
Aerodynamic Analysis of a Supersonic Transport Aircraft at Landing Speed Conditions


Abstract
:
1. Introduction
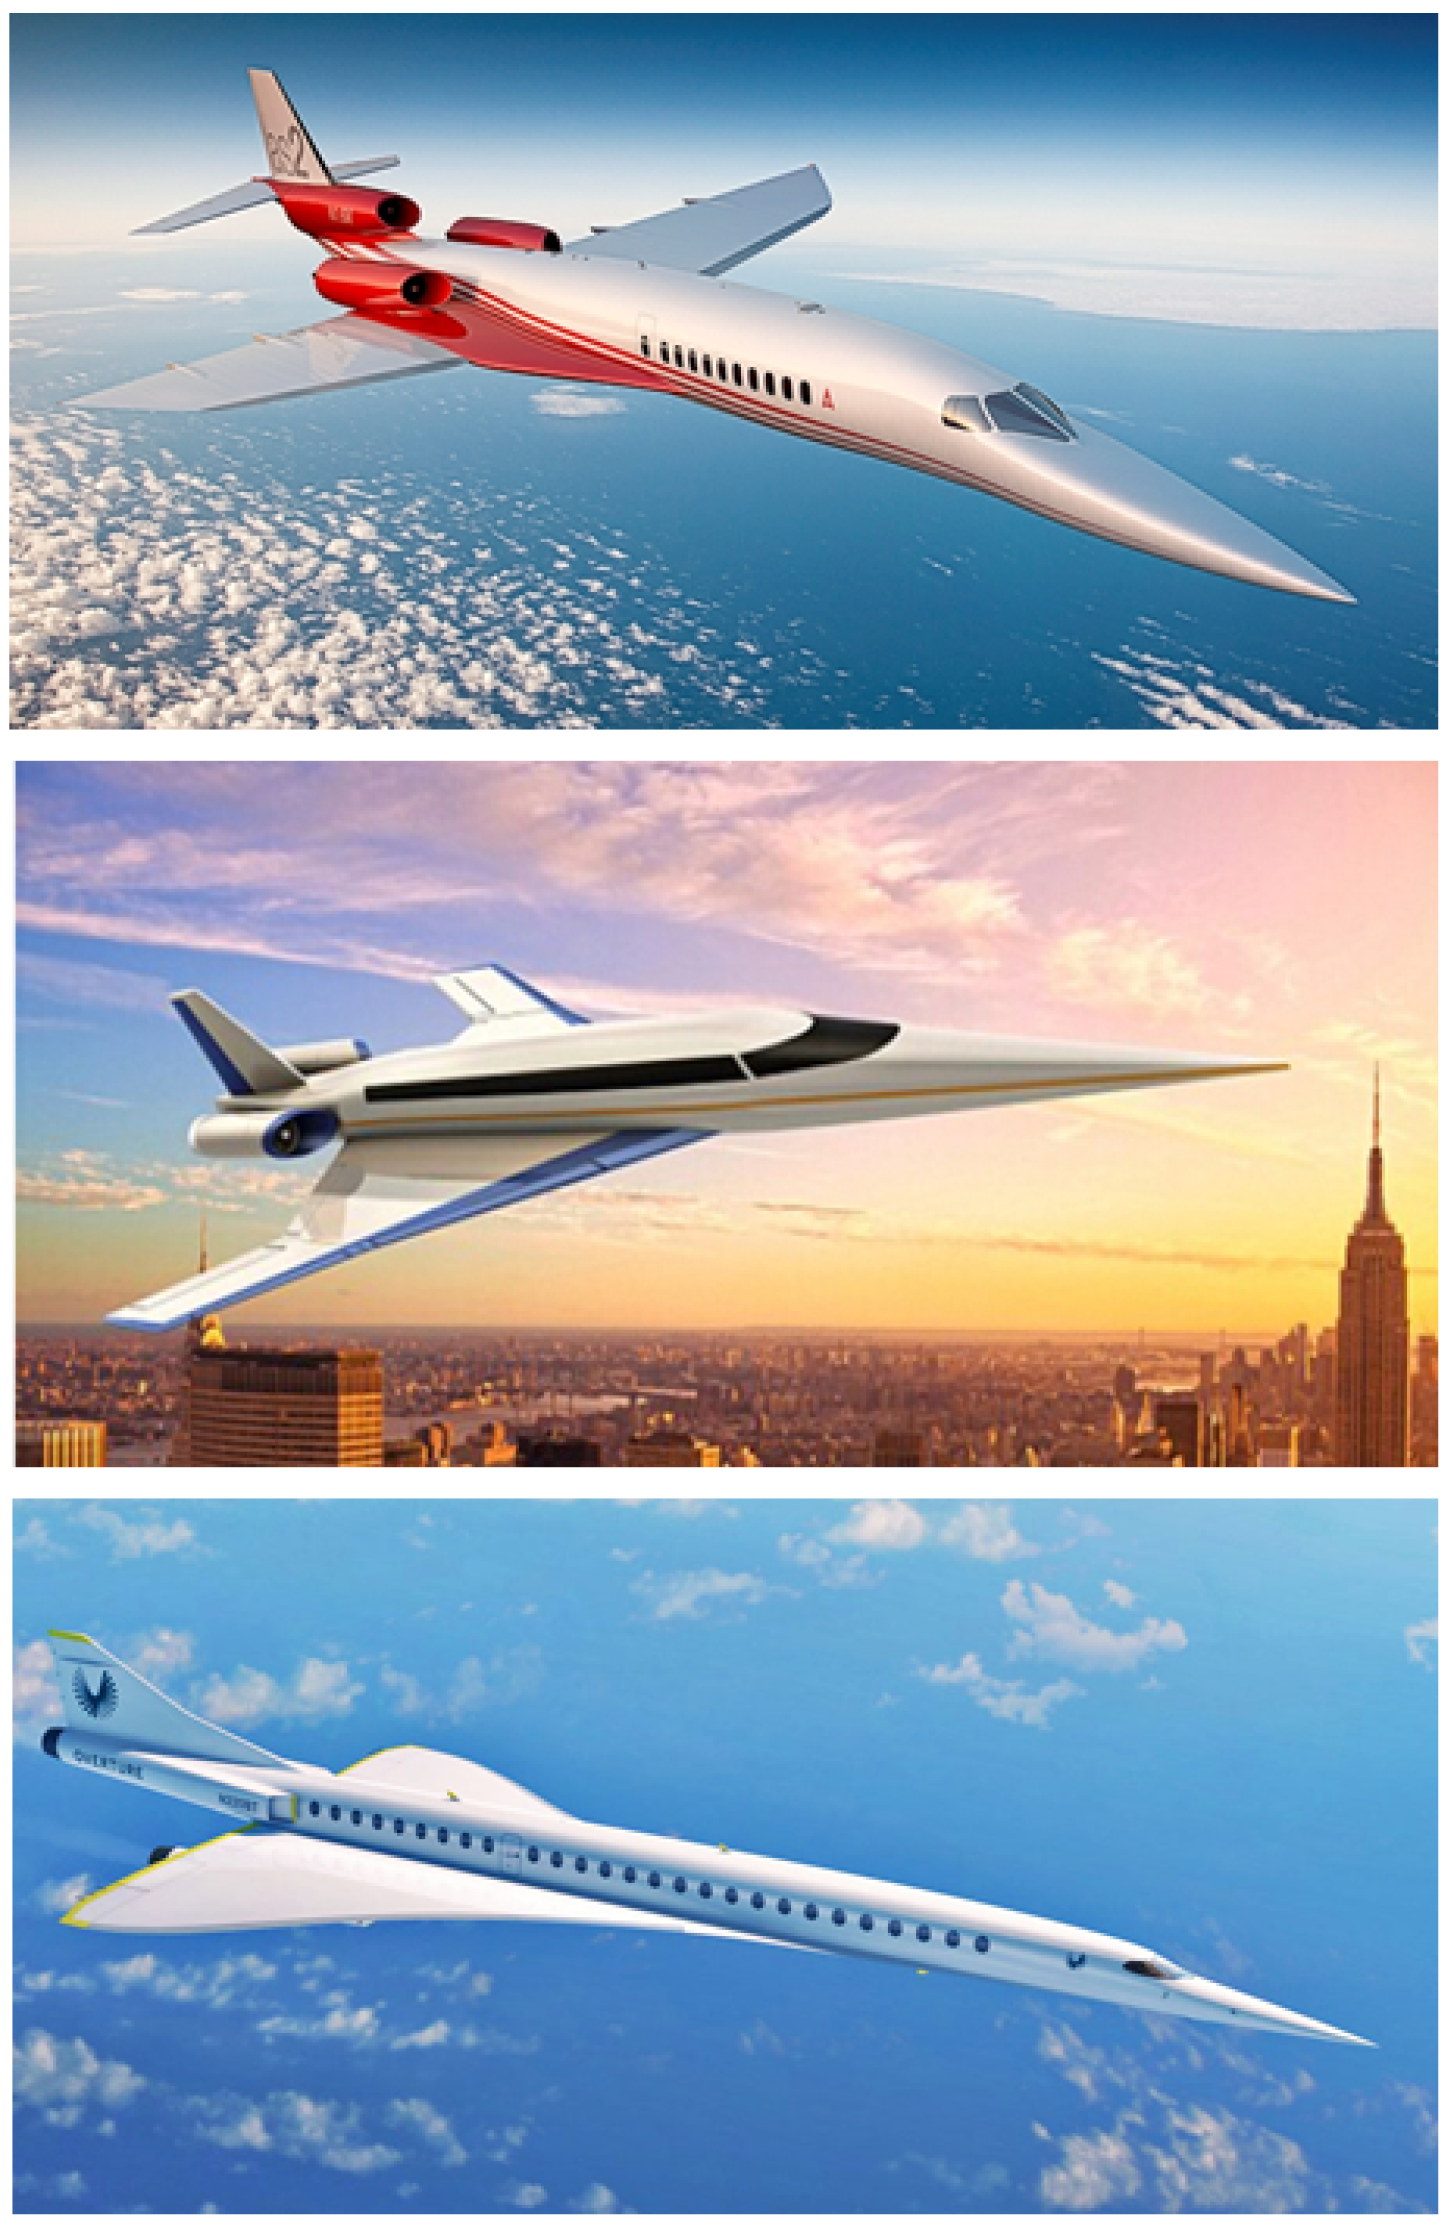
2. Overview on Supersonic Aircraft under Development and Investigation
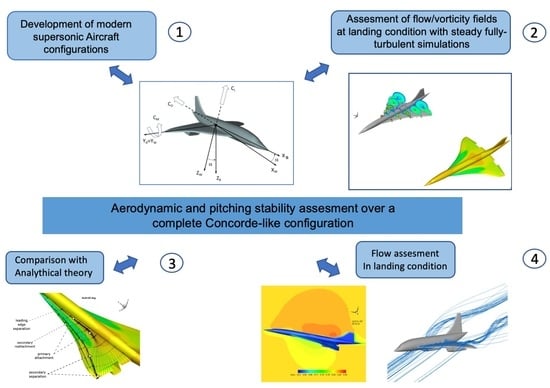
3. Research Framework and Background
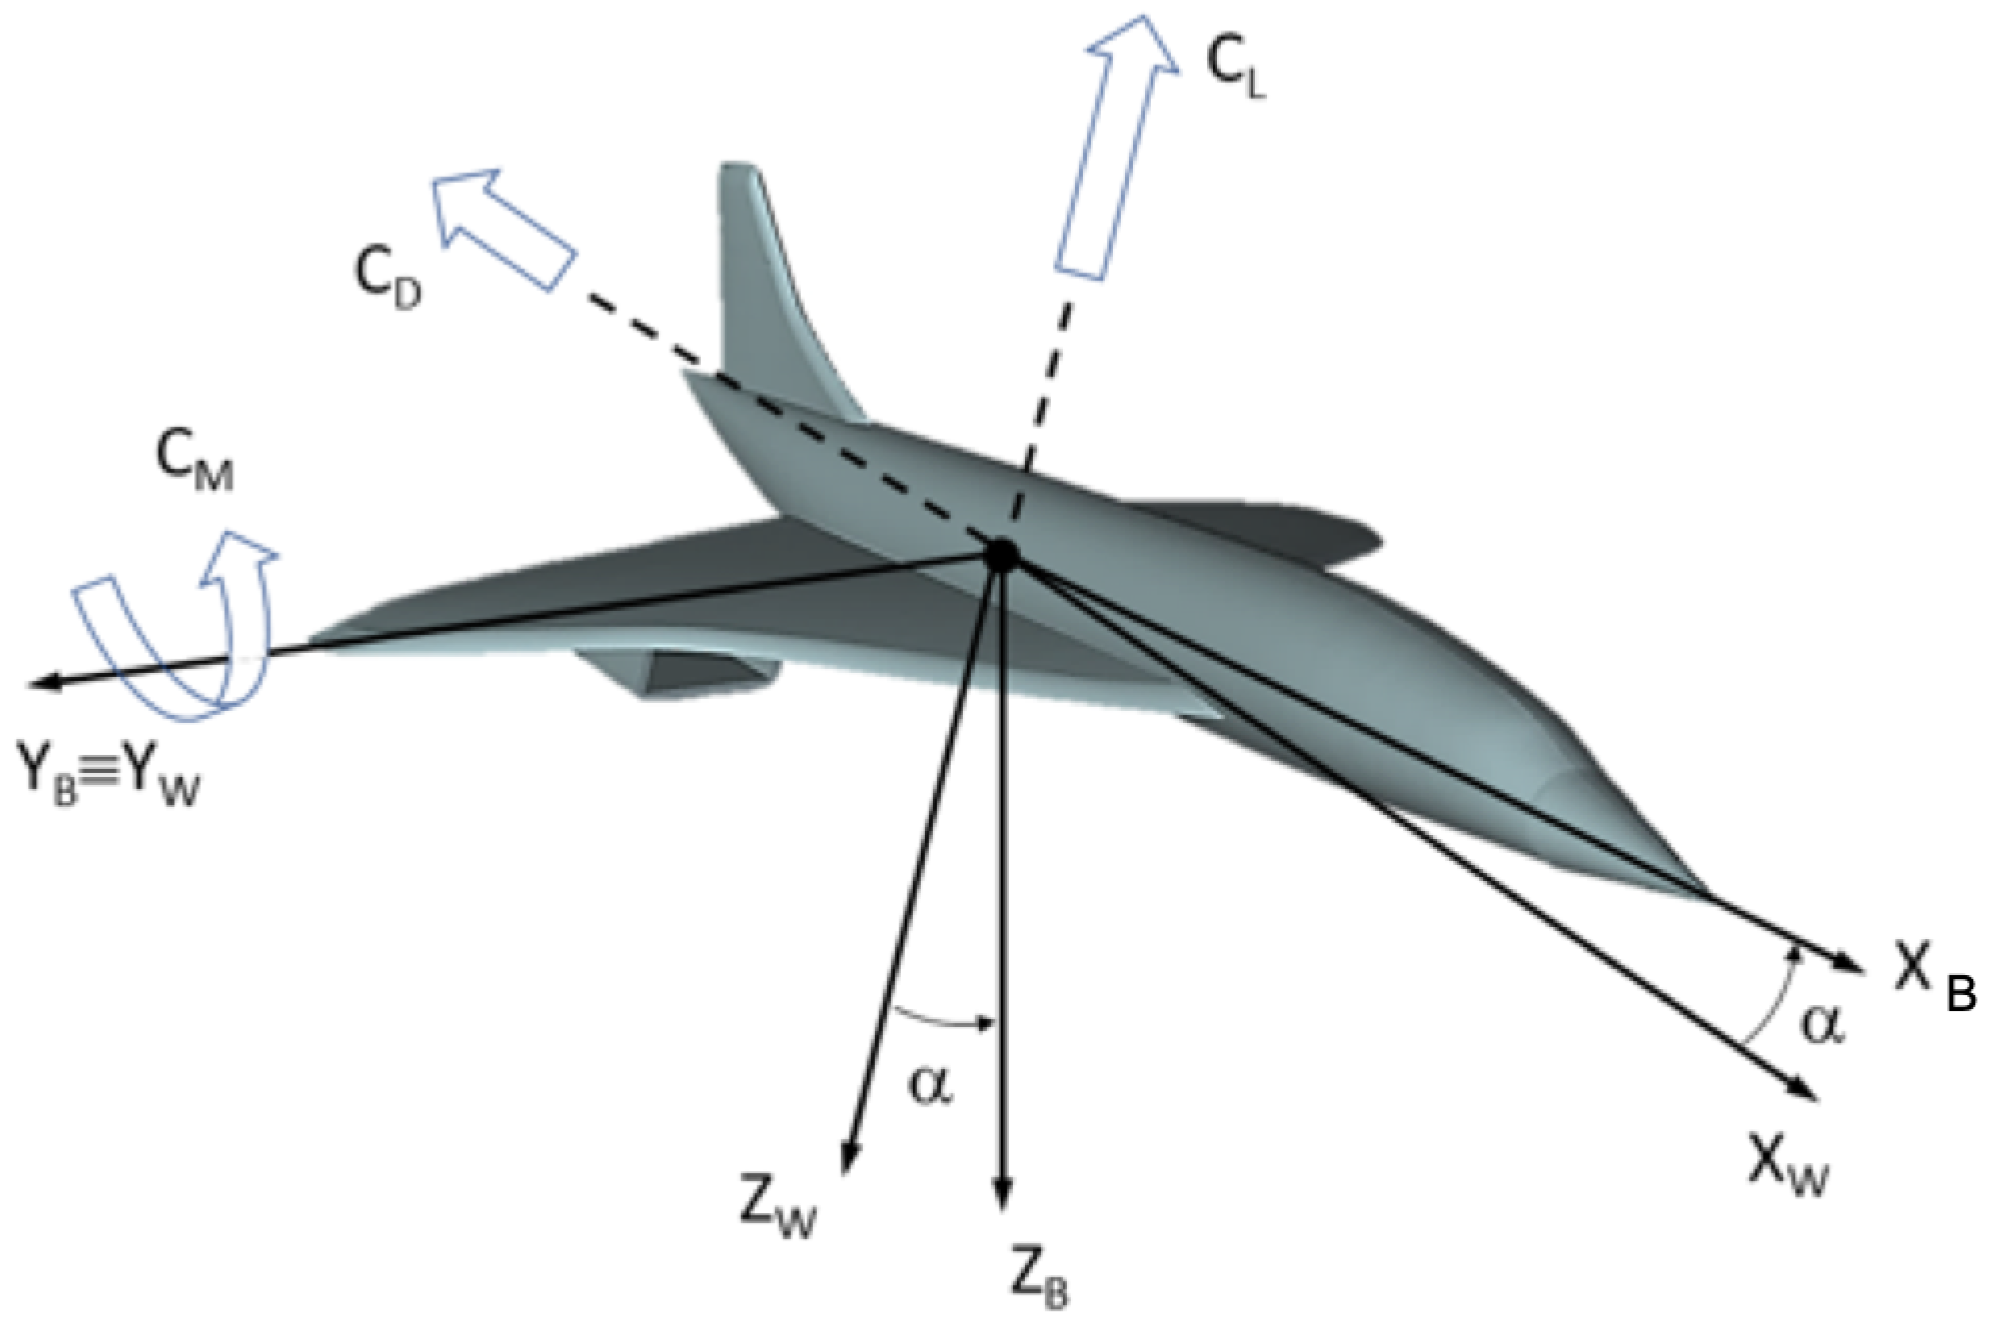
4. Aerodynamics of a Delta-Winged Aircraft
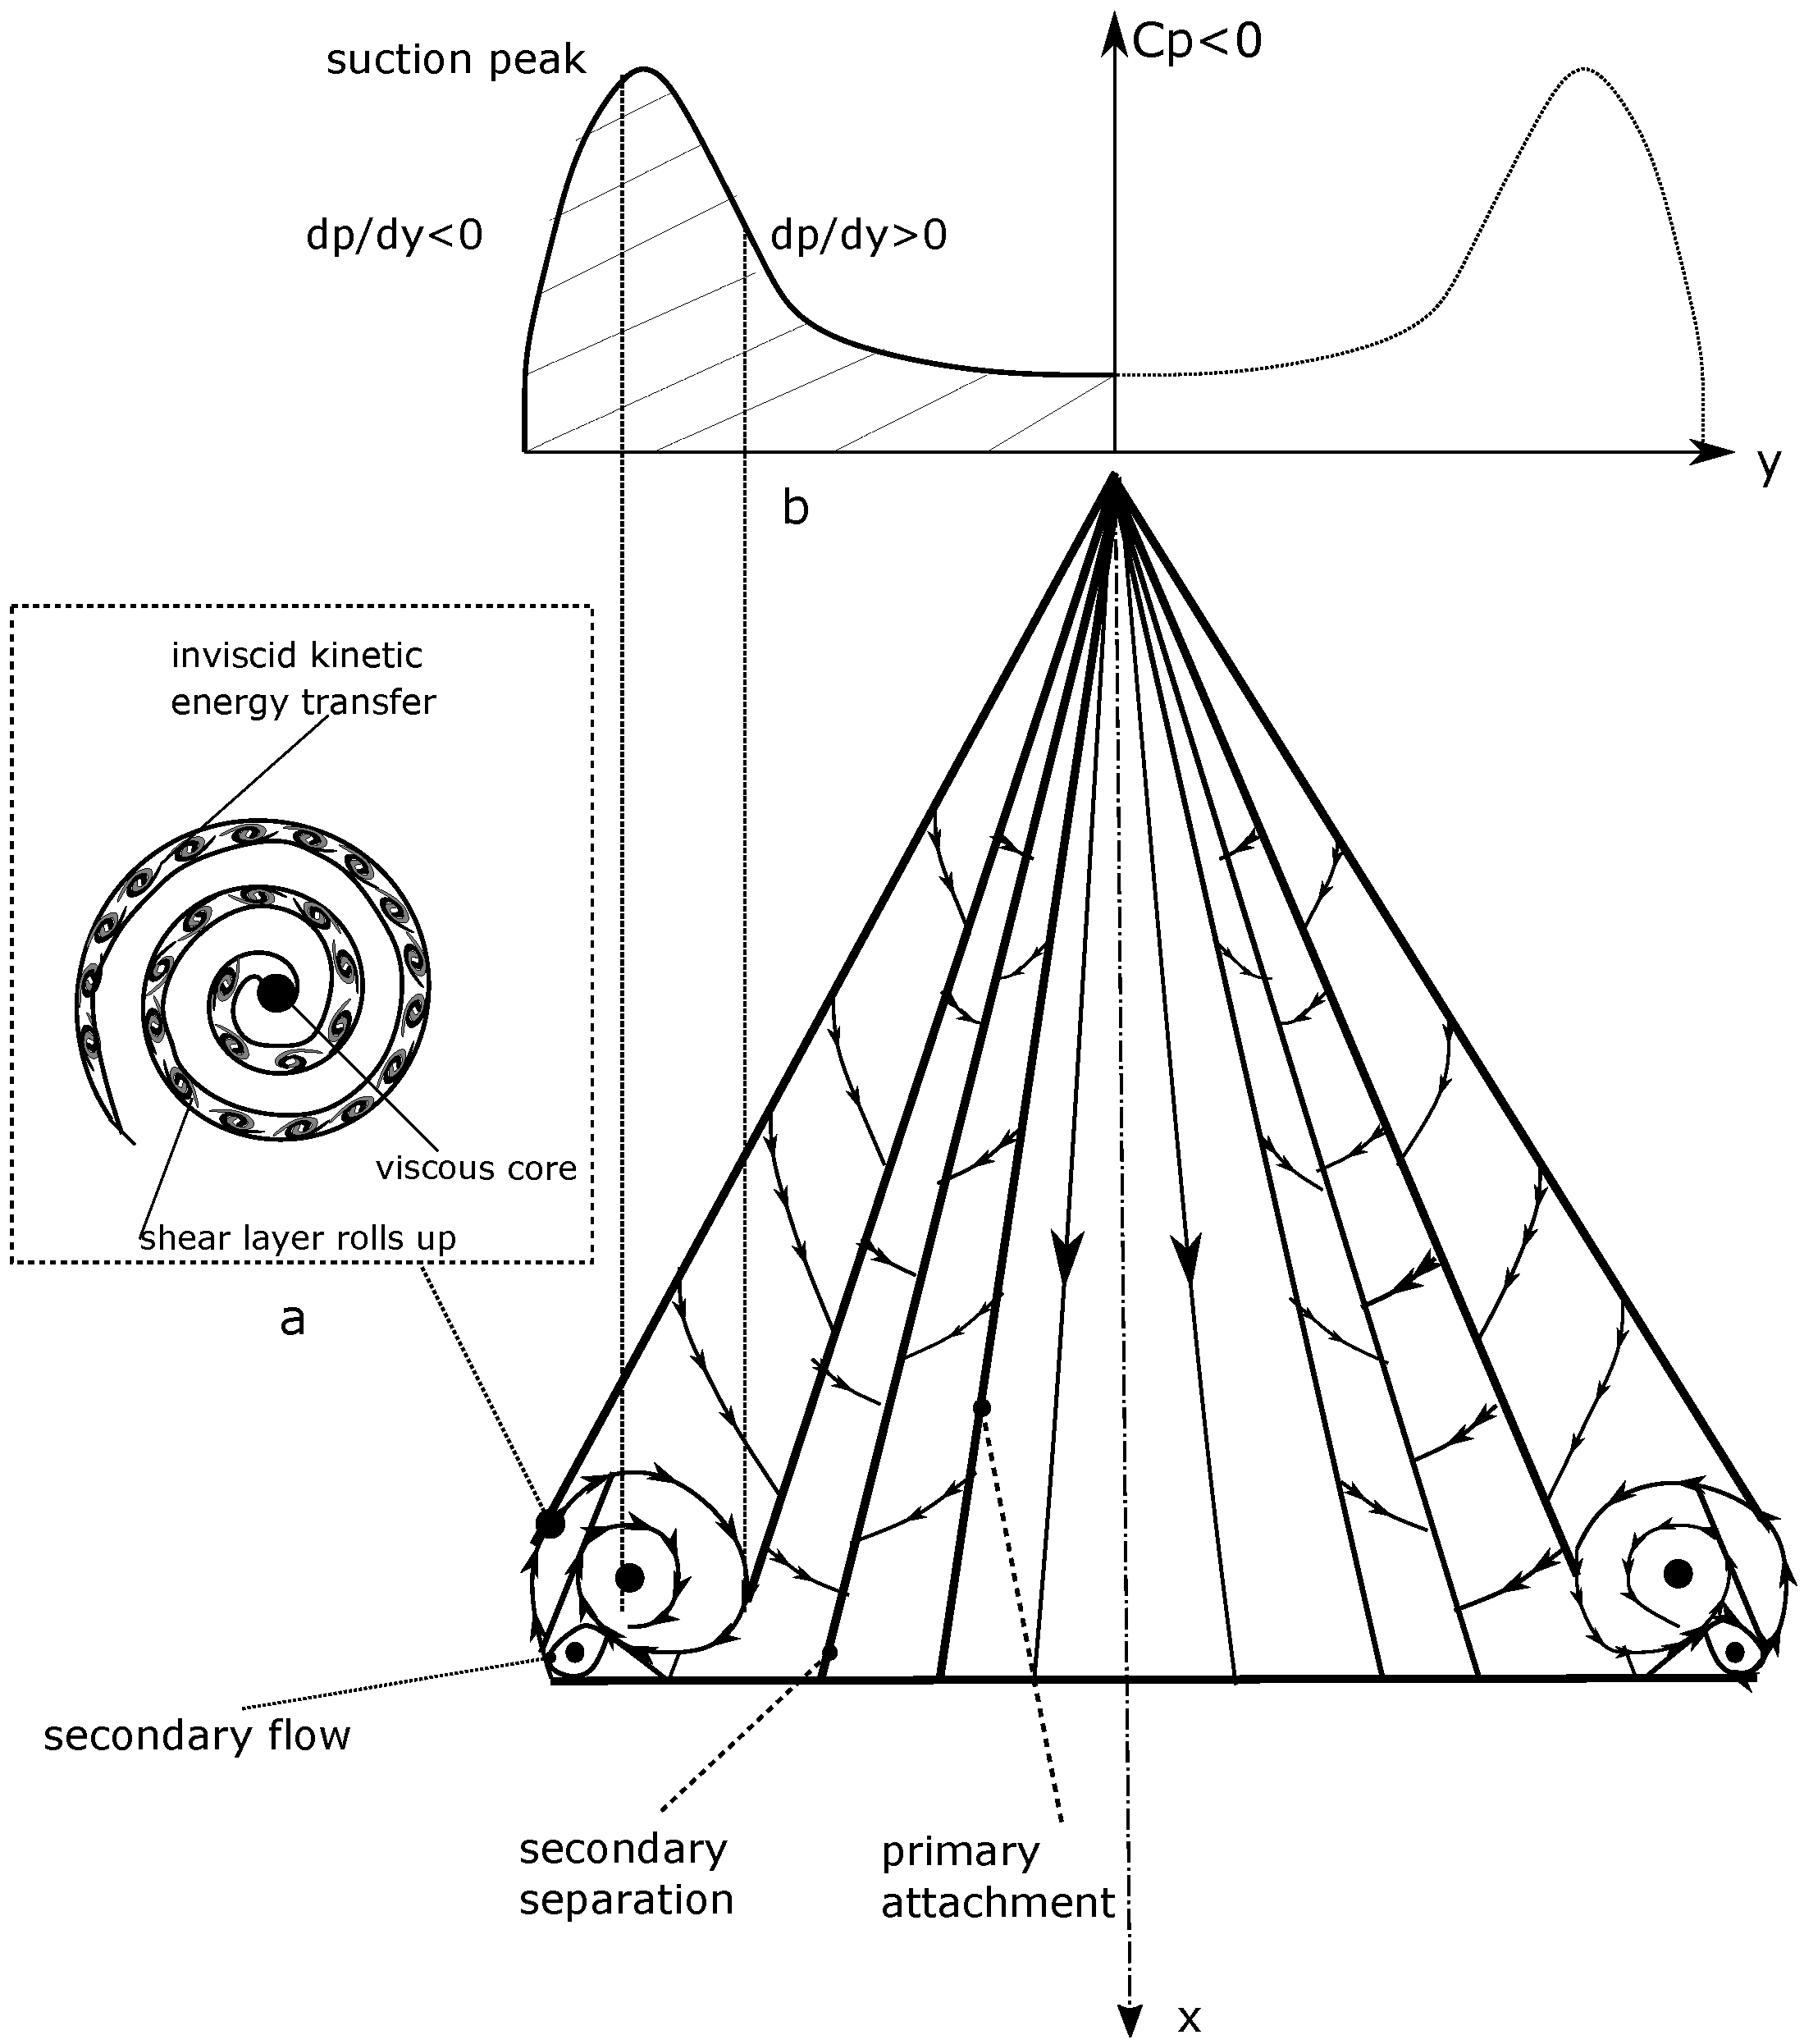
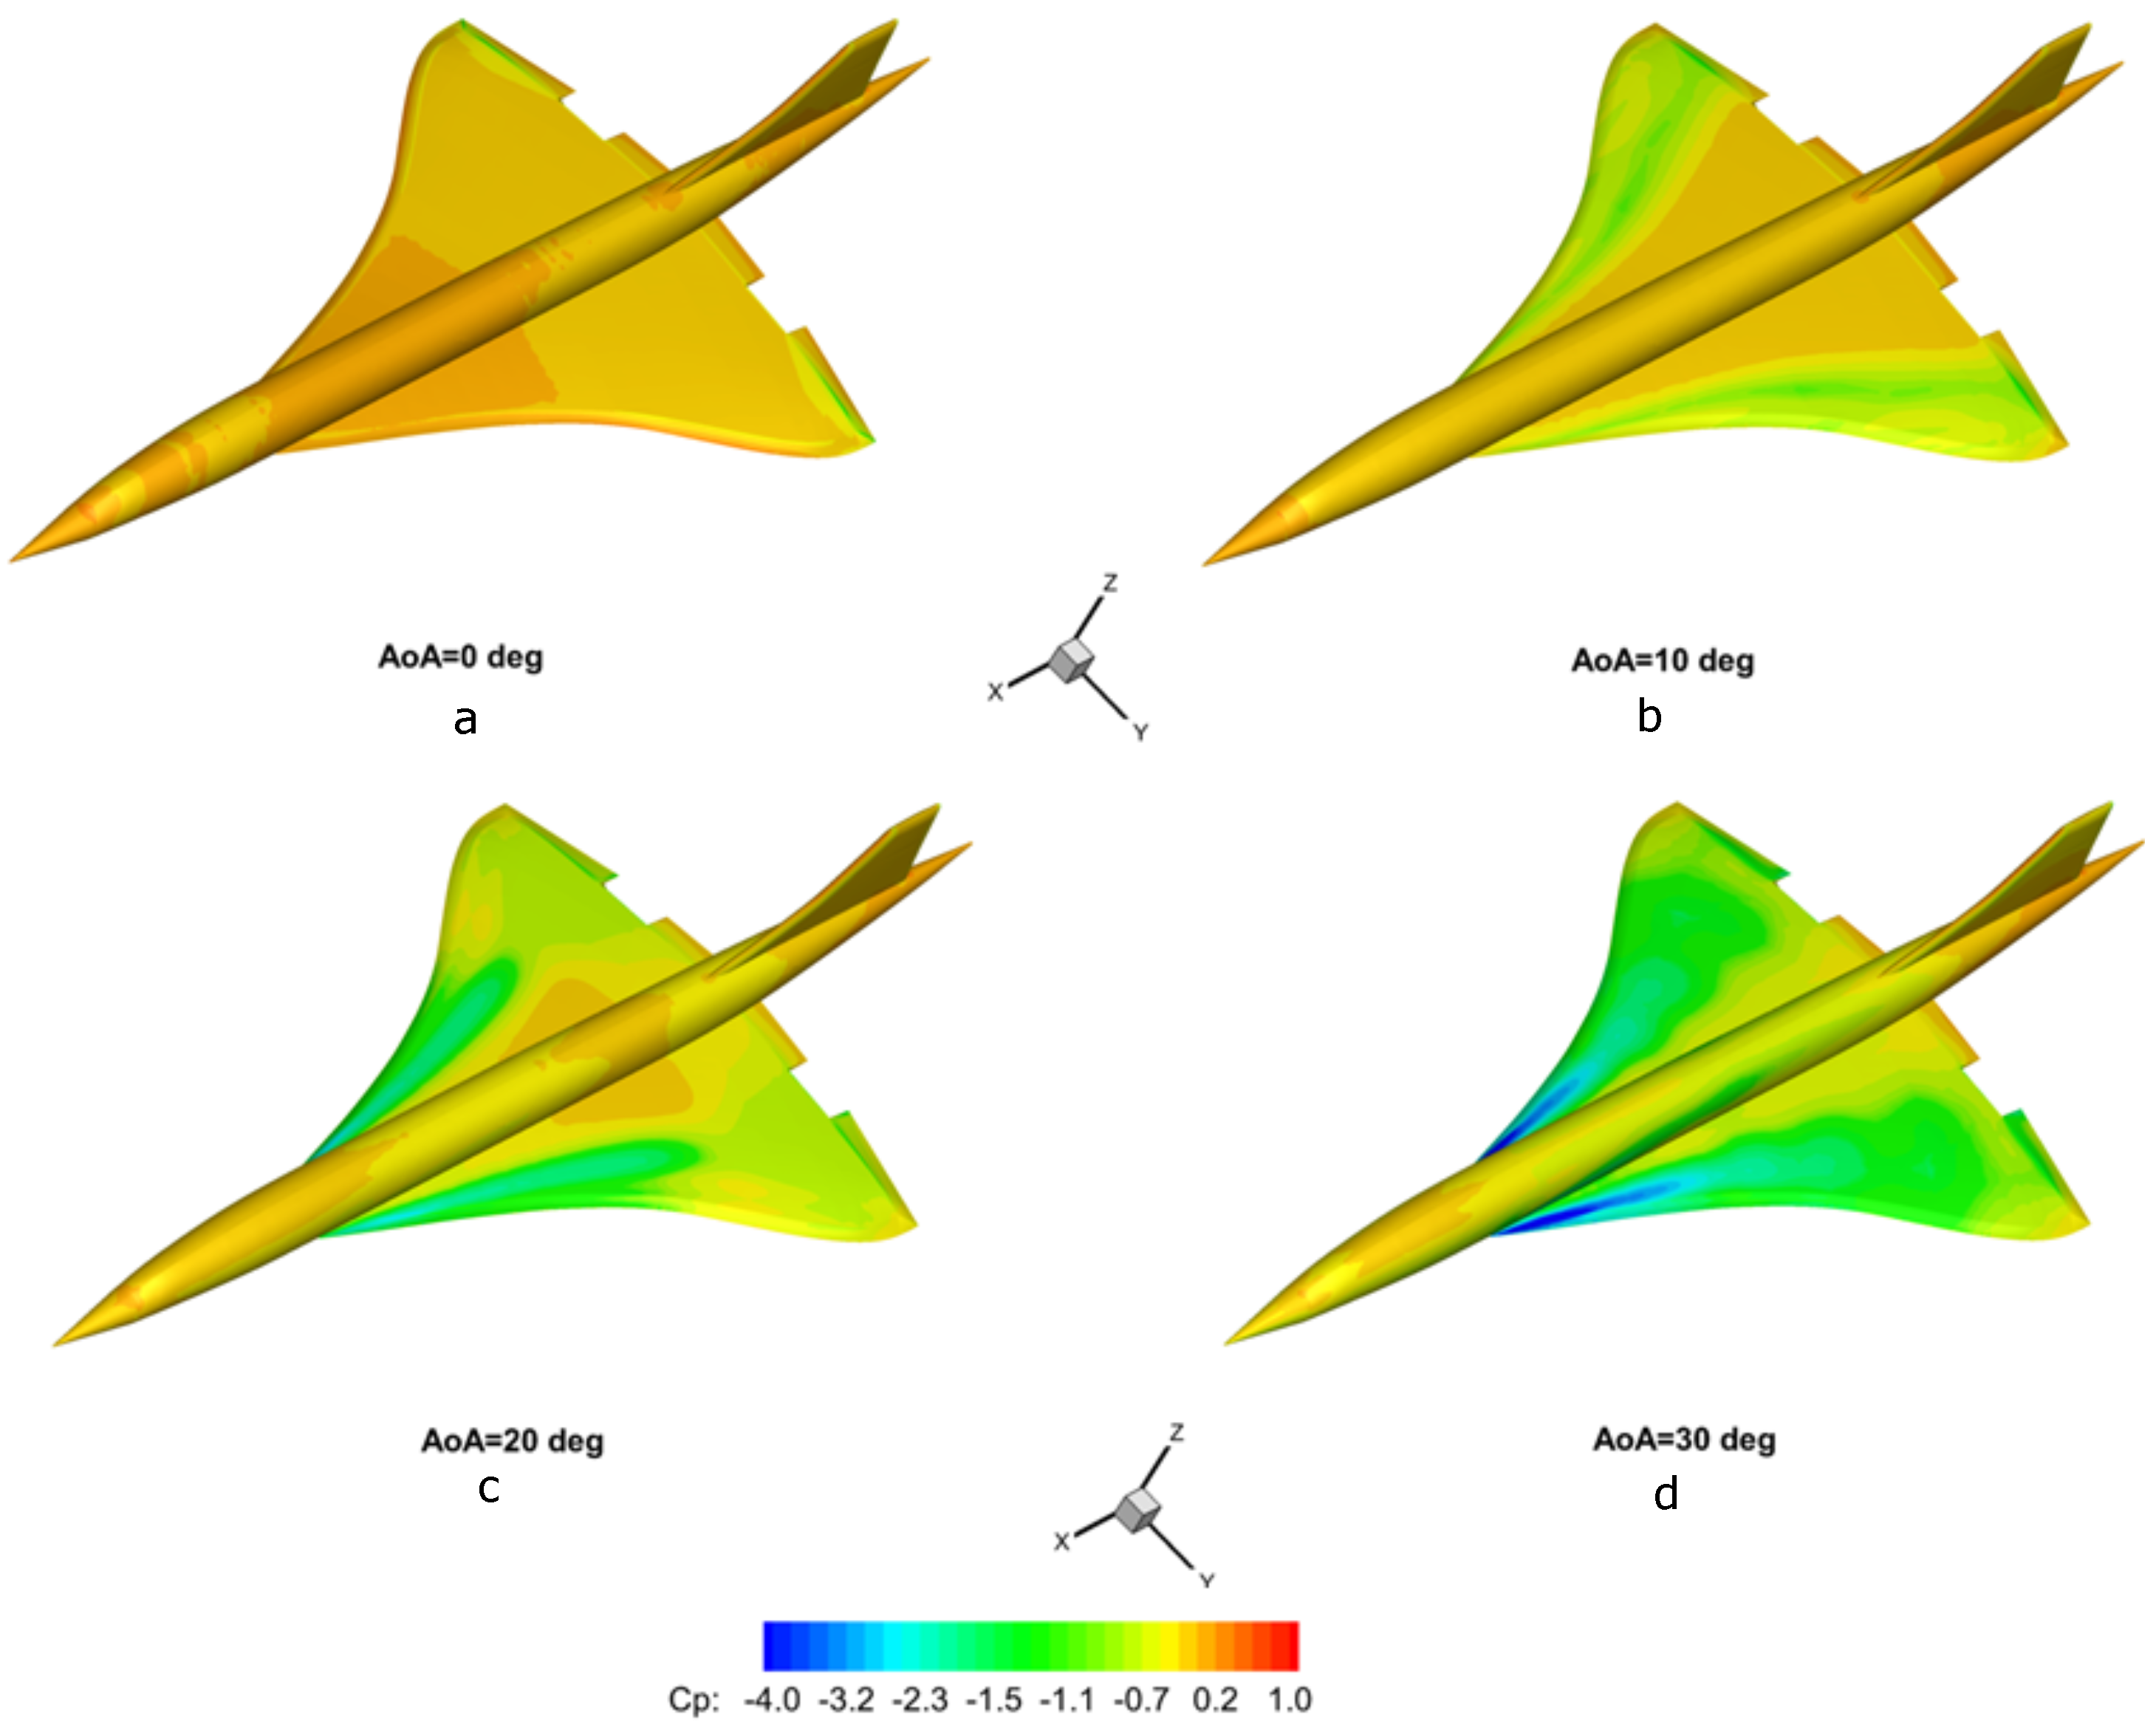
4.1. Vortex-Lift Phenomenon
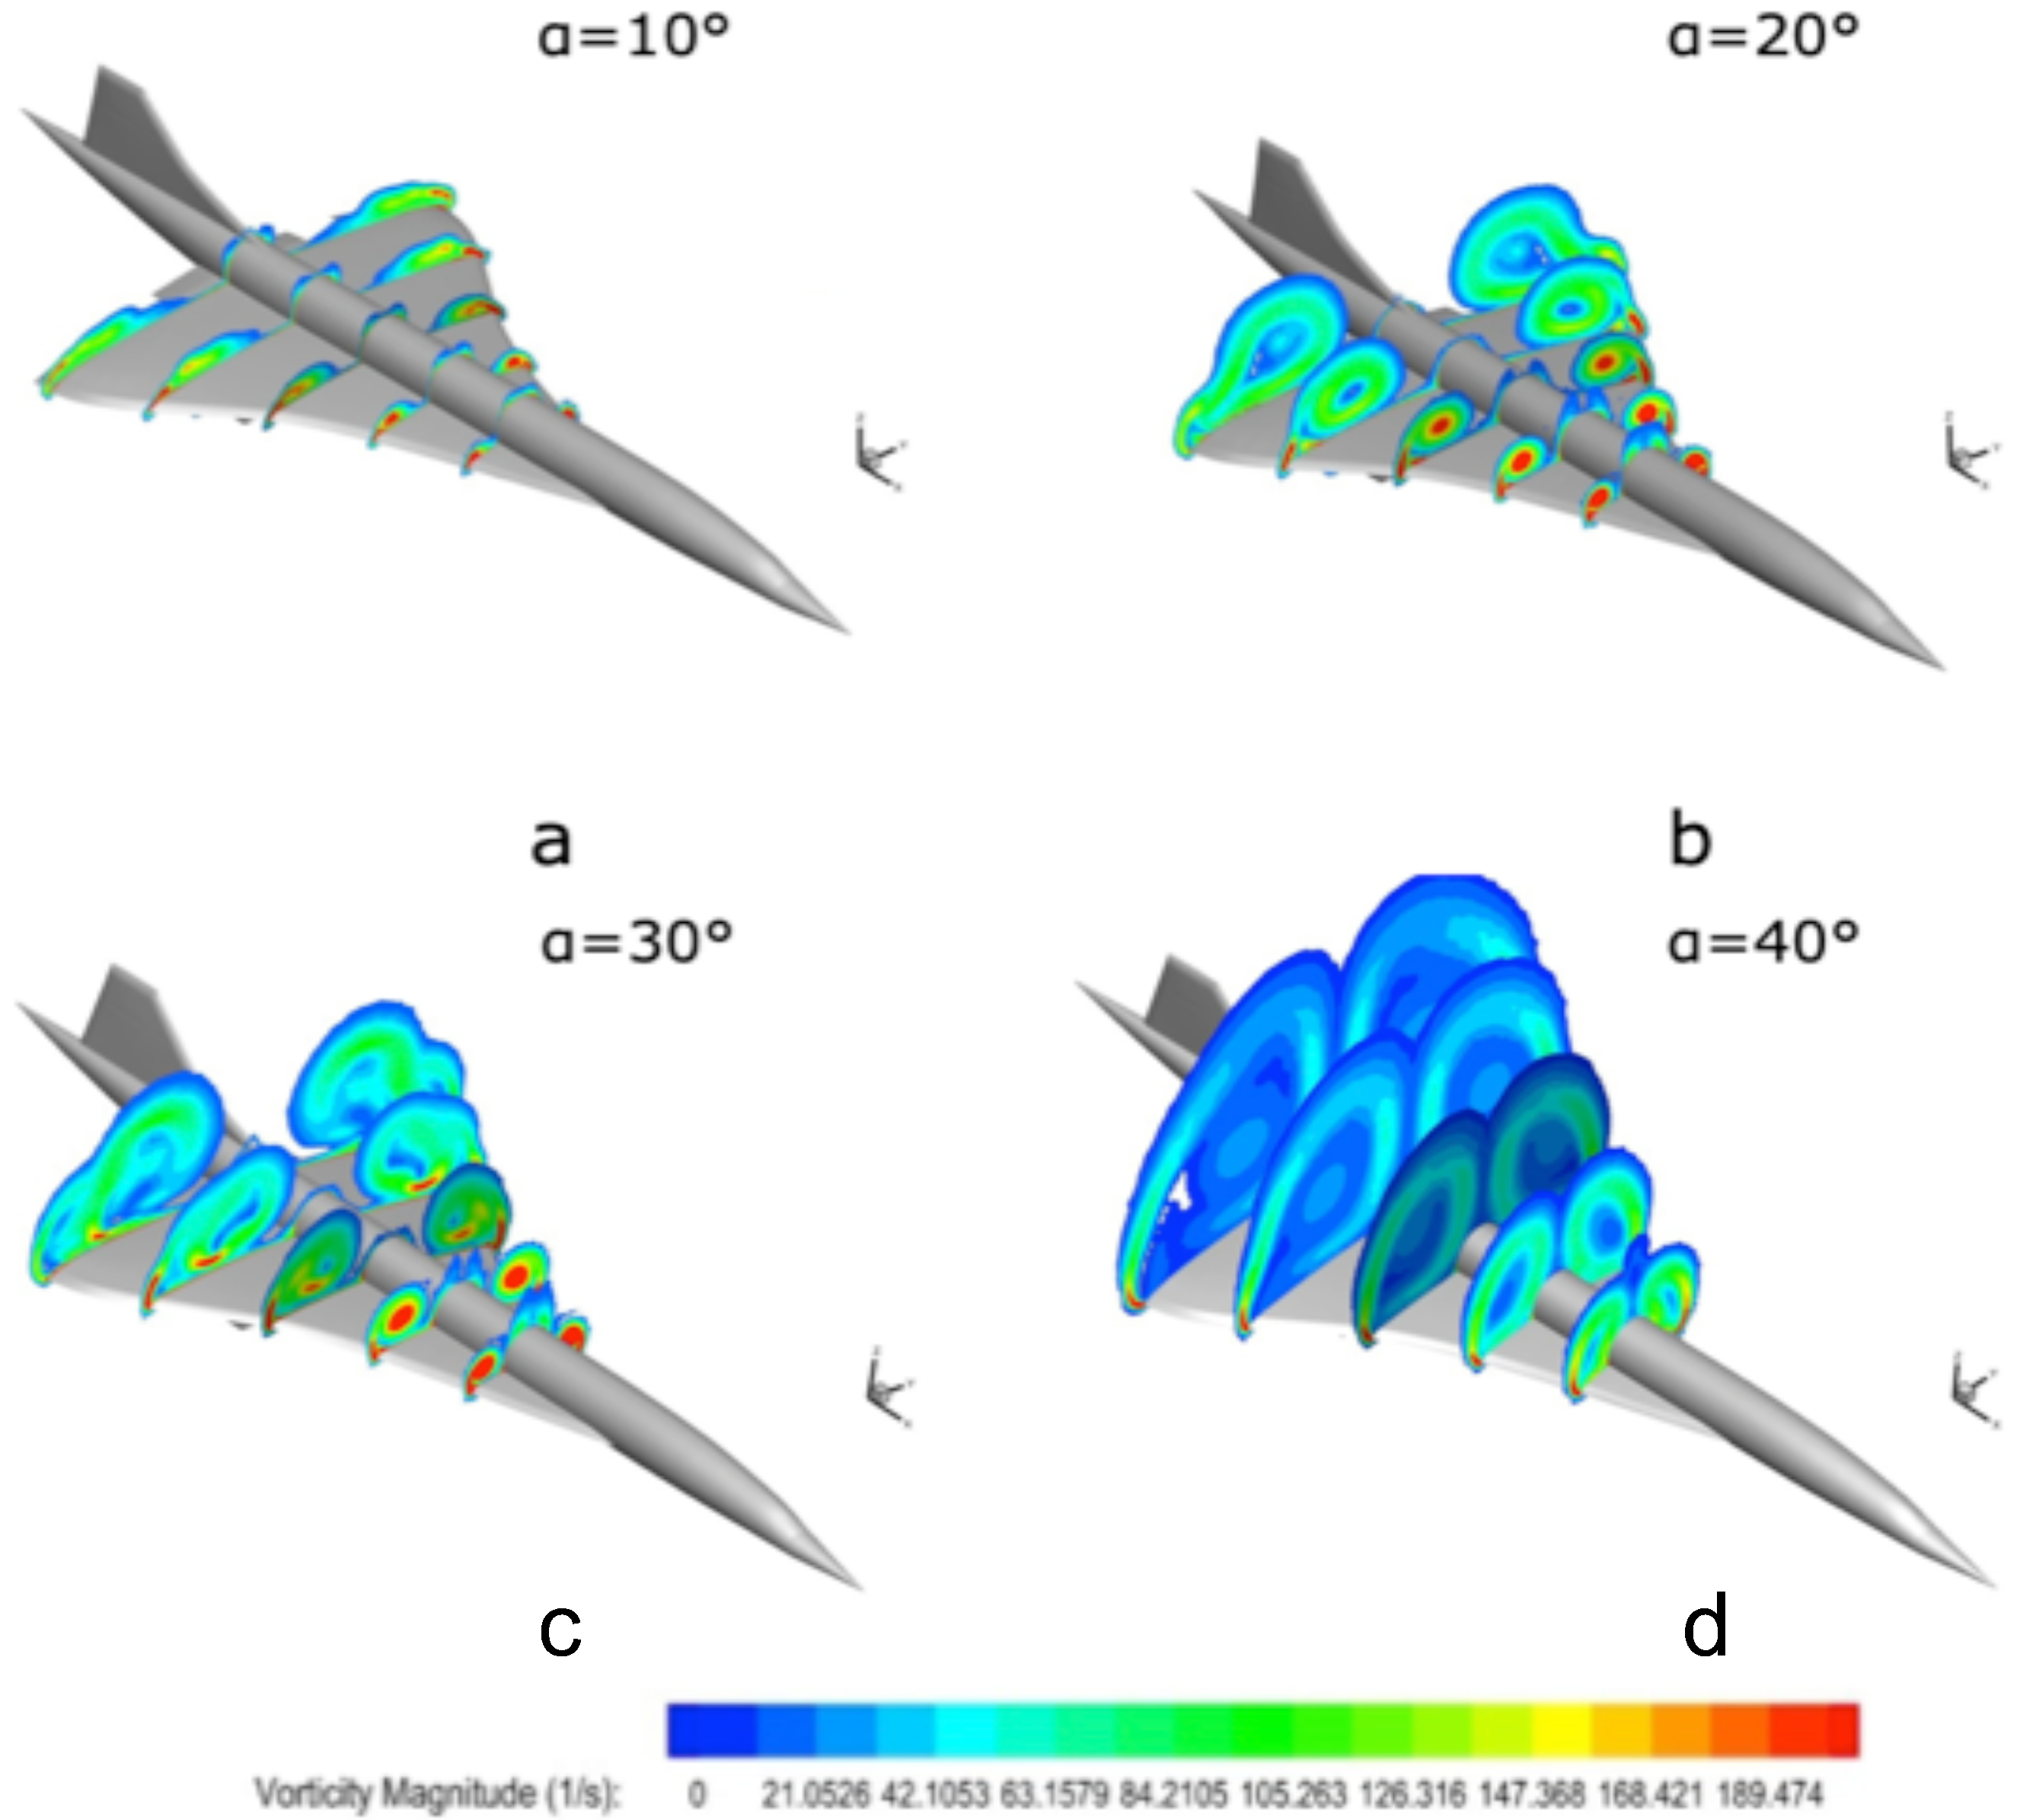
4.2. Vortex Breakdown
4.3. Aerodynamic Effect of Breakdown
5. Aerodynamic Study of a Concorde-Like Aeroshape
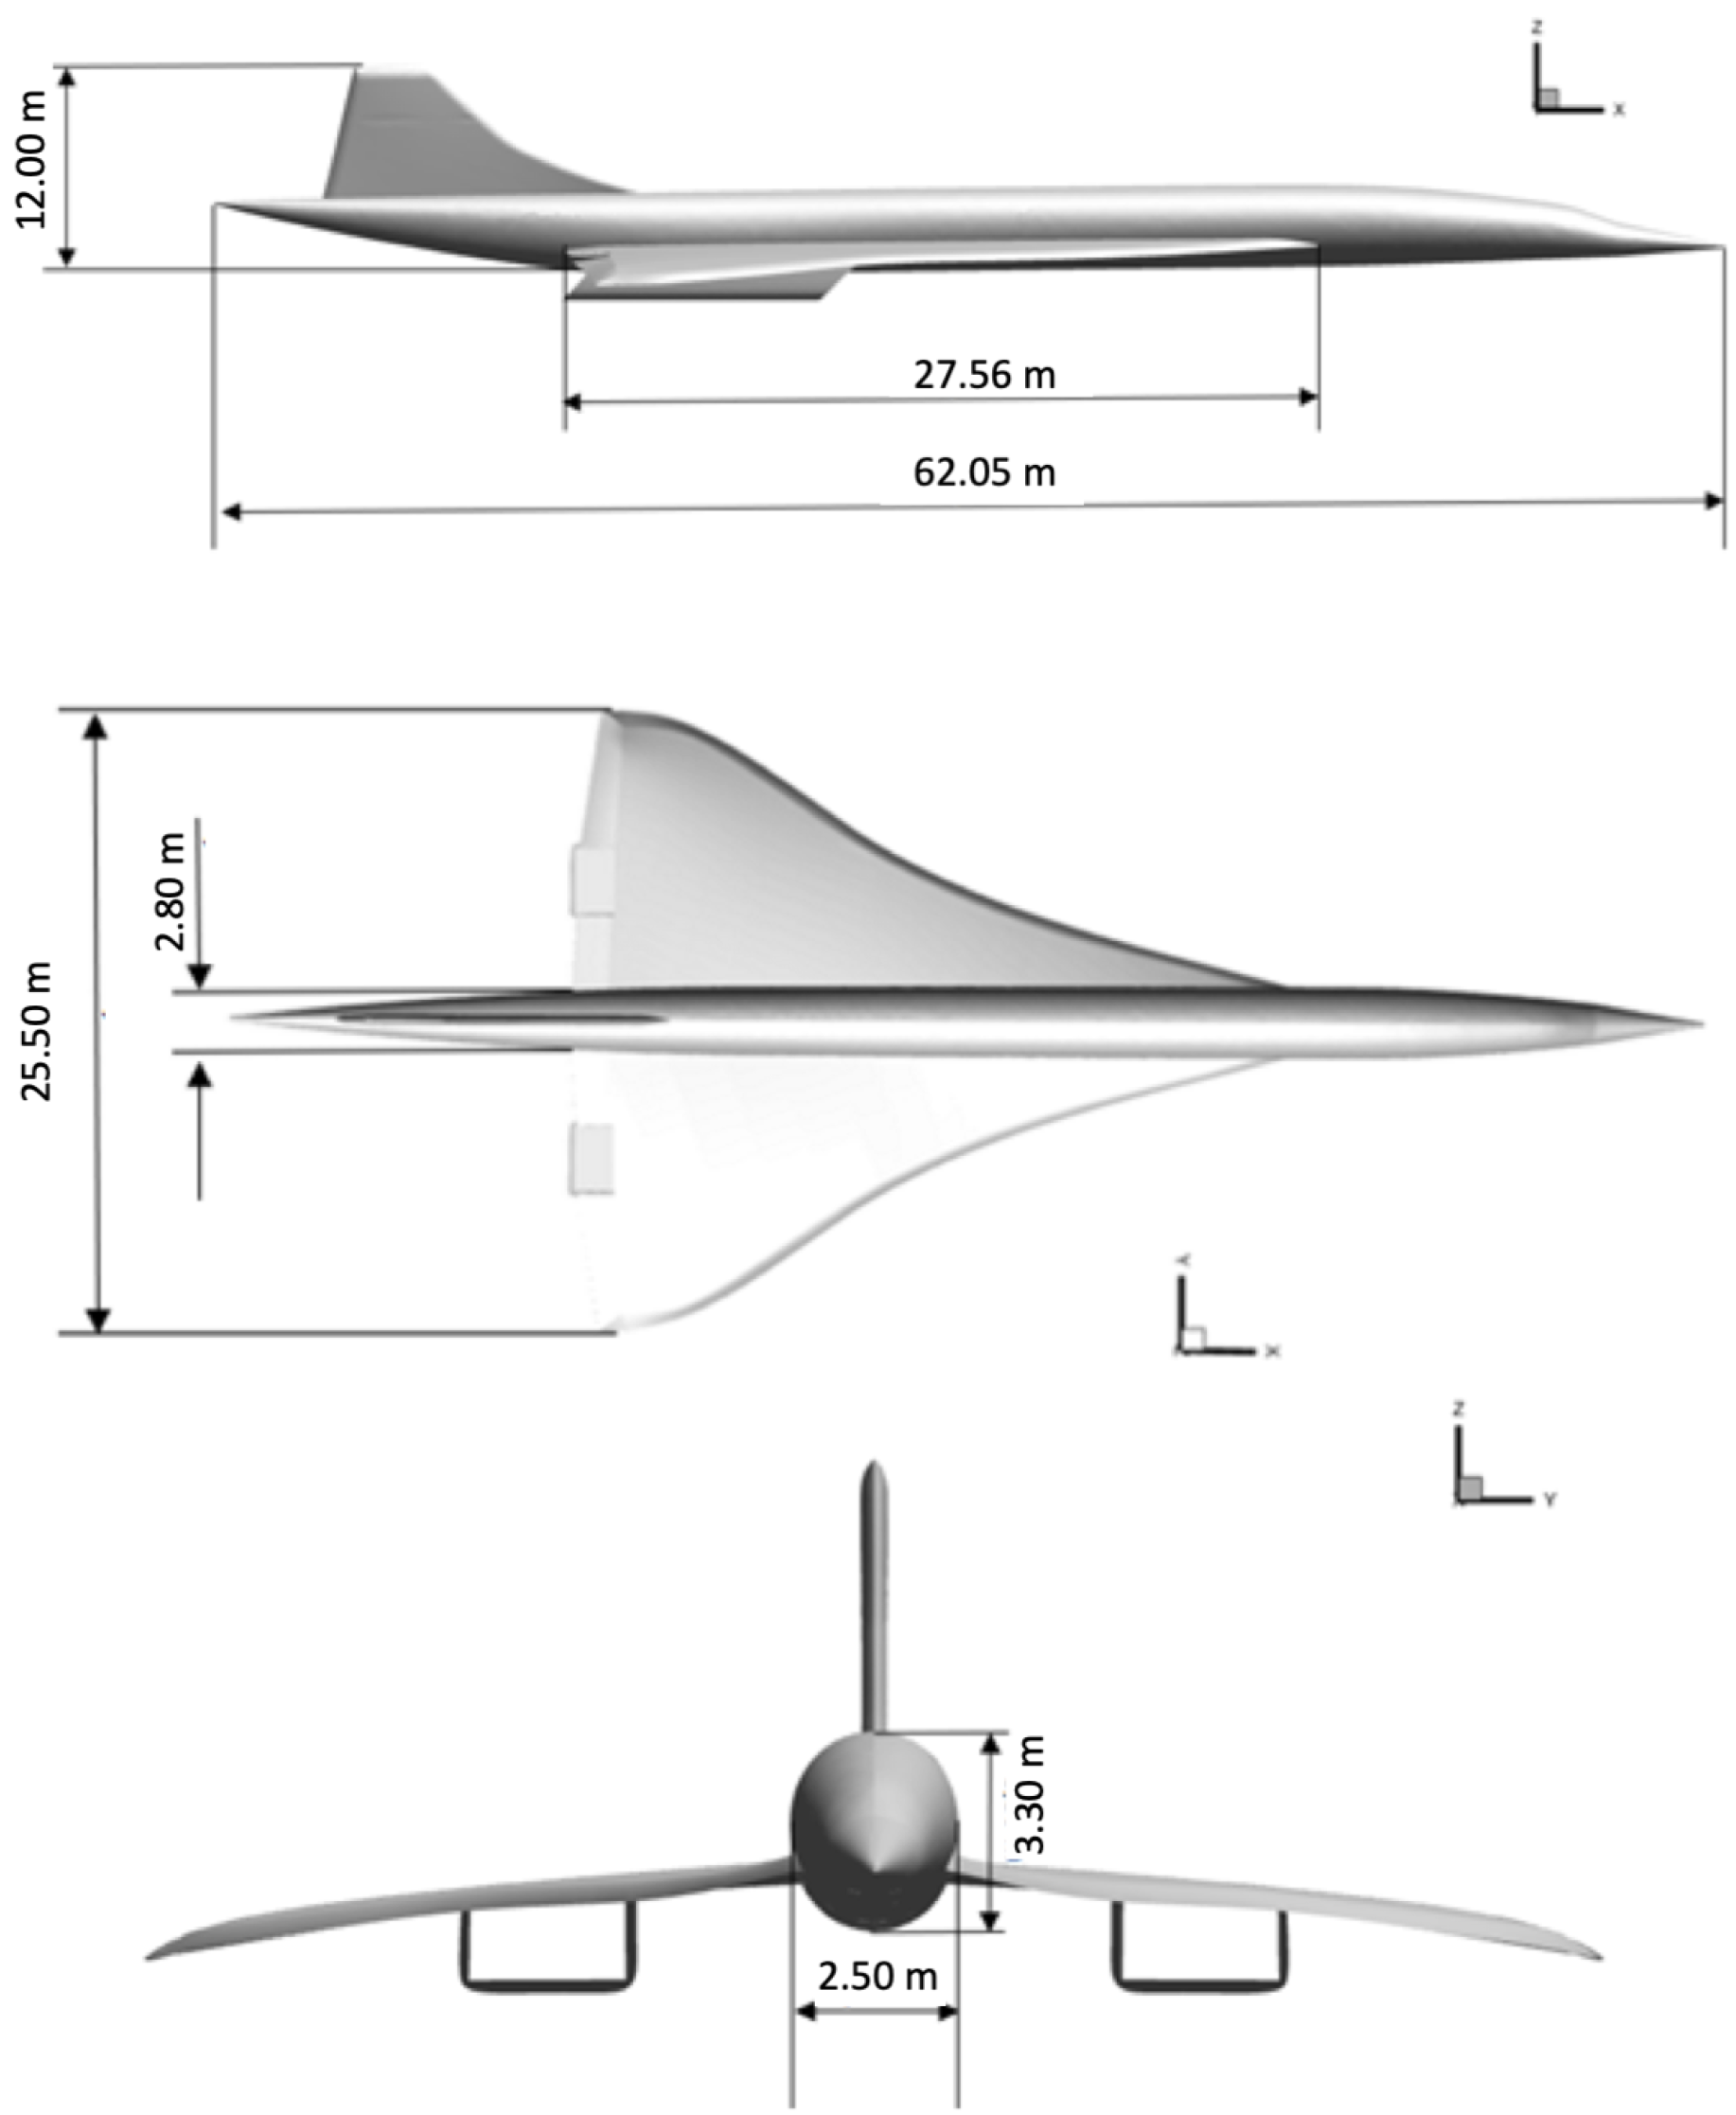
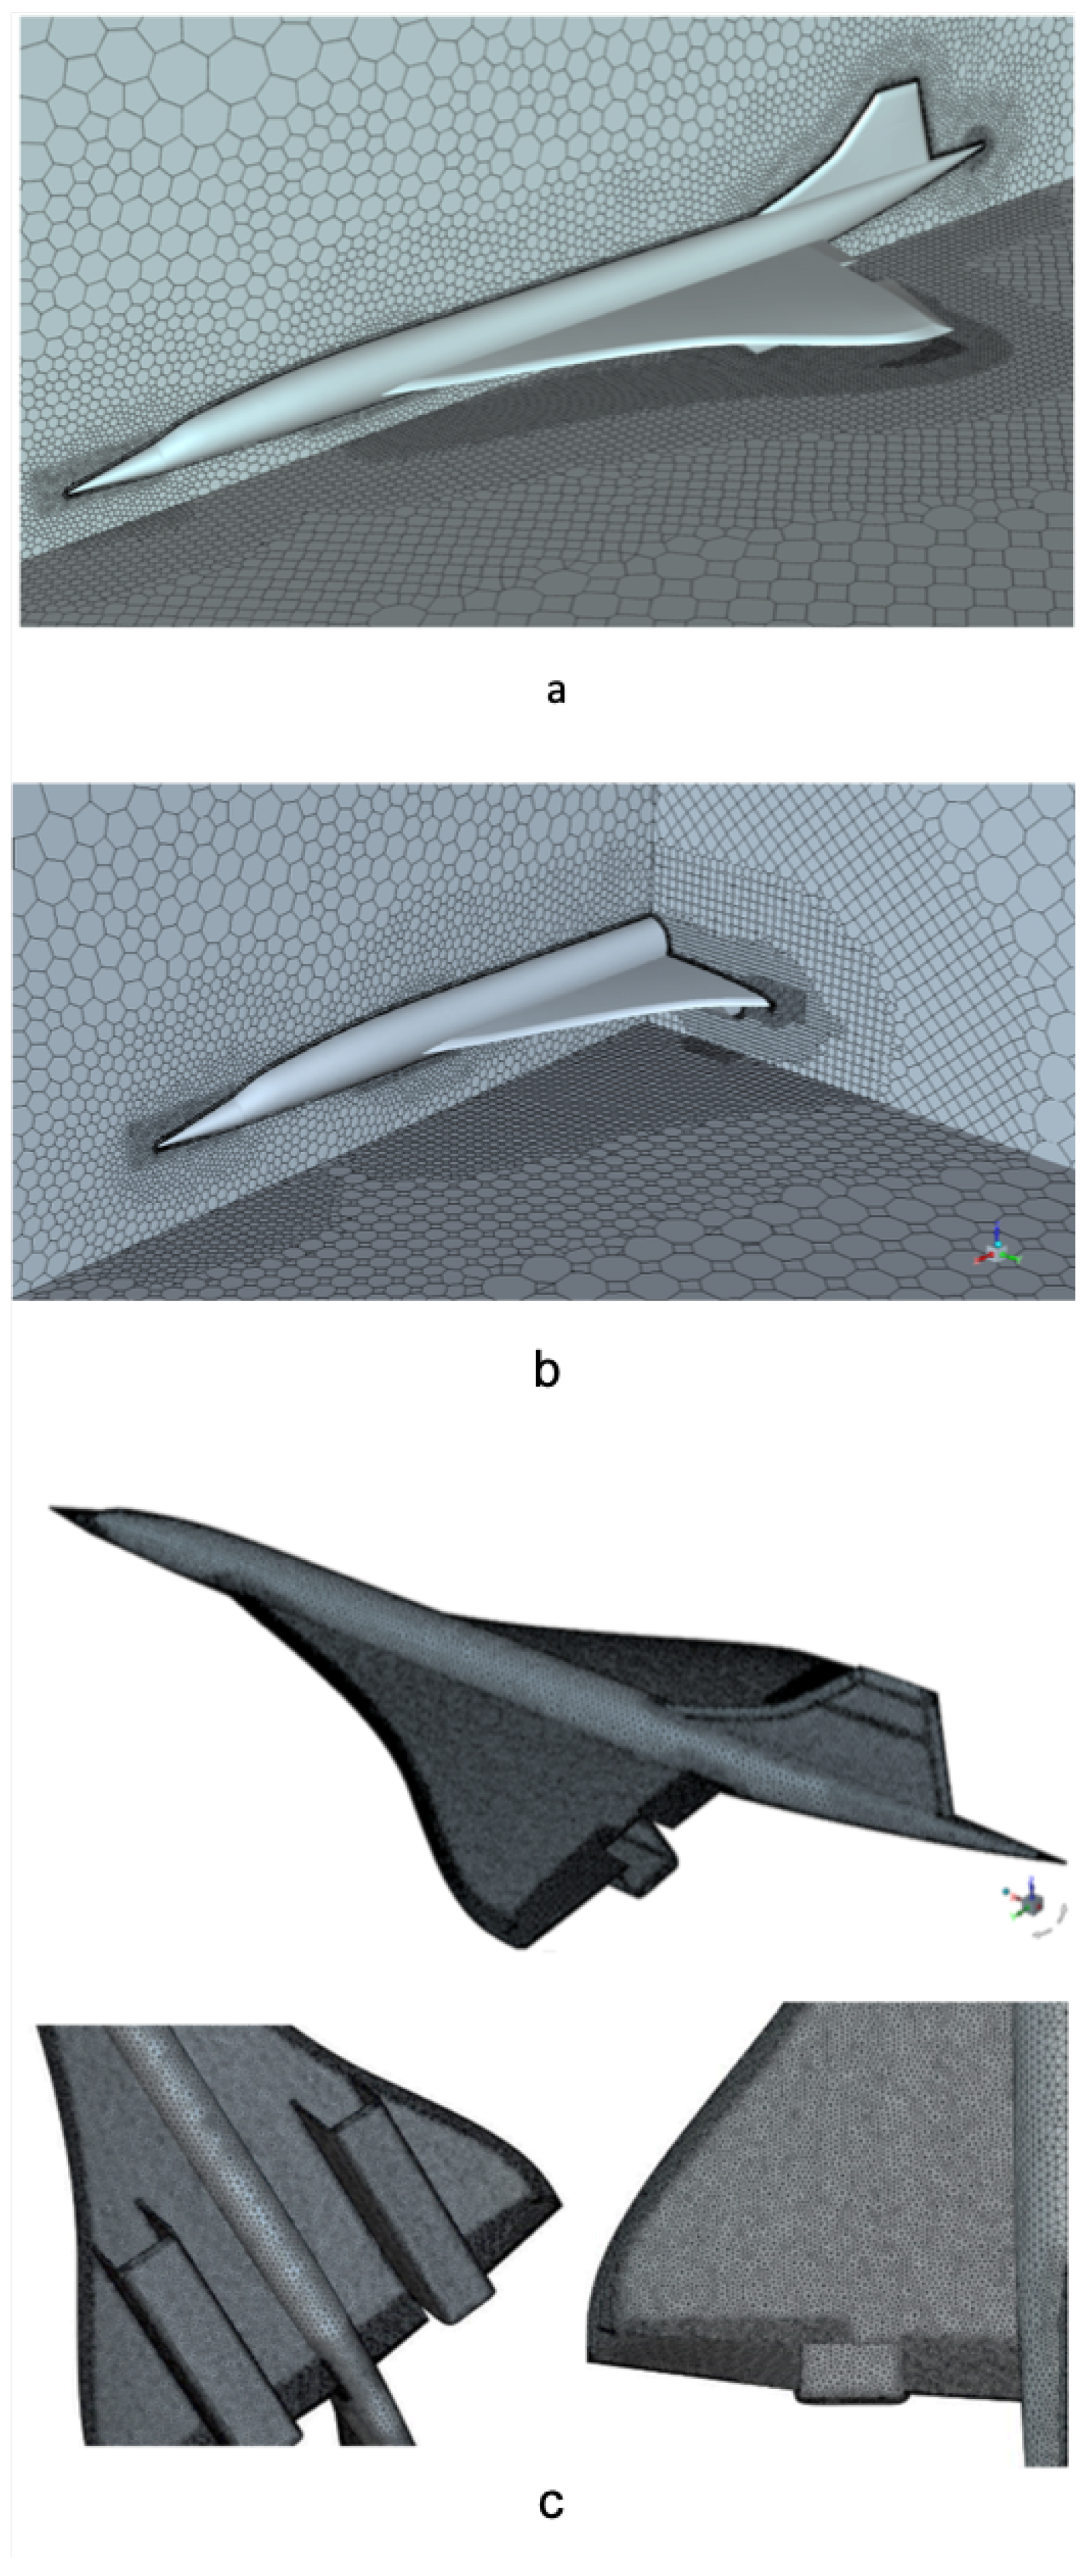
5.1. Computational Domain and Grids
5.2. CFD Modelling and Results
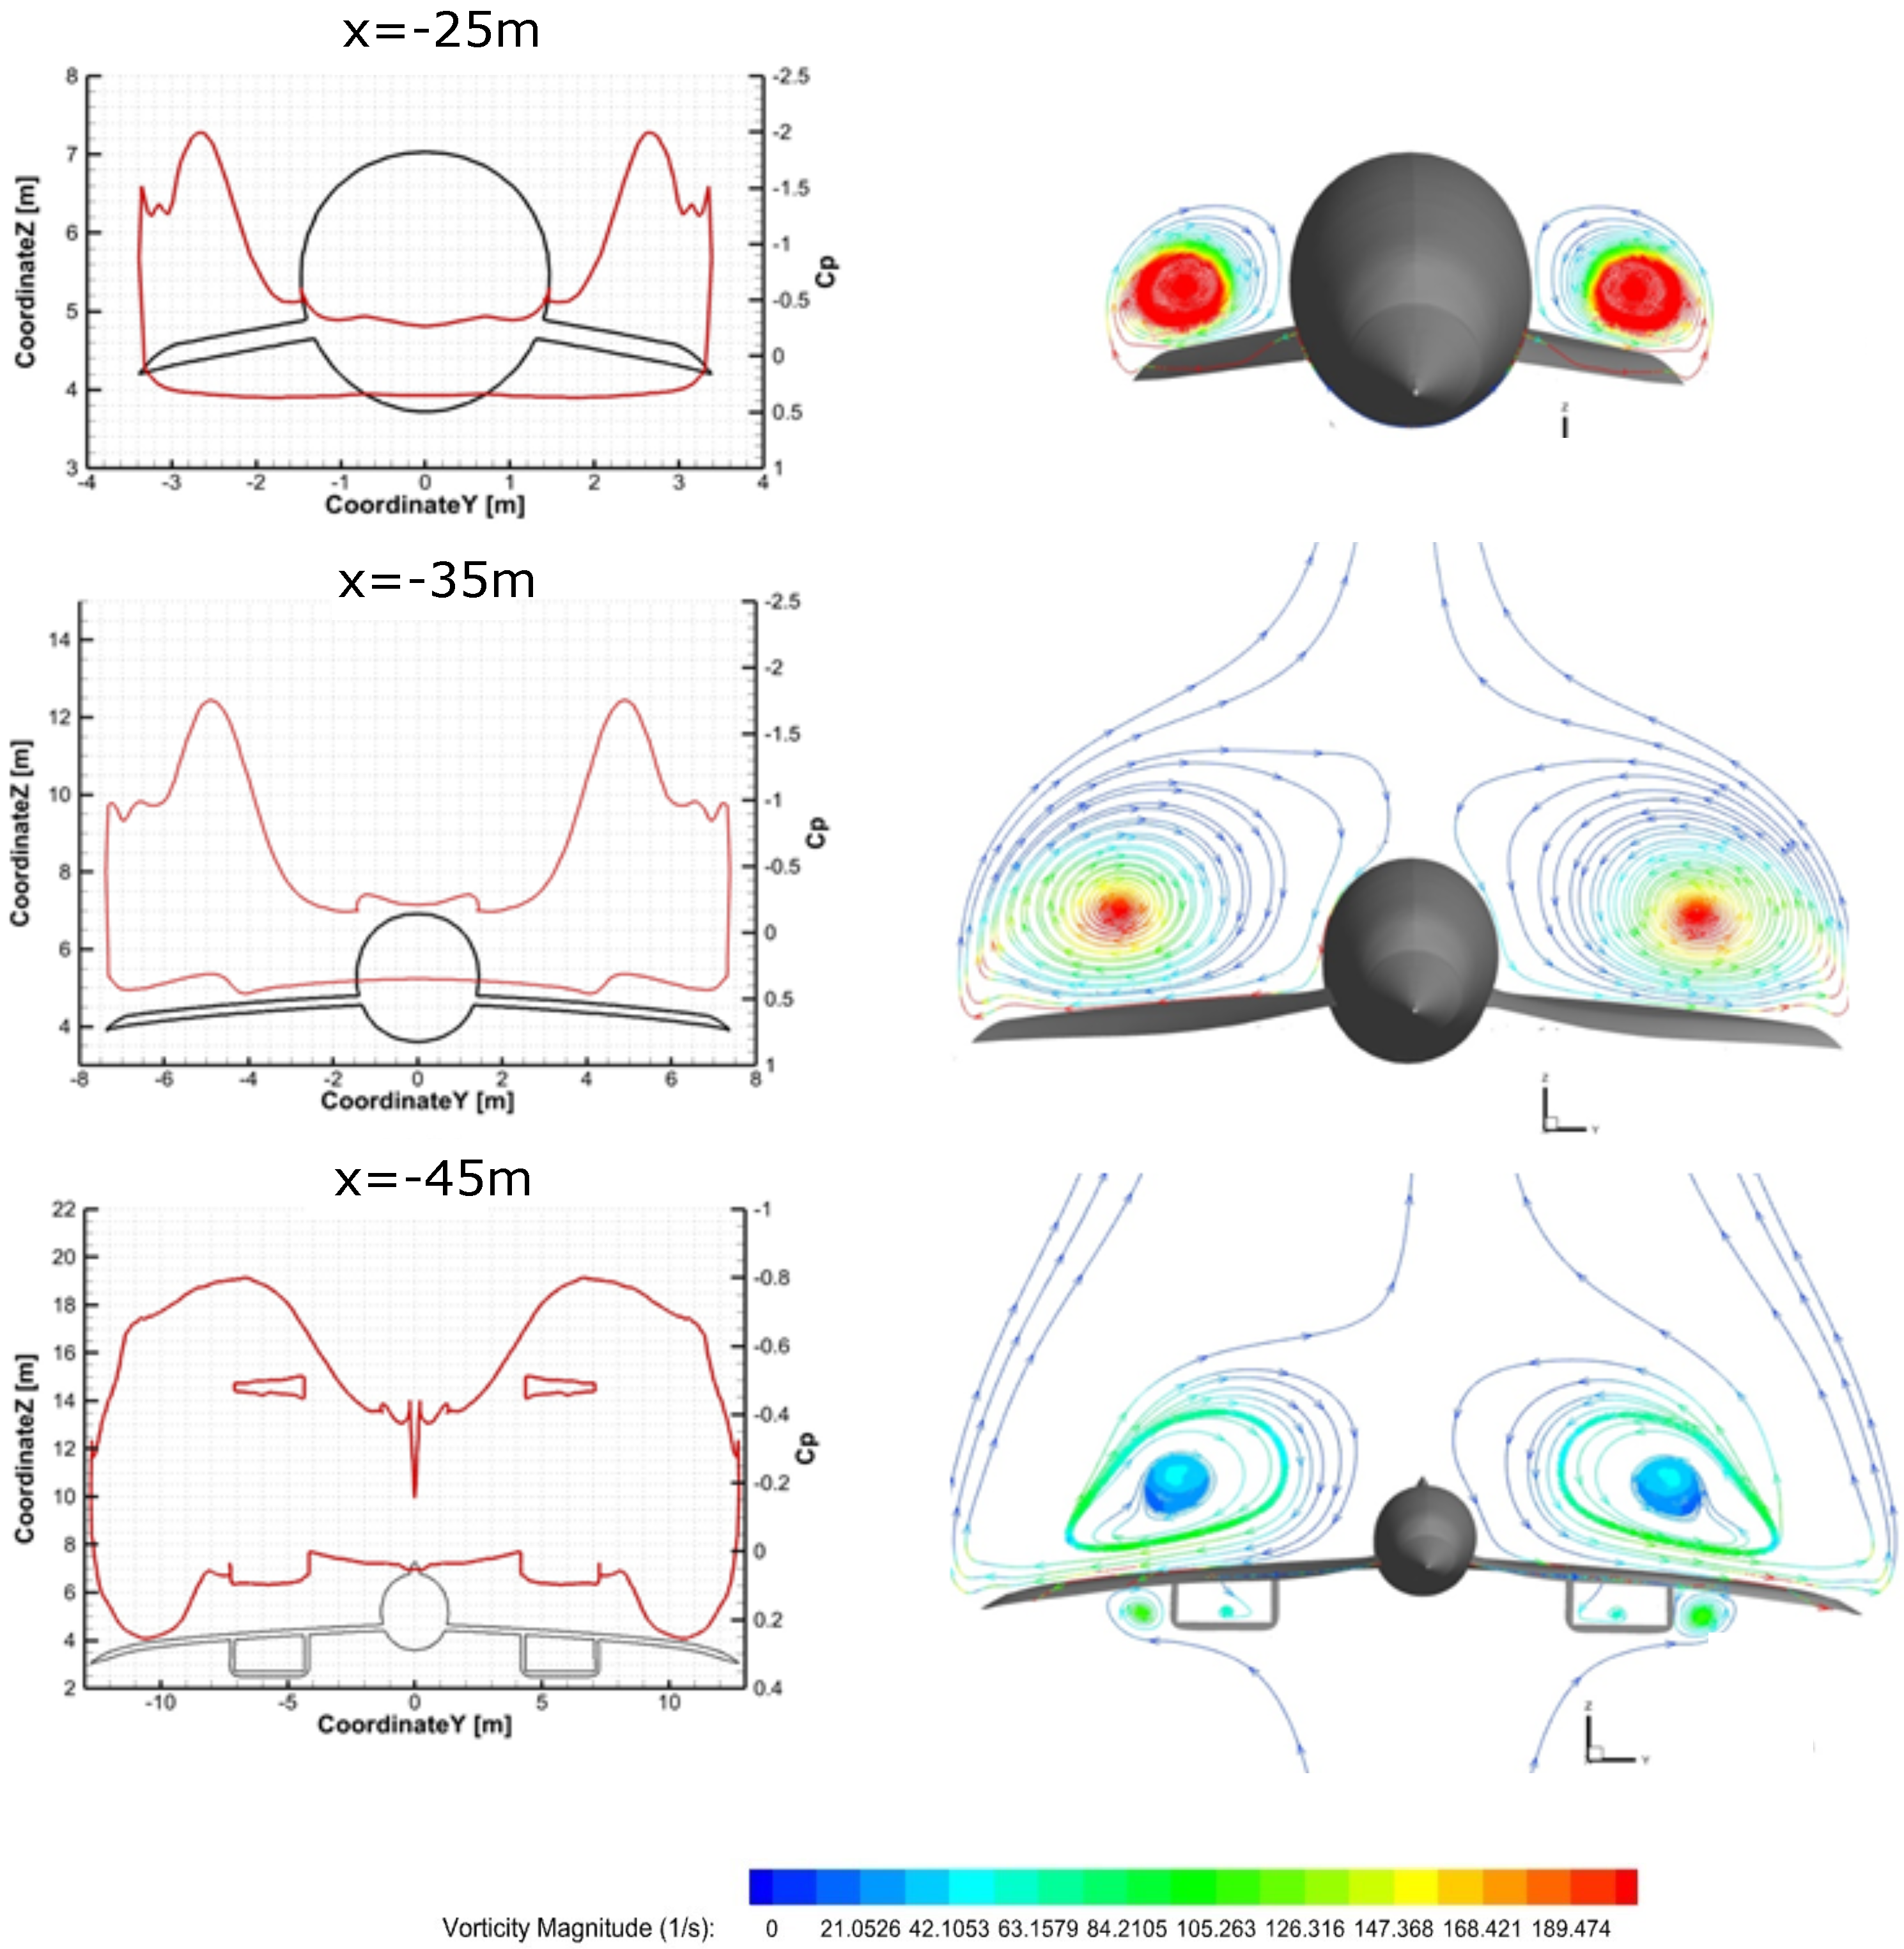
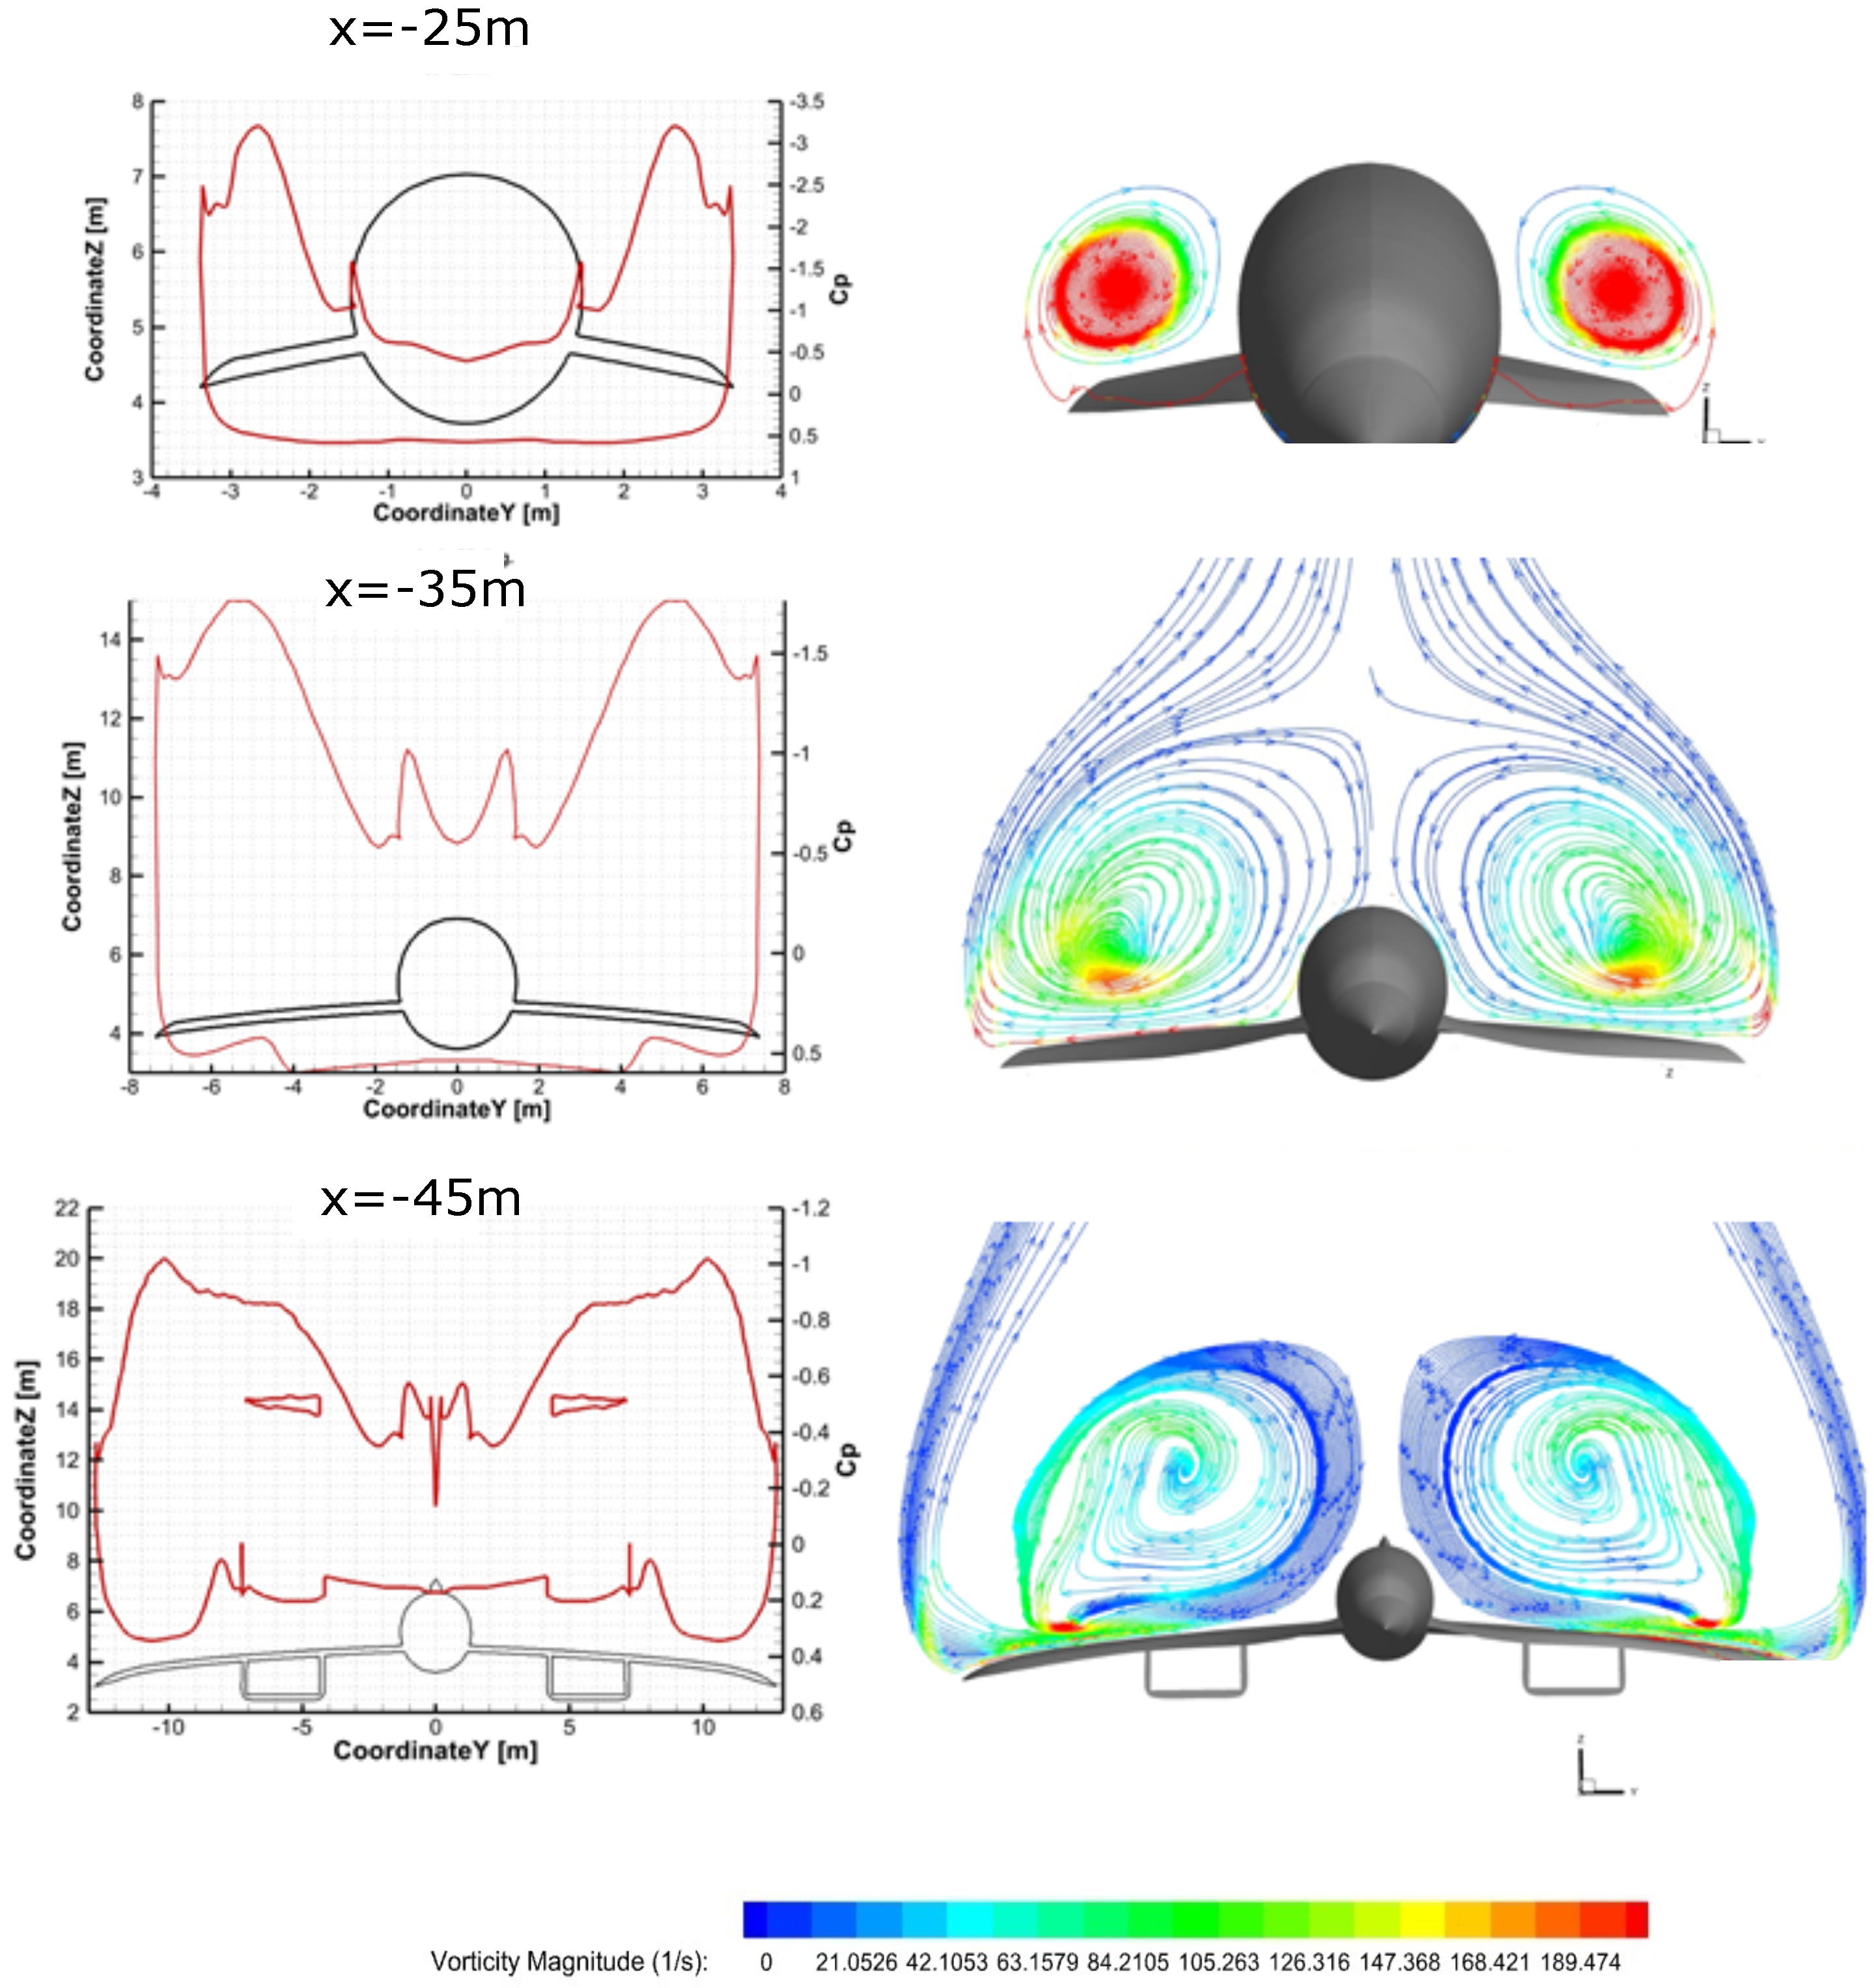
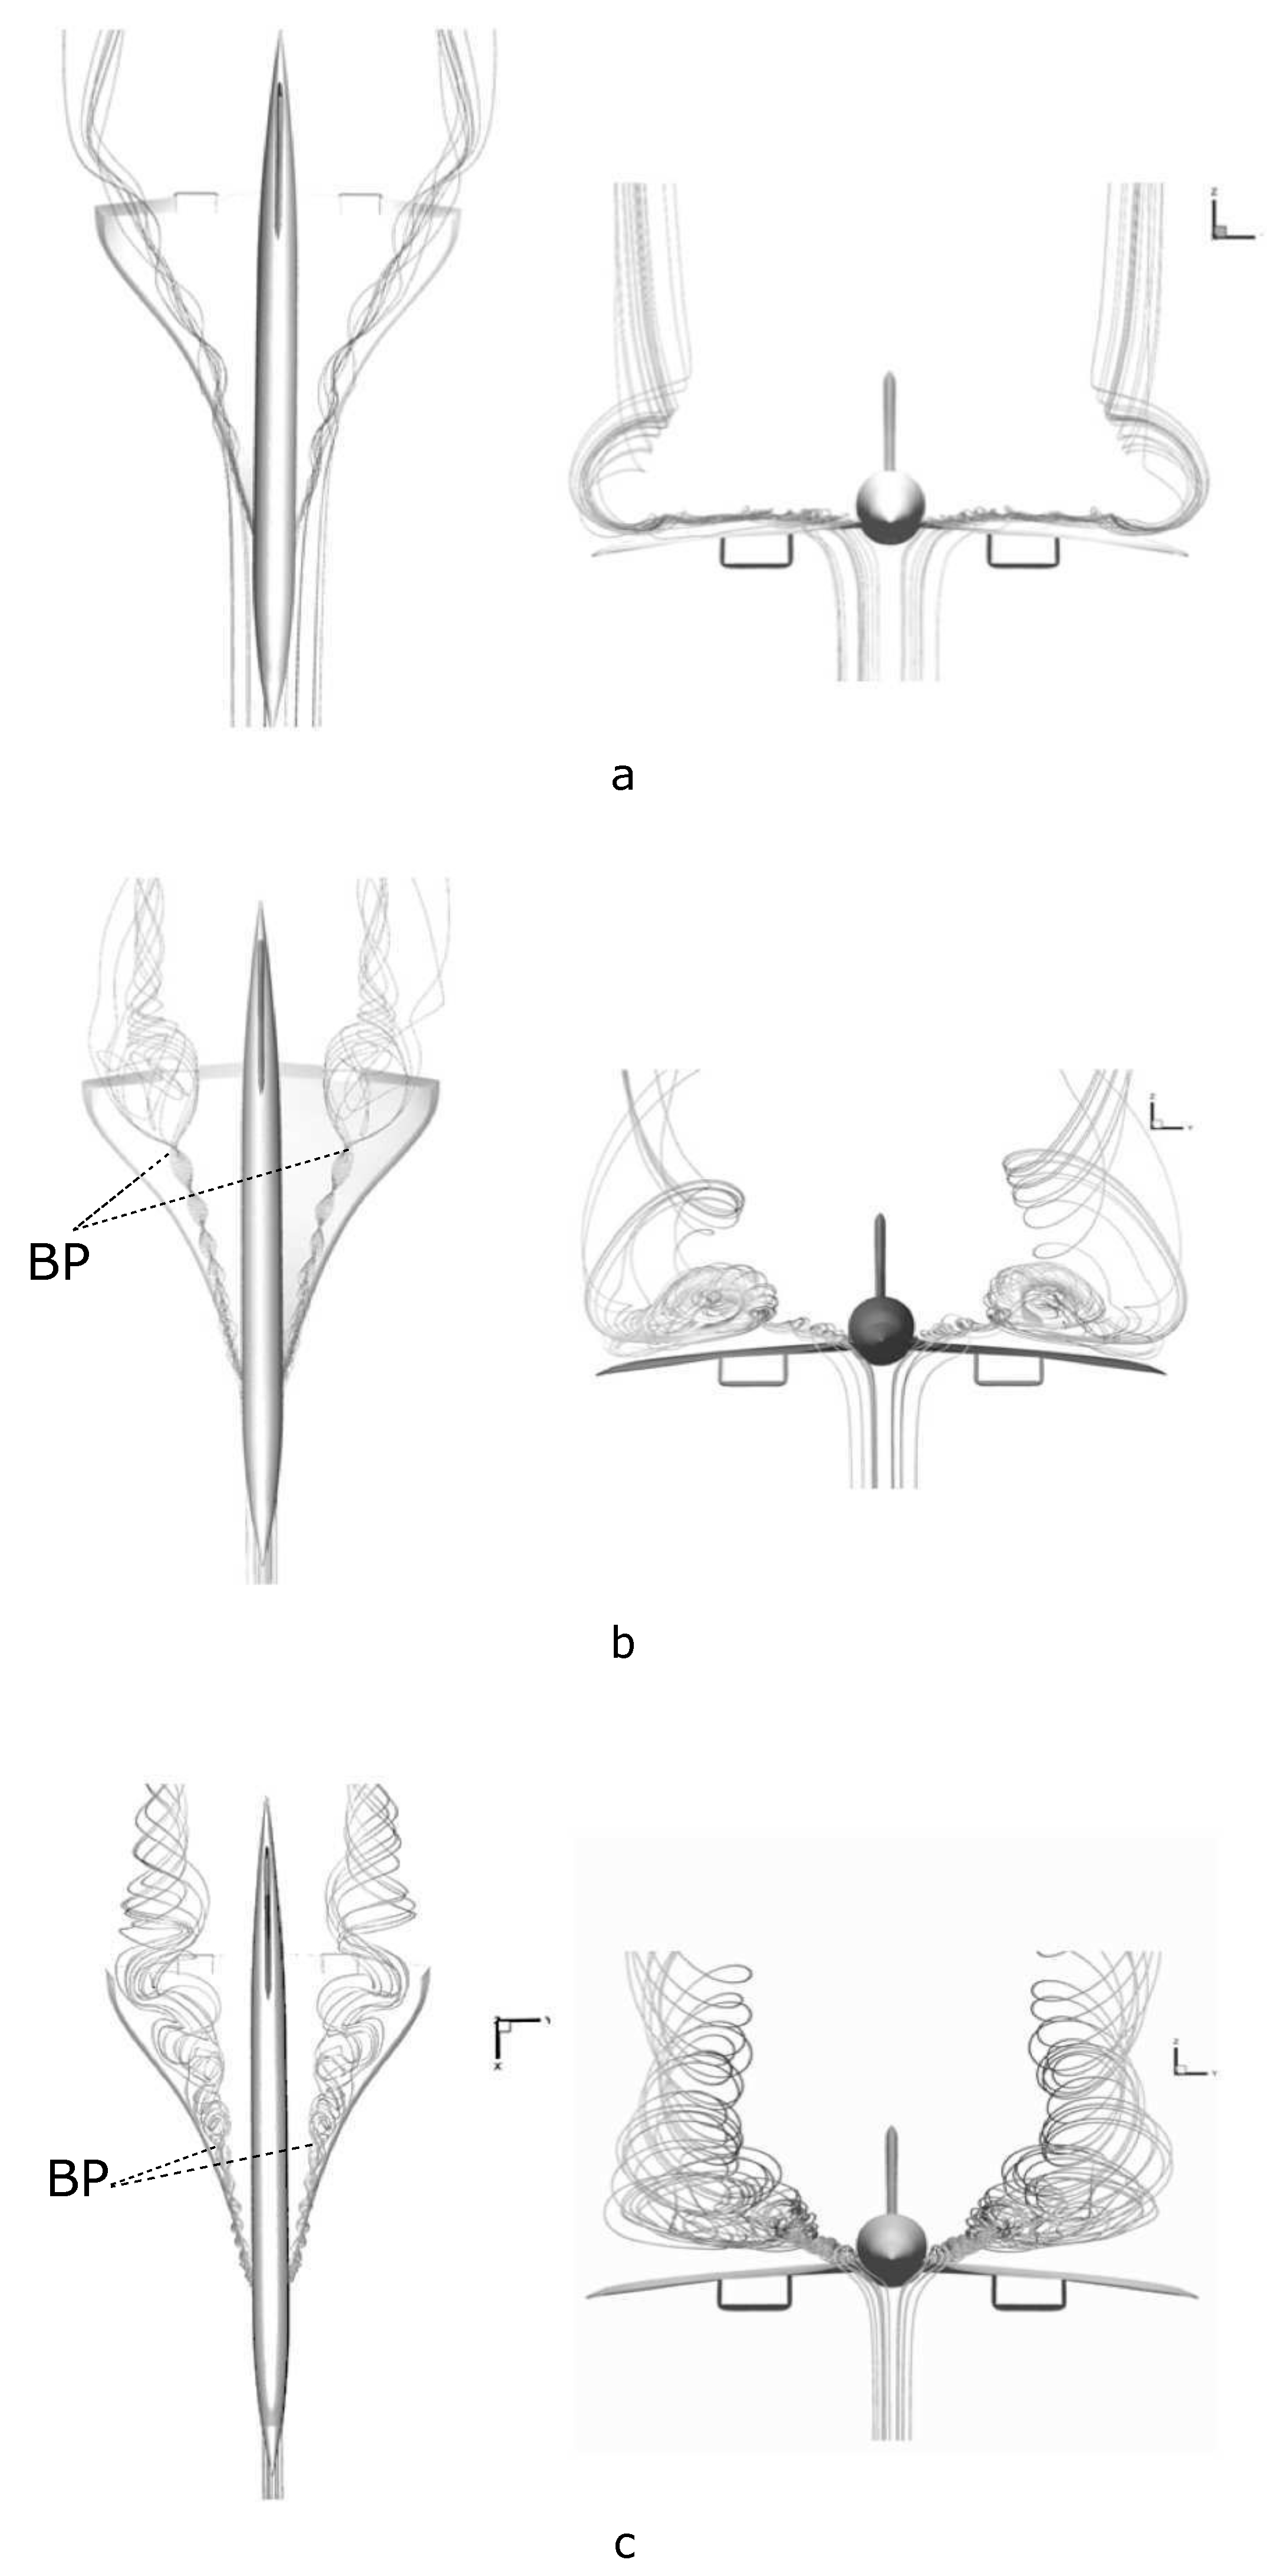
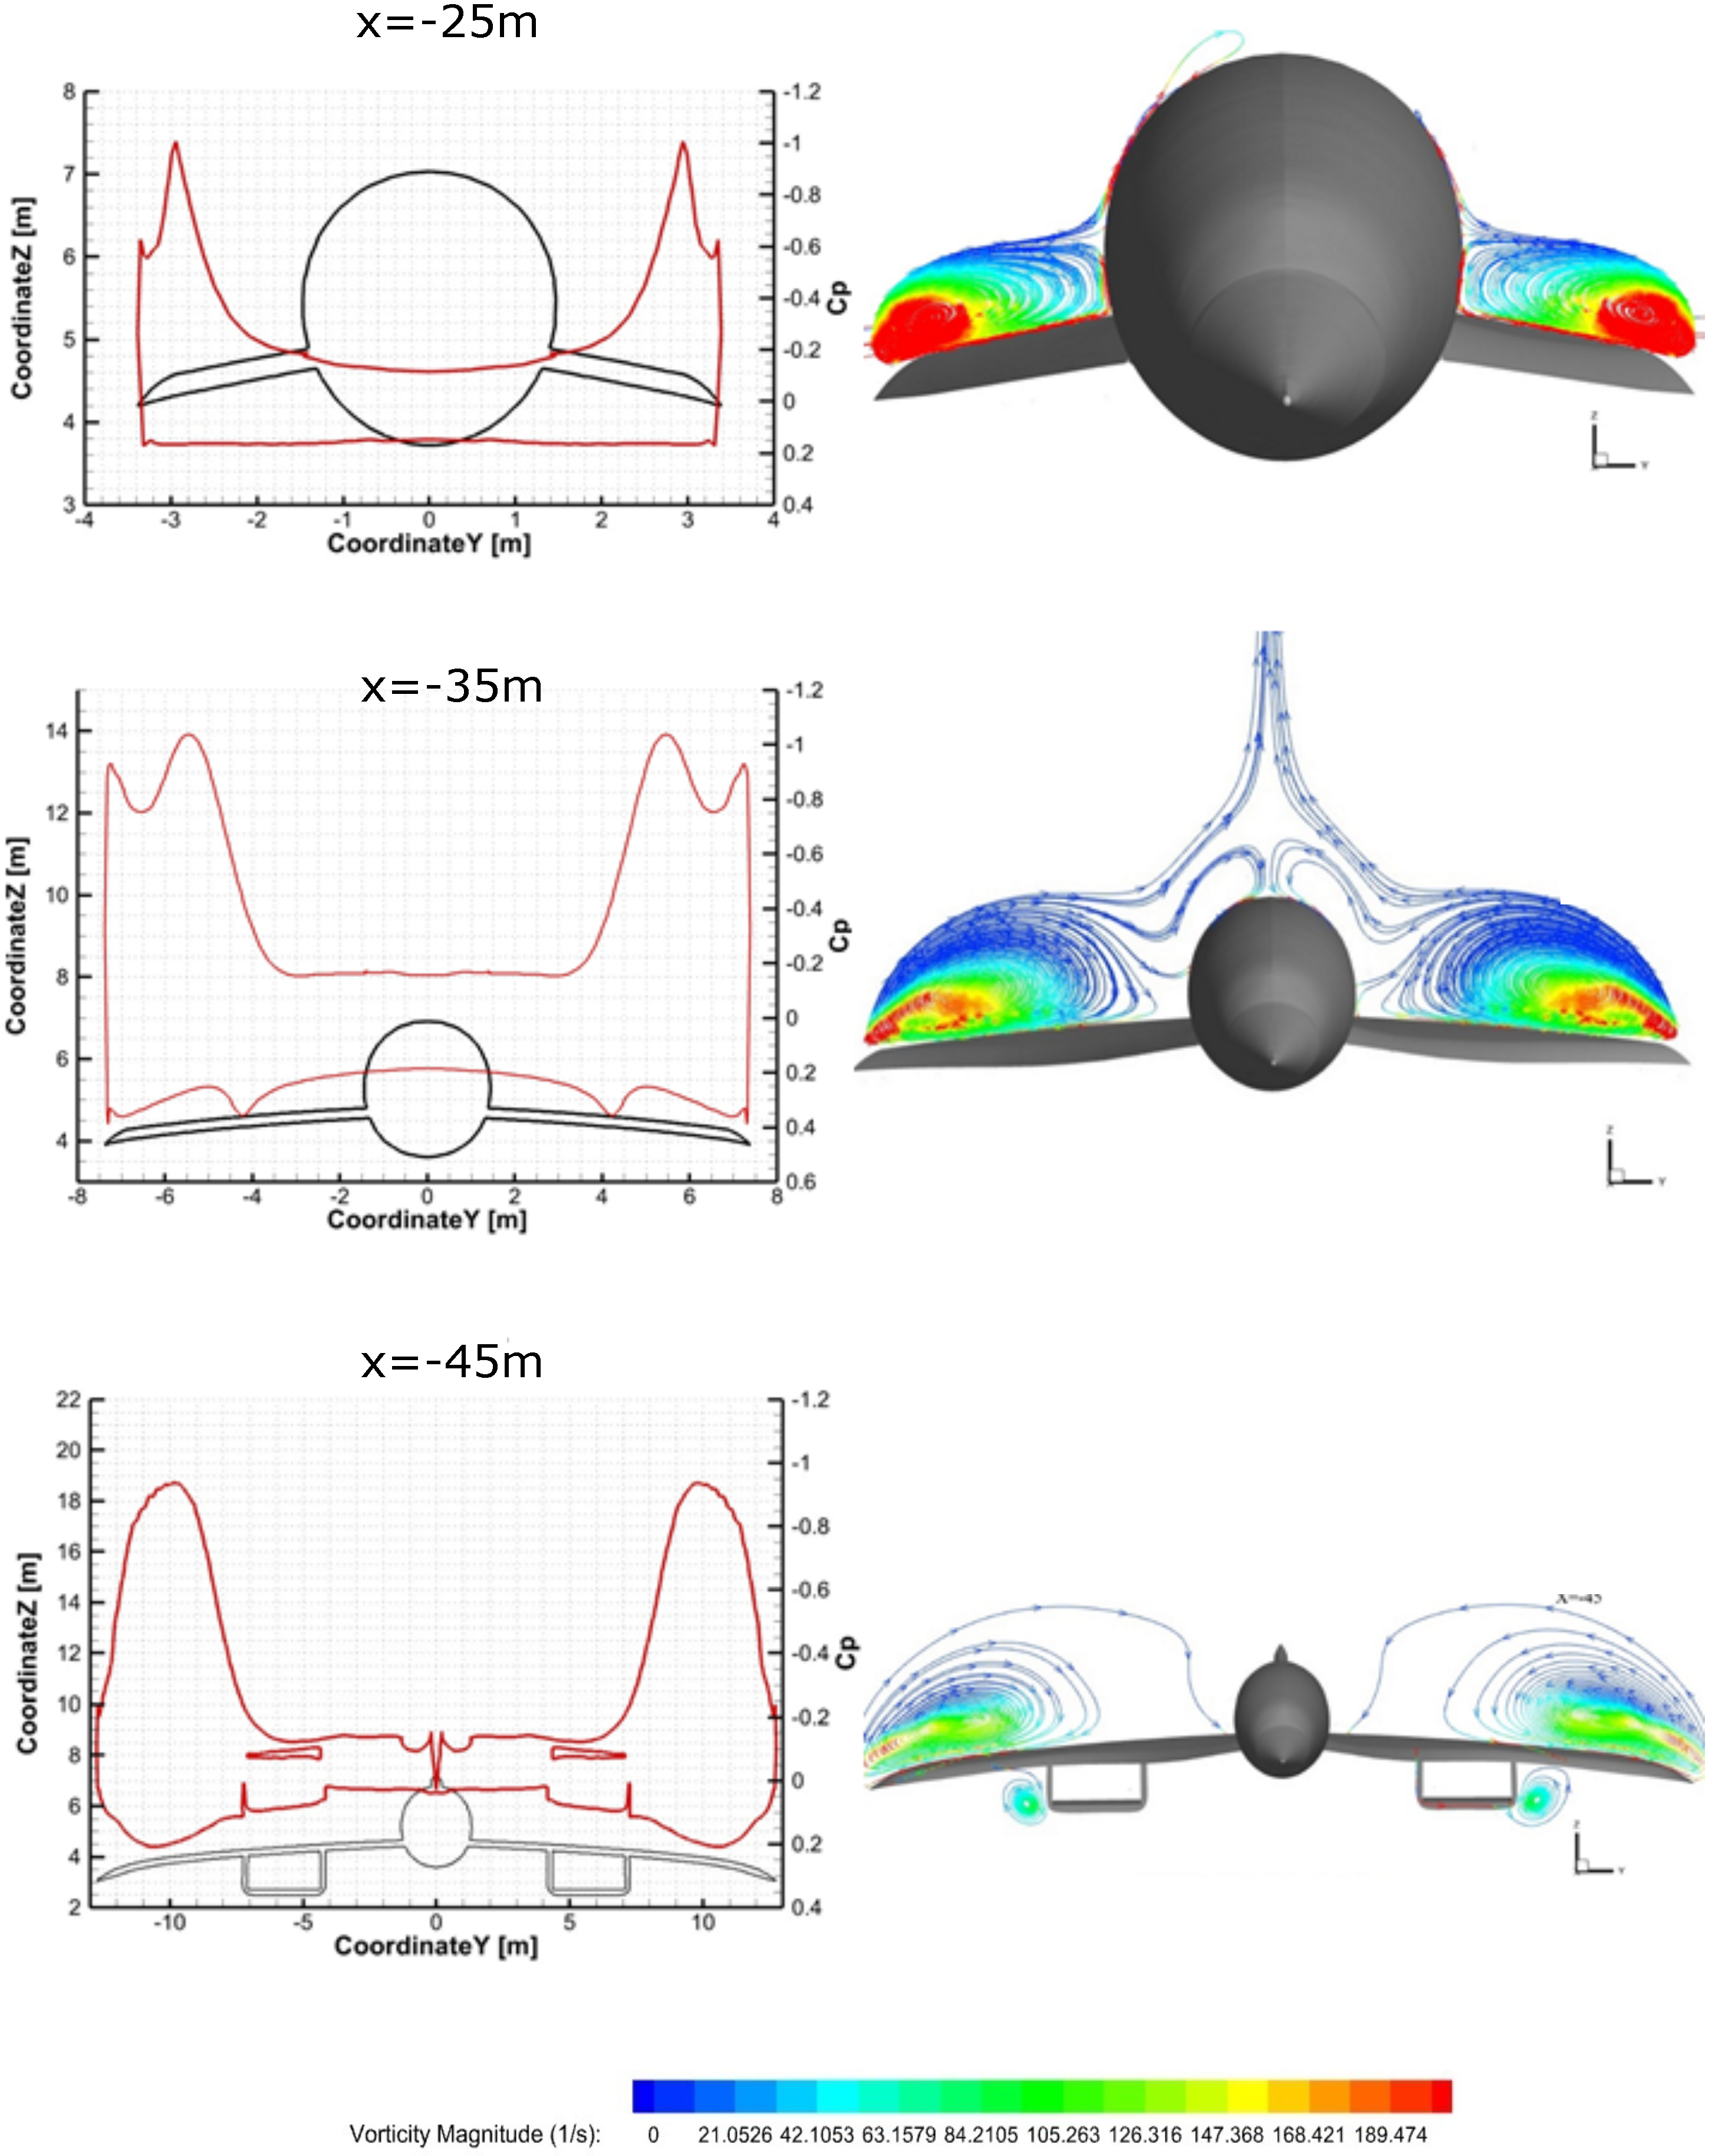
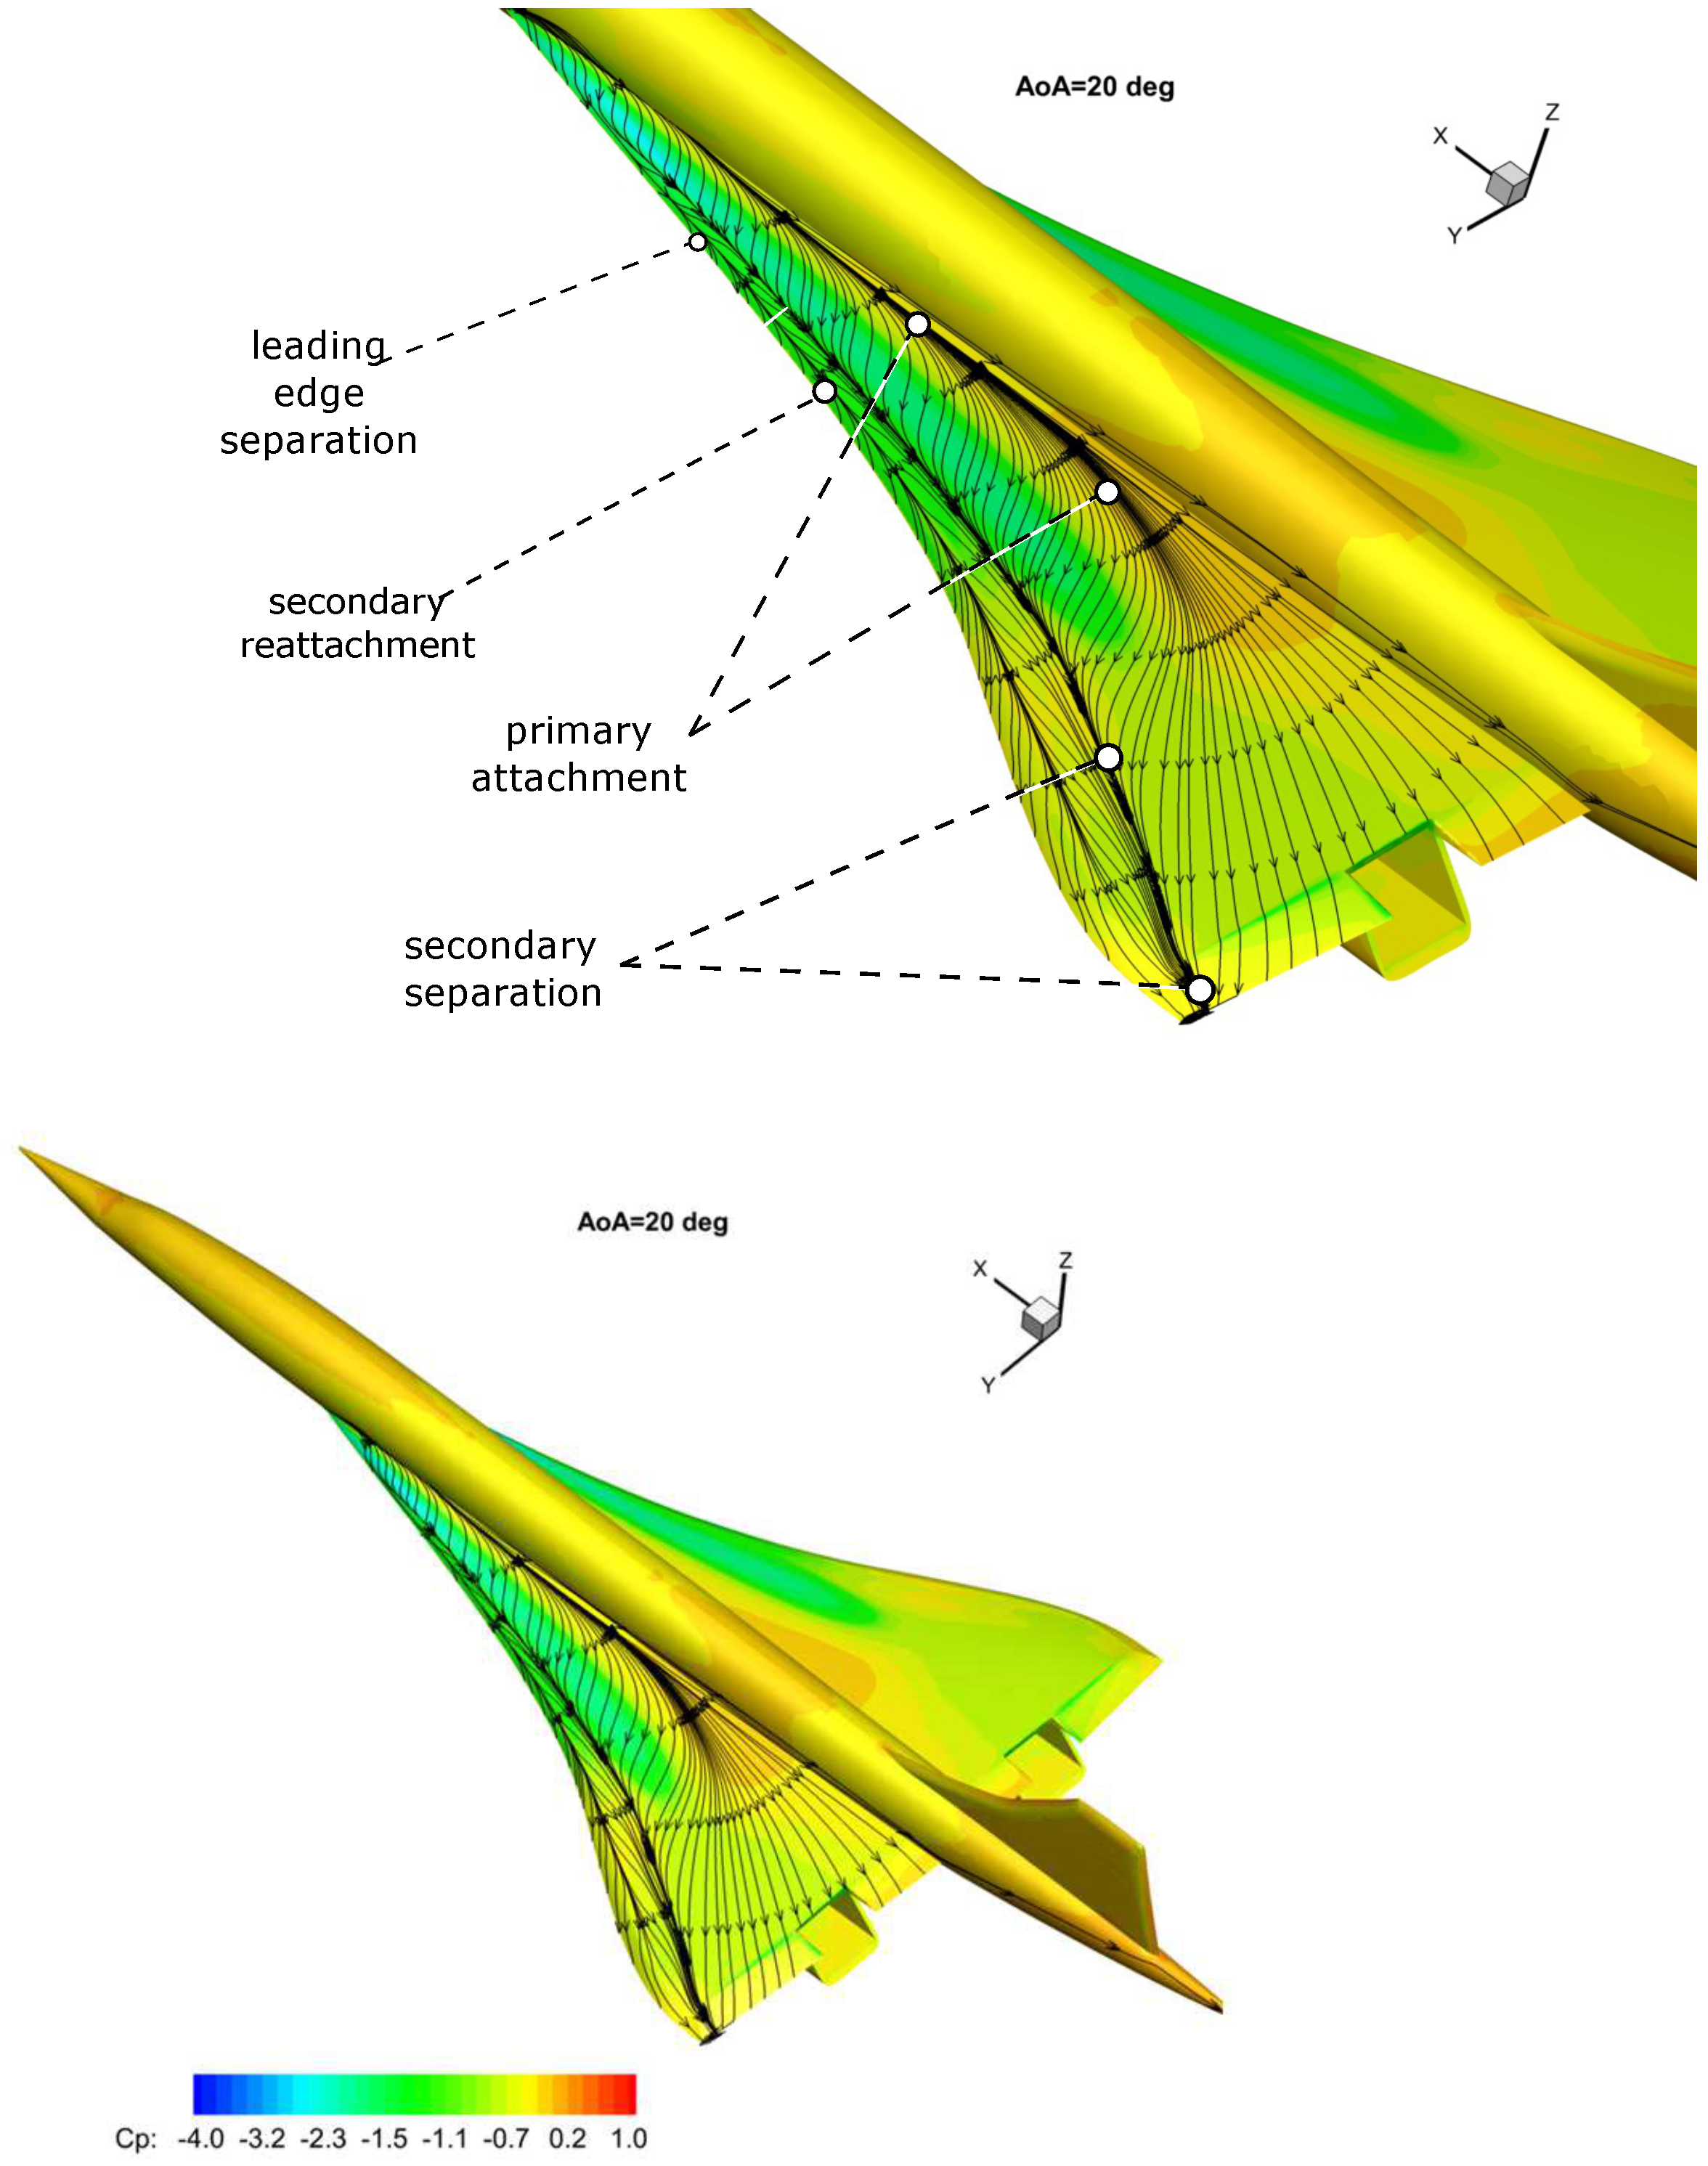
5.3. Flowfield at Breakdown
6. Conclusions
Author Contributions
Funding
Conflicts of Interest
References
- Carioscia, S.A.; Locke, J.W.; Boyd, L.D.; Lewis, M.J.; HalionSun, R.P.; Smith, H. Commercial Decelopment of Civilian Supersonic Aircraft; IDA Coument D-10845; IDA Science and Technology Policy Institute: Washington, DC, USA, 2019. [Google Scholar]
- Wood, R.M. Supersonic Aerodynamics of Delta Wings; NASA Technical Paper 2771; NASA: Houston, TX, USA, 1988. [Google Scholar]
- Elle, B.J. An Investigation at Low Speed of the Flow Near the Apex of Thin Delta Wing with Sharp Leading Edges; Reports and Memoranda 3176; Aeronautical Research Council: London, UK, 1958. [Google Scholar]
- Visbal, M.R. Onset of vortex breakdown above a pitching delta wing. AIAA J. 1994, 32, 1568–1575. [Google Scholar] [CrossRef]
- Ekaterinaris, J.A.; Schiff, L.B. Numerical simulation of incidence and sweeep effects on delta wing vortex breakdown. J. Aircr. 1994, 31, 1043–1049. [Google Scholar] [CrossRef]
- Gursul, I. Review of unsteady vortex flow over delta wings. J. Aircr. 2005, 42, 299–319. [Google Scholar] [CrossRef]
- Taylor, G.; Gursul, I. Buffeting flows over a low sweep delta wing. AIAA J. 2004, 42. [Google Scholar] [CrossRef]
- Nelson, R.C.; Pelletier, A. The unsteady aerodynamics of slender wings and aircraft undergoing large amplitude maneuvers. Prog. Aerosp. Sci. 2003, 39, 185–248. [Google Scholar] [CrossRef]
- Sun, Y.; Smith, H.; Chen, H. Conceptual Design of Low-Boom Low-Drag Supersonic Transports; American Institute of Aeronautics and Astronautics: Reston, VA, USA, 2020. [Google Scholar]
- Aerion Supersonic. 2017. Available online: https://www.aerionsupersonic.com (accessed on 8 August 2021).
- Spike Aerospace. 2021. Available online: https://www.spikeaerospace.com/spike-images/ (accessed on 8 August 2021).
- Boom Airliner. 2021. Available online: https://boomsupersonic.com/airliner (accessed on 8 August 2021).
- Yoshida, K. Supersonic drag reduction technology in the scaled supersonic experimental aeroplane project by JAXA. Prog. Aerosp. Sci. 2009, 45, 124–146. [Google Scholar] [CrossRef]
- NASA. Supersonic Project Review. 2017. Available online: https://ntrs.nasa.gov/archive/nasa/casi.ntrs.nasa.gov/20170007758.pdf (accessed on 8 August 2021).
- Aronstein, D.C.; Schueler, K.L. Two Supersonic Business Aircraft Conceptual Designs, With and Without Sonic Boom Constraint. J. Aircraft 2005, 42, 775–786. [Google Scholar] [CrossRef]
- Banerjee, T. Design Guidelines for Supersonic Aircrafts in Civil Aviation. Int. J. Aviat. Aeronaut. Aerosp. 2019, 6. [Google Scholar] [CrossRef]
- Sun, Y.; Smith, H. Design and operational assessment of a low-boom low-drag supersonic business jet. Proc. Inst. Mechan. Eng. Part G J. Aerosp. Eng. 2021. [Google Scholar] [CrossRef]
- Sun, Y.; Smith, H. Low-Boom Low-Drag Solutions through the Evaluation of Different Supersonic Business Jet Concepts. Aeronaut. J. 2019, 124, 76–95. [Google Scholar] [CrossRef]
- Quirino, M.U.; Calvo, M.; Munjulury, R.C.; Abdalla, A.M. Analysis of the Influence of the External Configuration on the Wave Drag of Supersonic Business Jets. In Proceedings of the 31st Congress of the International Council of the Aeronautical Sciences, Belo Horizonte, Brazil, 9–14 September 2018. [Google Scholar]
- Ghaffari, F.G.; Luckring, J.M.; Thomas, J.L.; Bates, B.; Biedron, R. Multiblock Navier-Stokes solutions about the F/A-18 wing-LEX-fuselage configuration. J. Aircr. 1993, 30, 293–303. [Google Scholar] [CrossRef]
- Luckring, J.M. The discovery and prediction of vortex flow aerodynamics. Aeronaut. J. 2019, 123, 729–804. [Google Scholar] [CrossRef] [Green Version]
- Breitsamer, C. Unsteady flow phenomena associated with leading edge vortices. Progress Aerosp. Sci. 2008, 44, 48–65. [Google Scholar] [CrossRef]
- Cummings, R.M.; Shutte, A. Detached-Eddy simulation of the vortical flow field about the VFE-2 delta wing. Aerosp. Sci. Andf Technol. 2013, 24, 66–76. [Google Scholar] [CrossRef] [Green Version]
- Jian, L.; Kunyu, L.; Haisheng, S.; Yong, H.; Zhitao, L.; Zhixiang, X. Dynamic response of vortes breakdown flows to a pitching double-delta wing. Aerosp. Sci. Technol. 2018, 72, 564–577. [Google Scholar]
- Zhou, B.Y.; Garger, N.R. Hybrid RANS/LES simulation of vortex breakdown over a Delta Wing. In Proceedings of the Computational Fluid Dynamics Conference, Dallas, TX, USA, 17–21 June 2019. [Google Scholar]
- Lamar, J.E.; Frink, N.T. Aerodynamic Features of Designed Strake-Wing Configurations. J. Aircrft 1982, 19. [Google Scholar] [CrossRef]
- Katz, J.; Plotkin, A. Low-Speed Aerodynamics, 2nd ed.; Cambridge Aerospace Series; Cambridge University Press: New York, NY, USA, 2001; ISBN 978-0-521-66552-0. [Google Scholar]
- Leibovich, S. The Structure of Vortex Breakdown. Annu. Rev. Fluid Mech. 1978, 10, 221–246. [Google Scholar] [CrossRef]
- Delrey, J.M. Aspects of vortex breakdown. Prog. Aerosp. Sci. 1994, 30, 1–59. [Google Scholar] [CrossRef]
- Gortz, S.; Rizzi, A.; Munukka, K. Computational Study of Vortex Breakdown over Swept Delta Wings; American Institute of Aeronautics and Astronautics: Norfolk, VA, USA, 1999. [Google Scholar] [CrossRef]


| Origin | Destination | Range (nm) | Mach 0.9 | Mach 1.4 | Mach 2.2 |
|---|---|---|---|---|---|
| New York (JFK) | Los Angeles (LAX) | 2200 | 3.7 h | 2.4 h | 1.5 h |
| New York (JFK) | London (LHR) | 3000 | 5.0 h | 3.2 h | 2.1 h |
| Los Angeles (LAX) | Bejiing (PEK) | 5400 | 9.1 h | 5.6 h | 3.7 h |
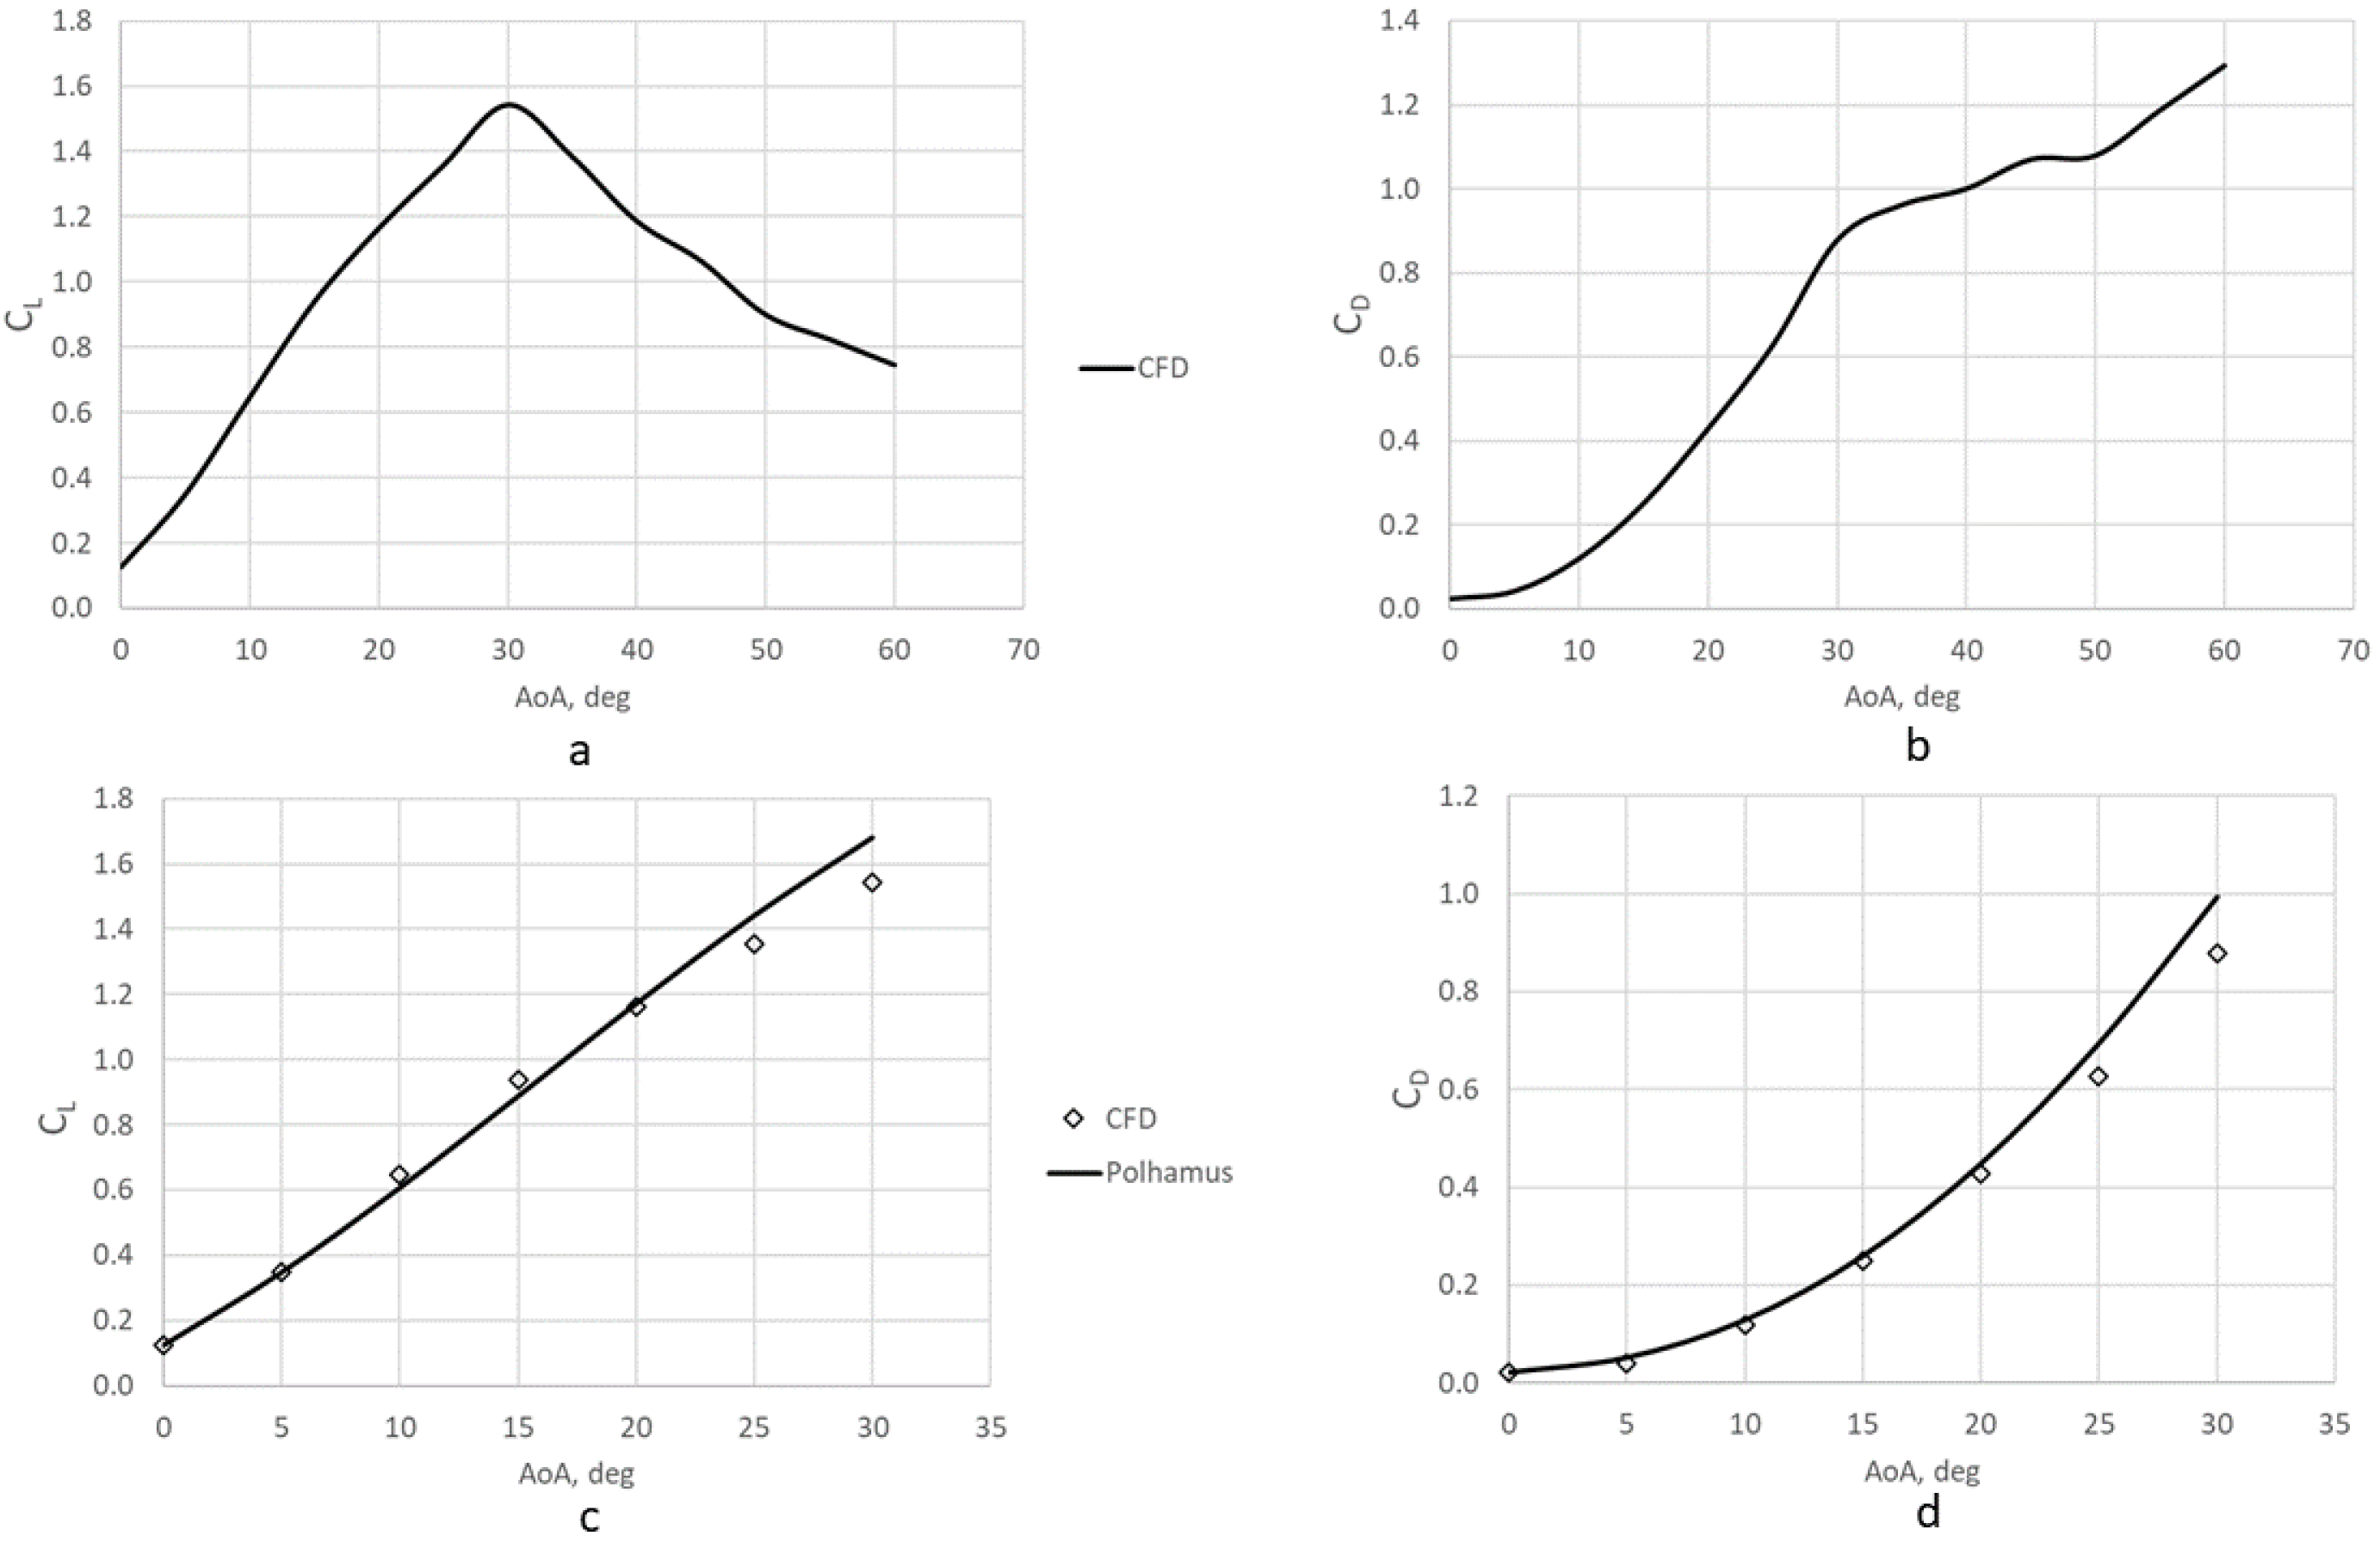
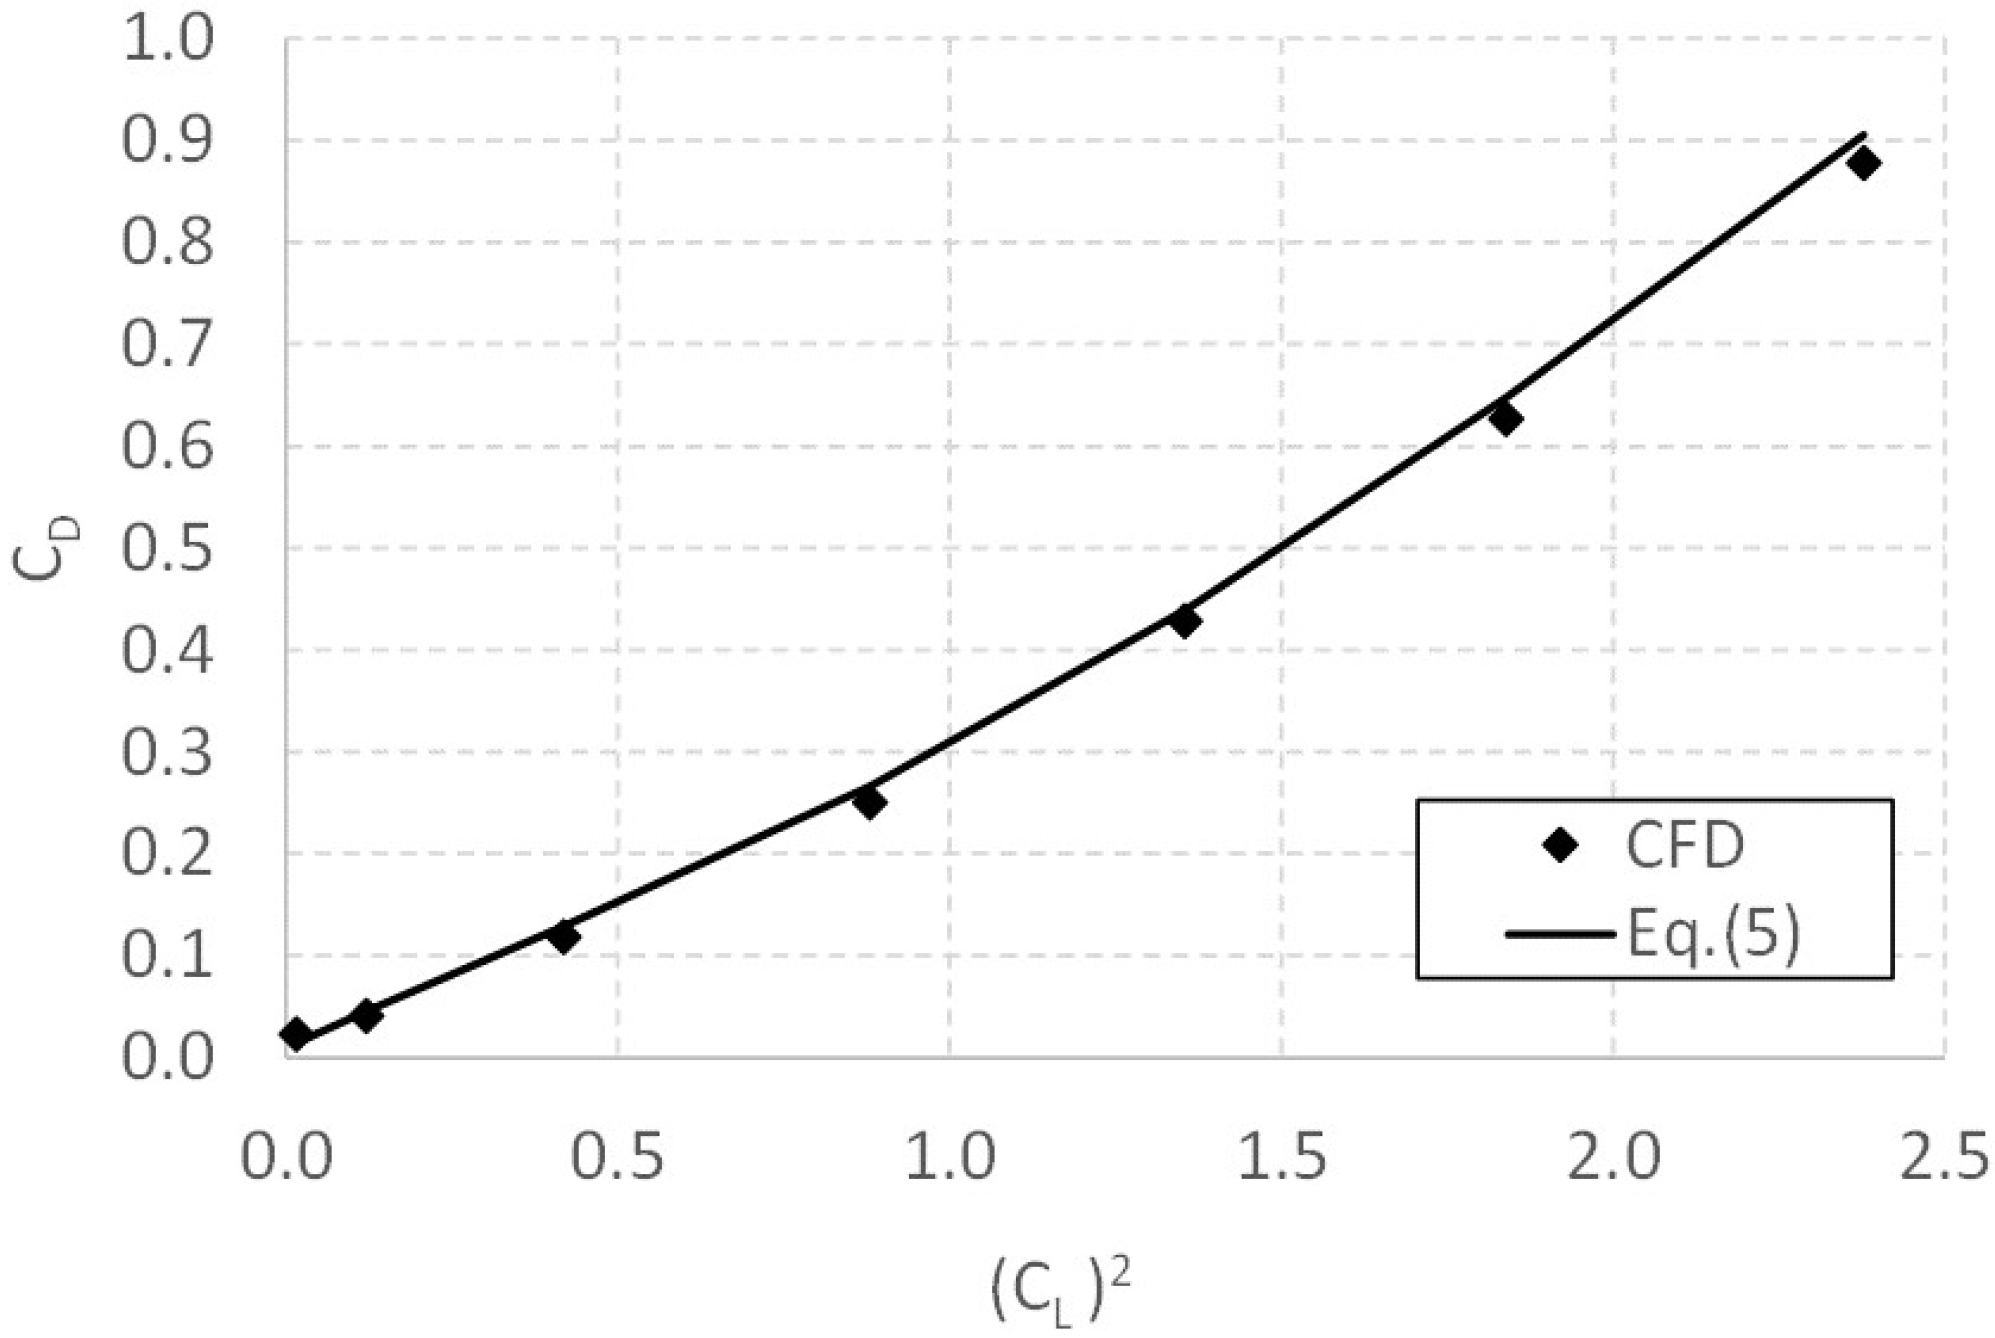
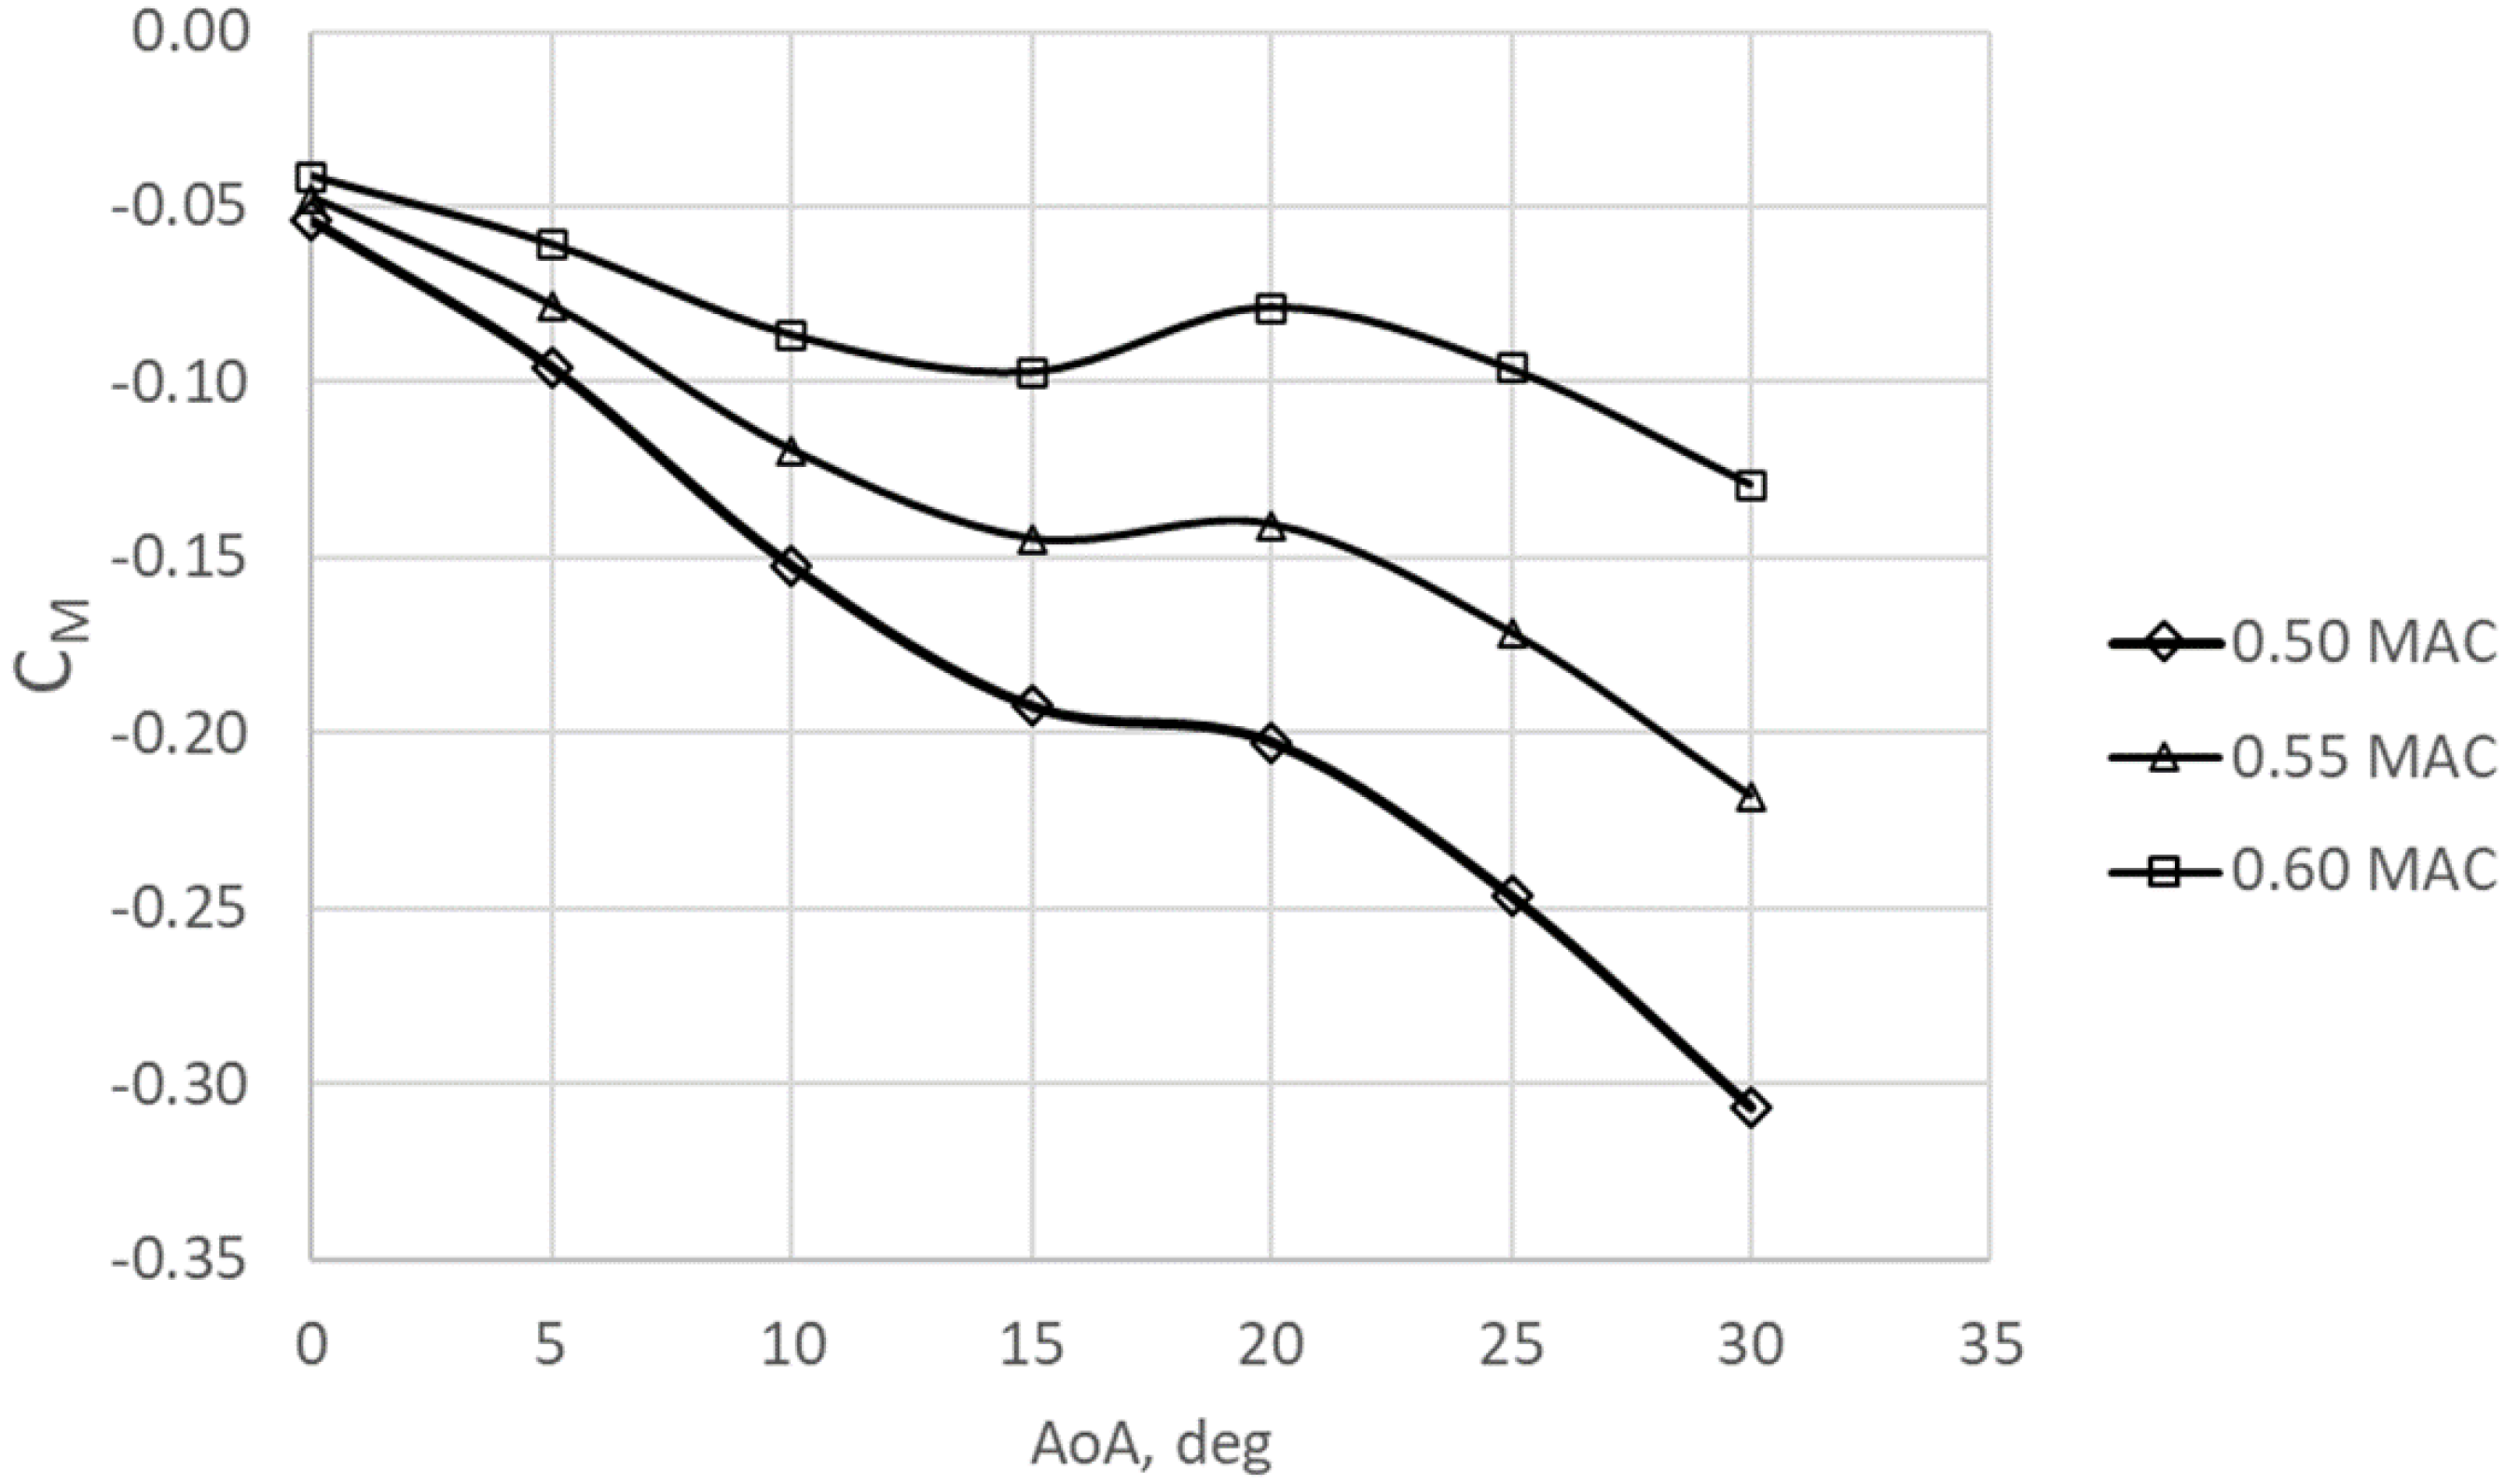
| 0 | 0.1251 | 0.02278 | −0.1896 | 0.1251 | 0.0228 | −0.0479 | 5.4868 |
| 5 | 0.3505 | 0.01042 | −0.4773 | 0.3473 | 0.0408 | −0.0859 | 8.5123 |
| 10 | 0.6571 | 0.00438 | −0.8762 | 0.6464 | 0.1184 | −0.1359 | 5.4595 |
| 15 | 0.9710 | −0.00143 | −1.3271 | 0.9382 | 0.2499 | −0.1733 | 3.7543 |
| 20 | 1.2401 | 0.00453 | −1.5428 | 1.1637 | 0.4284 | −0.1778 | 2.7166 |
| 25 | 1.4937 | −0.00508 | −1.8796 | 1.3559 | 0.6267 | −0.2188 | 2.1636 |
| 30 | 1.7743 | −0.01085 | −2.2389 | 1.5420 | 0.8778 | −0.2667 | 1.7565 |
| 35 | 1.6850 | −0.00603 | −2.0999 | 1.3837 | 0.9615 | −0.2265 | 1.4391 |
| 40 | 1.5515 | 0.00373 | −1.9439 | 1.1861 | 1.0001 | −0.2179 | 1.1860 |
| 45 | 1.5089 | 0.00447 | −1.8832 | 1.0574 | 1.0701 | −0.2045 | 0.9881 |
| 50 | 1.4049 | 0.00478 | −1.7543 | 0.8971 | 1.0762 | −0.1912 | 0.8336 |
| 55 | 1.4448 | 0.00654 | −1.8189 | 0.8223 | 1.1873 | −0.2119 | 0.6926 |
| 60 | 1.4928 | 0.00146 | −1.8780 | 0.7451 | 1.2935 | −0.2175 | 0.5760 |
Publisher’s Note: MDPI stays neutral with regard to jurisdictional claims in published maps and institutional affiliations. |
© 2021 by the authors. Licensee MDPI, Basel, Switzerland. This article is an open access article distributed under the terms and conditions of the Creative Commons Attribution (CC BY) license (https://creativecommons.org/licenses/by/4.0/).
Share and Cite
Aprovitola, A.; Di Nuzzo, P.E.; Pezzella, G.; Viviani, A. Aerodynamic Analysis of a Supersonic Transport Aircraft at Landing Speed Conditions. Energies 2021, 14, 6615. https://doi.org/10.3390/en14206615
Aprovitola A, Di Nuzzo PE, Pezzella G, Viviani A. Aerodynamic Analysis of a Supersonic Transport Aircraft at Landing Speed Conditions. Energies. 2021; 14(20):6615. https://doi.org/10.3390/en14206615
Chicago/Turabian StyleAprovitola, Andrea, Pasquale Emanuele Di Nuzzo, Giuseppe Pezzella, and Antonio Viviani. 2021. "Aerodynamic Analysis of a Supersonic Transport Aircraft at Landing Speed Conditions" Energies 14, no. 20: 6615. https://doi.org/10.3390/en14206615
APA StyleAprovitola, A., Di Nuzzo, P. E., Pezzella, G., & Viviani, A. (2021). Aerodynamic Analysis of a Supersonic Transport Aircraft at Landing Speed Conditions. Energies, 14(20), 6615. https://doi.org/10.3390/en14206615