Article

Comparative Analysis of Combined Heating Systems Involving the Use of Renewable Energy for Greenhouse Heating

1
Agriculture and Life Sciences Research Institute, Kangwon National University, Hyoja 2 Dong 192-1, Chuncheon-si 24341, Korea
2
Department of Interdisciplinary Program in Smart Agriculture, Kangwon National University, Hyoja 2 Dong 192-1, Chuncheon-si 24341, Korea
3
Department of Biosystems Engineering, Kangwon National University, Hyoja 2 Dong 192-1, Chuncheon-si 24341, Korea
*
Author to whom correspondence should be addressed.
Energies 2021, 14(20), 6603; https://doi.org/10.3390/en14206603
Submission received: 16 September 2021 / Revised: 6 October 2021 / Accepted: 7 October 2021 / Published: 13 October 2021
(This article belongs to the Topic Multi-Energy Systems)

Abstract

:
The continued use of fossil fuels is contributing to severe environmental pollution and the establishment of an abnormal climate; consequently, alternative renewable energy sources are being actively investigated worldwide. Further, following global trends, numerous countermeasures aimed at improving carbon neutrality, promoting sustainable agriculture, and reducing fossil fuel dependence are being implemented in the Republic of Korea. Therefore, this study was conducted to investigate the application of renewable energies for greenhouse heating in the Republic of Korea. Three hybrid systems, numbered 1–3, were constructed using a pellet boiler, hydrothermal heat pump, and solar heat collection system, respectively. Thereafter, the heating performance, combined heat efficiency, energy consumption per temperature lifting, and energy cost per temperature lifting of the systems were compared. The combined thermal efficiency results showed no significant differences. However, in terms of energy consumption and cost, hybrid system 1 demonstrated 25.7 and 24.1% savings, respectively, compared with the other systems. Moreover, based on economic analysis via the net present value and life cycle cost analysis methods, the system reduced costs by 29.2 and 27.7%, respectively, compared with conventional fossil fuel boilers. Thus, hybrid system 1 was identified as the most economical system.

1. Introduction

Carbon emissions are a global concern, and countermeasures to combat this issue are being implemented globally. Numerous international treaties, such as the United Nations Framework Convention on Climate Change, Kyoto Protocol, and Paris Agreement, aim to reduce greenhouse gas emissions worldwide. Accordingly, most advanced countries have set targets to achieve carbon neutrality by 2050 [1,2,3,4,5,6]. The increased focus on carbon neutrality has prompted extensive research on new and renewable energy technologies. For example, to actively participate in pollution reduction and voluntarily reduce estimated carbon emissions by 37% by 2030, the Republic of Korea (ROK) announced the “2030 Greenhouse Gas Reduction Roadmap” in 2018 [7]. The roadmap included fixed targets for greenhouse gas emission reduction for each industrial sector. For the agricultural sector in particular, the target was to reduce total carbon emissions by 1%. The Energy Consumption Survey conducted in the ROK in 2017 revealed that the fossil fuel dependence of the agriculture, forestry, and fishery sectors was 97.5% [8]. Moreover, the use of fossil fuels in heating systems and in powering agricultural equipment accounted for 53.4% of all the energy consumption associated with the agricultural sector [9]. Accordingly, the ROK is promoting the “Agricultural New and Renewable Energy Utilization Efficiency Project” to accelerate the utilization of new and renewable energy sources as well as energy-saving technologies.
In accordance with this project, heating systems using pellet boilers and geothermal heat pumps are being supplied to farms in the ROK. However, several post-installation problems are associated with these thermal energy supply systems. On the one hand, pellet boilers are difficult to maintain and have fluctuating operational costs because of variations in the cost of the wood pellets that are used as fuel [10,11,12,13,14]. Consequently, some farmers revert to using fossil fuel boilers. On the other hand, hydrothermal heat pumps are known to have high thermal efficiency and high heat source stability in the ROK (Republic of Korea) compared with those of air heat source pumps [15,16]. Specifically, the hydrothermal heat pumps that are supplied to farmers under the project primarily use groundwater as a heat source. However, the supply of heat, in this case, is unstable, as it depends on the amount of groundwater available [17,18]. Moreover, hydrothermal heat pumps require exorbitant initial investment costs.
Owing to these issues, farmers are hesitant to rely on alternative energy sources, and the utilization of new and renewable energy in greenhouses has remained unsuccessful.
First of all, domestic and foreign papers that applied pellet boilers to greenhouse heating include the following. Carlo Bibbiani et al. (2016) [12] judged the applicability of boilers using fossil fuels and wood fuels for greenhouse heating. In the Italian peninsula, the electric power energy load was estimated at 30 W/m2 (south) to 175 W/m2 (northern), but it was estimated to be 75,362.4–1,967,796 kW/m2·yr depending on the outside temperature. The flue gas produced by the boiler contains a large amount of CO2, so recycling it has the advantage of leading to increased plant production, but biomass boilers emit more NOx, SOx, VOC, PM, and ash than fossil fuels. There are disadvantages. When using a scrubber and flue gas control device, it is possible to use a more stable wood pellet boiler, and considering this, it is highly valuable to replace with a wood biomass boiler in the case of 5–100 €/m2 depending on the greenhouse area. Kang et al. (2013) [19] designed and manufactured a wood pellet boiler to obtain basic data for practical application of a wood pellet boiler system for greenhouse heating. In order to estimate the heating efficiency according to the change in heat capacity of 75,000, 100,000, and 120,000 kcal/h, the heating efficiency test was performed by controlling the amount of air flowing into the wood pellets and burner. The thermal efficiencies of 75,000, 100,000, and 120,000 kcal/h were 80.2%, 84.2%, and 81.6%, respectively, and the highest thermal efficiency was reported at 100,000 kcal/h.
Second, there are countless papers on greenhouse heating using a heat pump, but the following studies using solar heat as an auxiliary heat source are typical for heating systems that form a heat pump and a hybrid system. Hassanien et al. (2018) [20] studied a heat pump system using a vacuum tube type solar collector as an auxiliary heat source for greenhouse heating. The internal temperature for heating was set at 14 °C, and it was possible to cover 62%, 40%, and 78% of the required heating load in October, March, and April, respectively. In addition, the thermal efficiency of the vacuum tube type solar collector was 0.49 and the COP of the heat pump was 4.24. However, in January, the required heating load could not be fully met, and it was judged that it was due to heat loss in the thermal storage tank. Kwon et al. (2013) [21] developed a system that improves the performance of a heat pump by selectively using solar surplus heat and external air heat in the greenhouse as heat sources, and reduces carbon dioxide fertilization costs by delaying greenhouse ventilation. Using this system, the heating performance coefficient in the internal circulation mode was about 3.35, which was improved compared to 2.46 in the night external circulation mode and 2.67 in the daytime external circulation mode. However, as the greenhouse was operated without ventilation, the light transmittance was only 62% due to excessive moisture and moisture condensation. In a horticultural environment, light transmittance is the most important factor. It was mentioned that the part showing the effect of decreasing light transmittance is considered to have room for improvement. As such, research on a heat pump system using a pellet boiler or solar heat as an auxiliary heat source has been conducted in Korea and around the world. However, it was limited to judging the suitability or application of greenhouse heating using renewable energy. Therefore, this study was intended to study the continuous use of greenhouse heating using renewable energy or a new hybrid system.
The aforementioned solar thermal system acts as an excellent heat source under moderate climatic conditions [22]; however, its application in agriculture is challenging because of the limited land area that can be used for agriculture in the ROK. In addition, the economic feasibility of applying the solar heat collection system to agriculture without government subsidies in Korea is limited [23]. Additionally, studies on the application of solar heat in agriculture in the ROK are scarce; information regarding its performance and economic properties as a renewable energy source in agriculture is lacking.
Therefore, to ensure the use of renewable energy for heating greenhouses in ROK, this study was conducted to construct hybrid systems using new and renewable energies and to test the applicability of these systems in agriculture in the ROK. Further, based on multilateral comparative analyses and economic analyses of greenhouse heating, the most suitable system was identified.

2. Materials and Methods

2.1. Greenhouse Design

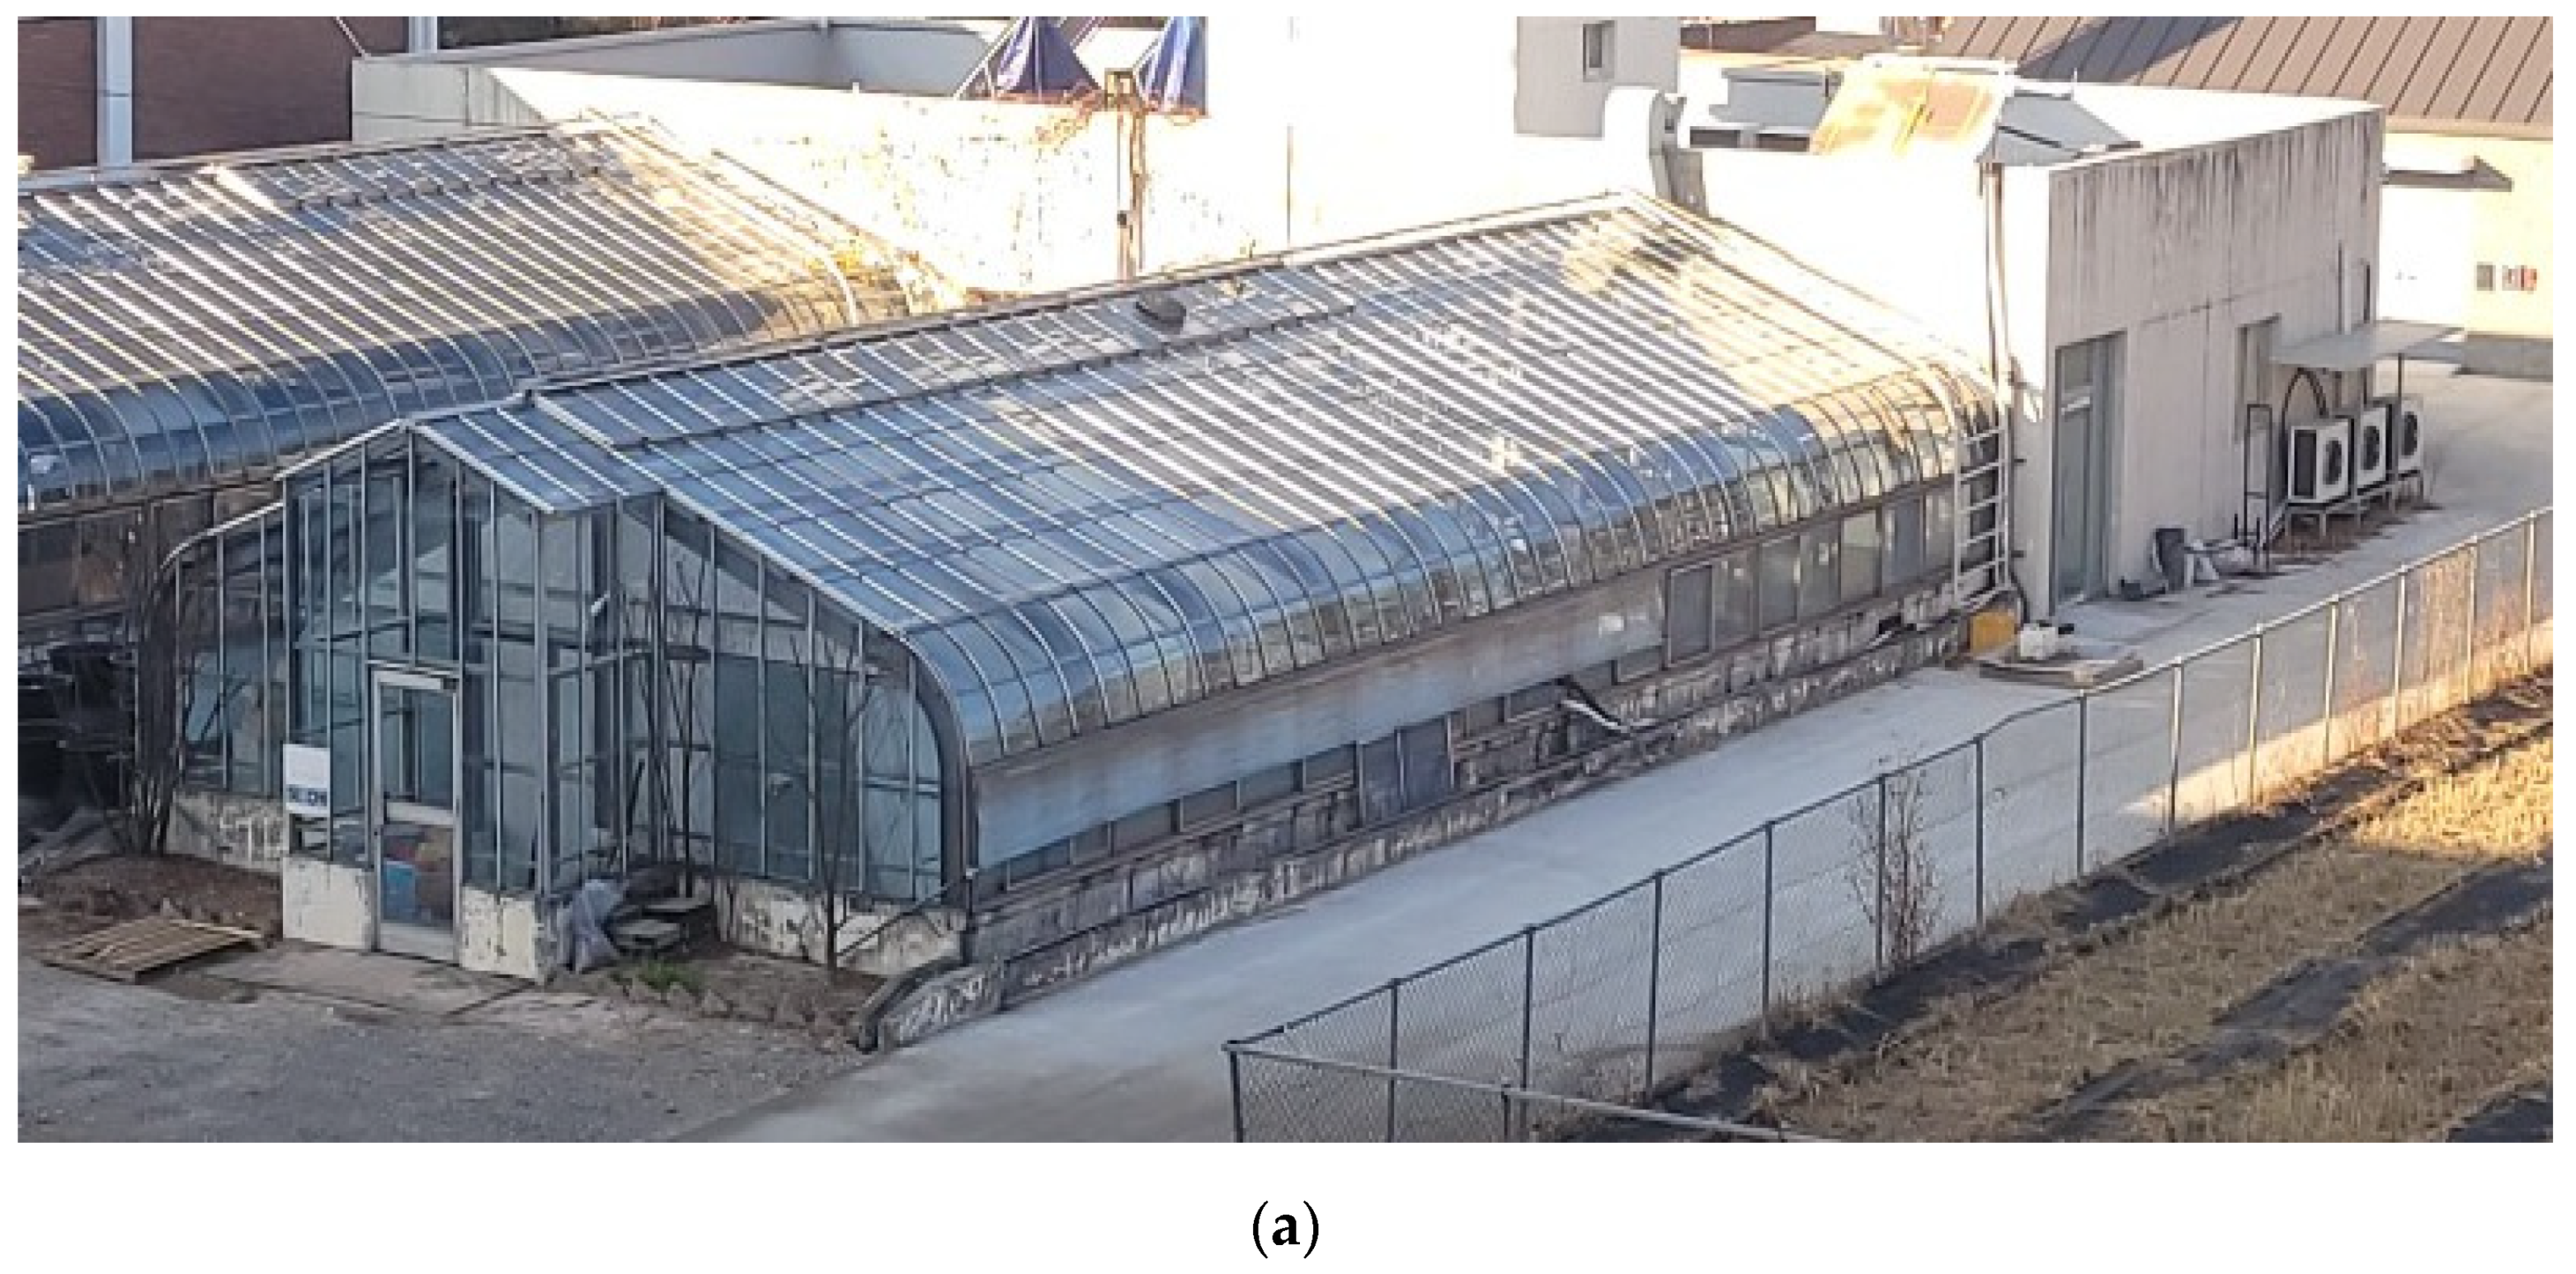
A glass greenhouse with an area of approximately 90 m2 at Kangwon University in Chuncheon-si, Gangwon-do, Korea was selected in this study. This greenhouse, which is equipped with an insulating curtain as well as ventilation facilities, features a double structure with an additional internal greenhouse. The experiments were conducted with the internal greenhouse closed. The floor area of the internal greenhouse and the covering area was 68.37 and 121.44 m2, respectively. The heating load of the experimental system was calculated based on these areas, and the capacity of each piece of equipment used in the heating system was also selected in consideration of these areas (Figure 1).

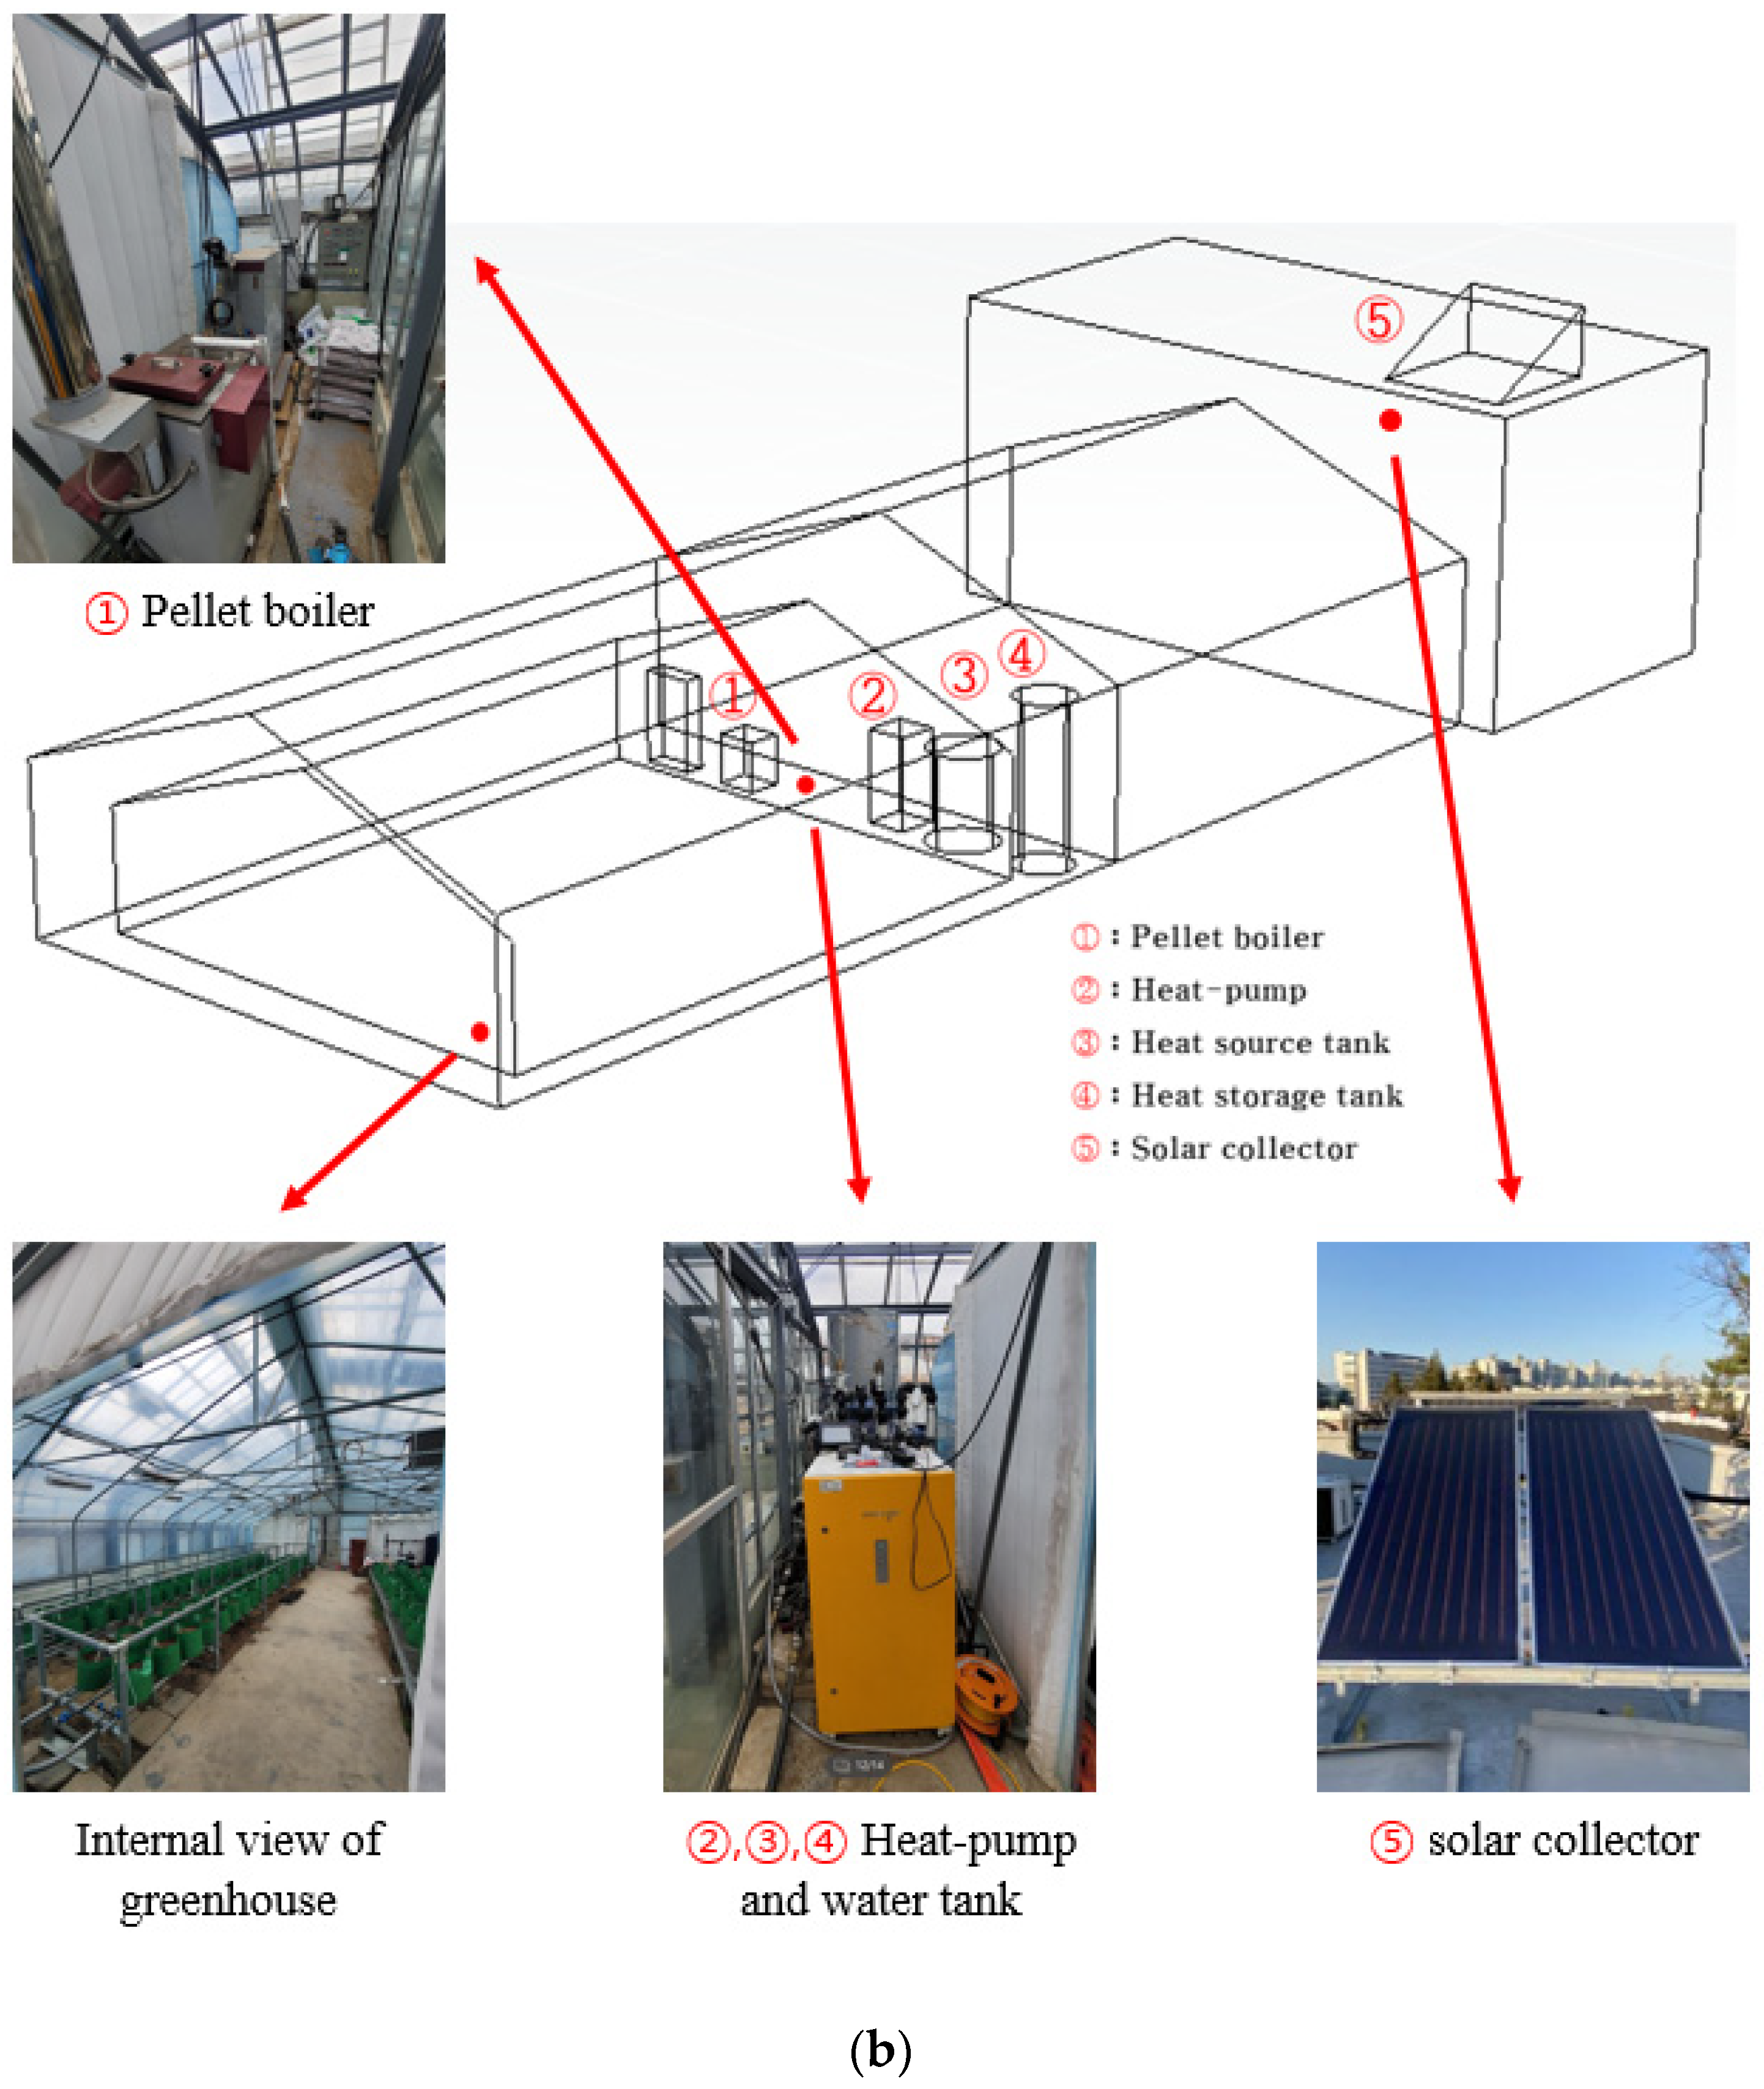
2.2. Thermal Energy Supply Systems

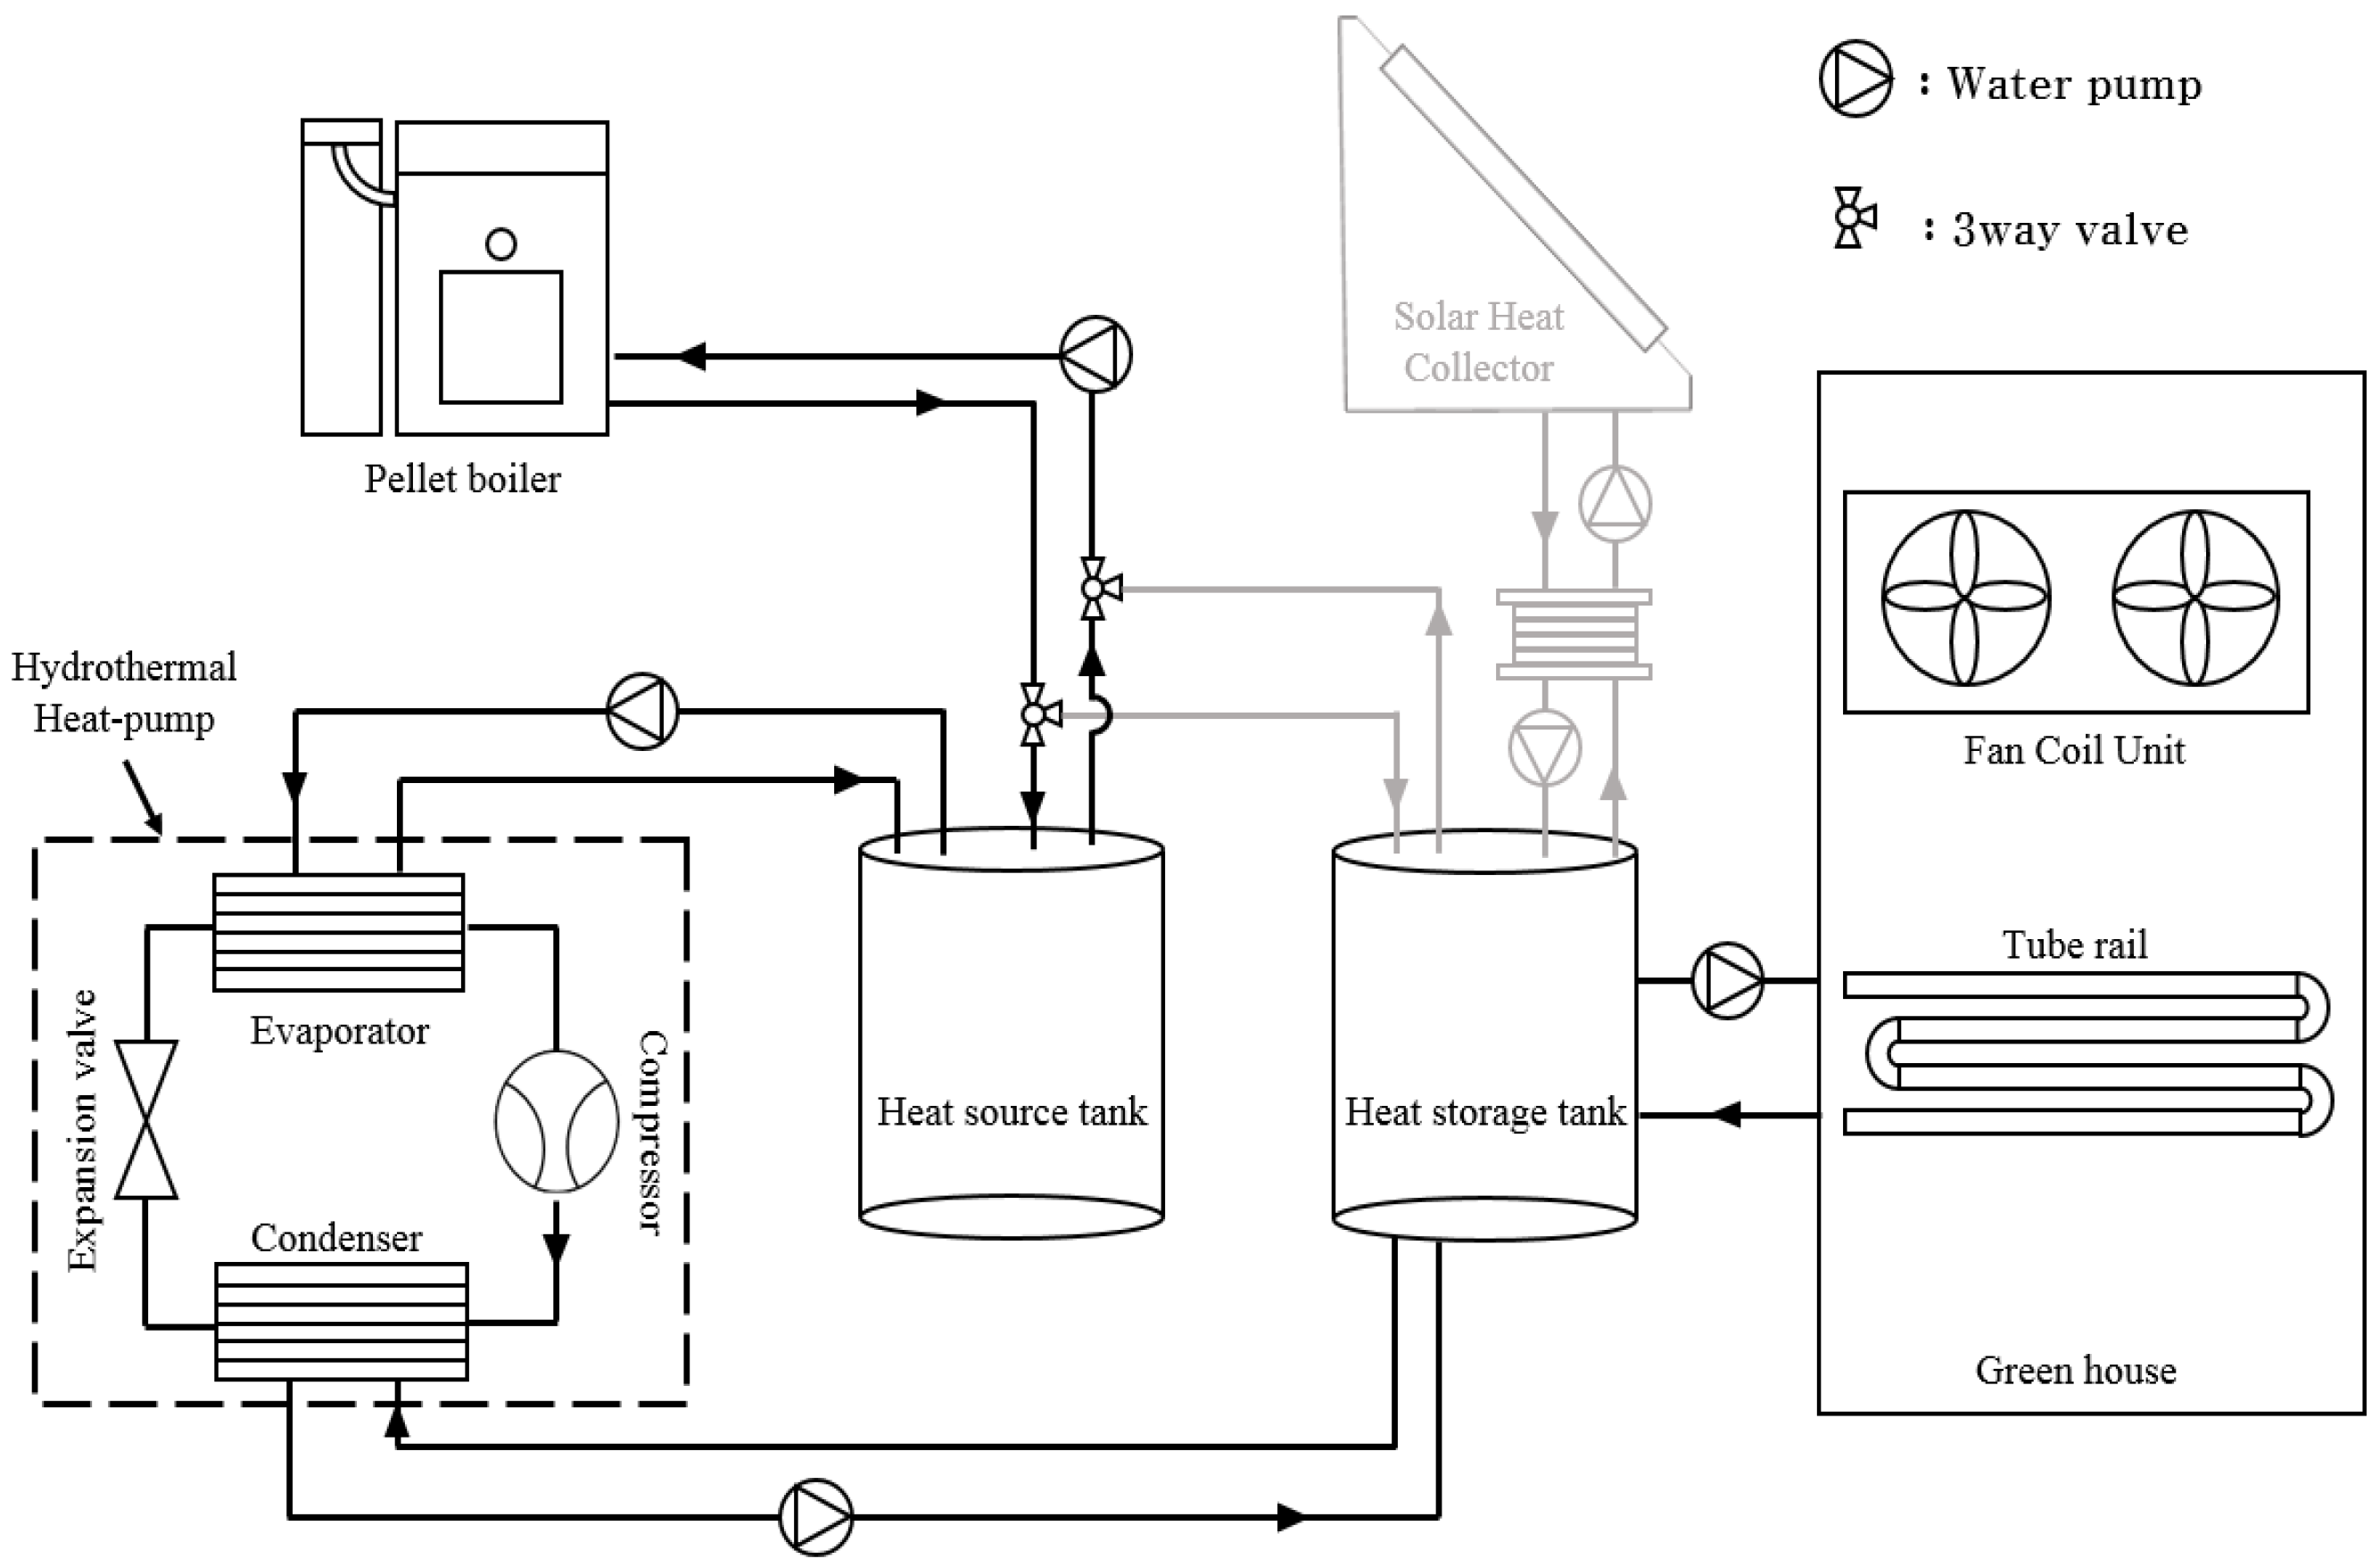
The thermal energy supply systems tested in the greenhouse included a 20,000 kcal/h-class pellet boiler (KN-23D, Kyuwon Tech, Gyeongsan, Korea), a 3RT-class hydrothermal heat pump (3RT, Inergy Technologies, Gwangsan-gu, Korea), and a 4.04 m2 solar heat collecting plate with a heat collection capacity of 2230 kcal/m
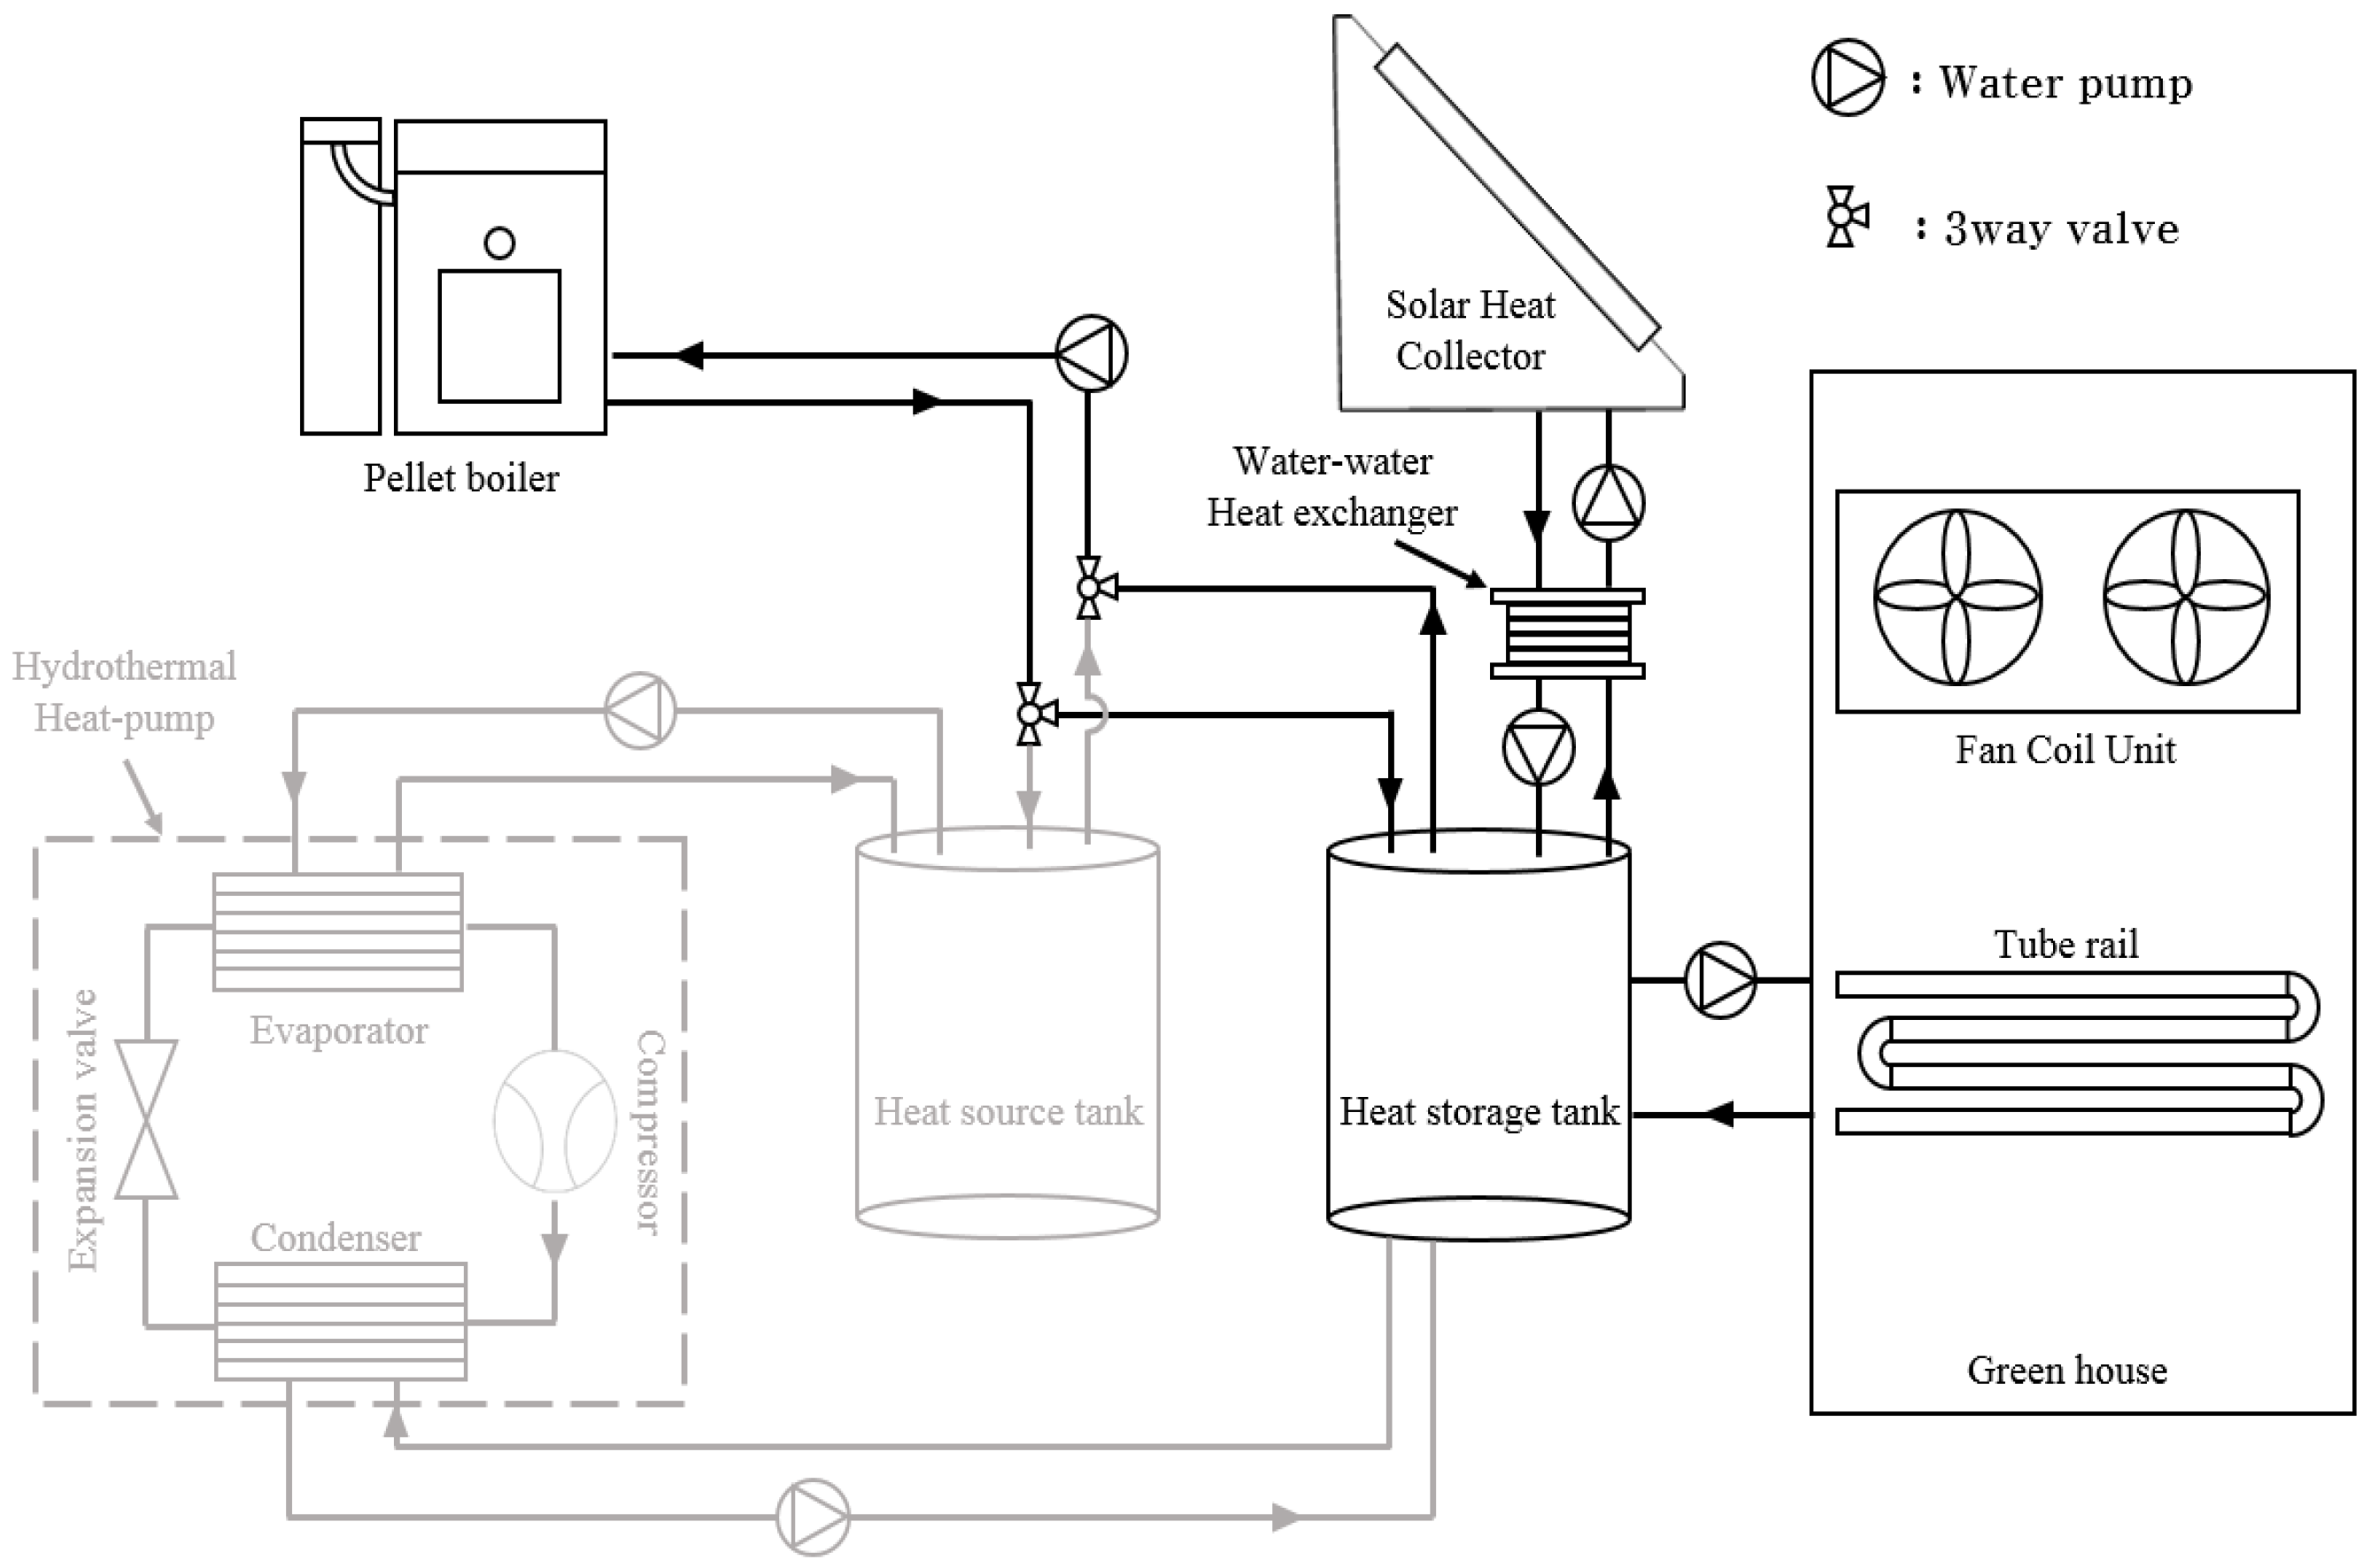
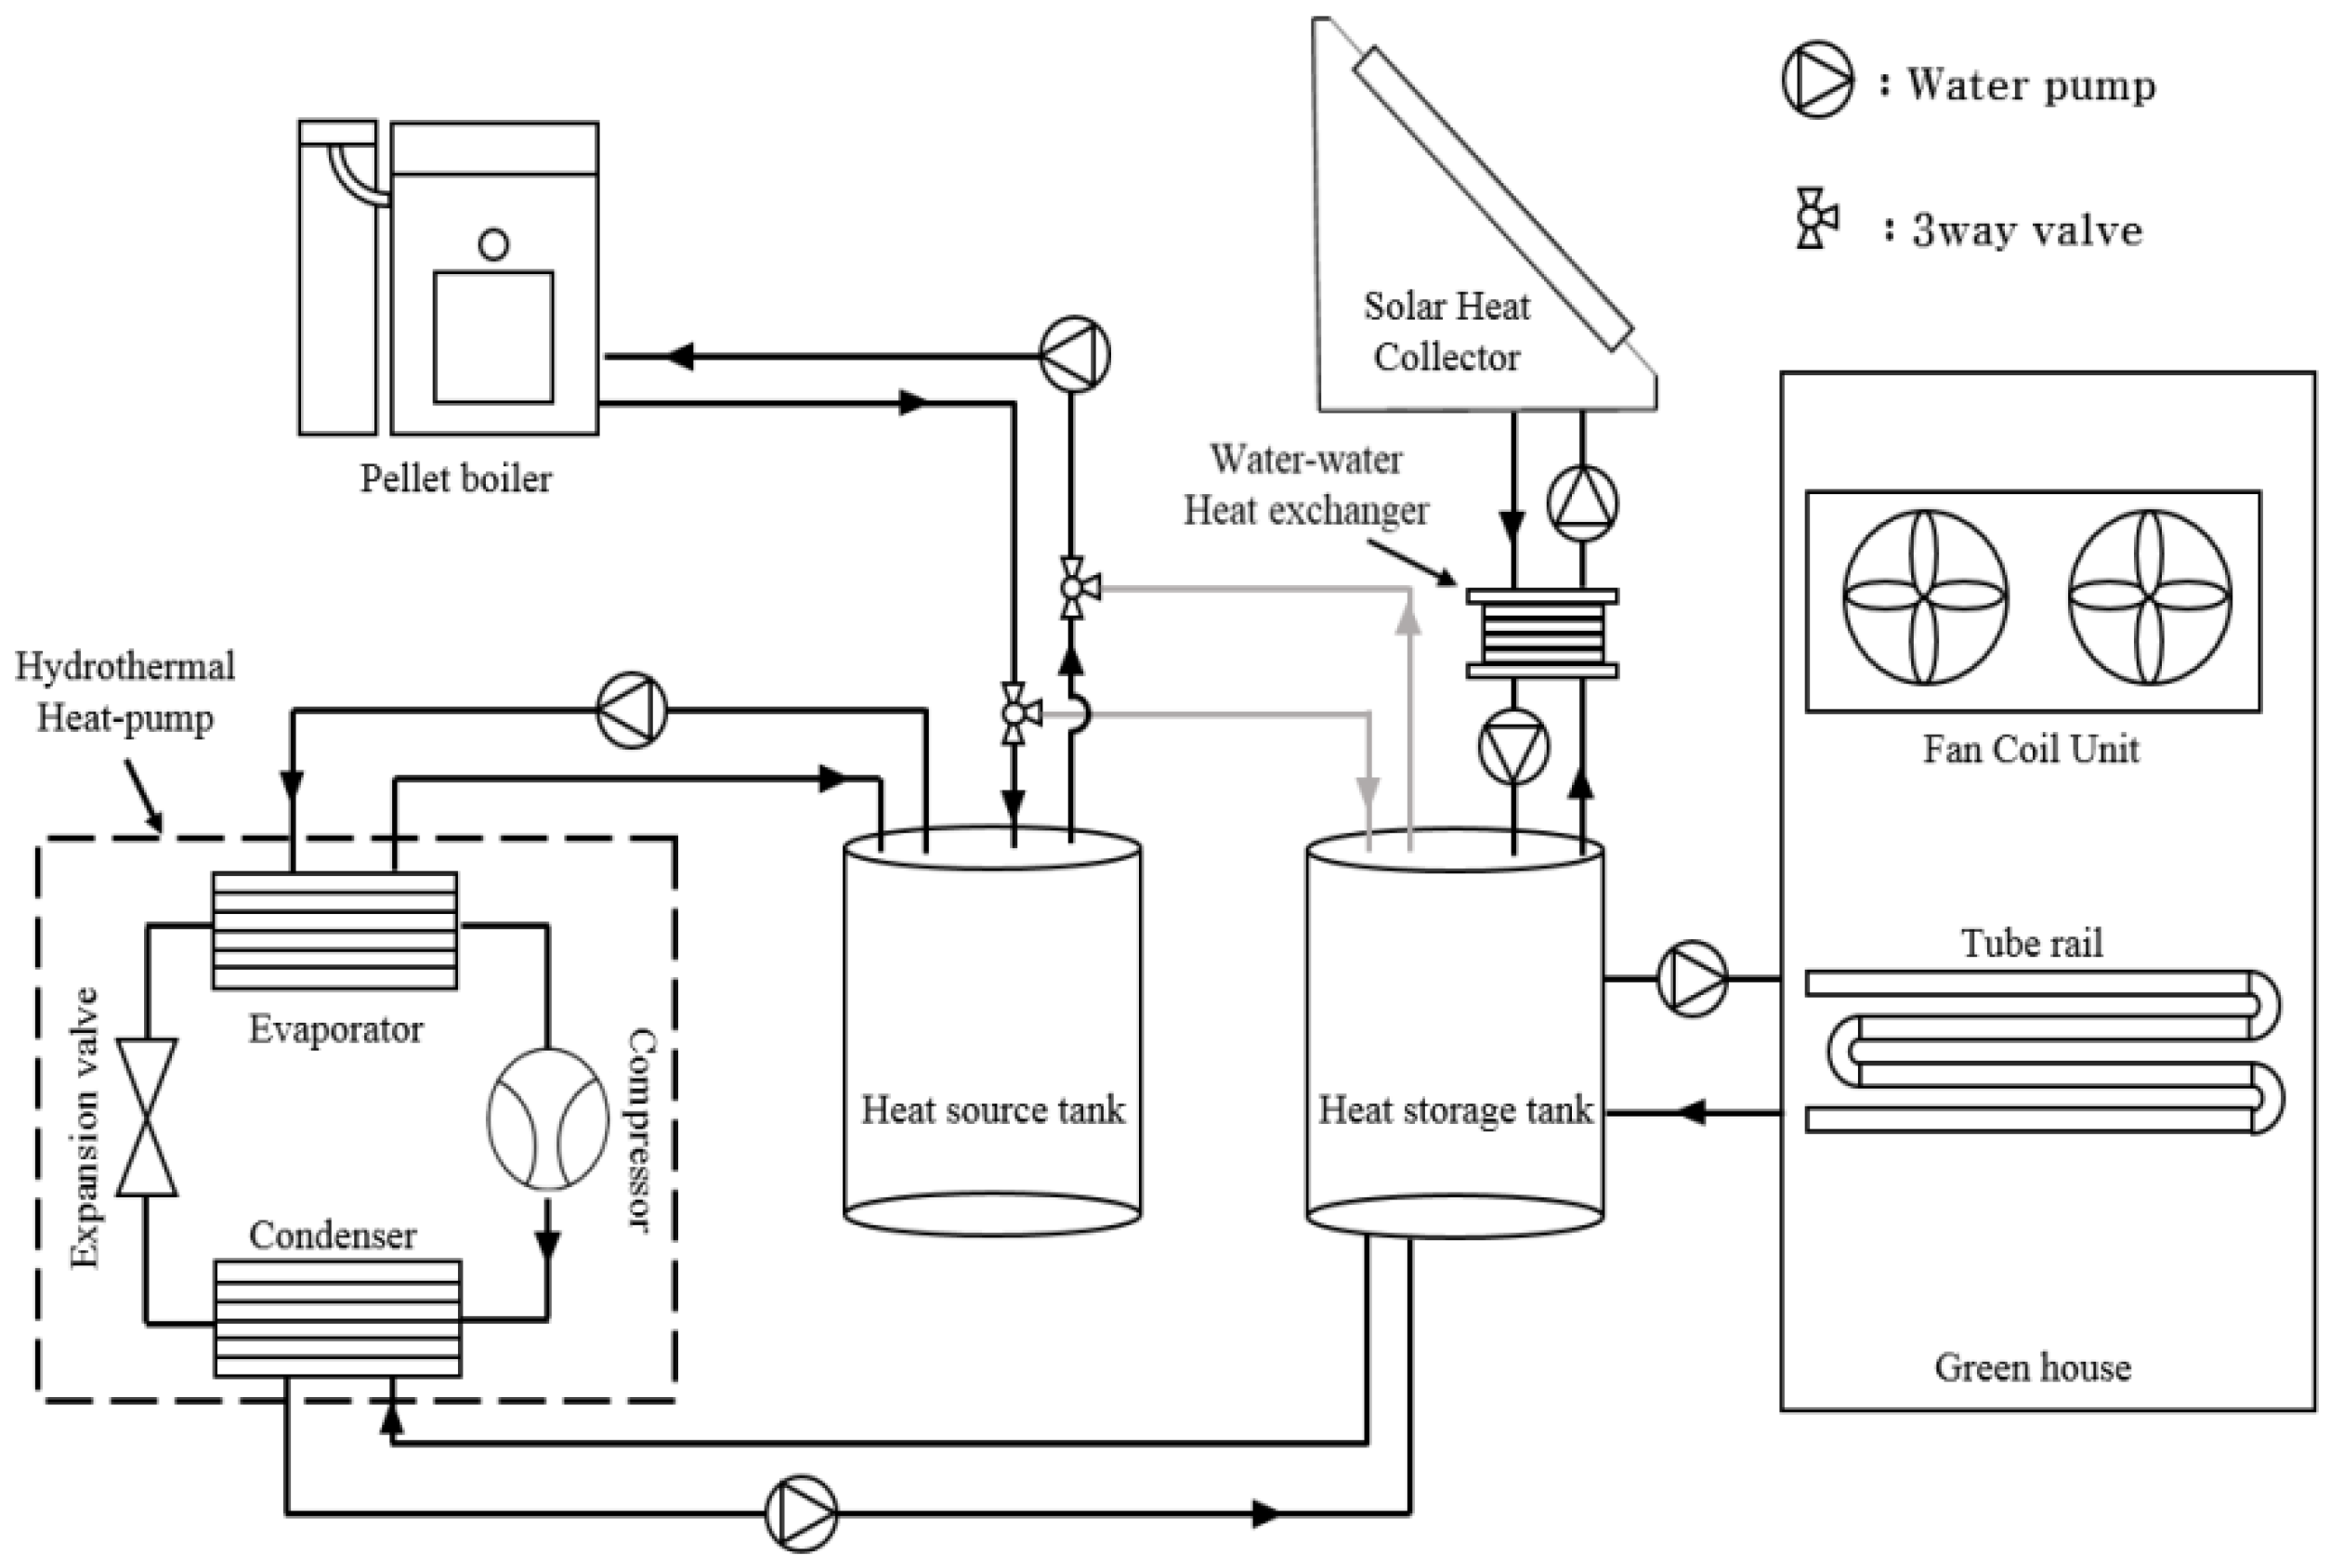
2·day. Three hybrid systems were designed using these systems. The thermal energy supply device comprised a fan coil unit and a tube rail. Hybrid system 1 consisted of a hydrothermal heat pump system with a pellet boiler as the heat source. In hybrid system 2, a pellet boiler was used as the main heat source, and a solar collector was used as an auxiliary heat source for the heat storage tank. Hybrid system 3 consisted of a heat pump system that included all the heating systems, with a pellet boiler and a solar panel as the main heat source and the auxiliary heat source, respectively. The combined heating system is as shown in Figure 2.

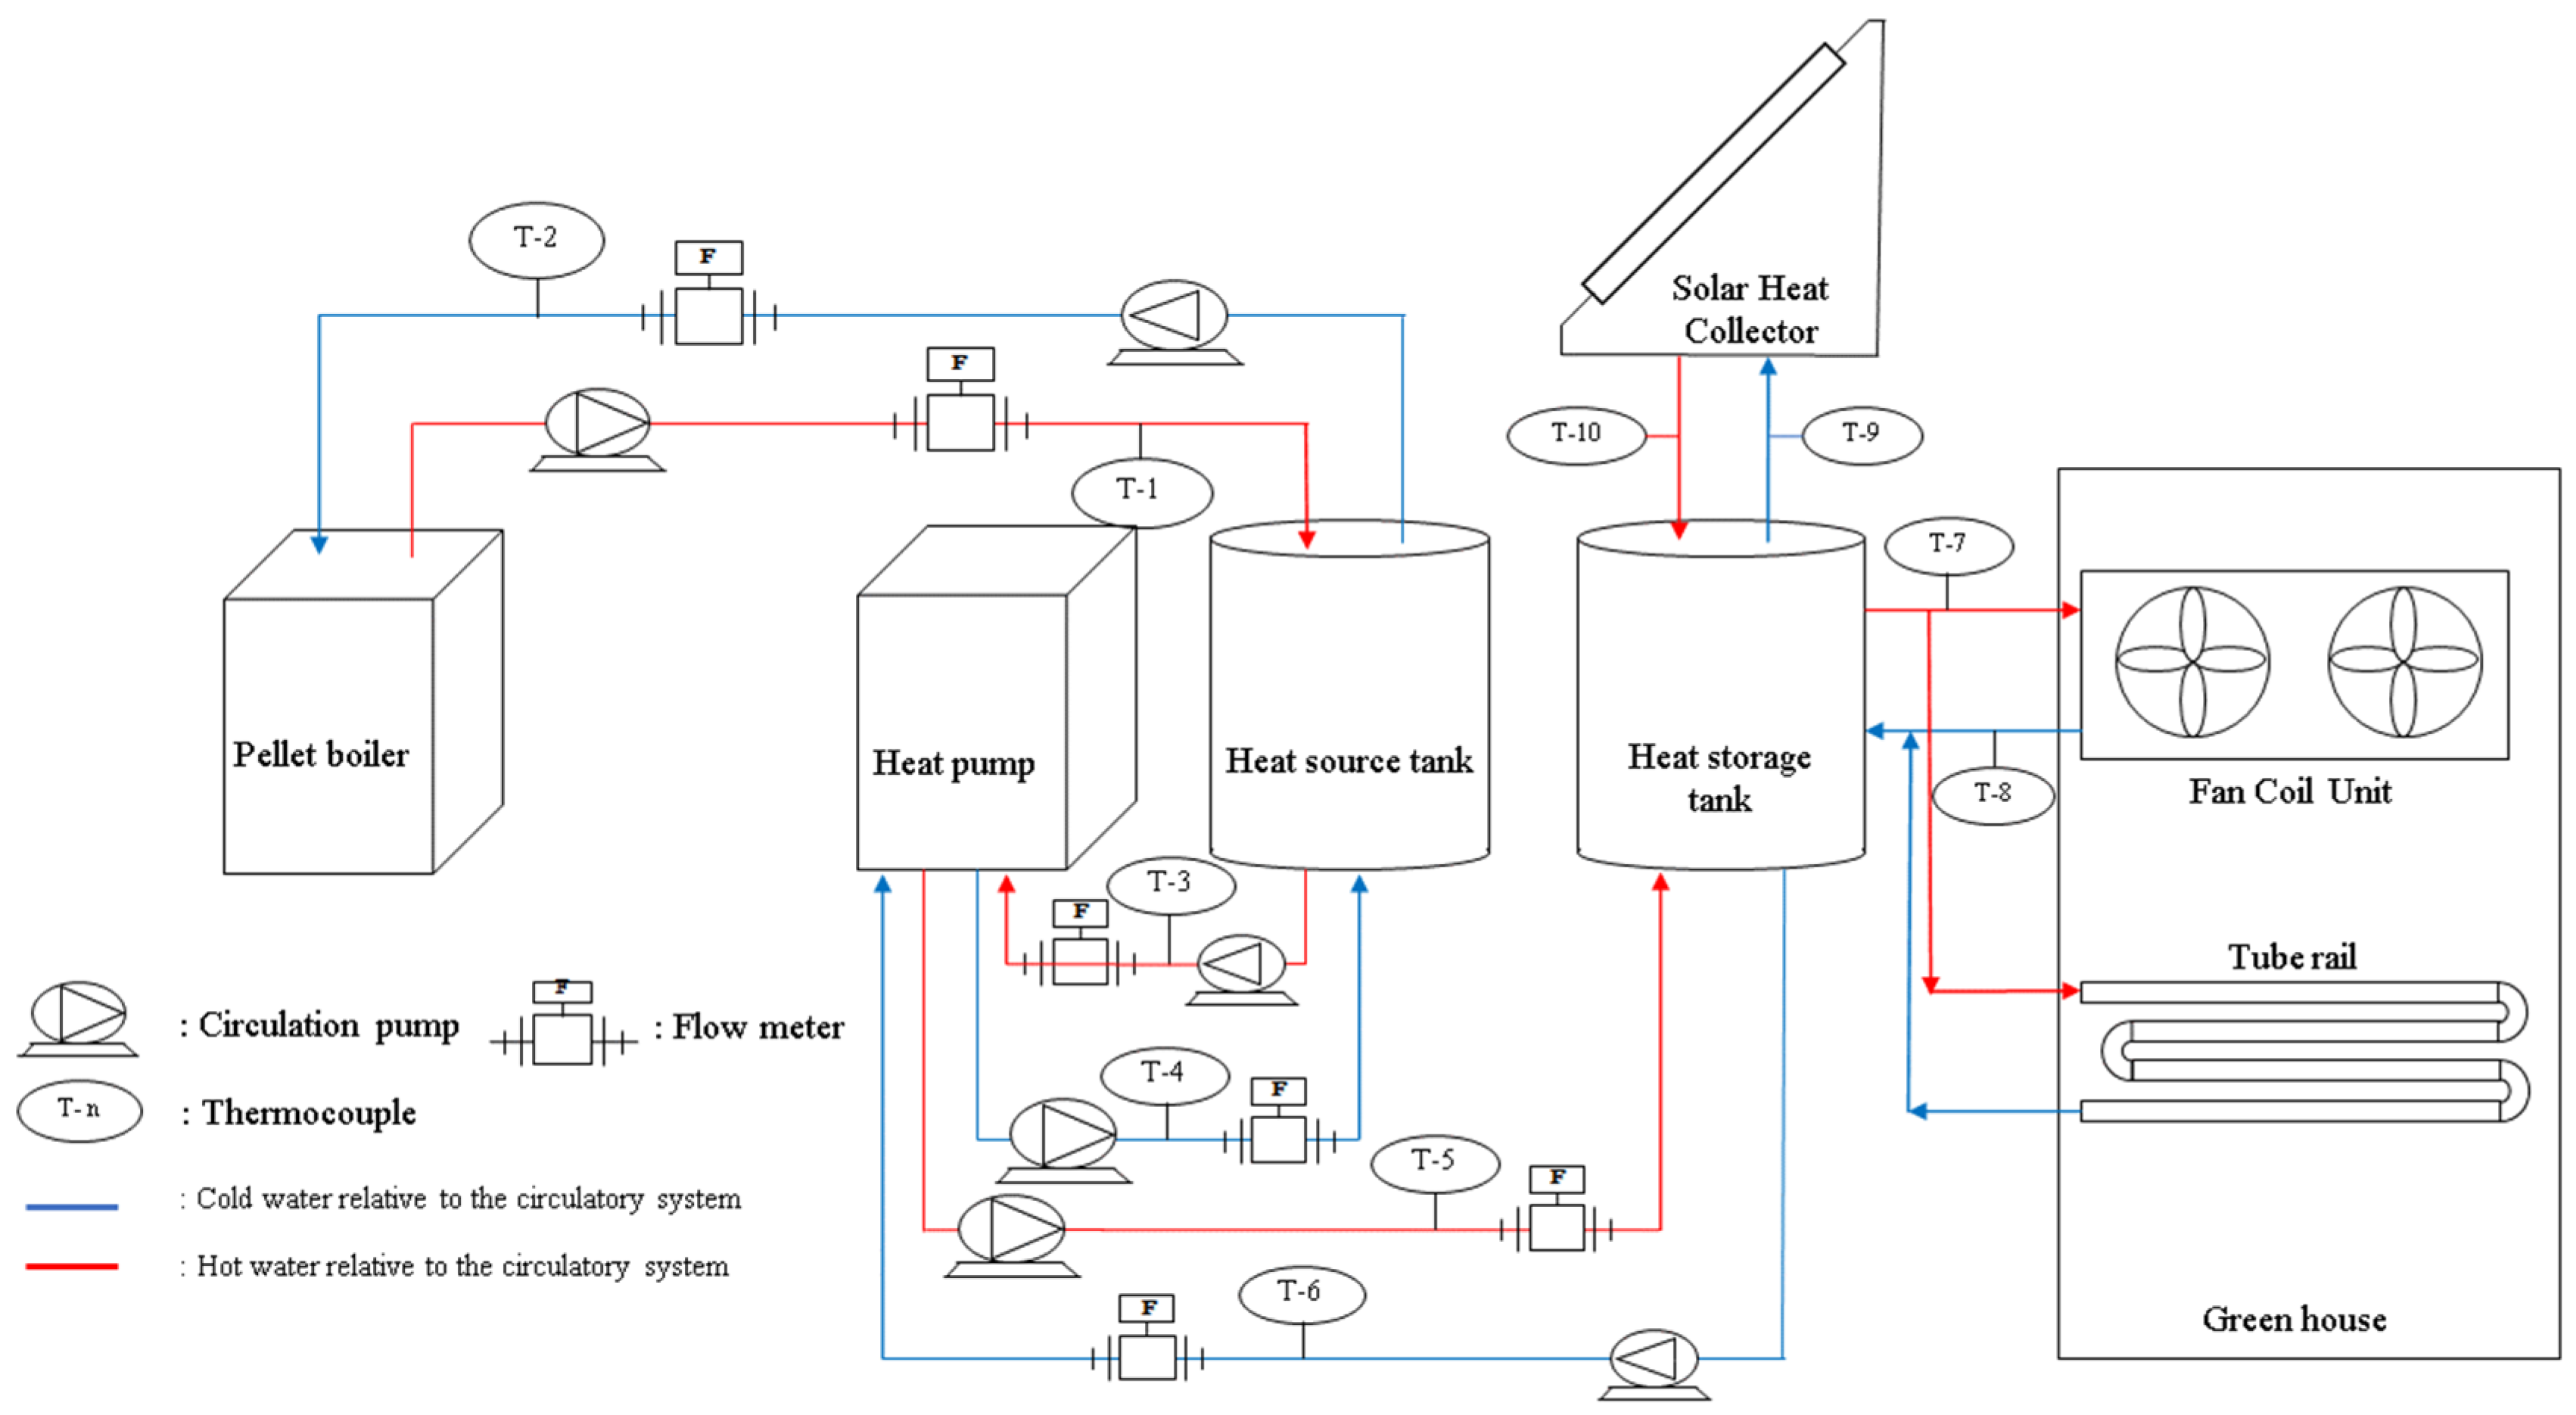
2.3. Data Measurement

In this study, a thermocouple (GTPK-02-17, GILTRON, Seoul, Korea), sensor-type flowmeter (VVX25, SIKA Dr. Siebert & Kore GmbH & Co., Kaufungen, Germany), and turbine-type flowmeter (VTH40, SIKA Dr. Siebert & KGmb GmbH & Co., Baden-Wüttemberg, Germany) were used for data collection. The data were recorded using a data logger (GL840, GRAPHTEC Co., Tokyo, Japan), and the heat energy transfer amount was calculated by measuring the temperature and flow rate in each closed-loop system. A load-cell scale (HPS-300A, CAS Co., Seoul, Korea), an integrated watt-hour meter (LD3410DRM-080, LS ELECTRIC Co., Seoul, Korea), and a solar radiation meter (Li-200R LI-COR, Inc., Lincoln, NE, USA) were used to determine the amount of input energy. For the pellet boiler, hydrothermal heat pump, and solar heating system, the input energy was the consumption of the pellets as fuel, power consumption by the compressor, and the amount of collected solar heat, respectively. The amount of input energy was measured before heating started at 17:00, which was the standard time when the experiments commenced each day. In the experimental groups involving solar heat, the input energy was measured every day from 15:00 to noon the next day, excluding three hours (12:00–15:00) for solar heat storage. To calculate the coefficient of performance (COP) of the heat pump, the amount of instantaneous power was measured using a power analyzer (DW-6092, LUTRON ELECTRONIC ENTERPRISE C, Taipei, Taiwan).

2.4. Auto Control System

The automatic control system used in this study was the Farmos program (JINONG Co., Ltd., An-yang, Korea). This automatic control system allows communication between mobile devices and PCs, making it possible to check the operation status of various actuators, including the main heating pump, and to set manual and automatic operations. The control logic was configured such that the main heating pump and heat source supply pump could detect the temperature of the heat storage tank and the heat source tank, and accordingly set the lower and upper temperature ranges required to attain the required temperature range.

2.5. Overview of Experiments

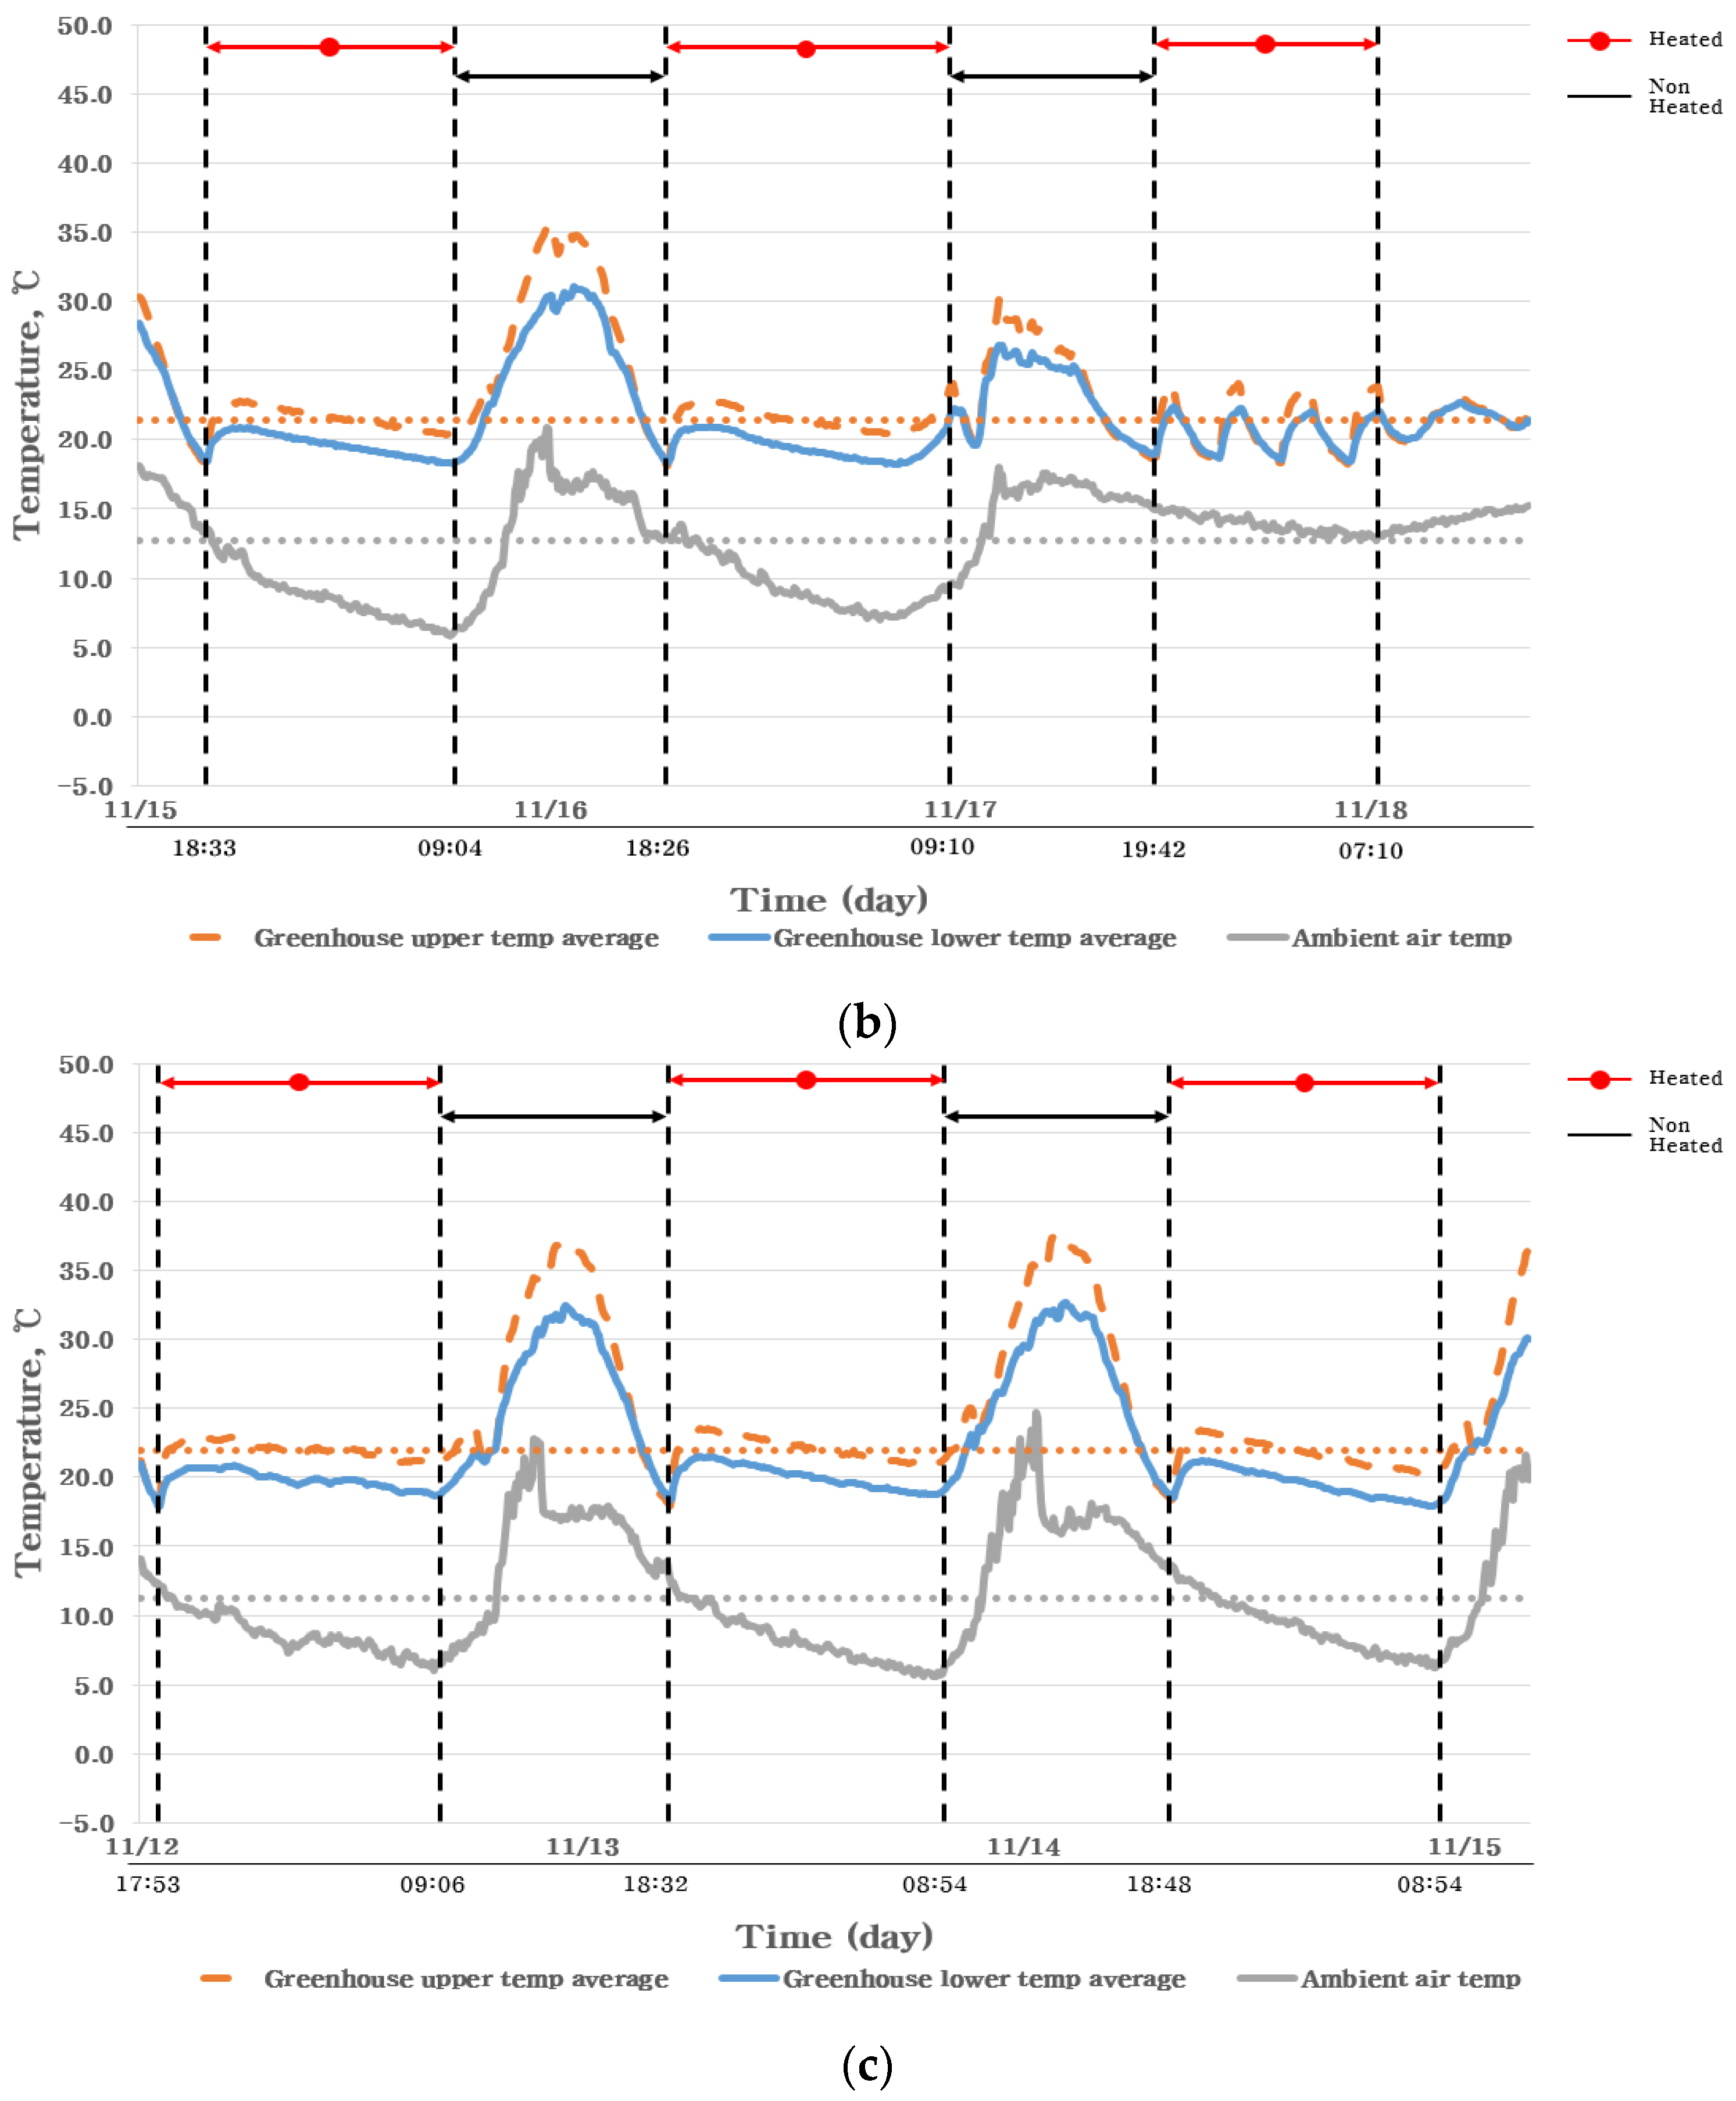
Experiments using hybrid system 1 were conducted from 2 to 4 March 2020, and experiments using hybrid systems 2 and 3 were conducted from 12 to 17 November 2020. The heating water temperature was 55 °C, which is the maximum discharge temperature of the heat pump that was used in the experiment. In hybrid systems 1 and 3, the heat source temperature was set to 20–25 °C. The reference heating temperature of the greenhouse was based on melon, which requires a nighttime growth temperature of 18–22 °C and is considered a high-temperature crop compared with other crops that are grown in Korea. Further, all the experiments were conducted via automatic control based on the control logic of the designed test method and were based on the on/off control of the thermal energy supply device.

2.6. Experimental Methods

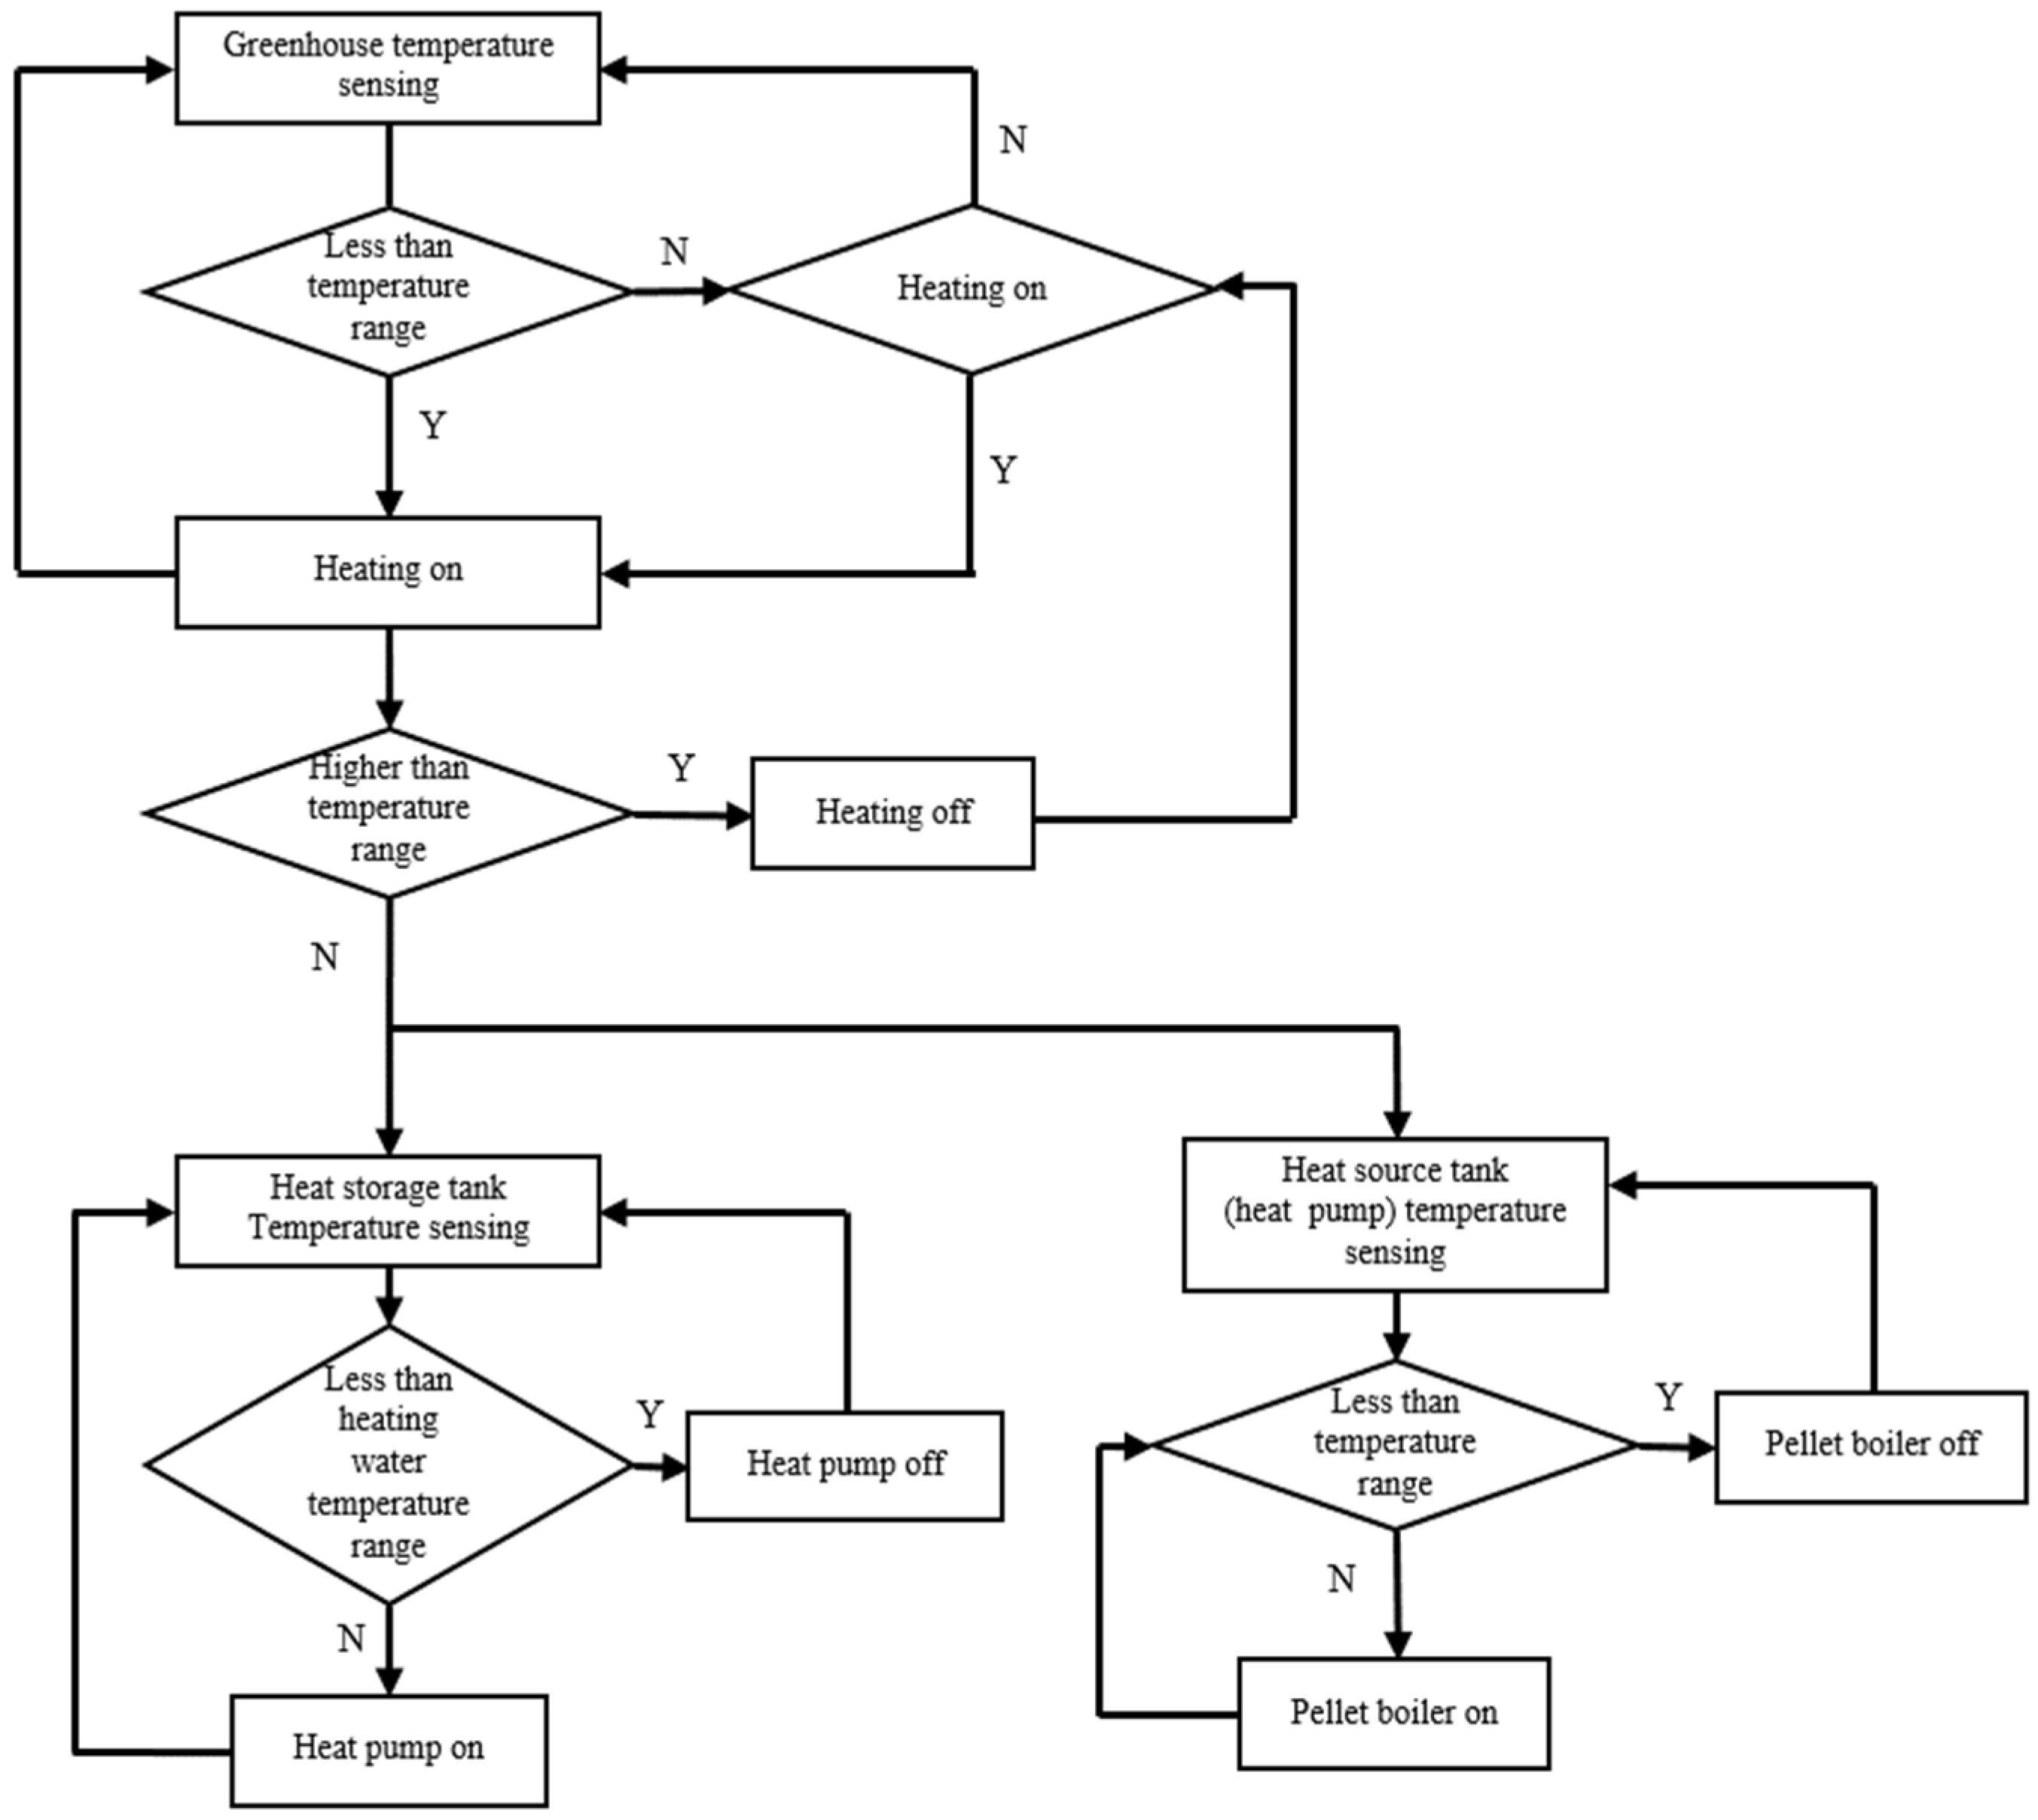
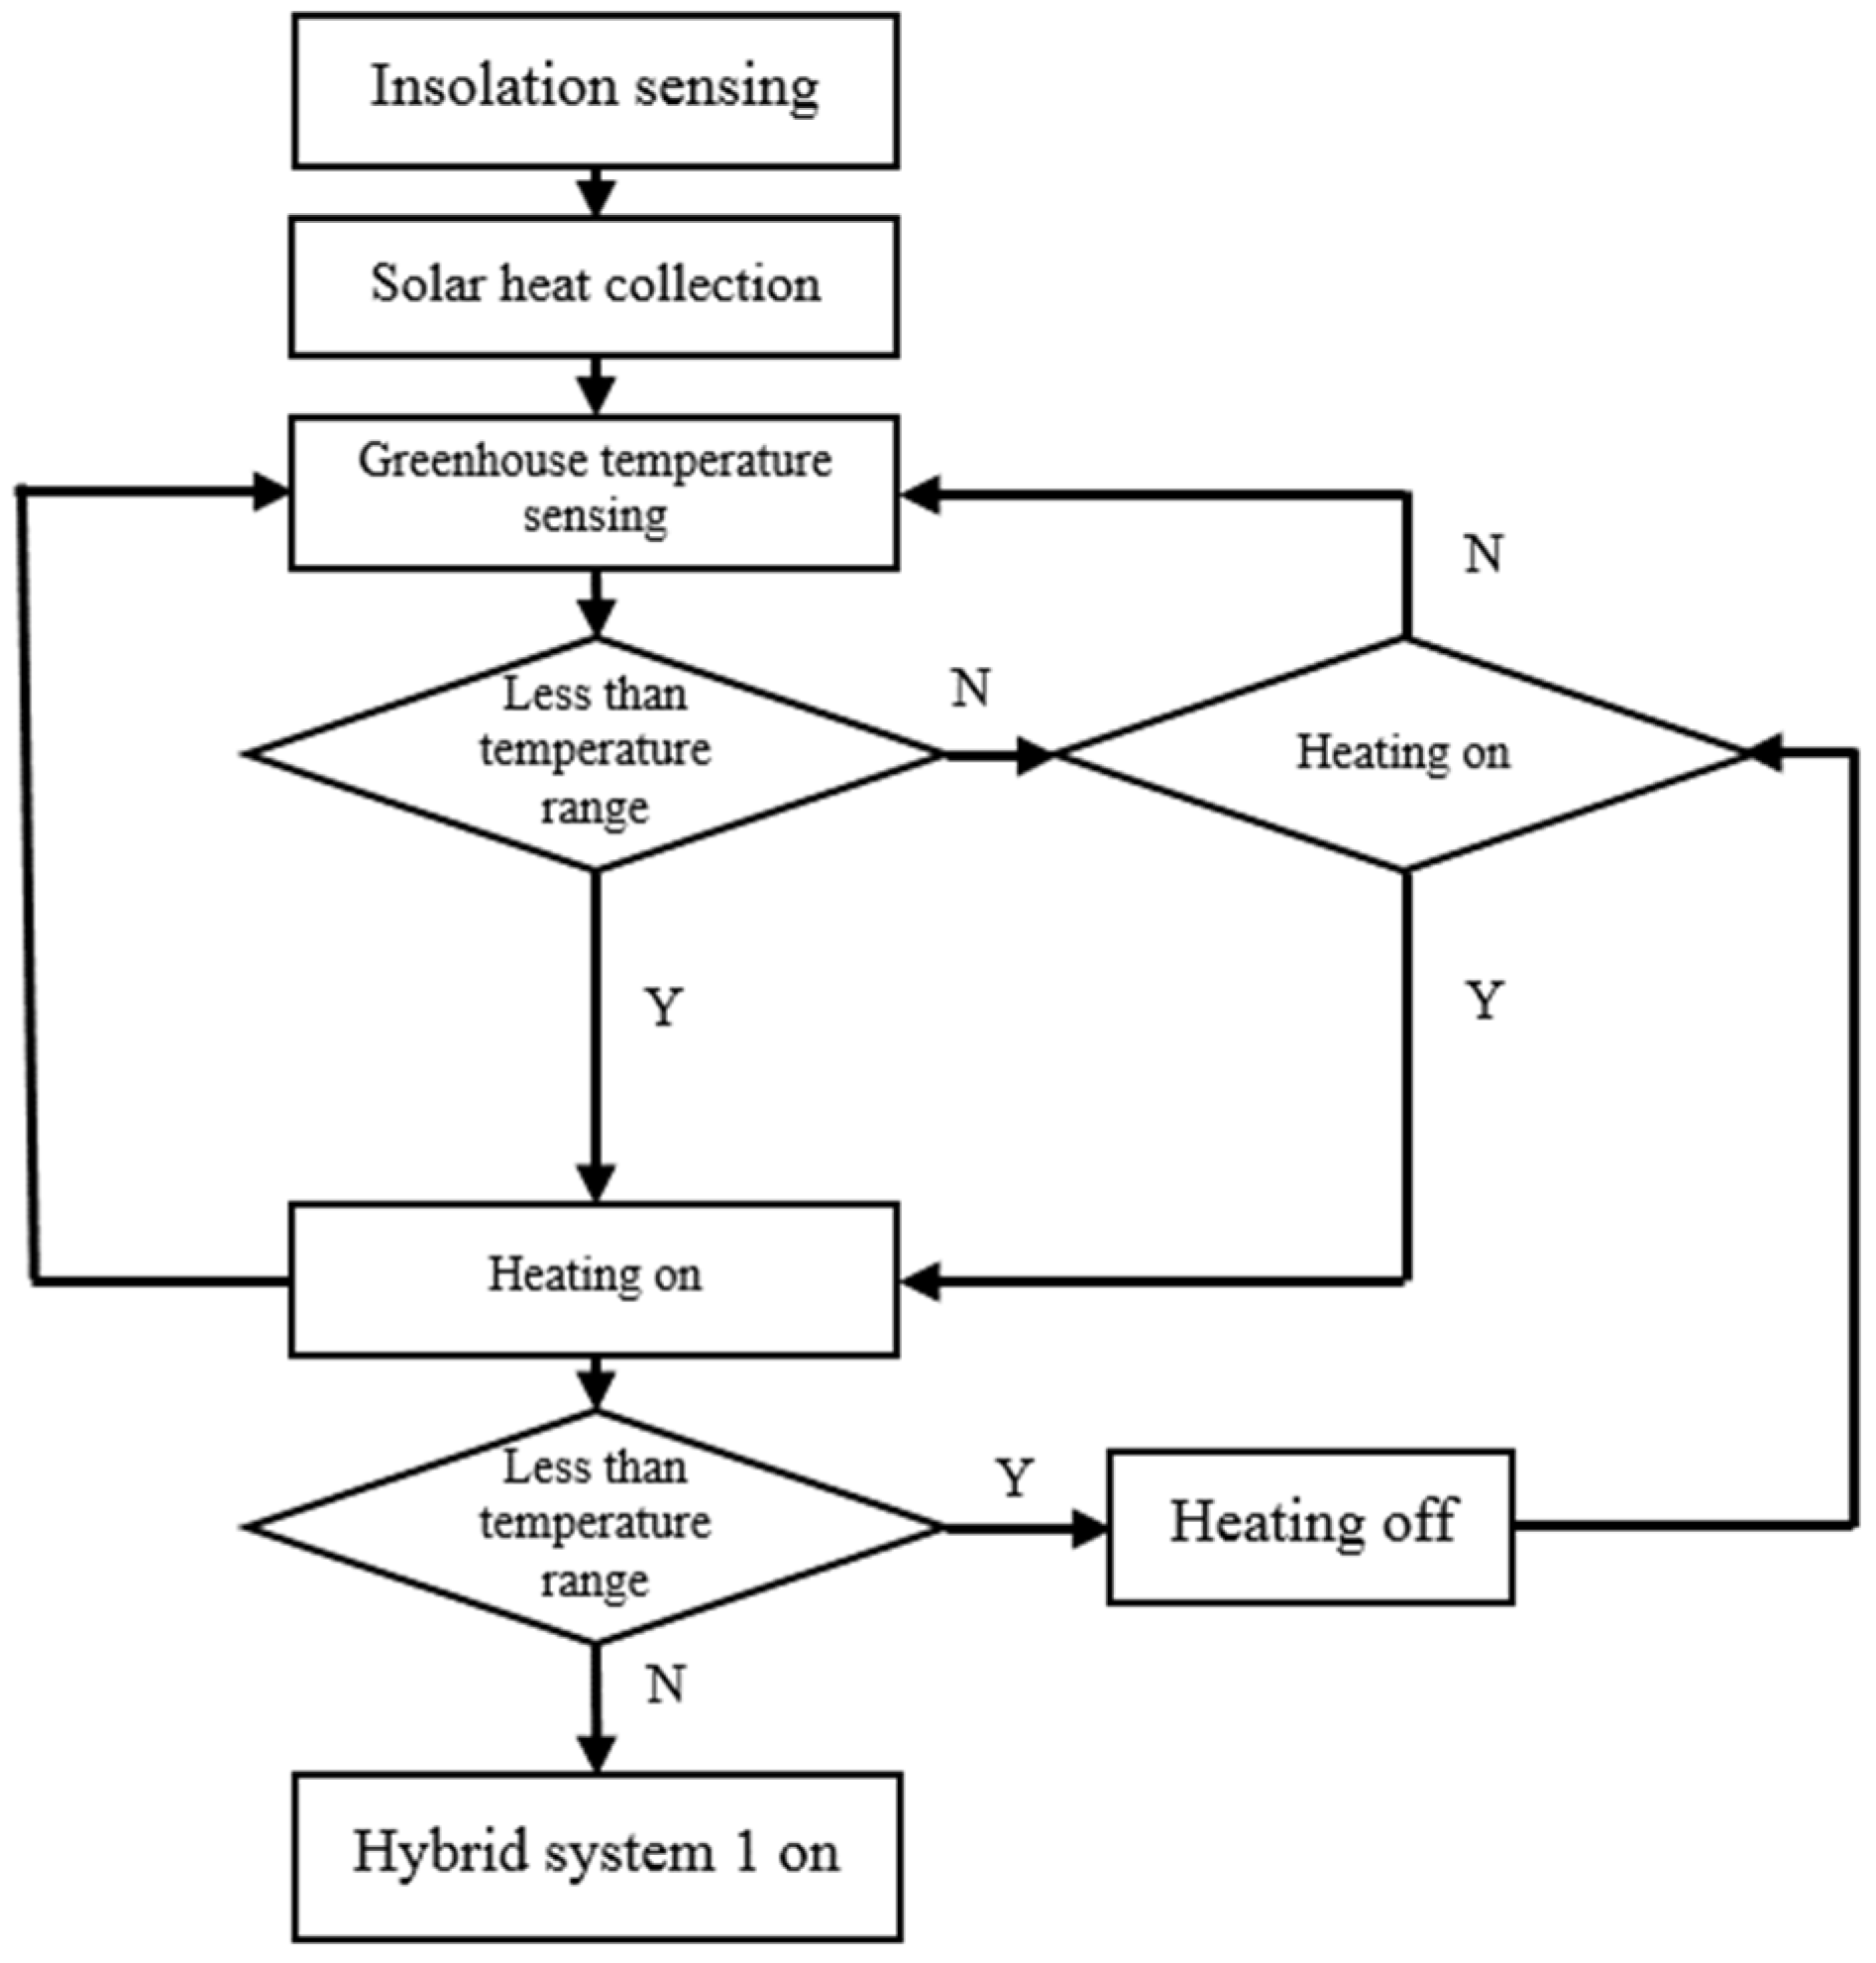
2.6.1. Hybrid System 1

The overview and control logic corresponding to hybrid system 1 are shown in Figure 3 and Figure 4, respectively. Specifically, the operation of hybrid system 1, which enabled the detection of the temperature of the heat source tank, heat storage tank, and greenhouse, began after the set temperatures of the heat source tank and the heat storage tank were achieved and maintained before 17:00. The detected room temperature was used as input for the control logic, which determines the presence or absence of heating. To heat the greenhouse, energy was released from the heat storage tank; hence, its temperature decreased. The operation of the hydrothermal heat pump supplemented the heat from the heat storage tank based on the measured temperature of the heat storage tank. Once the temperature of the heat source tank reached the lower limit of the temperature range of the heat source, the pellet boiler was then utilized as a heat source and was operated by controlling it between the circulation pump and the heat source tank. Thus, the control logic was implemented during the realization of the experiment. Further, the daily experiments were concluded at the same time as that of the energy input check, which was performed at 17:00 the next day.

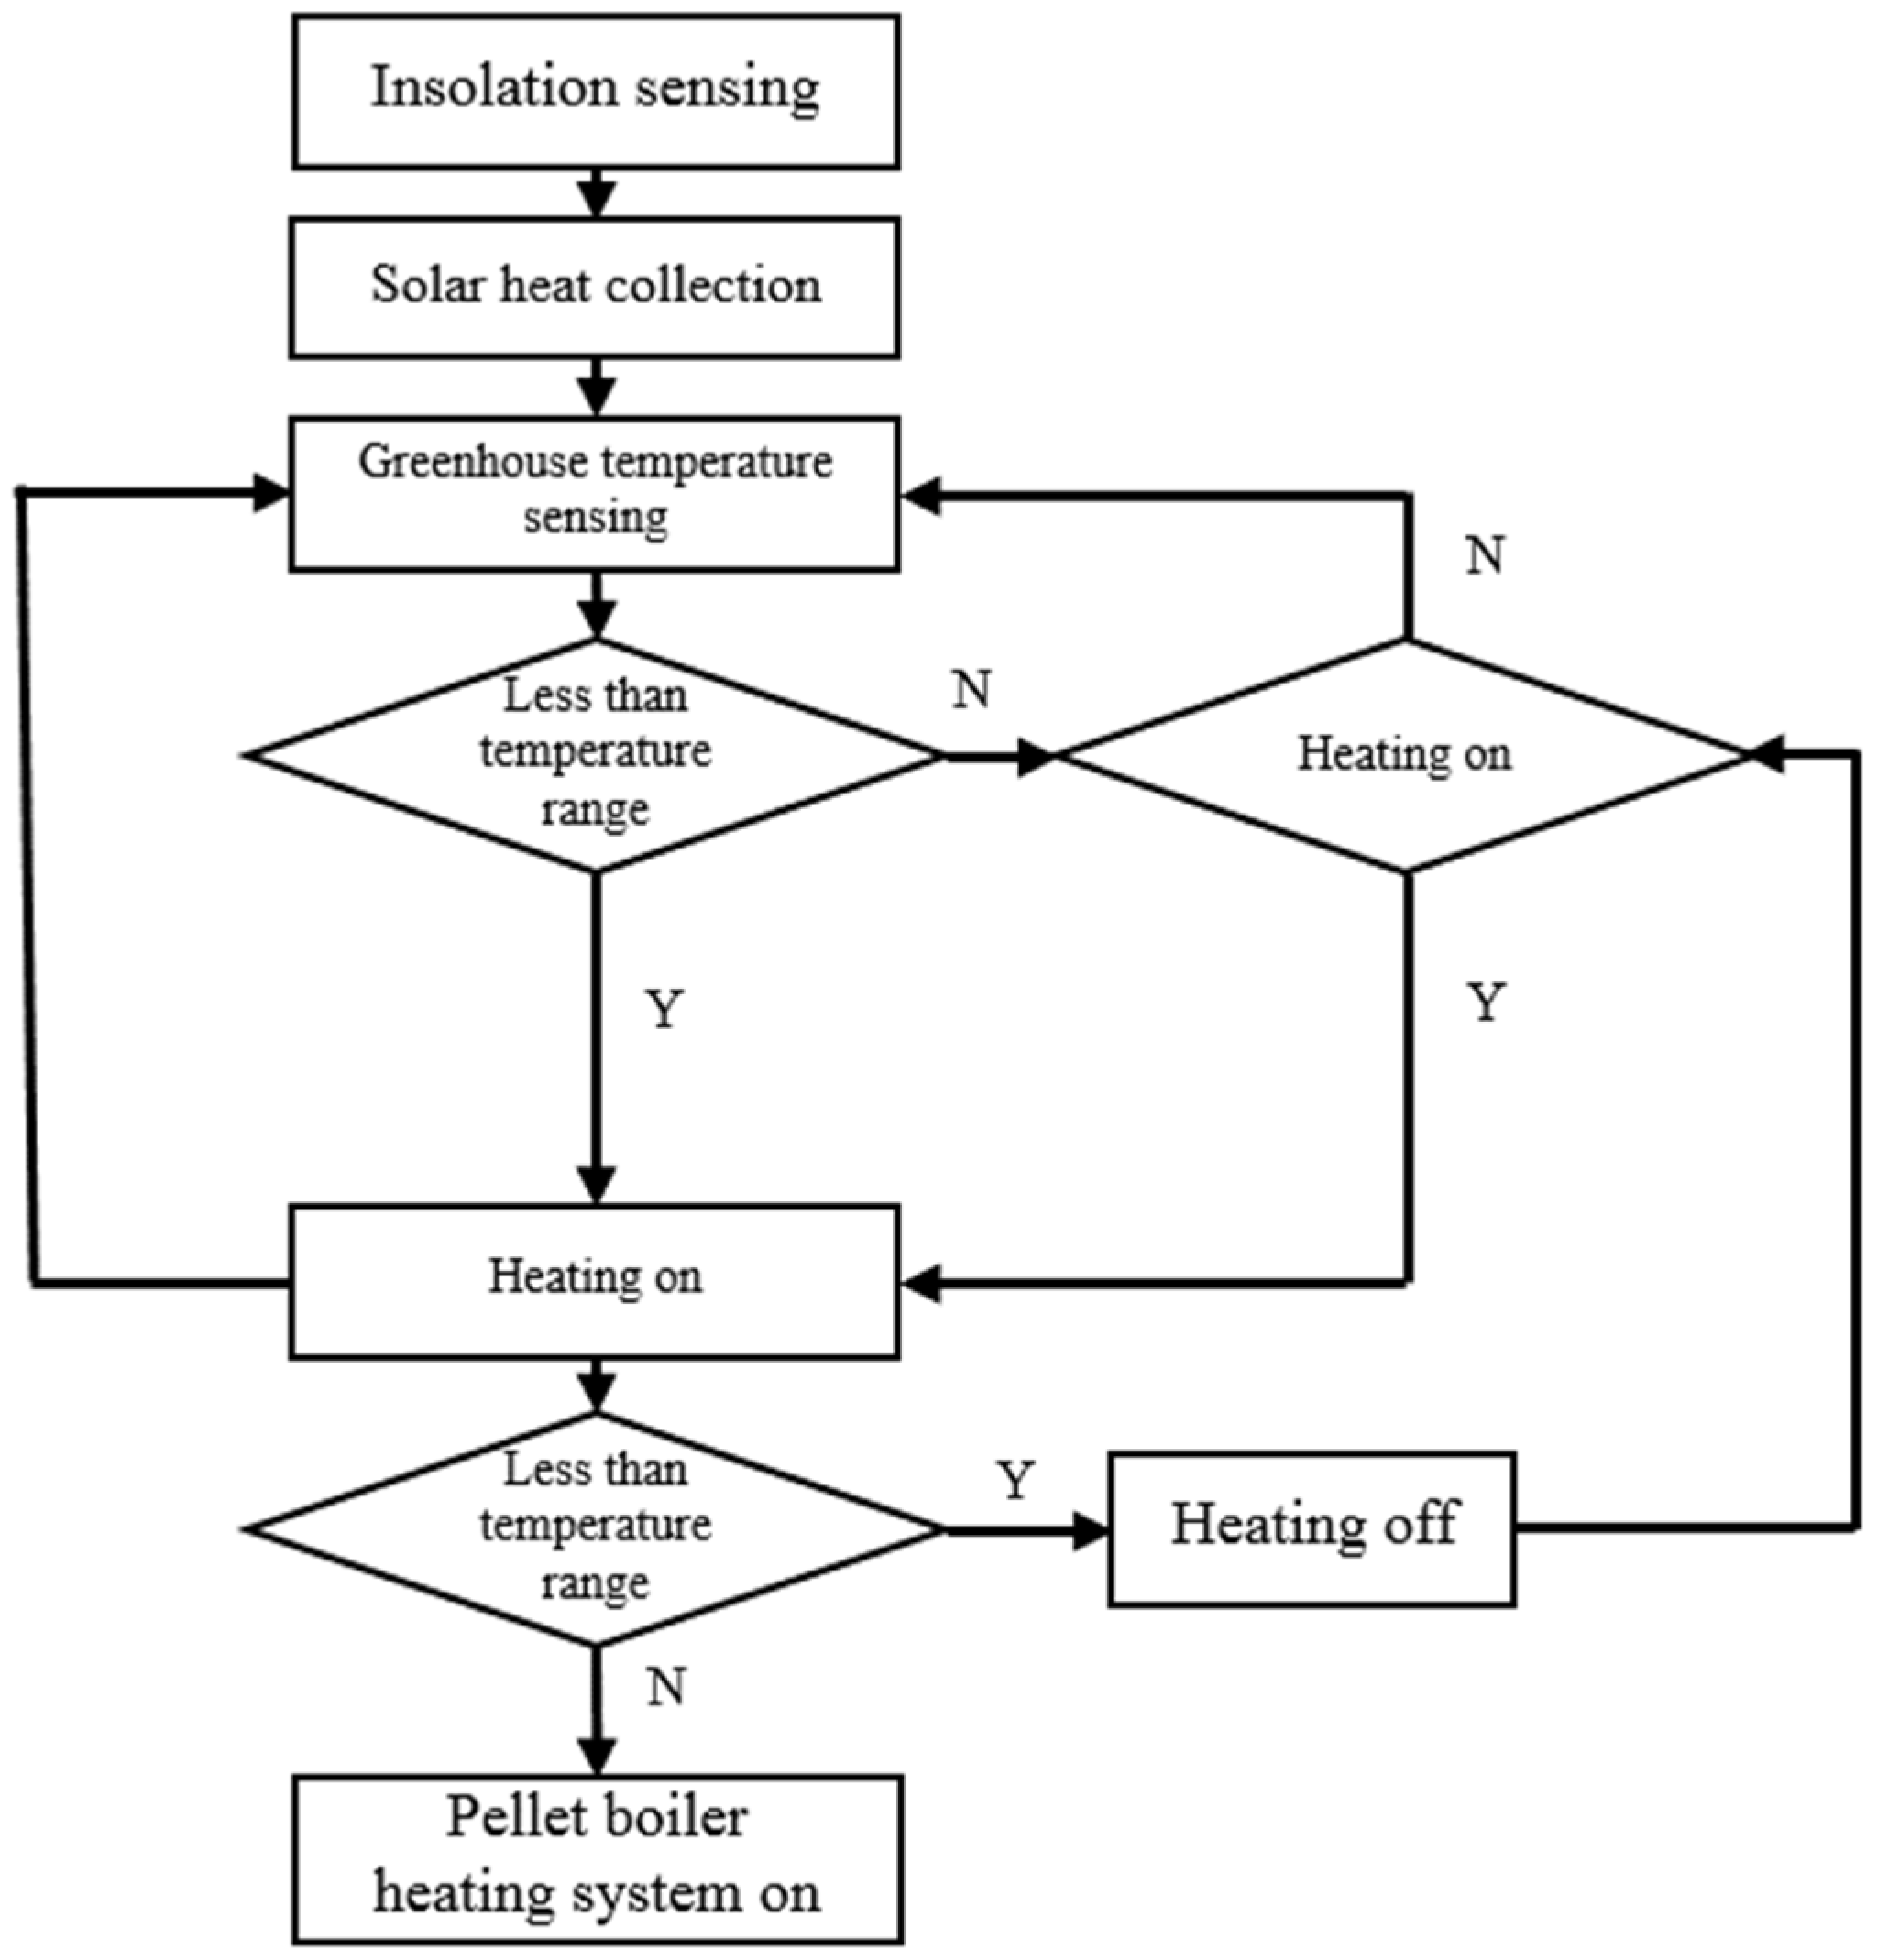
2.6.2. Hybrid System 2

The overview and control logic of hybrid system 2 are shown in Figure 5 and Figure 6, respectively. The experiment involving hybrid system 2 commenced at sunrise with the determination of the solar radiation. When the temperature of the circulating water inside the collector reached approximately 60–70 °C, the circulation pump between the heat exchanger and heat storage tank was operated to collect solar heat. This process continued until approximately 15:00. Further, the system continuously checked whether the heating temperature varied within the fixed range by measuring the temperature of the internal greenhouse. Heating was activated when the ambient temperature fell below the lower limit of the range. Continuous heating was performed up to the upper limit temperature of the set temperature range, and once it was determined that heating was not required, the system ceased heating activity. The collected solar heat served as an auxiliary heat source and supplemented the heat lost from the heat storage tank during the day. Additionally, the collected solar heat was used to increase the temperature of the heat storage tank to more than 55 °C, which represents the standard temperature for heating water, when the solar radiation intensity was high.

2.6.3. Hybrid System 3

The overview and control logic of hybrid system 3 are shown in Figure 7 and Figure 8, respectively. The operation of hybrid system 3 was based on the experimental method corresponding to hybrid system 1, with an additional solar thermal collection system. In this system, heat storage was initiated when more than a certain amount of solar radiation was detected after sunrise. Further, the heat storage process lasted from approximately 12:00 to 15:00, and once the temperature fell below the required value at 17:00, heating was initiated, with the stored solar heat utilized first. The subsequent methodology was similar to that corresponding to hybrid system 1.

2.7. Analysis

2.7.1. Thermal Energy Calculation

Heat transfer was calculated to obtain the thermal efficiency of the different hybrid systems. The amount of heat transferred was calculated using the temperature difference ( T ), flow rate ( ), and specific heat capacity of water ( C p ) obtained from each closed-loop system. The calculation was performed according to Equation (1).
Q = T × × C p × 3600 ,
where Q represents the total caloric energy ( kcal / h ), T   represents the temperature difference in in/out water ( ° C ), represents mass flow ( kg / s ), and C p represents the specific heat capacity of water ( kcal / kg · ° C ).

2.7.2. Determination of the Coefficient of Performance of the Heat Pump

The unit coefficient of performance (COP) was calculated by dividing the amount of heat transferred (kcal/h) from the heat pump to the heat storage tank ( Q h s t , Q heat   storage   tank ) because of compressor power consumption ( P c p c , P compressor   power   consumption ). The calculation was conducted by converting the amount of heat transferred into kilowatts-per-hour or converting the power consumption of the compressor into kilocalories-per-hour.
COP = Q h s t P c p c

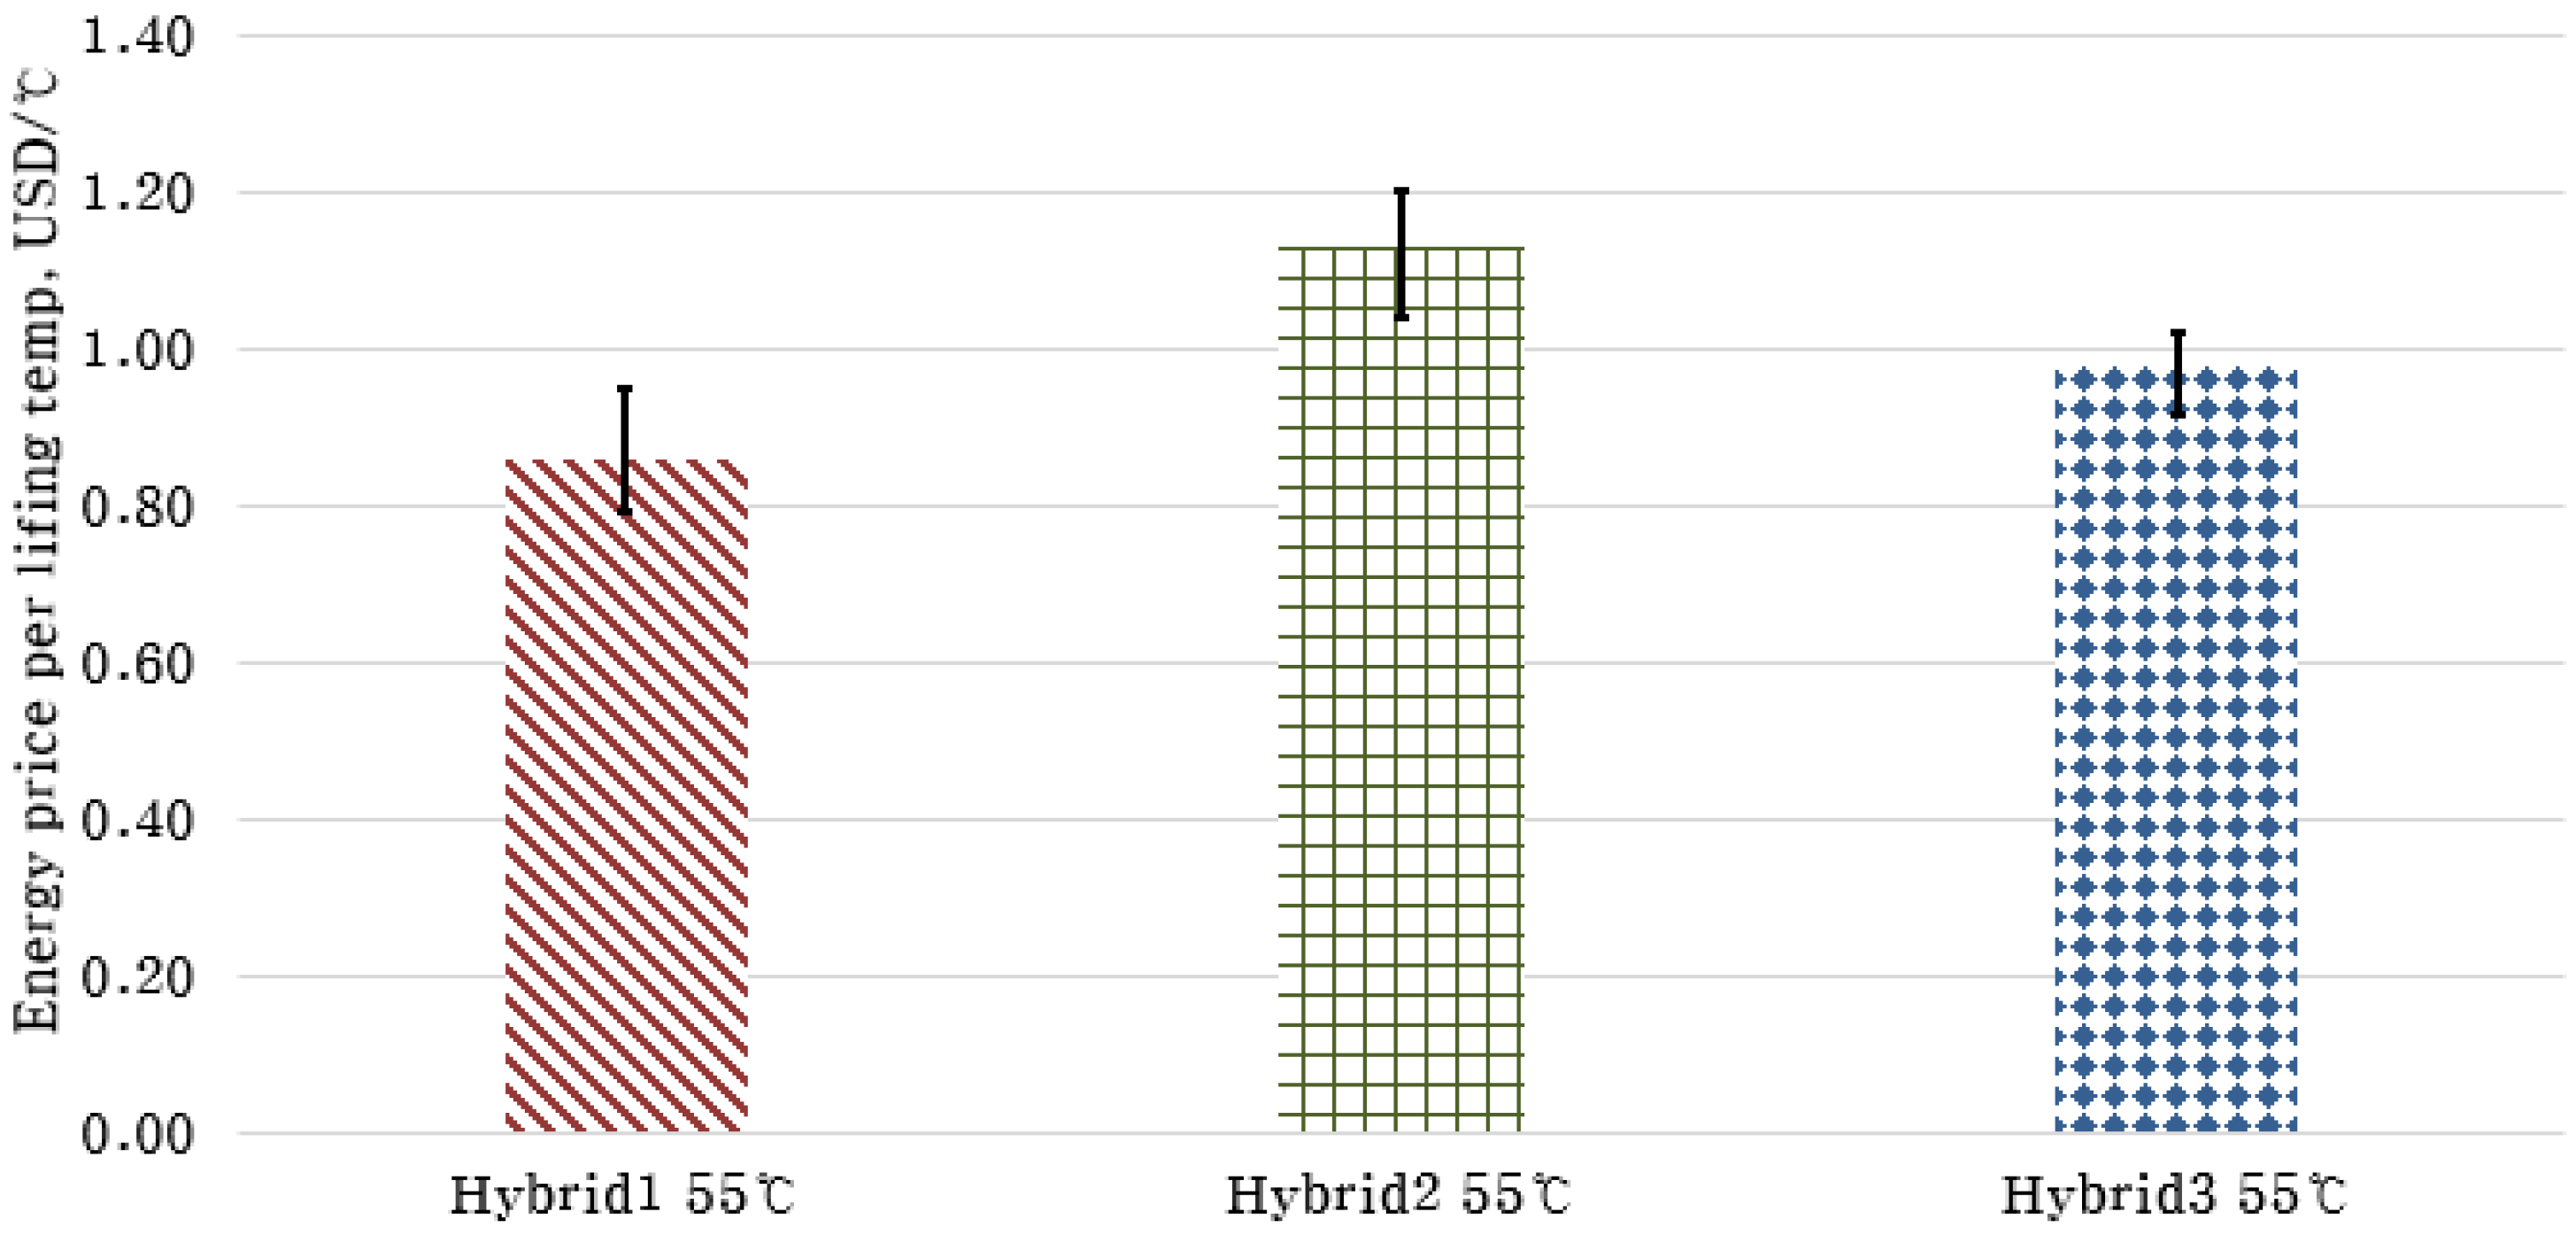
2.7.3. Energy Consumption and Cost Analysis

Energy consumption and energy cost are essential factors for the comparative analysis of the developed hybrid systems. Energy consumption was also used to calculate the efficiency of the combined thermal systems. The energy consumption of the individual systems was determined as pellet consumption, power consumption, and solar heat collection. Specifically, pellet consumption was calculated by multiplying the daily consumption amount (kg), which was obtained using a scale (HPS-300A, CAS Co., Ltd., Yang Ju, Korea), by the low-level heating amount (kcal/kg) of the pellet. Power consumption (kcal/h) was calculated by multiplying the amount of electricity measured using a watt-hour meter with a unit conversion factor, and solar heat collection was calculated by multiplying the solar heat collector efficiency by the solar radiation measured using an insolation meter (Equation (3)).
E t o t a l   =   ( Pellet   consumption   ×   LHV )   +   ( Power   consumption   ×   UCF )   +   ( insolation × η ) ,
where E t o t a l represents total energy consumption (kcal), LHV represents the lower heating value (kcal/kg), UCF is the unit conversion factor (power to calories), and η represents solar collector efficiency.
The energy consumption cost was calculated based on pellet and power consumption. The standard price per unit energy was based on the wood pellet unit price (0.31 USD/kg) as announced by the Korea Forest Service in June 2019 and the Korea Electric Power Corporation (KEPCO) electricity bill calculation table (0.042 USD/kWh). The energy consumption cost, based on energy consumption and energy cost, was calculated according to Equation (4).
E P t o t a l = ( Pellet   consumption   ×   PP )   +   ( Power   consumption   ×   EC ) ,
where E P t o t a l represents energy consumption cost, (USD, $), PP represents pellet cost, (USD/kg), and EC represents electricity charge (USD/kWh).

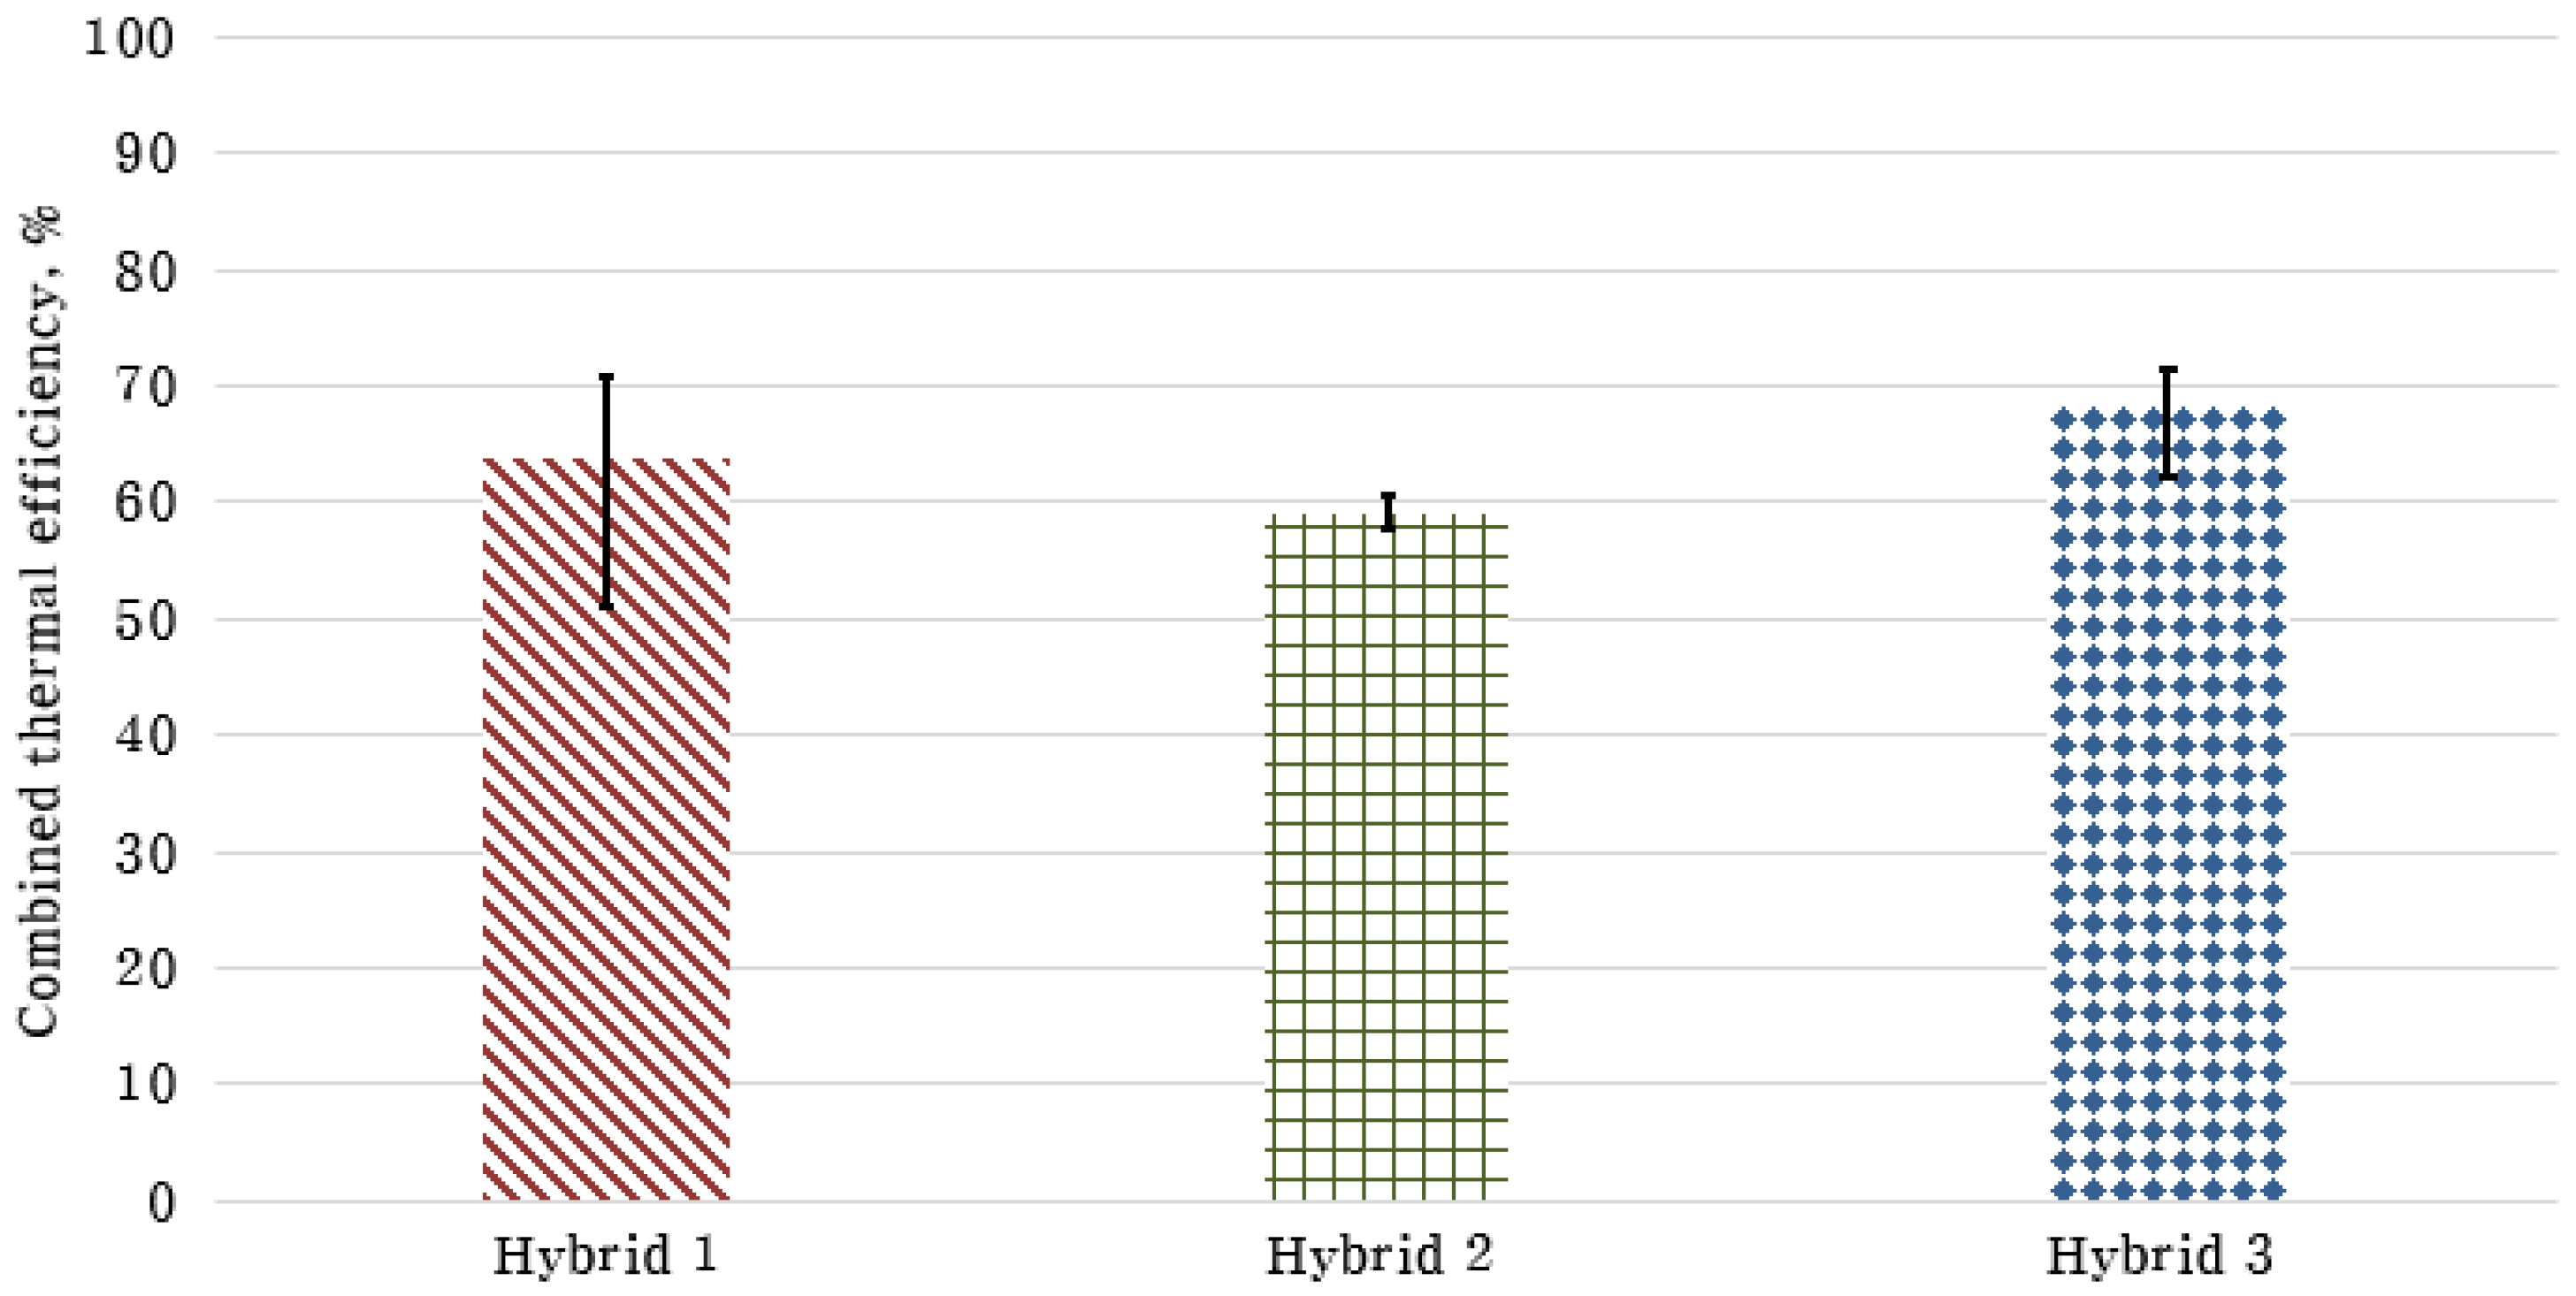
2.7.4. Combined Thermal Efficiency Analysis

The combined thermal efficiencies of the different hybrid systems were calculated to compare and identify the system with optimal thermal efficiency. The calculations were performed according to Equation (5), which considers the total energy consumption corresponding to each system ( E i n p u t ) and the amount of heat transferred to the heat storage tank ( E o u p u t ).
η c o m b i n e d = E o u t p u t E i n p u t   ,
where E o u t p u t represents energy transferred to the heat storage tank, and E i n p u t represents the input energy (pellet consumption, power consumption, and solar heat collection).

2.8. Economic Analysis

2.8.1. Heating Load Calculation

The total cost incurred by each system over 10 years can be predicted by dividing the total energy required for 10 years, which was calculated based on the heating load, by the energy cost per unit energy. Specifically, the heating load was calculated according to Equation (6), while the cover area heat flux, ventilation area heat flux, and floor area heat flux were calculated using Equations (7)–(9), respectively [24].
Q g   =   A g × [ q t   +   q v ]   + A s × q s × f w  
q t = h t × ( T s T a ) × ( 1 f r )  
q v = h v ×   ( T s T a )  
q s =   h s × ( T s T a )  
The different parameters in these equations are defined in Table 1.
The total energy consumption could be calculated by multiplying the maximum daily heating load by the 10-year durability period of the device as shown in Equation (10); a 12 h non-sunlight period was assumed.
TEC   ( kcal )   =   DAHL   × daily   data   excluding   July   and   August × 12   h × 10   year ,
where TEC implies total energy consumption and DAHL implies daily average heating load.

2.8.2. Economic Analysis (Net Present Value)

The net present value method was used for the comparative economic analysis of the developed hybrid systems. In this regard, the cultivation area was assumed to be 1000 m2, and the factors considered in the net present value method of economic analysis included the durability life of the device, initial investment cost, interest rate, operating cost, and depreciation amount. Further, the initial investment cost was analyzed in two parts based on the total project cost ( IIC ) and the actual required project cost ( IIC s e l f ) borne by the farmers according to the Renewable Energy Use Efficiency Project conducted in Korea. The initial investment cost calculation method using the present value method was expressed as shown in Equation (11).
TPW =   IIC   × CRF   ×   DP ,
where TPW implies total present worth, IIC implies initial investment costs, CRF implies capital recovery factor, and DP implies durability period.
The capital recovery factor (CRF) used in the net present value method was based on the straight-line depreciation method, and the cash flow was assumed to follow the same trend. The resulting CRF was calculated according to Equation (12), and the interest rate was calculated according to Equation (13) based on a nominal interest rate (2%).
CRF   =   i × ( 1 + i ) n ( 1 + i ) n 1
where i represents the nominal interest rate and n represents the applicable year.
i =   [ ( 1 + r ) × ( 1 + p ) ] 1
where i represents the nominal interest rate, r represents the real interest rate, and p represents the inflation rate.
Interest expenses, income tax, and annual operating expenses were calculated using the nominal interest rate, and the total expenses incurred during the durability period, including initial investment expenses, were calculated using Equation (14) [25].
T C 10 y r   = 0 TPW   + [ { n = 1 10 D R × ( 1 + i ) n +   n = 1 10 I T × ( 1 + i ) n + n = 1 10 A E × ( 1 + i ) n } × 10 ]
where T C 10 y r represents total cost for 10 years, D R represents debt return, I T represents income tax, A E represents annual expenses, i represents nominal interest rate, and n represents the applicable year.
The cost per unit energy for each system was determined using the total cost for 10 years calculated above and the total energy required for 10 years calculated using Equation (10). Subsequently, Equation (15), which was used to calculate energy cost (EC), was derived as follows:
EC   =   T C 10 y r T E C .

2.8.3. Economic Analysis (Life Cycle Cost)

The life cycle cost analysis method offers the possibility to calculate the total cost incurred during the life cycle of a device. The components considered for the life cycle cost analysis included initial investment cost, considering self-pay, maintenance and repair cost, and total fuel cost, which were then multiplied by the hourly fuel cost for 10 years of heating time required for the complex heating system. The formula that was used to calculate the life cycle cost based on the abovementioned factors was expressed as shown in Equation (16).
LCC   =   IIC s e l f + ( IIC × M C R ) + [ T E C Q g × ( F u e l   c o s t × Q g L H V   w i t h   u s e d   f u e l r a t i o ) ] ,
where M C R implies maintenance cost ratio.
The values of the different factors that were used in the economic analysis are listed in Table 2. The Table 2 is shown the initial investment cost & installation cost for pellet boiler (KN-23D, KYUWON Co., Gyeong-san, Korea) and a heat pump (COMPORT-A-03, Innergie Technologies Inc., Gwang-ju, Korea) and solar collector((KNSC-003, KANGNAM Co., Kwang-ju, Korea) recommended by manufacturers.

2.9. Statistical Analysis

Statistical analysis was conducted to confirm the significance of the comparative analysis between the experimental groups. The statistical program, SAS v9.4 (SAS Institute, Inc., Cary, NC, USA), was used, and the analysis was performed using Duncan’s multiple range test. Given that the heating experiments were conducted in connection with external weather, repeating them was challenging. Therefore, the effective data obtained during the experiments were assumed to be a single data sample per day.

3. Results

3.1. Experiment Schedule and Heating Performance Comparison

Each experiment was conducted for three days. The weather data during this experimental period are listed in Table 3.
The results of the comparison of the heating performances of the hybrid systems are listed in Table 4. Overall, the results satisfied the heating temperature setting range. However, hybrid system 1 showed the highest temperature increase, even though the outside temperatures of hybrid systems 2 and 3 were higher.
The variation of the temperature of the greenhouse under the different heating systems is shown in Figure 9, from which it is evident that when the outdoor temperature decreased, the indoor temperature also decreased. Further, an abnormal state with severe fluctuations in room temperature, which was considered to occur because the system was heated above the set heating temperature via simple on/off control, was observed during the experiment. In hybrid systems 2 and 3, in which solar heat was used, the indoor temperature decreased with the outside temperature, despite the relatively high outside temperature. Additionally, solar heat increased the temperature of the heat storage tank to 57 °C, but could not go above the reference temperature of 55 °C. This phenomenon was attributed to the relatively small amount of insolation due to seasonal characteristics. Consequently, the necessity for additional solar heat collection facilities was established. Although the hybrid systems showed excellent heating capacities, they suffered from some unwanted phenomena, including seasonal effects or failure to maintain the temperature of the heat storage tank evenly when solar heat was being used. However, as the heating capacities in the experiments involving the use of solar heat were generally lower than that corresponding to hybrid system 1, the application of the solar heat collection system changed the temperature of the heat storage tank, thereby reducing heating performance and decreasing the indoor temperature.

3.2. Results of Combined Thermal Efficiency

A comparison of the combined thermal efficiencies is shown in Figure 10 and Table 5 and Table 6. The thermal efficiency was highest at 68.1% in hybrid system 3. Considering hybrid systems 1 and 3, which involved the use of the hydrothermal heat pump, the average and maximum COP were 2.73 and 3.47 and 2.29 and 3.16, respectively. For hybrid system 2, which involved the use of the heat pump, the average COP was 2 because of the partial load operation of the inverter using the PID control that was built into the heat pump used in this study. Further, statistical analysis showed that all three experimental groups, which did not show any significant differences, could be classified under group A.

3.3. Variation of Energy Consumption with Increase in Temperature

A comparison of the energy consumption of the different hybrid systems as a function of increasing temperature is shown in Figure 11 and Table 7. The aim of studying these effects was to convert the energy consumption into a unit for comparison so as to recur any uncertainties arising from the fact that the different groups have different experimental dates. The comparison results revealed that hybrid system 1 consumed the lowest amount of energy, followed by hybrid systems 3 and lastly hybrid system 2. These results could be attributed to the proportion of power usage associated with the use of heat pumps in hybrid systems 1 and 3. For hybrid system 2, which involved the use of pellets and solar heat, the energy consumption with increasing temperature was expected to be the highest because of the high dependence on the pellets. Additionally, the energy-saving effect of hybrid system 1 was the greatest, as statistical analysis showed that this system had the lowest energy consumption. Thus, hybrid system 1 and the other experimental groups were classified under different groups and showed significant differences in this regard.

3.4. Results Corresponding to the Variation of Energy Cost with Increasing Temperature

A comparison of the energy cost with increasing temperature is shown in Figure 12 and Table 8. Hybrid system 1 exhibited the lowest application energy cost at 0.86 USD/h, whereas hybrid systems 3 and 2 showed higher energy costs at 0.98 and 1.13 USD/h, respectively. Unlike energy consumption, the energy cost was obtained by converting energy consumption. However, the cost served as a correction value; thus, it differed from energy consumption. Statistical analysis showed that hybrid system 2 could be classified under group A, while hybrid systems 1 and 3 could be classified under group B. The energy consumption cost corresponding to hybrid system 1 was significantly lower than that corresponding to hybrid system 2 but showed no significant difference compared with that corresponding to hybrid system 3. Additionally, the energy consumption and used energy cost tended to be similar. For the sake of comparison, the ratio of the energy consumption in each system is shown in Table 9.
The energy consumption ratio revealed that no significant difference existed between hybrid systems 1 and 3 with respect to pellet consumption; the difference in power consumption due to solar heat was approximately 3.3% on average. Further, when comparing hybrid systems 2 and 3, the amount of solar heat used was 4.5–4.6%, showing no significant difference. Thus, higher power consumption led to lower energy consumption and cost. The absolute energy consumption figures corresponding to hybrid systems 2 and 3 increased because of the use of solar heat; however, considering the three systems, hybrid system 1 showed superior performance in terms of energy consumption and cost.

3.5. Results of Comparative Economic Analysis (Net Present Value)

For a comparative analysis of economic feasibility, the developed hybrid systems were compared with conventional fossil fuel boilers (kerosene and diesel boilers). Additionally, the results obtained when only self-pay was considered when applying the government subsidy program that is currently in place in the ROK was compared with that based on the total project cost. Further, the results of the comparative analysis of economic feasibility using the net present value method are presented in Table 10.
Regarding the total project cost, hybrid systems 1 and 2 showed an energy cost reduction effect of approximately 5.8–6.5% compared to that of the kerosene boiler, whereas hybrid 3 was less economical than the standard kerosene boiler. Furthermore, hybrid systems 1 and 2 exhibited no significant differences. However, when implementing self-payment by applying the government subsidy project in Korea, hybrid system 1 led to 29.2% cost savings compared with that of kerosene boilers, showing the highest economic feasibility. In this regard, all systems built in this study were more economically feasible than kerosene boilers.

3.6. Results of Comparative Economic Analysis (Life Cycle Cost)

Based on the results of the economic analysis performed using the net present value method, it was difficult to confirm whether the observed dependence on the initial investment cost was large or whether the difference in operating expenses affected the economic feasibility of the systems. Therefore, we examined the economic feasibility of the hybrid systems and compared them, taking operating costs into consideration, by performing life cycle cost analysis. The results thus obtained are presented in Table 11.
Comparison performed using life cycle cost analysis showed that hybrid system 1 exhibited the best cost reduction effect (27.7%) as compared with that of the kerosene boiler. Further, kerosene and diesel boilers were found to have low economic feasibility due to their excessive fuel costs. Additionally, hybrid systems 1, 2, and 3 all showed higher economic feasibility than that of the fossil fuel boilers; however, despite exhibiting the lowest operating cost, hybrid system 3 was less feasible than hybrid system 1 because of its high initial investment cost. Consequently, hybrid system 1 was judged to be the best system overall.

4. Conclusions

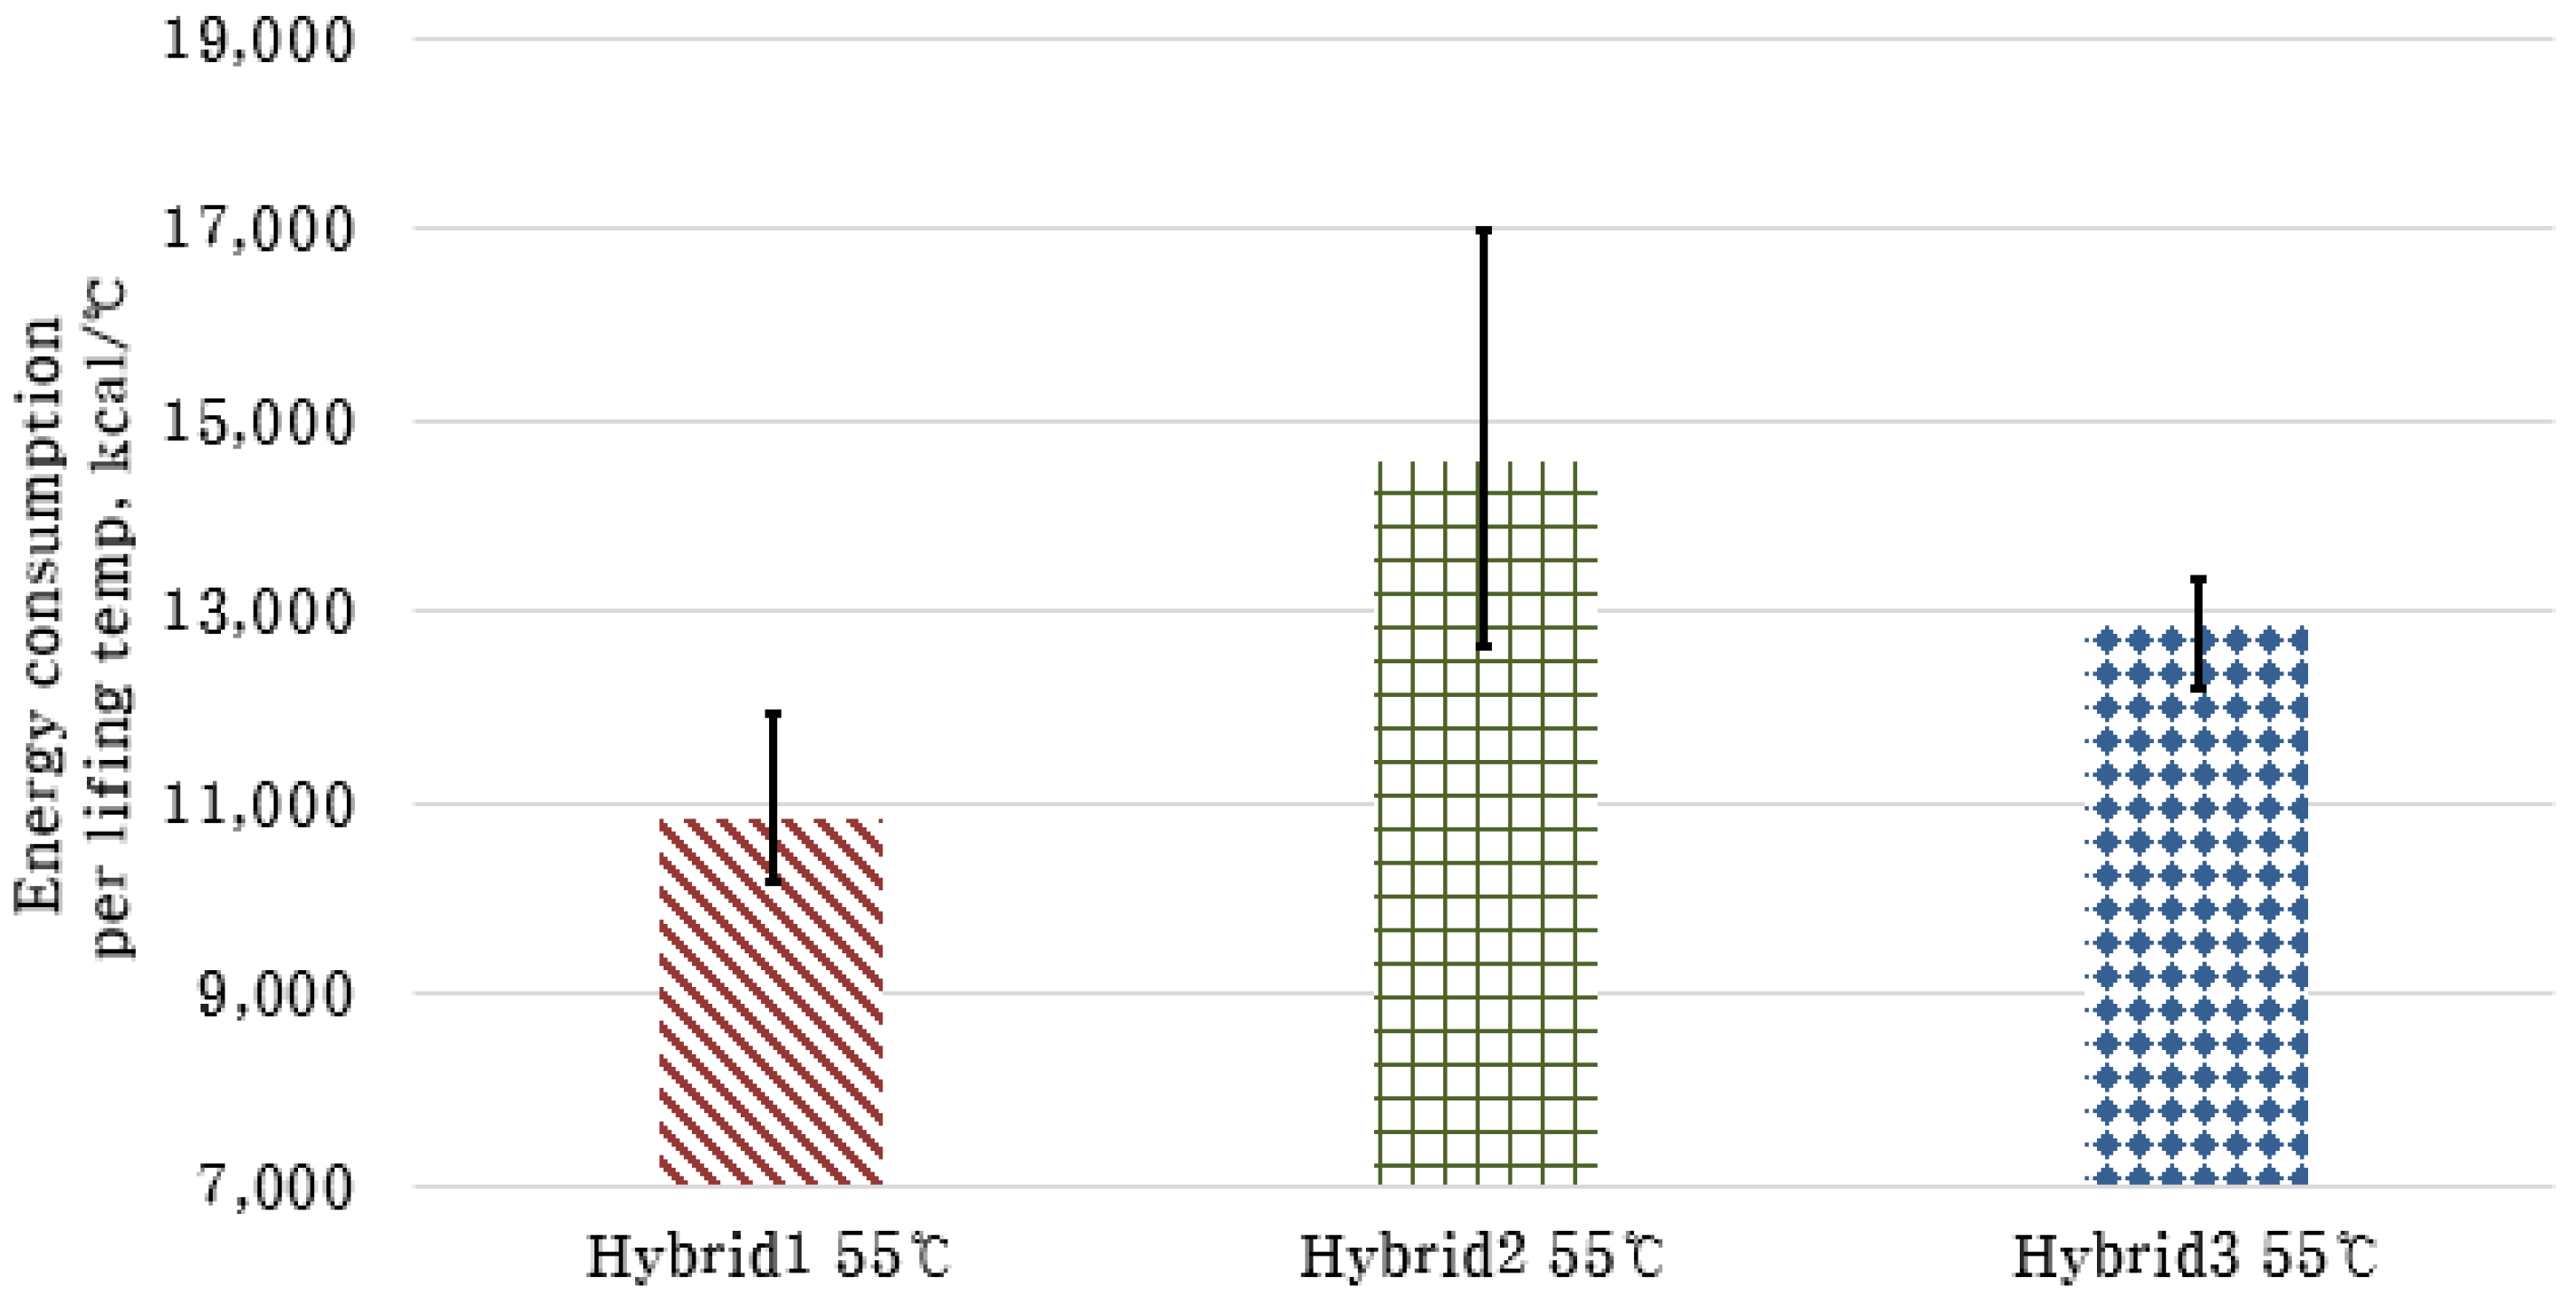
In this study, different hybrid systems for the heating of greenhouses in the ROK were built using available renewable energy sources. Their heating performances, combined thermal efficiencies, energy consumption characteristics, and energy costs as a function of increasing temperature were analyzed and compared. Additionally, the practical applicability of the developed hybrid systems was evaluated by performing a comparative analysis of their economic feasibility with respect to fossil fuel boilers. All the systems showed similar heating performance. Specifically, hybrid system 3 showed the best performance in terms of the combined thermal efficiency. However, the differences between the systems in this regard were not significant. Hence, comparing them with respect to combined thermal efficiency was challenging. Additionally, given that the results of the combined thermal efficiency analysis showed a tendency to change with changes in the external temperature, an appropriate balance between the thermal insulation of the systems and the thermal energy supply system was necessary. Hybrid system 1 showed a 25.7% reduction in energy consumption and a 24.1% reduction in energy cost with increasing temperature compared with those of the other systems. Thus, its performance was the best when considering the three hybrid systems. Further, the practical applicability of the developed hybrid systems was evaluated by performing economic analysis. Subsequently, the net present value approach and the life cycle cost analysis method were implemented. In the net present value approach, when considering only self-pay, hybrid system 1 showed a cost reduction effect of 29.2% compared with that of a kerosene boiler, and in the life cycle cost analysis, which included operating costs and initial investment costs; it showed a cost reduction effect of 27.7% compared with that of the kerosene boiler. Thus, it was judged to be the best system. Hybrid systems 2 and 3 showed higher economic efficiency than that of fossil fuel boilers; however, they were less efficient than hybrid system 1. In addition, hybrid systems 2 and 3 have seasonal restrictions on the use of solar heat collection systems. It can be used in spring and autumn when the outside temperature does not drop below freezing. However, it is difficult to use in winter due to the freezing problem of the collector. Therefore, hybrid system 1 is suitable for heating applications using renewable energy, and it is applicable to greenhouses in the ROK. In addition, Hybrid System 1 is judged to be applicable not only to ROK, but also to countries with a climate environment similar to that of ROK, or to greenhouses of small and medium size requiring heating anywhere in the world.

Author Contributions

Conception and design of study, C.-G.L., L.-H.C., S.-Y.P., S.-J.K. and D.-H.K.; experiments and experimental equipment configuration, C.-G.L., L.-H.C., S.-Y.P. and S.-J.K.; acquisition of data, C.-G.L. and L.-H.C.; analysis and/or interpretation of data, C.-G.L., L.-H.C., S.-Y.P. and S.-J.K.; writing of original draft, C.-G.L., L.-H.C., S.-Y.P., S.-J.K. and D.-H.K.; revising the manuscript critically for important intellectual content, C.-G.L. and D.-H.K.; approval of the version of the manuscript to be published, C.-G.L., L.-H.C., S.-Y.P., S.-J.K. and D.-H.K.; review & editing, supervision, funding acquisition, D.-H.K. All authors have read and agreed to the published version of the manuscript.

Funding

This work was supported by the Korea Institute of Planning and Evaluation for Technology in Food, Agriculture and Forestry (IPET) through the Smart Farm Innovation Technology Development Program funded by Ministry of Agriculture, Food and Rural Affairs (MAFRA) (grant number 421040-04).

Institutional Review Board Statement

Not applicable.

Informed Consent Statement

Not applicable.

Conflicts of Interest

The authors declare no conflict of interest.

References

  1. The Government of the Republic of Korea. 2050 Carbon Neutral Strategy of the Republic of Korea: Towards a Sustainable and Green Society. 2020. Available online: https://unfccc.int/sites/default/files/resource/LTS1_RKorea.pdf (accessed on 12 December 2020).
  2. Zhang, R.; Hanaoka, T. Deployment of electric vehicles in China to meet the carbon neutral target by 2060: Provincial disparities in energy systems, CO2 emissions, and cost effectiveness. Resour. Conserv. Recycl. 2021, 170, 105622. [Google Scholar] [CrossRef]
  3. Potrč, S.; Čuček, L.; Martin, M.; Kravanja, Z. Sustainable renewable energy supply networks optimization—The gradual transition to a renewable energy system within the European Union by 2050. Renew. Sustain. Energy Rev. 2021, 146, 111186. [Google Scholar] [CrossRef]
  4. Hirvonen, J.; Heljo, J.; Jokisalo, J.; Kurvinen, A.; Saari, A.; Niemelä, T.; Sankelo, P.; Kosonen, R. Emissions and power demand in optimal energy retrofit scenarios of the Finnish building stock by 2050. Sustain. Cities Soc. 2021, 70, 102896. [Google Scholar] [CrossRef]
  5. Zhang, C.; Hu, M.; Sprecher, B.; Yang, X.; Zhong, X.; Li, C.; Tukker, A. Recycling potential in building energy renovation: A prospective study of the Dutch residential building stock up to 2050. J. Clean. Prod. 2021, 301, 126835. [Google Scholar] [CrossRef]
  6. Sithole, H.; Cockerill, T.; Hughes, K.; Ingham, D.; Ma, L.; Porter, R.; Pourkashanian, M. Developing an optimal electricity generation mix for the UK 2050 future. Energy 2016, 100, 363–373. [Google Scholar] [CrossRef] [Green Version]
  7. Ministry of Environment, Republic of Korea. 2030 Greenhouse Gas Reduction Roadmap. 2018. Available online: https://www.gihoo.or.kr/portal/kr/images/download/2030gas_loadmap.pdf (accessed on 20 July 2020).
  8. Kim, S.; Jeon, Y. 2017 Energy Consumption Survey; Ministry of Trade Industry & Energy Republic of Korea & Korea Energy Economics Institute: Sejog City, Korea, 2018.
  9. Lee, Y. Agricultural and Livestock Income Data Book for Improving Agricultural Management; Rural Development Administration: Wansan-gu, Korea, 2014; ISBN 9788948002331. [Google Scholar]
  10. Chau, J.; Sowlati, T.; Sokhansanj, S.; Preto, F.; Melin, S.; Bi, X. Economic sensitivity of wood biomass utilization for greenhouse heating application. Appl. Energy 2009, 86, 616–621. [Google Scholar] [CrossRef]
  11. Karner, K.; Dißauer, C.; Enigl, M.; Strasser, C.; Schmid, E. Environmental trade-offs between residential oil-fired and wood pellet heating systems: Forecast scenarios for Austria until 2030. Renew. Sustain. Energy Rev. 2017, 80, 868–879. [Google Scholar] [CrossRef]
  12. Bibbiani, C.; Fantozzi, F.; Gargari, C.; Campiotti, C.A.; Schettini, E.; Vox, G. Wood Biomass as Sustainable Energy for Greenhouses Heating in Italy. Agric. Agric. Sci. Procedia 2016, 8, 637–645. [Google Scholar] [CrossRef]
  13. McKenney, D.W.; Yemshanov, D.; Fraleigh, S.; Allen, D.; Preto, F. An economic assessment of the use of short-rotation coppice woody biomass to heat greenhouses in southern Canada. Biomass Bioenergy 2011, 35, 374–384. [Google Scholar] [CrossRef]
  14. Kim, Y.; Park, H.; Kang, C.; Park, G.; Jeong, E.; Lee, W.; Park, M. Prospect of Demand and Supply of energy in the Agricultural Sector and Strategies for Introducing Clean Energy Farming System; Rural Development Administration: Jeollabuk-do, Korea, 2010; ISBN 97889601326109352. [Google Scholar]
  15. Maddah, S.; Goodarzi, M.; Safaei, M.R. Comparative study of the performance of air and geothermal sources of heat pumps cycle operating with various refrigerants and vapor injection. Alex. Eng. J. 2020, 59, 4037–4047. [Google Scholar] [CrossRef]
  16. De Swardt, C.A.; Meyer, J. A performance comparison between an air-source and a ground-source reversible heat pump. Int. J. Energy Res. 2001, 25, 899–910. [Google Scholar] [CrossRef]
  17. Ministry of Environment, Republic of Korea & K-Water (Korea Water Resources Corporation). 2019 Groundwater Annual Report. 2019. Available online: http://www.kogga.or.kr/site3/data/da_law_view.asp?intSeq=14772&strboardId=pdskwa&page=1 (accessed on 20 August 2021).
  18. Nam, H.; Kim, Y.; Seo, J.; Shin, Y. A Study on the Variation of ground water temperature for development of ground water source heat pump. Trans. Korea Soc. Geotherm. Energy Eng. 2004, 11, 80. [Google Scholar]
  19. Kang, Y.K.; Ryou, Y.S.; Kim, J.G.; Kim, Y.H.; Jang, J.K. Heating effects of the Greenhouse for Mango heated by the Wood Pellet Boiler. Korean Soc. New Renew. Energy 2013, 5, 86. [Google Scholar]
  20. Hassanien, R.H.E.; Li, M.; Tang, Y. The evacuated tube solar collector assisted heat pump for heating greenhouses. Energy Build. 2018, 169, 305–318. [Google Scholar] [CrossRef]
  21. Kwon, J.K.; Kang, G.C.; Moon, J.P.; Kang, Y.K.; Kil Kim, C.; Lee, S.J. Performance Improvement of an Air Source Heat Pump by Storage of Surplus Solar Energy in Greenhouse. Prot. Hortic. Plant Fact. 2013, 22, 328–334. [Google Scholar] [CrossRef]
  22. Tian, Z.; Zhang, S.; Deng, J.; Fan, J.; Huang, J.; Kong, W.; Perers, B.; Furbo, S. Large-scale solar district heating plants in Danish smart thermal grid: Developments and recent trends. Energy Convers. Manag. 2019, 189, 67–80. [Google Scholar] [CrossRef]
  23. Ko, M.-J.; Kim, Y.-S. Applicability Estimation of Solar Water Heater according to Solar Radiation and Water Supply Temperature in Korea. J. Korean Soc. Living Environ. Syst. 2017, 24, 579–587. [Google Scholar] [CrossRef]
  24. Ahn, H. Facility Horticulture Automation; Munundang: Seoul, Korea, 2008; pp. 128–138. ISBN 9788973934997. [Google Scholar]
  25. Kim, D.H. A review of desalting process techniques and economic analysis of the recovery of salts from retentates. Desalination 2011, 270, 1–8. [Google Scholar] [CrossRef]
Figure 1. Greenhouse overview. (a) Photo of experimental greenhouse, and (b) Heating device installation overview.
Energies 14 06603 g001aEnergies 14 06603 g001b
Figure 2. Schematic diagram of the combined heating system.
Energies 14 06603 g002
Figure 3. Schematic of hybrid system 1.
Energies 14 06603 g003
Figure 4. Control logic of hybrid system 1.
Energies 14 06603 g004
Figure 5. Schematic of hybrid system 2.
Energies 14 06603 g005
Figure 6. Control logic of hybrid system 2.
Energies 14 06603 g006
Figure 7. Schematic of hybrid system 3.
Energies 14 06603 g007
Figure 8. Control logic of hybrid system 3.
Energies 14 06603 g008
Figure 9. Experimental results showing variation of greenhouse temperature. (a) Hybrid system 1, (b) hybrid system 2, and (c) hybrid system 3, all at a standard temperature of 55 °C.
Energies 14 06603 g009aEnergies 14 06603 g009b
Figure 10. Comparison results of combined thermal efficiency.
Energies 14 06603 g010
Figure 11. Comparison of energy consumption as a function of increasing temperature.
Energies 14 06603 g011
Figure 12. Comparison of average cost of fuel consumption with increasing temperature.
Energies 14 06603 g012
Table 1. Factors required for the calculation of the heating load.
ParameterDefinitionUnit
QgMaximum heating loadkcal/h
AgCovered area of a greenhousem2
AsFloor area of a greenhousem2
qtTransmission heat load
for unit covered area of the greenhouse
kcal/m2
qvVentilation heat load
for unit covered area of the greenhouse
kcal/m2
qsGround heat transfer load
for unit covered area of the greenhouse
kcal/m2
fwCorrection factor according to wind velocity-
htThermal perfusion ratio4.50kcal/m2·h·°C
TsGreenhouse inside set temperature°C
TaSet ambient air temperature°C
TgGround temperature°C
SfSafety factor1.2-
frReduction rate of heating cover0.71
(Triple screen)
-
hvVentilation heat coefficient0.2kcal/m2·h·°C
hsGround heat transfer coefficients0.244kcal/m2·h·°C
Table 2. Factors used in economic analysis.
DivisionHybrid 1
(Pellet Boiler/
Heat Pump)
Hybrid 2
(Pellet Boiler/
Solar Collector)
Hybrid 3
(Pellet Boiler/
Heat Pump/
Solar Collector)
Generating capacity100,000 kcal/h (1 EA)/
15 RT (2 EA)
100,000 kcal/h (1 EA)/
2231 kcal/m2 day (40 EA)
50,000 kcal/h (1 EA)/
30 RT (1 EA)/
2231 kcal/m2 day (40 EA)
Initial investment cost
total cost (USD, $)
47,81764,33245,795
Initial investment cost
self-pay (USD, $)
12,38628,22728,901
Debt ratio (%)139.613
Interest rate on agricultural loans when using renewable energyFixed interest rate of 2%
Annual average inflation (%)2%
Effective income tax rate (%)15%
Durability period (yr)10
Depreciation methodStraight-line
Table 3. Weather data during experimental period.
ExperimentPeriodTemperature
(°C)
Wind Speed
(m/s)
Humidity
(g/m3)
Insolation
(MJ/m2)
MaxMinMaxMinMaxMinMaxMin
Hybrid 1
55 °C
2020-03-02~2020-03-0414.5−1.34.90.05.82.52.71.85
Hybrid 2
55 °C
2020-11-15~2020-11-1722.35.72.30.09.65.41.71.3
Hybrid 3
55 °C
2020-11-12~2020-11-1425.65.52.70.07.63.91.91.8
Table 4. Summary of experimental results.
System at 55 °CAverage Ambient Temperature for Heating Period (°C)Lifting Temperature Average (°C)Average Greenhouse Temperature (°C)
Hybrid 15.816.0620.76
Hybrid 211.210.8321.41
Hybrid 312.713.4321.97
Table 5. Comparative analysis combined thermal efficiency.
Device at 55 °CInput Calorie
(kcal/h)
Heating Calorie
(kcal/h)
Combined Thermal Efficiency (%)Combined Thermal Efficiency (%),
Average
max/min
Average COP/
Maximum COP
Hybrid system 116,07510,67966.463.82.29/3.16
18,64010,81258.0
15,01610,07667.167.158.0
Hybrid system 212,749848569.559.1-
13,445803662.8
21,960989345.169.545.1
Hybrid system 312,286870370.868.12.73/3.47
12,728881169.2
13,535871764.470.864.4
Table 6. Statistical analysis results of combined thermal efficiency.
Duncan GroupingMeanNSystem at 55 °C
A68.13Hybrid system 3
A63.83Hybrid system 1
A59.13Hybrid system 2
Table 7. Results of the statistical analysis of energy consumption as a function of increasing temperature.
Duncan GroupingMeanNSystem at 55 °C
A14,584.03Hybrid 2
B12,849.73Hybrid 3
C10,830.83Hybrid 1
Table 8. Statistical analysis results corresponding to the variation of energy consumption with increasing temperature.
Duncan GroupingMeanNSystem at 55 °C
A1.133Hybrid 2
B0.983Hybrid 3
B0.863Hybrid 1
Table 9. Used fuel ratio of hybrid systems 1, 2, and 3.
Hybrid System 1
(Pellet:Power)
(%)
Hybrid System 2
(Pellet:Solar)
(%)
Hybrid System 3
(Pellet:Power:Solar)
(%)
Day 1 experiment83.3:16.795.7:4.382.8:12.3:4.9
Day 2 experiment79.9:20.195.1:4.982.7:12.2:5.3
Day 3 experiment84.4:15.696.0:4.078.5:18.3:3.4
Average ratio82.5:17.595.6:4.481.1:14.2:4.6
Table 10. Results of economic analysis based on the net present value method for each system.
DivisionKerosene
Boiler
Diesel
Boiler
Hybrid 1
(P.B + H.P)
Hybrid 2
(P.B + S.C)
Hybrid 3
(P.B + H.P + S.C)
Initial investment cost
(USD, $)
5055505547,81764,33245,795
Debt ratio (%)0013139.6
Initial investment cost—Self-pay
(USD, $)
5055505512,38628,22728,901
Debt ratio (%)005020.721.4
Capital recovery factor0.12
TC10yr of
total investment cost
(USD, $)/10 years)
196,139.79209,114.17183,879.34184,834.68201,293.06
TC10yr of self-pay
(USD, $)/10 years)
196,139.79209,114.17139,416.16163,957.79156,836.28
TEC
(Mcal/10 years)
1,511,842
EC total investment cost
(KRW/Mcal)
0.1290.1380.1210.1220.133
EC self-pay
(KRW/Mcal)
0.1290.1380.0920.1080.103
Table 11. Comparative results of economic analysis based on life cycle cost analysis for each system.
DivisionKerosene BoilerDiesel
Boiler
Hybrid 1
(P.B 1 + H.P 2)
Hybrid 2
(P.B + S.C 3)
Hybrid 3
(P.B + H.P + S.C)
Fuel using ratio100%100%P.B 82%
H.P 18%
96%P.B 82%
H.P 14%
TEC151,184,200 kcal
Heating load per hour97,262 kcal/h
Total heating time
required per 10 years
1554.4
Fuel costKerosene, 0.92 USD/L; diesel, 1.09 USD/L;
Pellet, 373 KRW/kg; electricity, 50 KRW/kWh; solar: 0 KRW
Fuel cost per hour
(USD/h)
10.9411.797.067.266.87
Operating expenses required for 10 years
(total investment cost)
(USD, $)
170,517.19183,725.14114,555.86117,488.20113,244.86
Initial investment cost self-pay
(USD, $)
5055.615055.6112,38628,22728,901
LCC
(USD, $)
175,572.80188,780.75126,942.11145,715.37142,146.11
1 P.B: Pellet Boiler; 2 H.P: Heat Pump; 3 S.C: Solar Collector.
Publisher’s Note: MDPI stays neutral with regard to jurisdictional claims in published maps and institutional affiliations.

