Article

Biocrude Production from Hydrothermal Liquefaction of Chlorella: Thermodynamic Modelling and Reactor Design

1
School of Energy and Power Engineering, Jiangsu University, Zhenjiang 212013, China
2
School of Mechanical Engineering, Jiangsu University, Zhenjiang 212013, China
3
College of Chemistry & Chemical Engineering, Anhui University, Hefei 230601, China
*
Author to whom correspondence should be addressed.
Energies 2021, 14(20), 6602; https://doi.org/10.3390/en14206602
Submission received: 26 September 2021 / Revised: 11 October 2021 / Accepted: 11 October 2021 / Published: 13 October 2021

Abstract

:
Hydrothermal liquefaction can directly and efficiently convert wet biomass into biocrude with a high heating value. We developed a continuous hydrothermal liquefaction model via Aspen Plus to explore the effects of moisture content of Chlorella, reaction pressure and temperature on thermodynamic equilibrium yields, and energy recoveries of biocrude. We also compared the simulated biocrude yield and energy recoveries with experiment values in literature. Furthermore, vertical and horizontal transportation characteristics of insoluble solids in Chlorella were analyzed to determine the critical diameters that could avoid the plugging of the reactor at different flow rates. The results showed that the optimum moisture content, reaction pressure, and reaction temperature were 70–90 wt%, 20 MPa, and 250–350 °C, respectively. At a thermodynamic equilibrium state, the yield and the energy recovery of biocrude could be higher than 56 wt% and 96%, respectively. When the capacity of the hydrothermal liquefaction system changed from 100 to 1000 kg·h−1, the critical diameter of the reactor increased from 9 to 25 mm.

1. Introduction

Increasing global energy demand leads to the excessive consumption of fossil fuels and causes serious environmental pollution problems. Fuel from biomass has attracted wide attention for its renewability, sustainability, and low net CO2 emissions from a life cycle perspective [1]. Hydrothermal liquefaction (HTL) is a typical thermochemical conversion process with water involved in reactions under sub-critical conditions [2]. It could convert macromolecules in biomass into biocrude through complex reactions, such as depolymerization, bond breaking, rearrangement, and decarboxylation [3]. HTL can utilize the fat, as well as the full components in biomass. It also has the advantages of avoiding the energy-intensive drying process by directly treating wet biomass [4]. Biocrude produced from HTL presents a high heating value and great potential to solve an energy crisis.
Previous studies on HTL research focused on the influence of biomass type, temperature, time, biomass concentration, catalyst, reaction media, and recovery solvent on biocrude yields and properties [5,6]. However, HTL experiments were usually performed with batch apparatus, and studies on continuous HTL systems were few [7]. Aspen Plus has many reaction modules such as RStoic, RYield, and RGibbs, which can be used for the analysis of a continuous HTL system. With Aspen Plus, Hansen et al. [8] developed a conceptual HTL flow sheet with an electrofuel system to recover the carbon in aqueous phase and gaseous by-products, and the total carbon efficiency was estimated as 84.8%. Lozano et al. [9] established a HTL process of wood with the aqueous phase recirculated and explored the duties of the reactor and heat exchanger. Ong et al. [10] analyzed a 2000 t·d−1 HTL process of pine and estimated the operating cost of the system. Hoffmann et al. [11] simulated a combined HTL and upgrading process of 1000 kg·d−1 manure, and the energy recovery of biofuels could reach 62–84%. However, biocrude yields in the above studies were all assumed by experimental results and simulated with a yield reactor in Aspen Plus. The change of biocrude yield under different operating conditions cannot be clarified from a thermodynamic perspective.
The above research gaps motivate this study on developing a continuous HTL system by Aspen Plus to investigate the influences of operation conditions (biomass moisture content, pressure, and temperature) on biocrude yield and its energy recovery and to obtain optimum reaction conditions thermodynamically. In addition, the blockage problem of reactor limits the development of continuous HTL systems, and determination of the reactor diameter is crucial [12]. Different from prior studies, which determine the reactor diameter by either experiments [13] or computational fluid dynamics [14], this work will theoretically obtain the reactor diameters at different flow rates by analyzing the transportation characteristics of insoluble solids in biomass.

2. Process Design

2.1. Materials

Feedstock of HTL mainly includes microalgae, agricultural and forestry biomass, manure, and sludge. Thereinto, microalgae are cost-effective raw materials with the advantages of growing in an aquatic environment, not occupying land, and having a superior carbon fixation rate, excellent photosynthesis efficiency, and high lipid content. As a typical species of algae, Chlorella has a fast growth rate and can undergo some inhibitory components including nitrogen-containing heterocyclic substances and phenols [15]. Therefore, Chlorella was chosen as the feedstock for the HTL system. Table 1 summarizes the proximate and ultimate analyses of Chlorella [16].

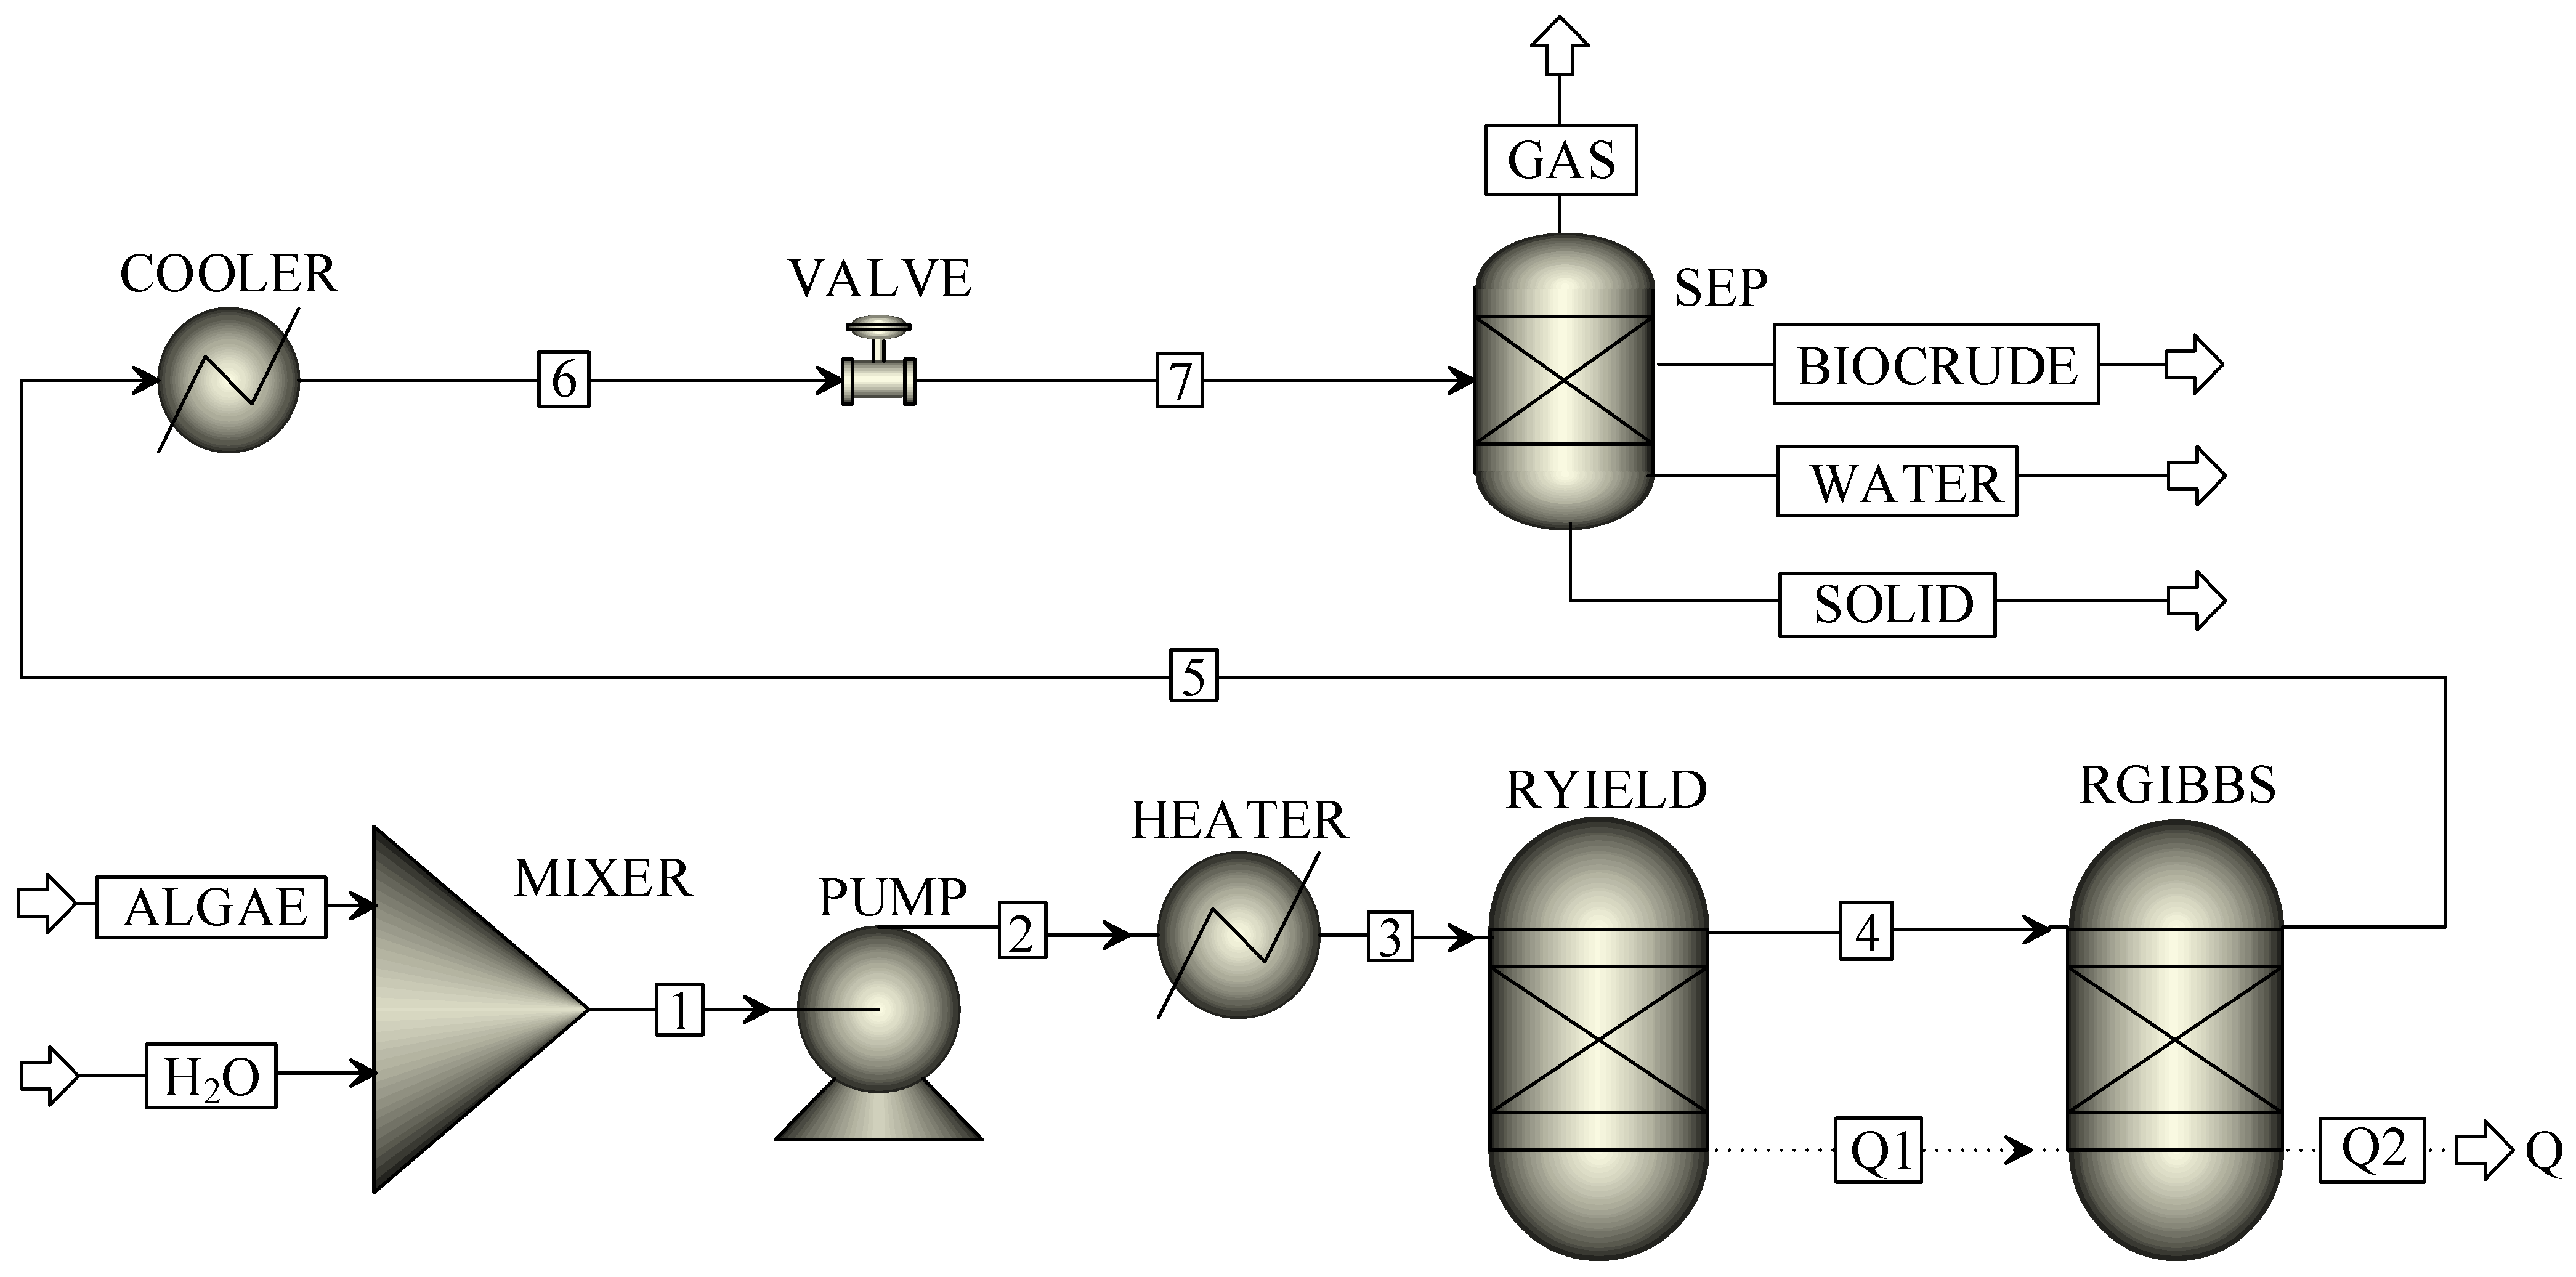
2.2. Process Flow Sheet

The flow sheet for continuous HTL of Chlorella was simulated by Aspen Plus V8.0 (see Figure 1) based on the Gibbs free energy minimization method. The initial mass flow, moisture content, temperature, and pressure of Chlorella were supposed as 100 kg·h−1, 80 wt%, 25 °C, and 0.1 MPa, respectively. The biocrude was modeled as a mixture of palmitic acid and phenol [11]. This composition was based on the GC-MS analysis of biocrude because palmitic acid was generally the most abundant compound in biocrude while most cyclic oxygenates have the structure of phenol [17]. The Soave–Redlich–Kwong equation was applied to define the physical property of the model compounds in Aspen Plus. For non-conventional components such as Chlorella and ash, HCOALGEN and DCOALIGT models in Aspen Plus were applied to calculate their enthalpies and densities through their proximate and ultimate analyses.
In Figure 1, Chlorella (ALGAE) and water (H2O) were mixed in a mixer (MIXER) and pressurized by a pump (PUMP). After pressurization, the stream was heated to the reaction temperature by a preheater (HEATER). The reaction pressure and temperature were initially set at 20 MPa and 350 °C, respectively. Afterwards, the mixed stream was decomposed into conventional components including C, H, O, N, S, H2O, and ASH in a yield reactor (RYIELD) and entered a Gibbs reactor (RGIBBS) to produce biocrude (palmitic acid and phenol), syngas (H2 and CO), and other gaseous products via HTL reaction. Thermodynamic equilibrium compositions of HTL products were calculated based on the Gibbs free energy minimization principle in Aspen Plus. After HTL reaction, the stream was cooled down and depressurized to ambient conditions (50 °C and 0.10 MPa). Products from COOLER and VALVE subsequently entered a component separator (SEP) to obtain the oil phase (BIOCRUDE), water phase (WATER), solid phase (SOLID), and gas phase (GAS). Finally, the influences of moisture content of Chlorella, pressure, and temperature on yields and energy recoveries of biocrude were explored by the sensitivity analysis tool in Aspen Plus.

2.3. Data Analysis

Yields of palmitic acid, phenol, and biocrude were calculated by Equation (1).
Yield   ( wt % ) = mass   of   palmitic   acid ,   phenol   or   biocrude   mass   of   the   dried   C h l o r e l l a × 100 %
Energy recoveries of biocrude were formulated by Equation (2). Higher heating values of palmitic acid, phenol, and Chlorella were 38.91, 32.45, and 20.47 MJ·kg−1, respectively.
Energy   recovery   ( % ) = flow   rate   of   palmitic   acid × HHV   of   palmitic   acid + flow   rate   of   phenol × HHV   of   phenol   flow   rate   of   C h l o r e l l a × HHV   of   C h l o r e l l a × 100 %

3. Results and Discussion

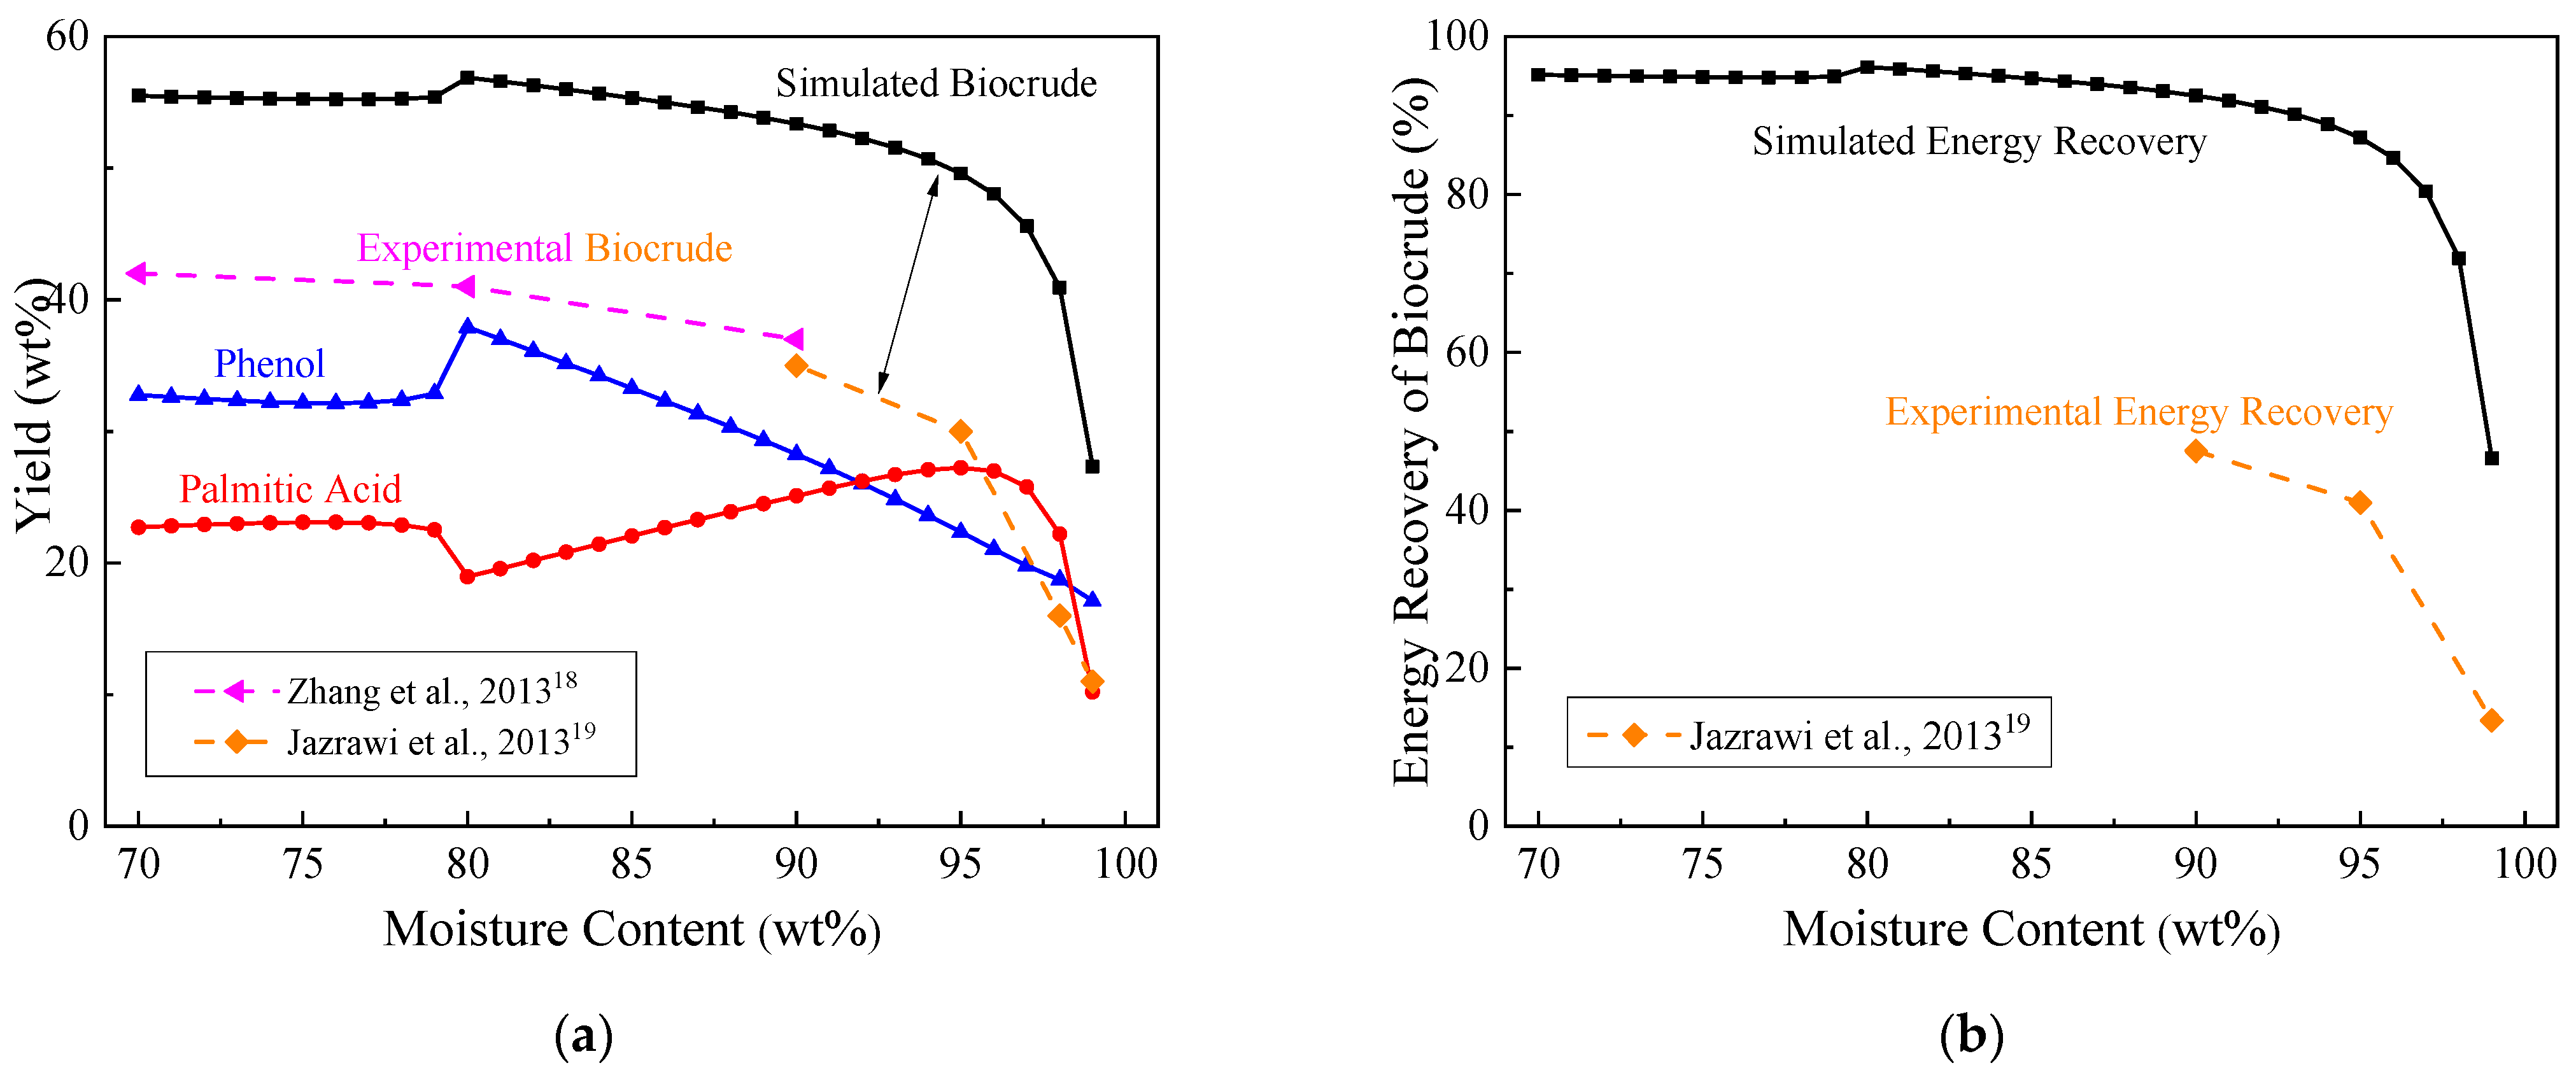
3.1. Effect of Moisture Content

Figure 2 displays the impact of moisture content of Chlorella on the biocrude yield and its energy recovery at 350 °C and 20 MPa. As shown in Figure 2a, despite the fact that the simulated biocrude yields were all higher than the experimental values from HTL of Chlorella [18,19], their general variation trends were similar. The simulated biocrude yield changed little as the water content of Chlorella ascended from 70 to 90 wt%. It reached a small peak of 55.5 wt% with 80 wt% water content. When the moisture content exceeded 95 wt%, a considerable decrease in the biocrude yield was observed. The change trend of phenol was similar to that of biocrude, and the peak yield also appeared at 80 wt% moisture content. In comparison, the yield of palmitic acid reached a valley value at 80 wt% moisture content, and then slowly increased. When the moisture content exceeded 95 wt%, the yield of palmitic acid also decreased rapidly.
Similar to the yield, the simulated energy recovery of biocrude in Figure 2b also kept stable as the water content of Chlorella ranged from 70 to 90 wt% but significantly decreased with the water content higher than 95 wt%. This downward trend with moisture content higher than 95 wt% was consistent with Jazrawi et al.’s experimental data [19] (see the dashed line in Figure 2b). During the HTL process, hydrolysis reactions initially occurred to produce water-soluble products, and then the water-soluble products were converted into biocrude [20]. Higher moisture contents might promote the hydrolysis of Chlorella to produce water-soluble products but inhibit dehydration reactions of water-soluble products to form biocrude. Thus, the moisture content of Chlorella should be controlled at 70–90 wt%.

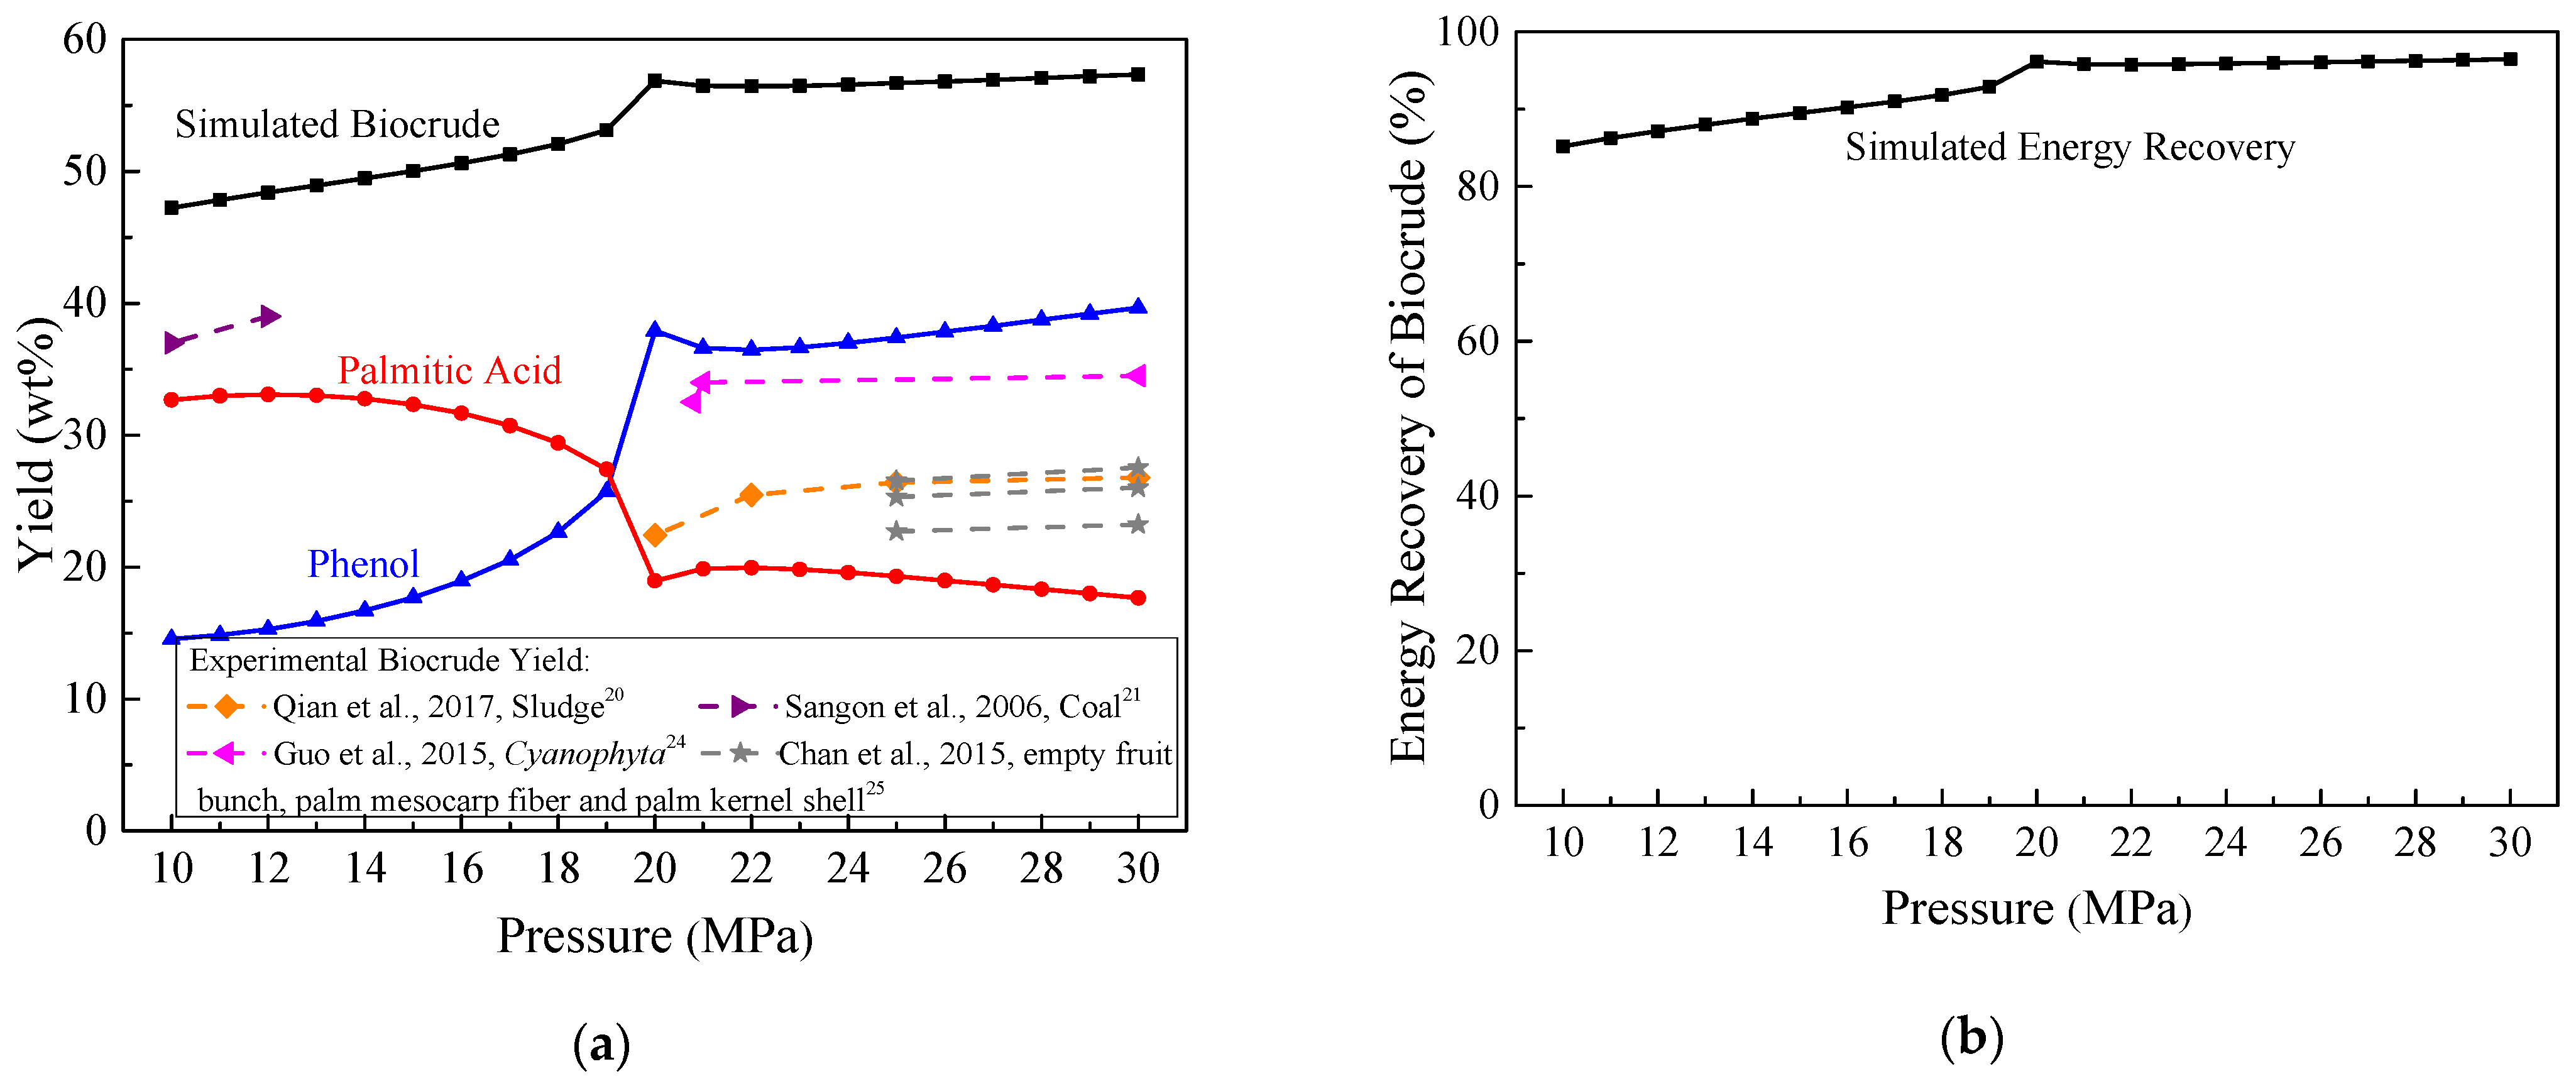
3.2. Effect of Pressure

Figure 3 reports the impact of pressure on the biocrude yield and its energy recovery produced by 80 wt% Chlorella at 350 °C. As shown in Figure 3a, the biocrude yield increased from 47.2 to 56.9 wt% with the pressure changing from 10 to 20 MPa. Sangon et al. [21] also found that an increase in pressure from 7 MPa to 12 MPa slightly improved the liquefied oil yield by 7 wt% during coal liquefaction. However, when the pressure was higher than 20 MPa, yields of biocrude, palmitic acid, and phenol remained stable.
High pressure will promote the hydrolysis of Chlorella and accelerate ionic reactions during the HTL process, but excessively high pressure will generate a solvent cage effect and inhibit free radical reactions [22,23]. Thus, the biocrude yields underwent little change when the pressure exceeded the critical pressure of water (22 MPa). Although few studies report the influence of pressure on HTL of Chlorella, experiments on HTL of sludge [20], Cyanophyta [24], empty fruit bunch, palm mesocarp fiber, palm kernel shell [25], and Nannocholoropsis sp. [26] (see dashed lines in Figure 3) all confirmed that once the pressure was close to or higher than the critical pressure of water, it had a negligible influence on biocrude yield. This phenomenon was consistent with the thermodynamic biocrude yield in Figure 3a.
In Figure 3b, the simulated energy recovery of biocrude shows the same variation trend as the biocrude yield. It reached 96% when the reaction pressure was 20 MPa. Further increasing the pressure seldom changed the energy recovery of biocrude but significantly improved costs of the feeding pump, HTL reactor, and effluent pressure regulators in a continuous system [5]; so, the pressure should be controlled at about 20 MPa.

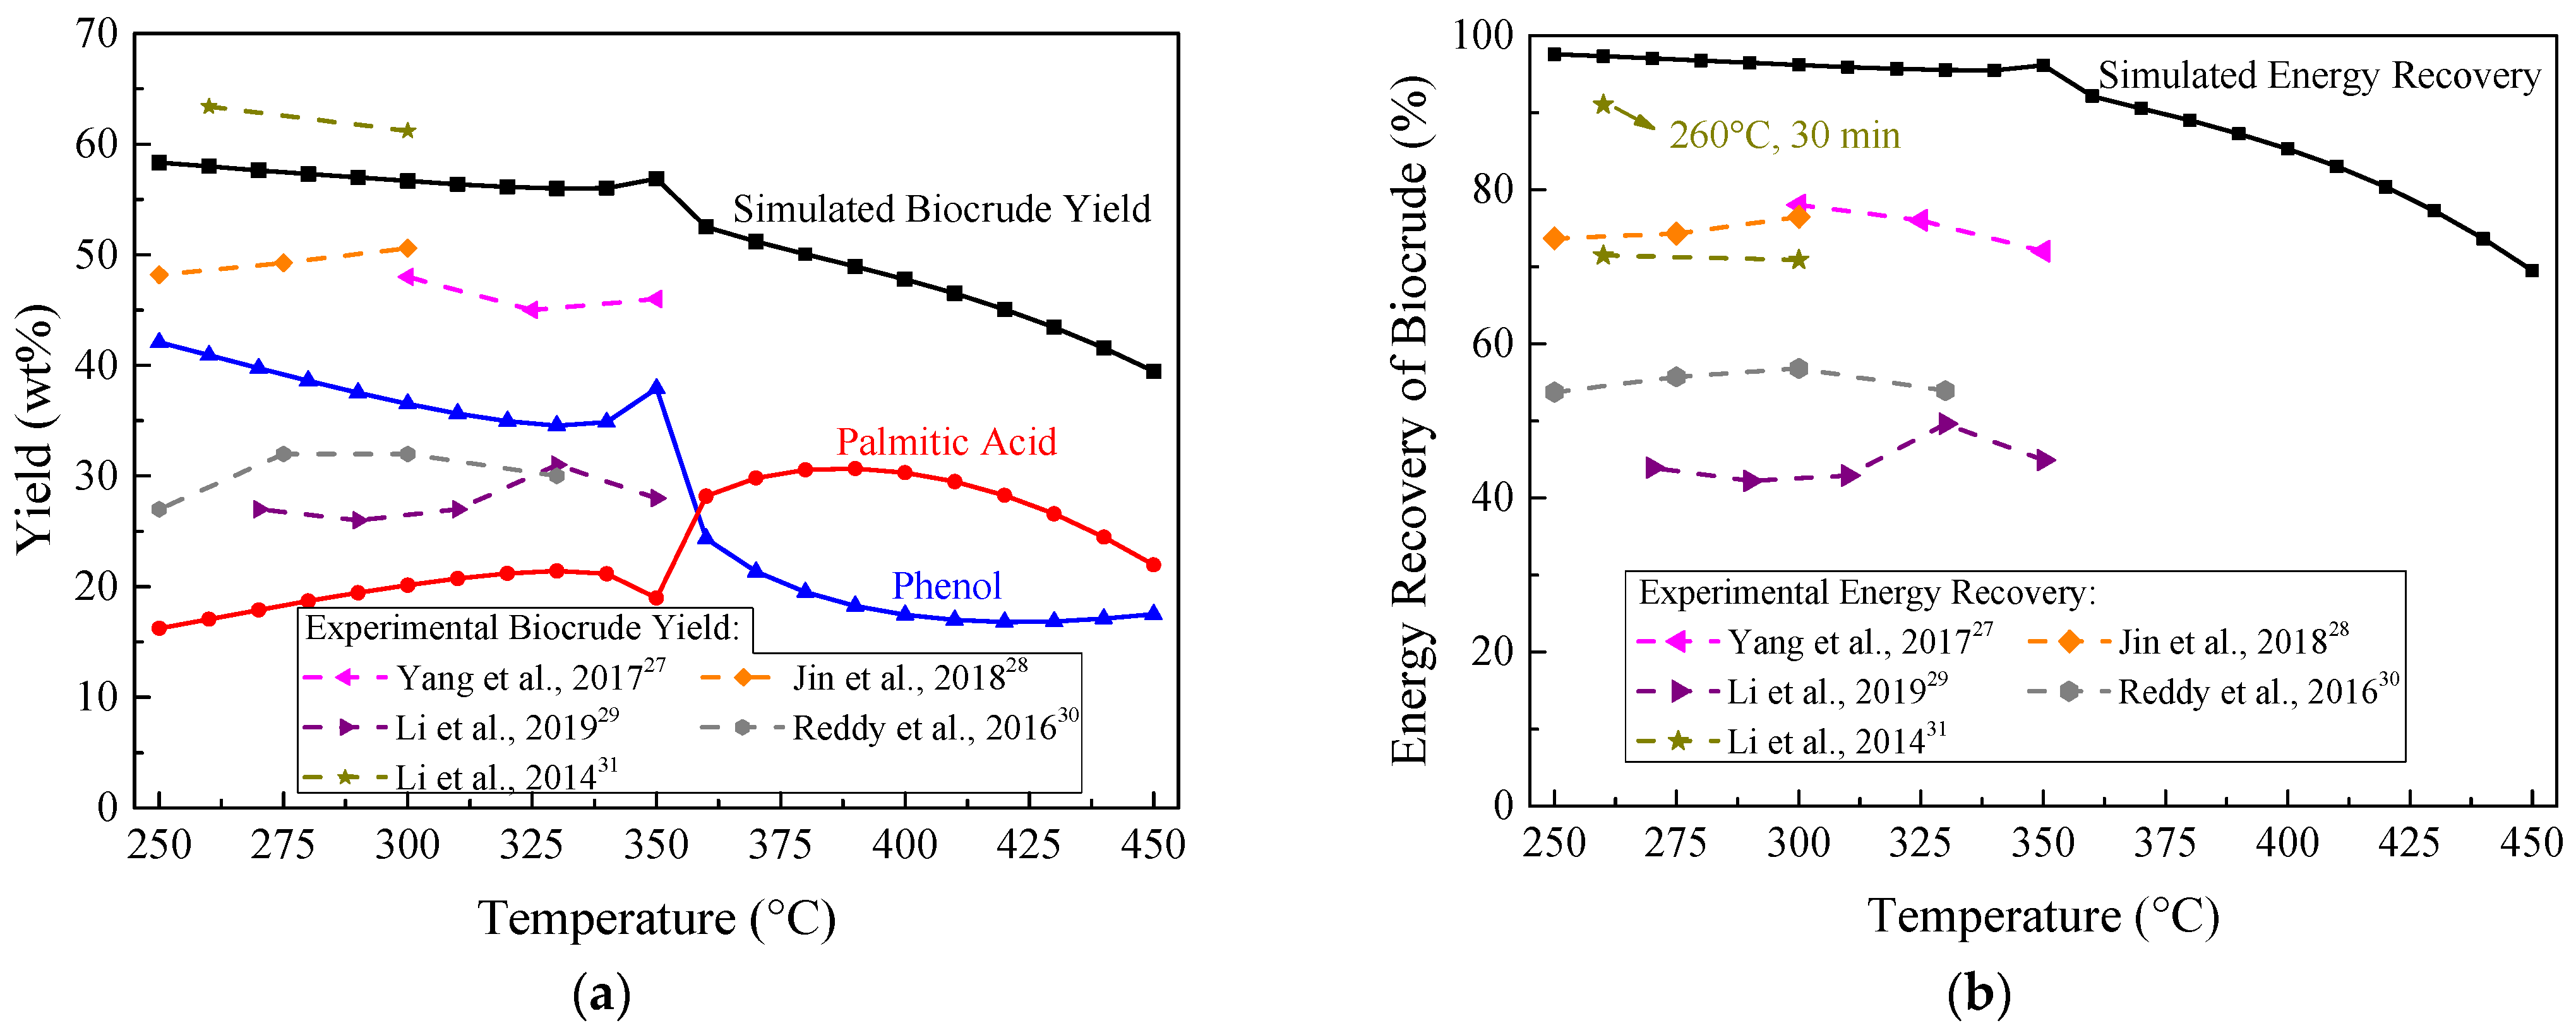
3.3. Effect of Temperature

Temperature significantly influences the HTL fraction products and determines the reaction pressure, which is generally regarded as the most important factor for HTL of biomass [5]. Table 2 summarizes the properties of Chlorella and the corresponding experimental biocrude yields in literature [27,28,29,30,31]. Experimental biocrude yields ranged from 26 wt% to 63.4 wt% due to differences in the properties of Chlorella, especially the lipid contents. When the lipid content of Chlorella increased from 6.22 wt% to 59.9 wt%, the experimental biocrude yield rose from 26–31 wt% to 61.2–63.4 wt%.
Figure 4 depicts the yield and energy recovery of biocrude with respect to the temperature rising from 250 to 350 °C at 20 MPa and with the moisture content of 80 wt%. We also compared the simulated biocrude yields and energy recoveries with experimental results from HTL of Chlorella in literature (see dashed lines in Figure 4). As shown in Figure 4a, at 250–350 °C, the simulated biocrude yield kept stable at about 56 wt%. This trend was similar to the experimental data, marked with dashed lines in Figure 4. It was observed that variations of experimental biocrude yields were all less than 5 wt% between 250 °C and 350 °C. When the temperature was higher than 350 °C, a rapid decrease in the biocrude yields could be observed because Chlorella underwent gasification reactions [32] and converted biocrude into gaseous products.
Phenolic compounds and organic acids in biocrude were formed by the hydrolysis of carbohydrates and lipids in Chlorella, respectively [33]. In Figure 4a, yields of palmitic acid and phenol present opposite trends between 250 °C and 330 °C. This outcome was consistent with literature [28], showing that with ascending temperature from 250 to 300 °C, the organic acid contents rose while the total phenol contents declined.
The simulated energy recovery of biocrude in Figure 4b remained stable at about 96% from 250 to 350 °C, which was close to the experimental values of 91% at 260 °C obtained by Li et al. [31]. Further increase in the temperature led to the energy partitioned into the gaseous products; hence, the energy recovery of biocrude noticeably reduced. Consequently, the HTL temperature should be controlled at 250–350 °C.

3.4. Determination of the Reactor Diameter

The insoluble solid particles, such as ash in biomass, may cause the plugging of the reactor. The deposition characteristics of these insoluble solids can guide the design of the continuous HTL reactor. According to the simulation results by Aspen Plus, it was supposed that the moisture content of Chlorella, the pressure, and the temperature were set at 80 wt%, 20 MPa, and 300 °C, respectively. Under these conditions, the simulated yield and energy recovery of biocrude were 56.7 and 96.2%. The insoluble particle size was assumed to be 50 μm [19].
The continuous HTL reactor is commonly a plug flow reactor with vertical and horizontal tubes. In a vertical transportation process, velocities of the insoluble solid particles should be higher than their settling flow velocities (ω), as shown in Equation (3) [34,35].
ω = 4 d g ( ρ s ρ w ) 3 C D ρ w
C D = 24 R e p ( 1 + 0.15 R e p 0.687 ) + 0.413 1 + 16,300 R e p 1.09 ( 2000 < R e p < 2 × 10 5 )
where d is the particle size (~5 × 10⁻⁵ m), ρs denotes the density of insoluble solids (~2500 kg·m−3), ρw defines the water density (734.71 kg·m−3 at 300 °C and 20 MPa), g is the gravitational acceleration (9.81 m·s−2), CD refers to the drag coefficient as shown in Equation (4), and Rep gives the Reynolds number of particles.
In a horizontal transportation process, velocities of the insoluble solid particles should be higher than their critical flow velocities (vc) to keep the particles suspended, which was calculated by the Durand equation (see Equation (5)). In a HTL process, vc was much higher than w, so the reactor diameter was determined by the critical flow velocity.
v c = F l 2 g D ( ρ s ρ w ) ρ w
where D is the reactor diameter, m, and Fl refers to the resistance coefficient, which is determined by the particle size and the volume fraction of insoluble solids [36].
Figure 5 depicts the critical diameters (Dc) that could avoid the deposition of insoluble particles at different flow rates (F). As shown in Equations (6) and (7), it was found that DcF0.4; hence, the critical diameter increased from 9 to 25 mm with the flow rate changing from 100 to 1000 kg·h−1. The University of Sydney established a continuous HTL pilot plant with the Chlorella flow rates between 15 and 90 L·h−1 [19]. The inner diameter (6.2 mm) in their reactor was similar to the critical diameter in Figure 5.
F = ρ A v = 1 4 ρ π D 2 v 1 4 ρ π D 2 v c = 1 4 ρ π D 2 F l 2 g D ( ρ s ρ w ) ρ w
D c = 8 F 2 ρ w π 2 ρ 2 F 1 2 ( ρ s ρ w ) g 5
where F, ρ, and v are the flow rate, density, and velocity of the feedstock, respectively; A and D are the sectional area and diameter of the HTL reactor; and Dc is the critical diameter.

4. Conclusions

A continuous hydrothermal liquefaction model was developed by Aspen Plus to predict the thermodynamic equilibrium yield and energy recovery of biocrude produced with different moisture contents (70–99 wt%) of Chlorella at 10–30 MPa and 250–450 °C. At a thermodynamic equilibrium state, over 56 wt% biocrude yield and 96 wt% energy recovery can be achieved by Chlorella with 80 wt% moisture content at 20 MPa and 300 °C. To avoid the deposition of insoluble particles in biomass, the reactor diameter should be smaller than the critical diameters, which were demonstrated to be proportional to the flow rate to the power of 0.4.

Author Contributions

Conceptualization, L.Q.; methodology, L.Q.; software, L.Q. and Z.X.; validation, Z.X.; formal analysis, J.N.; investigation, B.Y.; resources, L.Q. and D.X.; data curation, J.N.; writing—original draft preparation, L.Q.; writing—review and editing, S.W.; visualization, L.Q.; supervision, L.Q.; project administration, L.Q.; funding acquisition, L.Q. and H.G. All authors have read and agreed to the published version of the manuscript.

Funding

This research was funded by the Natural Science Foundation of Jiangsu Province, China, grant numbers BK20190843, BK20210757; the Natural Science Research of Jiangsu Higher Education Institutions of China, grant number 19KJB480002; the Innovative and Entrepreneurial Doctor Project of Jiangsu Province, China; and the Start-up Foundation of Jiangsu University, China, grant number 20JDG057.

Institutional Review Board Statement

Not applicable.

Informed Consent Statement

Not applicable.

Data Availability Statement

Not applicable.

Conflicts of Interest

The authors declare no conflict of interest.

References

  1. Pehl, M.; Arvesen, A.; Humpenöder, F.; Popp, A.; Hertwich, E.G.; Luderer, G. Understanding future emissions from low-carbon power systems by integration of life-cycle assessment and integrated energy modelling. Nat. Energy 2017, 2, 939–945. [Google Scholar] [CrossRef]
  2. Zhao, B.; Hu, Y.; Gao, J.; Zhao, G.; Ray, M.B.; Xu, C.C. Recent Advances in hydroliquefaction of biomass for bio-oil production using in situ hydrogen donors. Ind. Eng. Chem. Res. 2020, 59, 16987–17007. [Google Scholar] [CrossRef]
  3. Gollakota, A.R.K.; Kishore, N.; Gu, S. A review on hydrothermal liquefaction of biomass. Renew. Sustain. Energy Rev. 2018, 81, 1378–1392. [Google Scholar] [CrossRef]
  4. Wang, S.; Zhao, S.; Cheng, X.; Qian, L.; Barati, B.; Gong, X.; Cao, B.; Yuan, C. Study on two-step hydrothermal liquefaction of macroalgae for improving bio-oil. Bioresour. Technol. 2021, 319, 124176. [Google Scholar] [CrossRef]
  5. Basar, I.A.; Liu, H.; Carrere, H.; Trably, E.; Eskicioglu, C. A review on key design and operational parameters to optimize and develop hydrothermal liquefaction of biomass for biorefinery applications. Green Chem. 2021, 23, 1404–1446. [Google Scholar] [CrossRef]
  6. Madsen, R.B.; Glasius, M. How do hydrothermal liquefaction conditions and feedstock type influence product distribution and elemental composition? Ind. Eng. Chem. Res. 2019, 58, 17583–17600. [Google Scholar] [CrossRef]
  7. Li, H.; Zhu, Z.; Lu, J.; Watson, J.; Kong, D.; Wang, K.; Zhang, Y.; Liu, Z. Establishment and performance of a plug-flow continuous hydrothermal reactor for biocrude oil production. Fuel 2020, 280, 118605. [Google Scholar] [CrossRef]
  8. Hansen, N.H.; Pedersen, T.H.; Rosendahl, L.A. Techno-economic analysis of a novel hydrothermal liquefaction implementation with electrofuels for high carbon efficiency. Biofuel Bioprod. Bior. 2019, 13, 660–672. [Google Scholar] [CrossRef]
  9. Lozano, E.M.; Pedersen, T.H.; Rosendahl, L.A. Modeling of thermochemically liquefied biomass products and heat of formation for process energy assessment. Appl. Energy 2019, 254, 113654. [Google Scholar] [CrossRef]
  10. Ong, B.H.Y.; Walmsley, T.G.; Atkins, M.J.; Walmsley, M.R.W. Hydrothermal liquefaction of Radiata Pine with Kraft black liquor for integrated biofuel production. J. Clean Prod. 2018, 199, 737–750. [Google Scholar] [CrossRef]
  11. Hoffmann, J.; Rudra, S.; Toor, S.S.; Holm-Nielsen, J.B.; Rosendahl, L.A. Conceptual design of an integrated hydrothermal liquefaction and biogas plant for sustainable bioenergy production. Bioresour. Technol. 2013, 129, 402–410. [Google Scholar] [CrossRef]
  12. Elliott, D.C.; Biller, P.; Ross, A.B.; Schmidt, A.J.; Jones, S.B. Hydrothermal liquefaction of biomass: Developments from batch to continuous process. Bioresour. Technol. 2015, 178, 147–156. [Google Scholar] [CrossRef] [Green Version]
  13. Wagner, J.L.; Le, C.D.; Ting, V.P.; Chuck, C.J. Design and operation of an inexpensive, laboratory-scale, continuous hydrothermal liquefaction reactor for the conversion of microalgae produced during wastewater treatment. Fuel Process. Technol. 2017, 165, 102–111. [Google Scholar] [CrossRef] [Green Version]
  14. Ranganathan, P.; Savithri, S. Computational Fluid Dynamics simulation of hydrothermal liquefaction of microalgae in a continuous plug-flow reactor. Bioresour. Technol. 2018, 258, 151–157. [Google Scholar] [CrossRef]
  15. Leng, L.; Li, J.; Wen, Z.; Zhou, W. Use of microalgae to recycle nutrients in aqueous phase derived from hydrothermal liquefaction process. Bioresour. Technol. 2018, 256, 529–542. [Google Scholar] [CrossRef] [PubMed]
  16. Parvez, A.M.; Wu, T.; Hong, Y.; Chen, W.; Lester, E.H.; Mareta, S.; Afzal, M. Gasification reactivity and synergistic effect of conventional and microwave pyrolysis derived algae chars in CO2 atmosphere. J. Energy Inst. 2019, 92, 730–740. [Google Scholar] [CrossRef]
  17. Gai, C.; Zhang, Y.; Chen, W.; Zhang, P.; Dong, Y. An investigation of reaction pathways of hydrothermal liquefaction using Chlorella pyrenoidosa and Spirulina platensis. Energy Convers. Manag. 2015, 96, 330–339. [Google Scholar] [CrossRef]
  18. Zhang, J.; Luo, Z.; Zhang, Y. Hydrothermal liquefaction of Chlorella pyrenoidosa in water and ethanol. T. ASABE 2013, 56, 253–259. [Google Scholar] [CrossRef]
  19. Jazrawi, C.; Biller, P.; Ross, A.B.; Montoya, A.; Maschmeyer, T.; Haynes, B.S. Pilot plant testing of continuous hydrothermal liquefaction of microalgae. Algal Res. 2013, 2, 268–277. [Google Scholar] [CrossRef] [Green Version]
  20. Qian, L.; Wang, S.; Savage, P.E. Fast and isothermal hydrothermal liquefaction of sludge at different severities: Reaction products, pathways, and kinetics. Appl. Energy 2020, 260, 114312. [Google Scholar] [CrossRef]
  21. Sangon, S.; Ratanavaraha, S.; Ngamprasertsith, S.; Prasassarakich, P. Coal liquefaction using supercritical toluene–tetralin mixture in a semi-continuous reactor. Fuel Process. Technol. 2006, 87, 201–207. [Google Scholar] [CrossRef]
  22. Lu, Y.; Guo, L.; Ji, C.; Zhang, X.; Hao, X.; Yan, Q. Hydrogen production by biomass gasification in supercritical water: A parametric study. Int. J. Hydrogen Energy 2006, 31, 822–831. [Google Scholar] [CrossRef]
  23. Qian, L.; Wang, S.; Wang, S.; Zhao, S.; Zhang, B. Supercritical water gasification and partial oxidation of municipal sewage sludge: An experimental and thermodynamic study. Int. J. Hydrogen Energy 2021, 46, 89–99. [Google Scholar] [CrossRef]
  24. Guo, Y.; Song, W.; Lu, J.; Ma, Q.; Xu, D.; Wang, S. Hydrothermal liquefaction of Cyanophyta: Evaluation of potential bio-crude oil production and component analysis. Algal Res. 2015, 11, 242–247. [Google Scholar] [CrossRef]
  25. Chan, Y.H.; Yusup, S.; Quitain, A.T.; Tan, R.R.; Sasaki, M.; Lam, H.L.; Uemura, Y. Effect of process parameters on hydrothermal liquefaction of oil palm biomass for bio-oil production and its life cycle assessment. Energy Convers. Manag. 2015, 104, 180–188. [Google Scholar] [CrossRef]
  26. Faeth, J.L.; Savage, P.E. Effects of processing conditions on biocrude yields from fast hydrothermal liquefaction of microalgae. Bioresour. Technol. 2016, 206, 290–293. [Google Scholar] [CrossRef] [PubMed] [Green Version]
  27. Yang, J.H.; Shin, H.Y.; Ryu, Y.J.; Lee, C.G. Hydrothermal liquefaction of Chlorella vulgaris: Effect of reaction temperature and time on energy recovery and nutrient recovery. J. Ind. Eng. Chem. 2018, 68, 267–273. [Google Scholar] [CrossRef]
  28. Jin, M.; Oh, Y.K.; Chang, Y.K.; Choi, M. Optimum utilization of biochemical components in Chlorella sp. KR1 via subcritical hydrothermal liquefaction. ACS Sustain. Chem. Eng. 2017, 5, 7240–7248. [Google Scholar] [CrossRef]
  29. Li, H.; Liu, Z.; Wang, M.; Lu, J.; Bultinck, T.; Wang, Y.; Wang, X.; Zhang, Y.; Lu, H.; Duan, N.; et al. Hydrothermal conversion of anaerobic wastewater fed microalgae: Effects of reaction temperature on products distribution and biocrude properties. IET Renew. Power Gener. 2019, 13, 2215–2220. [Google Scholar] [CrossRef]
  30. Reddy, H.K.; Muppaneni, T.; Ponnusamy, S.; Sudasinghe, N.; Pegallapati, A.; Selvaratnam, T.; Seger, M.; Dungan, B.; Nirmalakhandan, N.; Schaub, T.; et al. Temperature effect on hydrothermal liquefaction of Nannochloropsis gaditana and Chlorella sp. Appl. Energy 2016, 165, 943–951. [Google Scholar] [CrossRef] [Green Version]
  31. Li, H.; Liu, Z.; Zhang, Y.; Li, B.; Lu, H.; Duan, N.; Liu, M.; Zhu, Z.; Si, B. Conversion efficiency and oil quality of low-lipid high-protein and high-lipid low-protein microalgae via hydrothermal liquefaction. Bioresour. Technol. 2014, 154, 322–329. [Google Scholar] [CrossRef] [PubMed]
  32. Duan, P.; Li, S.; Jiao, J.; Wang, F.; Xu, Y. Supercritical water gasification of microalgae over a two-component catalyst mixture. Sci. Total Environ. 2018, 630, 243–253. [Google Scholar] [CrossRef] [PubMed]
  33. Kiran Kumar, P.; Vijaya Krishna, S.; Verma, K.; Pooja, K.; Bhagawan, D.; Srilatha, K.; Himabindu, V. Bio oil production from microalgae via hydrothermal liquefaction technology under subcritical water conditions. J. Microbiol. Methods 2018, 153, 108–117. [Google Scholar] [CrossRef] [PubMed]
  34. Xu, H.; Xie, Q.; Wu, B.; Zhao, H.; Xu, S. Numerical simulation and analysis of gas hydrate mining pipe hydraulic lifting. J. Cent. South Univ. (Sci. Technol.) 2015, 46, 4062–4069. (In Chinese) [Google Scholar]
  35. Chen, G.; Yang, N.; Tang, D.; Jin, X.; Xiao, H. Study on the settling regularity of solid particles in vertical pipelines. J. Sediment Res. 2010, 4, 16–21. (In Chinese) [Google Scholar]
  36. Fu, S.; Sun, G.; Gao, C. Effect of condition parameters of gas drilling on critical flow rate of material discharge. Oil Field Eq. 2009, 38, 27–30. (In Chinese) [Google Scholar]
Figure 1. A continuous system for hydrothermal liquefaction of Chlorella.
Energies 14 06602 g001
Figure 2. Effect of moisture content on: (a) biocrude yield; (b) energy recovery at 350 °C and 20 MPa.
Energies 14 06602 g002
Figure 3. Effect of pressure on: (a) biocrude yield; (b) energy recovery at 350 °C and with 80 wt% moisture content.
Energies 14 06602 g003
Figure 4. Effect of temperature on: (a) biocrude yield; (b) energy recovery at 20 MPa and with 80 wt% moisture content.
Energies 14 06602 g004
Figure 5. The critical diameter of the reactor at different flow rates of Chlorella (300 °C, 20 MPa, and 80 wt% moisture content).
Energies 14 06602 g005
Table 1. Proximate and ultimate analyses of Chlorella on a dry basis [16].
Moisture Content (wt%)Proximate Analysis (wt%)Ultimate Analysis (wt%)HHV 2/MJ·kg−1
Volatile Fixed CarbonAshCHO 1NS
8072.918.48.747.46.527.88.80.820.47
1 By difference: O=100-C-H-N-S-Ash; 2 Estimated by the Dulong Formula: higher heating value (HHV) = 0.3383C + 1.443(H-O/8) + 0.0927S.
Table 2. Properties of Chlorella and experimental biocrude yields in literature [27,28,29,30,31].
Moisture Content (wt%)Elemental Analysis (wt%)Biochemical Analysis (wt%)Temperature (°C)Biocrude Yield (wt%)Reference
CHONSLipidProteinCarbohydrateAsh
8048.57.035.08.50.218.754.024.33.0300–35045–48[27]
9553.628.1035.082.590.6136.5822.1736.125.13250–30048.2–50.6[28]
8546.447.2424.238.75-6.2253.819.7913.1270–35026–31[29]
90.9-----10.744.6242.882.50250–33027–32[30]
75–8560.59.121.81.9 59.99.325.94.9260–30061.2–63.4[31]
Publisher’s Note: MDPI stays neutral with regard to jurisdictional claims in published maps and institutional affiliations.

