1. Introduction
Methane/oxygen is one of the most promising propellants of spacecraft, which has the advantages of excellent performance, low price, and low carbon emissions [
1]. System security issues in the energy production and aerospace fields cannot be ignored [
2,
3]. In order to improve the safety and reliability of ignition, it is necessary to study the propagation of the flame kernel and the shock wave in the combustion process of engines.
In recent years, more and more attention has been paid to laser-induced plasma ignition (LIPI) thanks to the great innovation of laser technology. Compared to conventional spark ignition, this new technique enables the high-precision control of ignition timing. Besides, multi-point ignition is feasible due to the flexible ignition position, which reduces the possibility of misfire and ignition delay [
4]. Furthermore, the non-intrusive configuration eliminates the radiation and heat transfer caused by the existence of electrodes [
5]. Several studies of LIPI have been conducted. Bradley et al. [
6] studied the laser ignition of gaseous fuels and recorded the development of the flame kernel and the propagation of the shock wave for the first time using a high-speed camera, and analyzed the formation of the third-lobe with gas dynamics theory in detail. Xu et al. [
7] studied the flame kernel of ethanol/oxygen mixture and compared the difference of velocities in different directions. The rarefaction wave generated by plasma caused the change in gas density gradient and pressure near the plasma, interacts with the high-temperature gas and produces local flow, leading to an annular structure from the left and right sides [
6,
8,
9]. The structure created by the rarefaction wave forms the third-lobe, and the leading edge of the structure decays rapidly. In addition, numerical simulation of the annular structure was also performed [
10,
11,
12]. From a gas dynamics perspective, Spiglanin et al. [
13] believed that the third-lobe was created by the change of local flow velocity due to excessive expansion. Raizer et al. [
14] found that the laser-induced plasma made the ionization front depart from the focus and move in the direction of laser.
Wohlhüter et al. [
15] conducted numerical simulation and experimental study on the peak pressure of methane/oxygen mixture using laser ignition in a combustion chamber. Dumitrache et al. [
16] studied the flammability limit and minimum ignition energy of methane/air mixture in a rapid compression machine. Optical diagnostics, including the schlieren technique, shadow technique and spectral analysis were used to study the kernel structure and combustion of laser ignition; thereby, the detailed process of flame development could be obtained [
17]. Leela et al. [
18] used an Intensified Charge Coupled Device (ICCD) camera to study the development of laser-induced plasma in air and observed the self-radiation of plasma. They believed that when the energy is high enough, the leading edge of the laser beam first reached the breakdown threshold and produced plasma and the beam interacted with the trailing edge of the plasma later, creating two kernels. Shen et al. [
19] found that the leading and trailing edges of the laser beam focused in two different positions in the direction of propagation, thus created two breakdown points.
In addition to the propagation of flame kernel, the theory of explosive waves when LIPI occurs has been studied. The strong blast wave formed by solar flares will decay into a medium-strength shock wave after reaching the earth. Besides, the strong shock wave formed by natural activities such as lightning discharge will attenuate to a medium-strength shock wave after propagating a distance of 5 mm. In fact, in about 99.5% of the propagation distance, the shock wave propagates at a medium intensity.
Many investigations have studied the generation and propagation of explosive waves. Taylor [
9] proposed the similarity solution theory of strong explosion waves in 1951. The study ignored the impact of ionization and excitation on shock waves, and then obtained the relationship between radius, velocity, temperature and pressure of the shock wave [
5,
8,
9], but this theory was only applicable when the ratio of the shock wave pressure (
PS) to the ambient pressure (
P0) was greater than 10. Then, Taylor, Sakurai and Lin et al. [
20,
21] respectively proposed the similarity to solve the cylindrical explosion wave theory. Many researchers have verified the accuracy of Taylor’s explosive wave theory through experiments, which can predict the early development of LIPI hot gas nuclei and shock waves. After that, Gatti et al. [
22], in 1988, conducted a study on the evolution of LIPI spherical shock waves with time in different medium gases. Based on the Taylor blast wave model, they proposed a simplified relationship for calculating the shock radius and shock Mach number. After comparing the calculation results of the above relationship with the experimental data, they found that they were in good agreement. After research by Sedov [
23], it was found that the self-similarity solution theory was not suitable for medium-intensity explosion waves; in fact, the best method was a series expansion theory. However, Sakurai [
21] proposed the series expansion of cylindrical medium-strength explosion waves and found that the series converged very slowly, especially when the pressure of the explosion wave was low. Jones [
24] proposed a relational formula suitable for the calculation of medium-intensity spherical shock waves
R and
PS. Peters et al. [
25] also verified the accuracy of Jones’s explosion wave theory through experiments. They found that, compared with Taylor’s explosion wave theory, Jones’s explosion wave theory could still perform well at 10 μs after the formation of hot gas nuclei and shock wave.
It is worth noting that Jones [
24] believed that the key problem of solving strong explosion waves was determining the energy actually used to drive the shock wave propagation (the energy coupled into the shock,
E0). Only when
E0 is determined is it possible to accurately calculate the wave radius
R and wave front pressure
PS. After certificating the value of
R and
PS,
E0 can be deduced. In the simplified relationship proposed by Gattihe et al., it is believed that all the energy absorbed by the plasma was used to drive the shock wave propagation, and other energy losses were not considered. When Peter et al. used Taylor blast wave theory and Jones blast wave theory to calculate the shock radius, they believed that 90% of the energy absorbed by the plasma was used to drive the shock wave propagation. According to the research of Taylor and Phuoc, it was known that the energy absorbed by the plasma would not be used to drive the shock wave propagation.
Although previous articles had studied the factors that affect the morphology of LIPI flame kernels, most of the research had focused on the effects of pressure, laser energy and equivalence ratio; thus, the influence of oxygen content on the morphology of the flame kernel remains to be explored. In addition, for the process of the LIPI generation shock wave, although the research was early and a variety of models had been proposed, they were not suitable for the experimental conditions of this paper. Therefore, this paper also proposes a modified model based on the Jones model, and compares it with the Taylor model and the Jones model, in order to systematically study the impact of different factors on the characteristics of the shock wave and the flame kernel in the LIPI.
2. Experiment Methods
2.1. Experimental Setup
The experiment is carried out in a constant volume combustion chamber and the experimental system is shown in
Figure 1, which is mainly composed of a constant volume combustion chamber, a high-speed shadow system, an ignition system, a gas distribution system, a data acquisition system, and a timing control system.
The constant volume combustion chamber cavity used was a stainless-steel cylinder with an inner diameter of 100 mm, a length of 100 mm, and a volume of 0.86 L (including a part of the pipeline), with two quartz glass windows on each of its axial and radial ends. The diameter of the axial window was 100 mm, which was used to shoot flame images; The diameter of the radial window was 25 mm, which was used for focusing the laser beam and collecting the remaining laser beam energy. A pressure transmitter (Rosemount 3051TA) was installed on the top of the constant volume combustion chamber to measure the static pressure of the air intake. In addition, the piezoelectric pressure sensor (Kistler 7001) was used to measure pressure fluctuations during the combustion process, which was installed at the bottom of the combustion chamber, and its pressure diaphragm was flush with the inner surface of the combustion chamber cavity.
The laser ignition system used a Nd:YAG lamp pumped nanosecond Q-switched laser (Grace NASOR800); three wavelengths of 355 nm/532 nm/1064 nm could be selected, and 532 nm was used in this article (RMS < 1.2%). The laser pulse energy was adjusted by an energy attenuator on the external optical path, which was composed of a half-wave plate and a polarizer. The measurement of laser pulse energy was mainly realized through a beam splitter and two energy meters (Coherent, model: J-50-MB-YAG and J-25-MB-LE). The laser beam could be divided into two beams of a certain proportion by the beam splitter, and by measuring one beam, the energy of the other laser beam could be known. The incident laser energy was measured by a spectroscope and an energy meter, while the remaining energy of the laser was measured by another energy meter.
The high-speed shadow camera system consisted of an LED light source, lens and high-speed camera (Phantom v2511). According to the difference of experimental conditions, the high-speed camera selected two frame rates and corresponding frames. When studying the impact of equivalence ratio on shock wave, the selected high-speed camera had a frame rate of 245,000 and a frame size of 768 × 112 pixels. In other experimental conditions, the high-speed camera had a frame rate of 138,000 and a frame of 768 × 208 pixels.
2.2. Experimental Conditions
According to the research on shock wave theory, the main factors affecting the development of shock wave are laser energy, environmental pressure and gas composition. Therefore, the influence of these parameters on the shock wave characteristics as well as the flame kernel will be studied by changing the initial pressure, laser energy, equivalence ratio, and oxygen content.
The initial temperature of the experiment is 298 K, and the experimental conditions are shown in
Table 1. In order to ensure the accuracy and reliability of the experimental data, each working condition is repeated at least twice. The purity of methane, oxygen and nitrogen in the experiment are 99.99%. The laser energy values in
Table 1 are obtained by averaging the laser energy multiple times by adjusting the settings of the laser, gradually making the average value of the multiple laser energy close to the laser energy required for the experiment. It should be noted that in order to ensure that the laser energy incident in the combustion chamber is consistent with the experimental conditions, the laser energy here takes into account the loss of quartz glass.
2.3. Data Processing
The radius and velocity of the shock wave could be calculated based on the pictures.
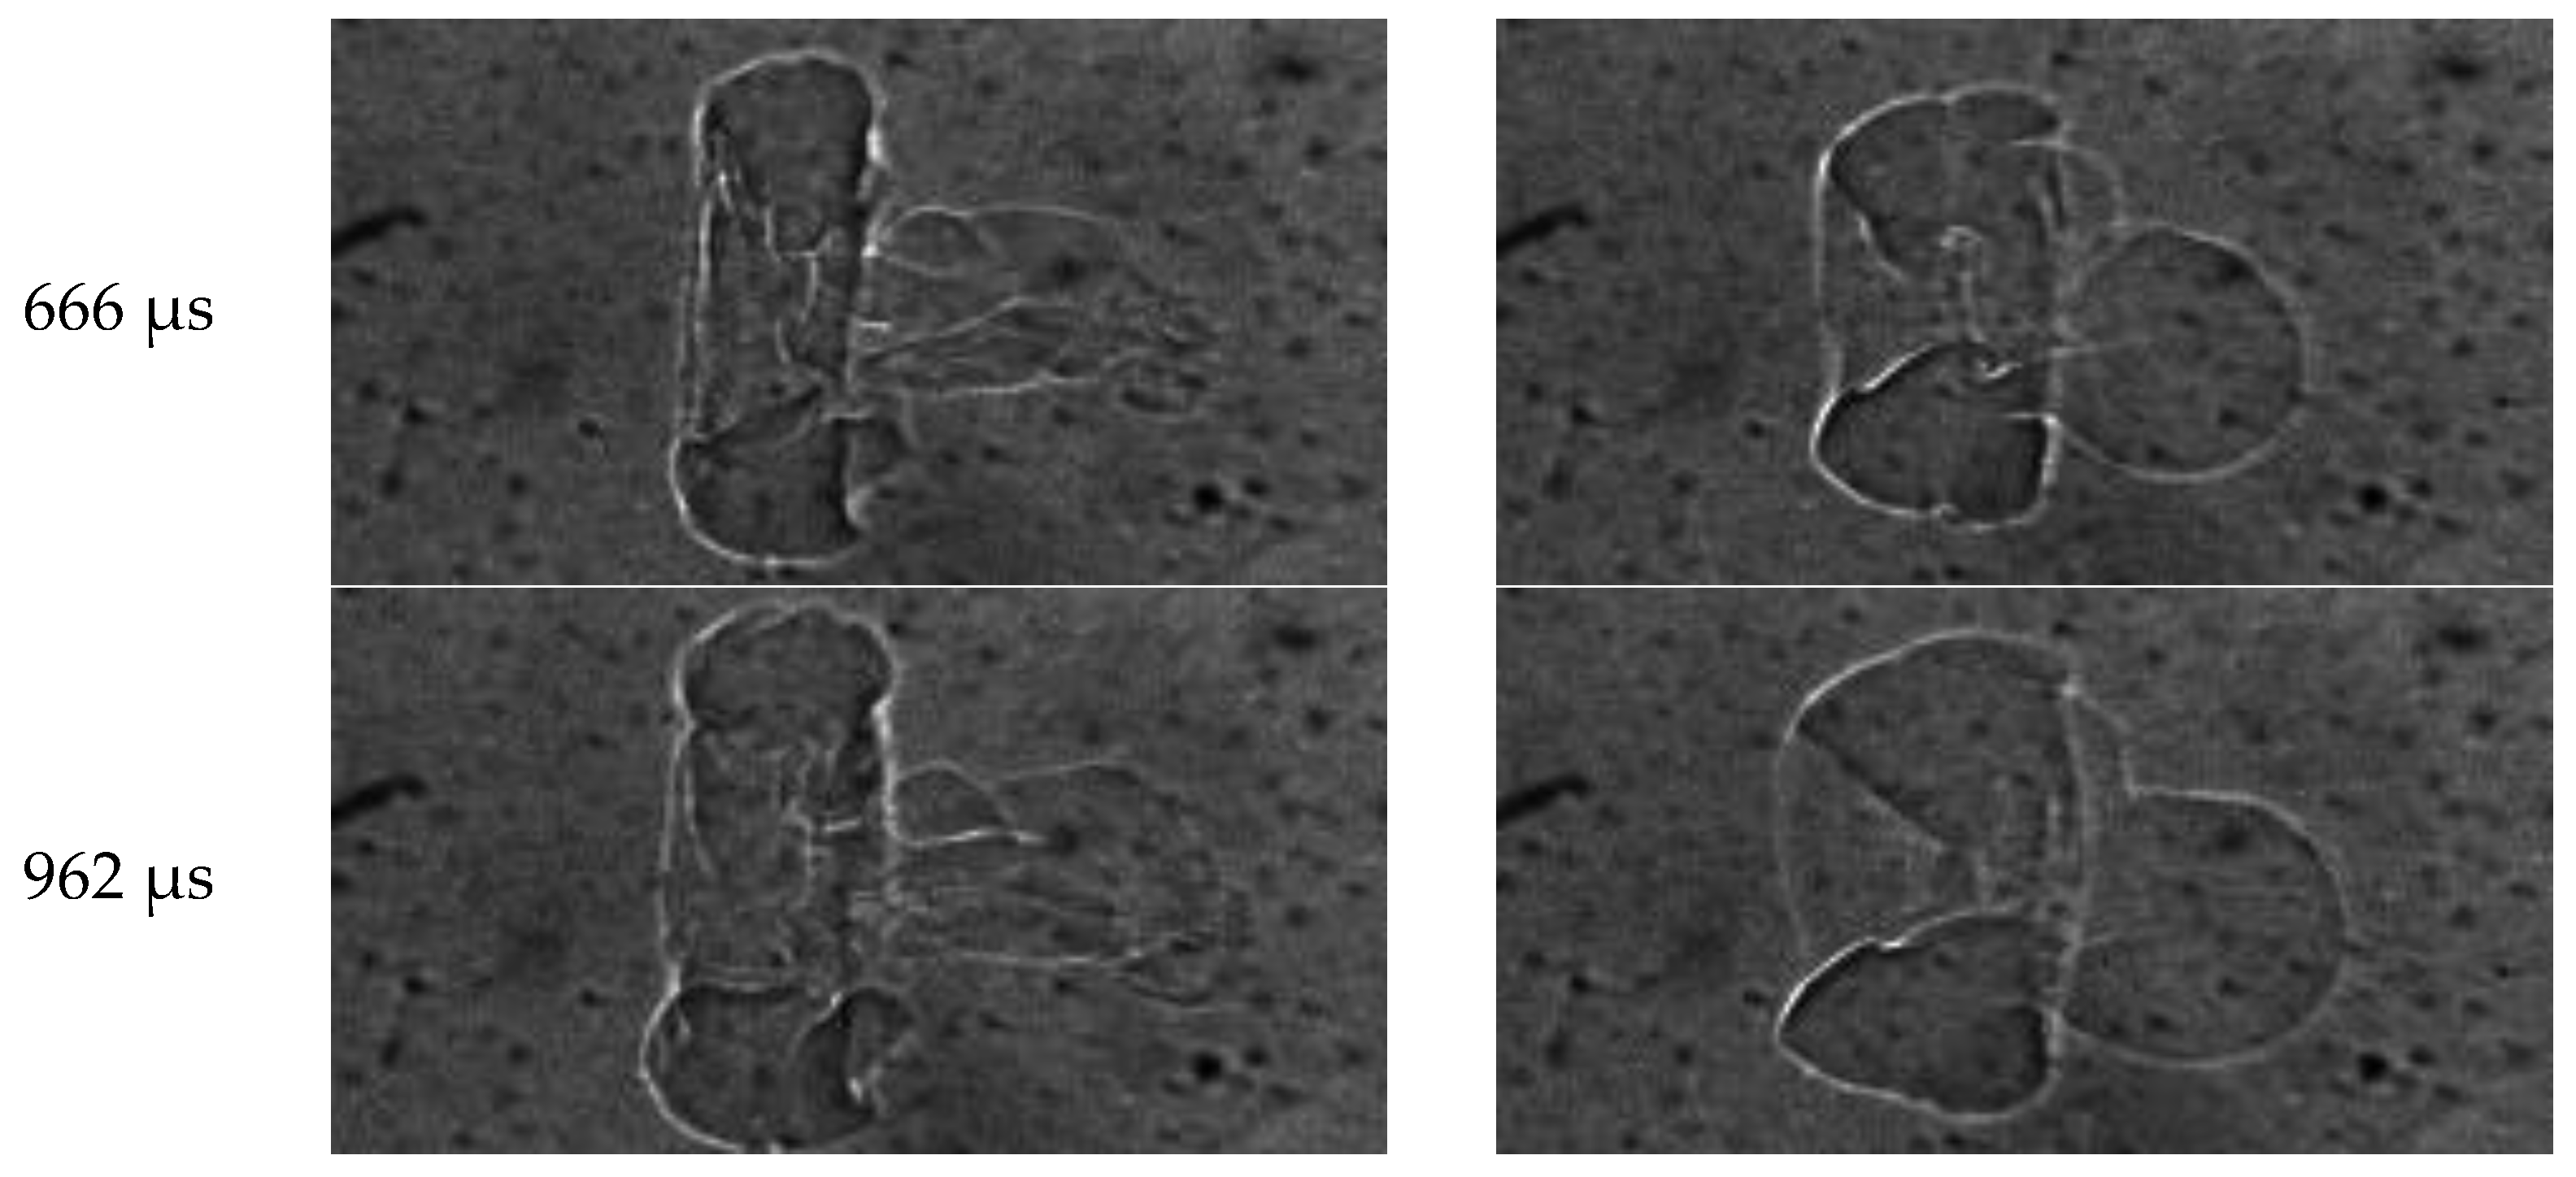
Figure 2 shows the flame kernel and shock wave of the CH
4/O
2 mixture LIPI. The center area was the flame kernel and the outer contour was the shock wave. The cone-shaped structure on the left side of the flame kernel was determined by the characteristics of LIPI, which will be analyzed in detail below. In fact, the shape of the flame kernel directly affected the initial shape of the shock wave, which was the cause of the bulge on the left side of the shock wave, where the bulge direction of the shock wave was consistent with the incident direction of the laser. It was worth noting that the position and size of the plasma formed by laser ignition changed each time, there was a certain deviation between each other. Because the shock wave was generated by the instantaneous heat release of the plasma, its shape and center point position would be affected by the plasma energy. In order to facilitate the calculation of the shock wave velocity, a set of shock wave pictures were obtained in each experimental condition, and the position of the geometric center point needed to be determined separately. First, the position of the geometric center point of the shock wave in the first picture was determined, and the geometric center points in the other pictures were the same as the first picture, so that the geometric center in each experiment could be determined. As shown in
Figure 2, the intersection of the vertical lines of the shock wave in the Y+ and X+ directions was determined as the geometric center point.
Due to the limitation of the high-speed camera frame, the number of shock waves obtained in the Y+ and Y− directions is lower. By comparing the radius and velocity of the shock wave of methane/oxygen LIPI in the four directions with the initial pressure of 2.5 atm, it could be found that the radius and velocity of the shock wave in the X−, X+, Y− and Y+ directions were basically the same, so this paper mainly studied the change of the radius and velocity of the shock wave in the X− and X+ direction. The radius could be obtained by measuring the distance from the boundary of the shock wave to the center point, and the shock wave velocity could be calculated according to the differentiation of the shock wave radius with respect to time.
2.4. Models
In order to simplify the calculations, the Taylor explosion wave model and the Jones explosion wave model had been sorted out and simplified, obtaining the following equations:
where,
—local speed of sound/mm·μs
−1;
—shock wave propagation radius/mm;
—shock wave propagation time/μs;
—medium specific heat ratio;
—energy of driving shock wave propagation/mJ;
—environmental pressure/atm; and
—relevant to
.
In this paper, after linear fitting of and calculated by Peters [
25], the following equations were obtained:
where,
—shock wave propagation radius/mm;
—energy of driving shock wave propagation/J;
—shock wave propagation time/μs;
—density of surrounding gas/Kg·m
−3;
—medium specific heat ratio; and
—the dimensionless parameter obtained from the equation of motion, which is approximately 1.
Among them, Equation (1) was the Jones simplified model, and Equation (3) was the Taylor simplified model.
E0 was calculated as 80% of the energy absorbed by the plasma, and which was 85% of the difference value between the incident laser energy and the remaining energy, so
E0 was equal to 68% of the energy difference [
8]. The basic parameter values of the model with different experimental conditions were shown in
Table 2.
In this paper, by calculating the Jones explosion wave model and the Taylor explosion wave model, the curve of shock wave radius and velocity with time with different experimental conditions could be obtained; the results were compared with the experimental data. The calculation results of the Taylor model had great deviations from the experimental data, while the Jones model fits the experimental data relatively well, but there were still deviations. Therefore, this paper proposed a modified model Equation (4) based on the Jones model.
This model was derived by fitting the experimental data of CH
4/O
2 mixture with pressure of 2.5 atm. In this paper, the Jones model was used as the curve fitting function, and the two numbers 0.543 and 0.4 in Equation (1) were determined as variables. Then, by continuously adjusting these two variables, the curve fitting function with the best fitting effect was obtained:
3. Results and Discussions
The LIPI shock wave and flame kernel of the CH
4/O
2 mixture at initial temperature 298 K is shown in
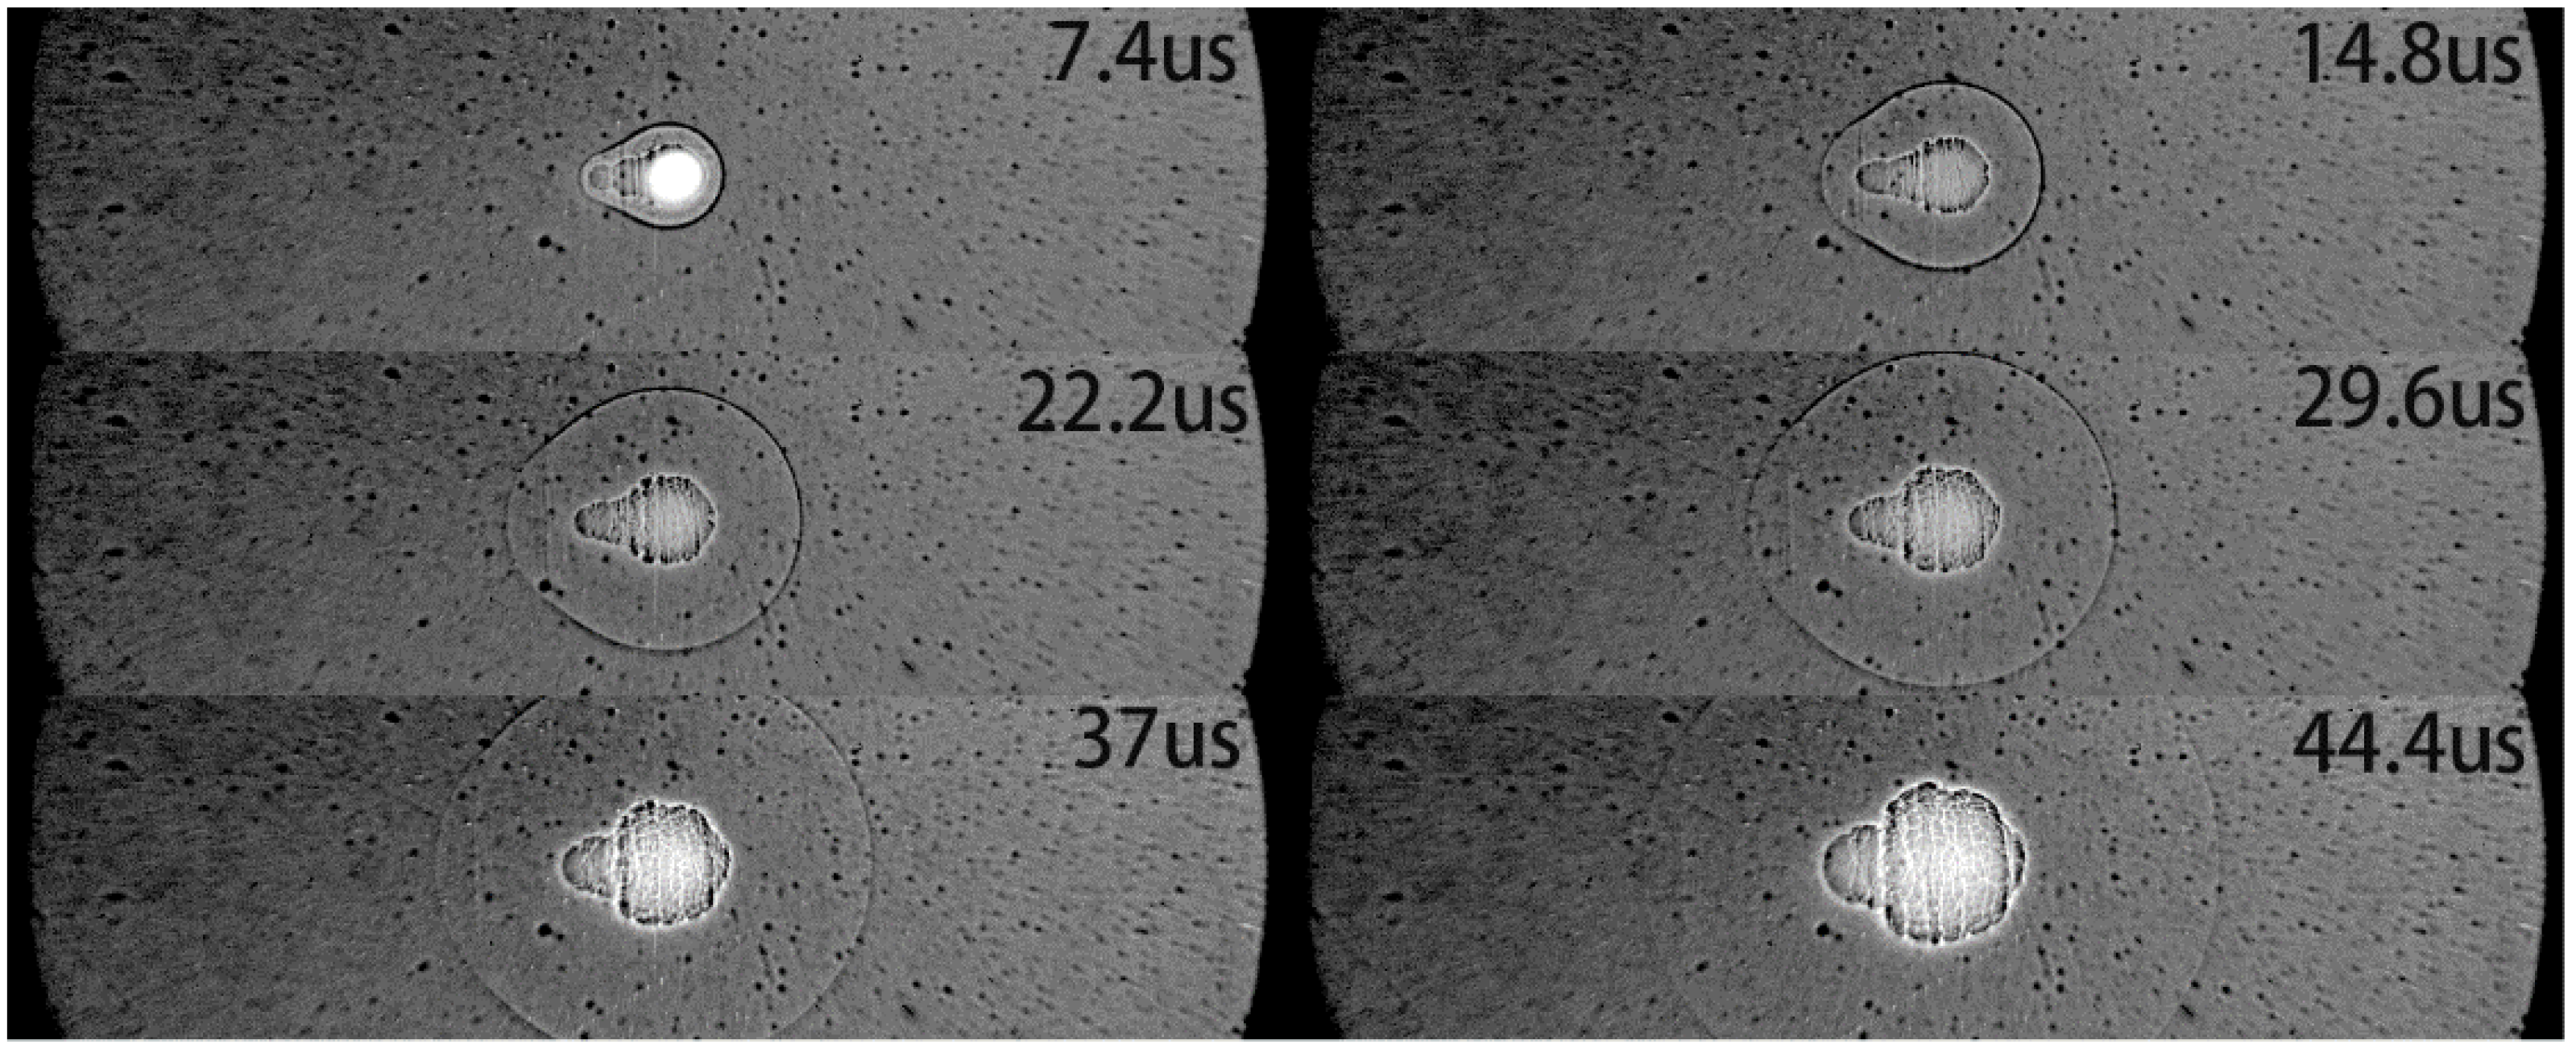
Figure 3, with initial pressure of 2.5 atm, and an equivalence ratio of 1. The first picture is taken 7.4 μs after the camera is triggered; it can be seen that there is still a strong plasma signal in the central area. At the same time, a more obvious flame kernel and shock wave boundary can be observed, but the shape of the flame kernel is different from the usual one ring-shaped or third-lobe structure, and a cone-shaped structure appears. After that, flame kernel and shock wave gradually develop and spread outward. It can be noticed that after 44.4 μs, the brightness of the central area of the flame kernel gradually increases, while the boundary of the shock wave is gradually blurred and difficult to identify. In addition, in the initial stage of the formation of the flame kernel, the axial development speed is faster than the radial direction, but then the radial development speed is faster, which leads to the gradual disappearance of the cone-shaped structure. The following is the detailed analysis of the shock wave development and flame kernel morphology under different experimental conditions.
3.1. The Effect of the Pressure
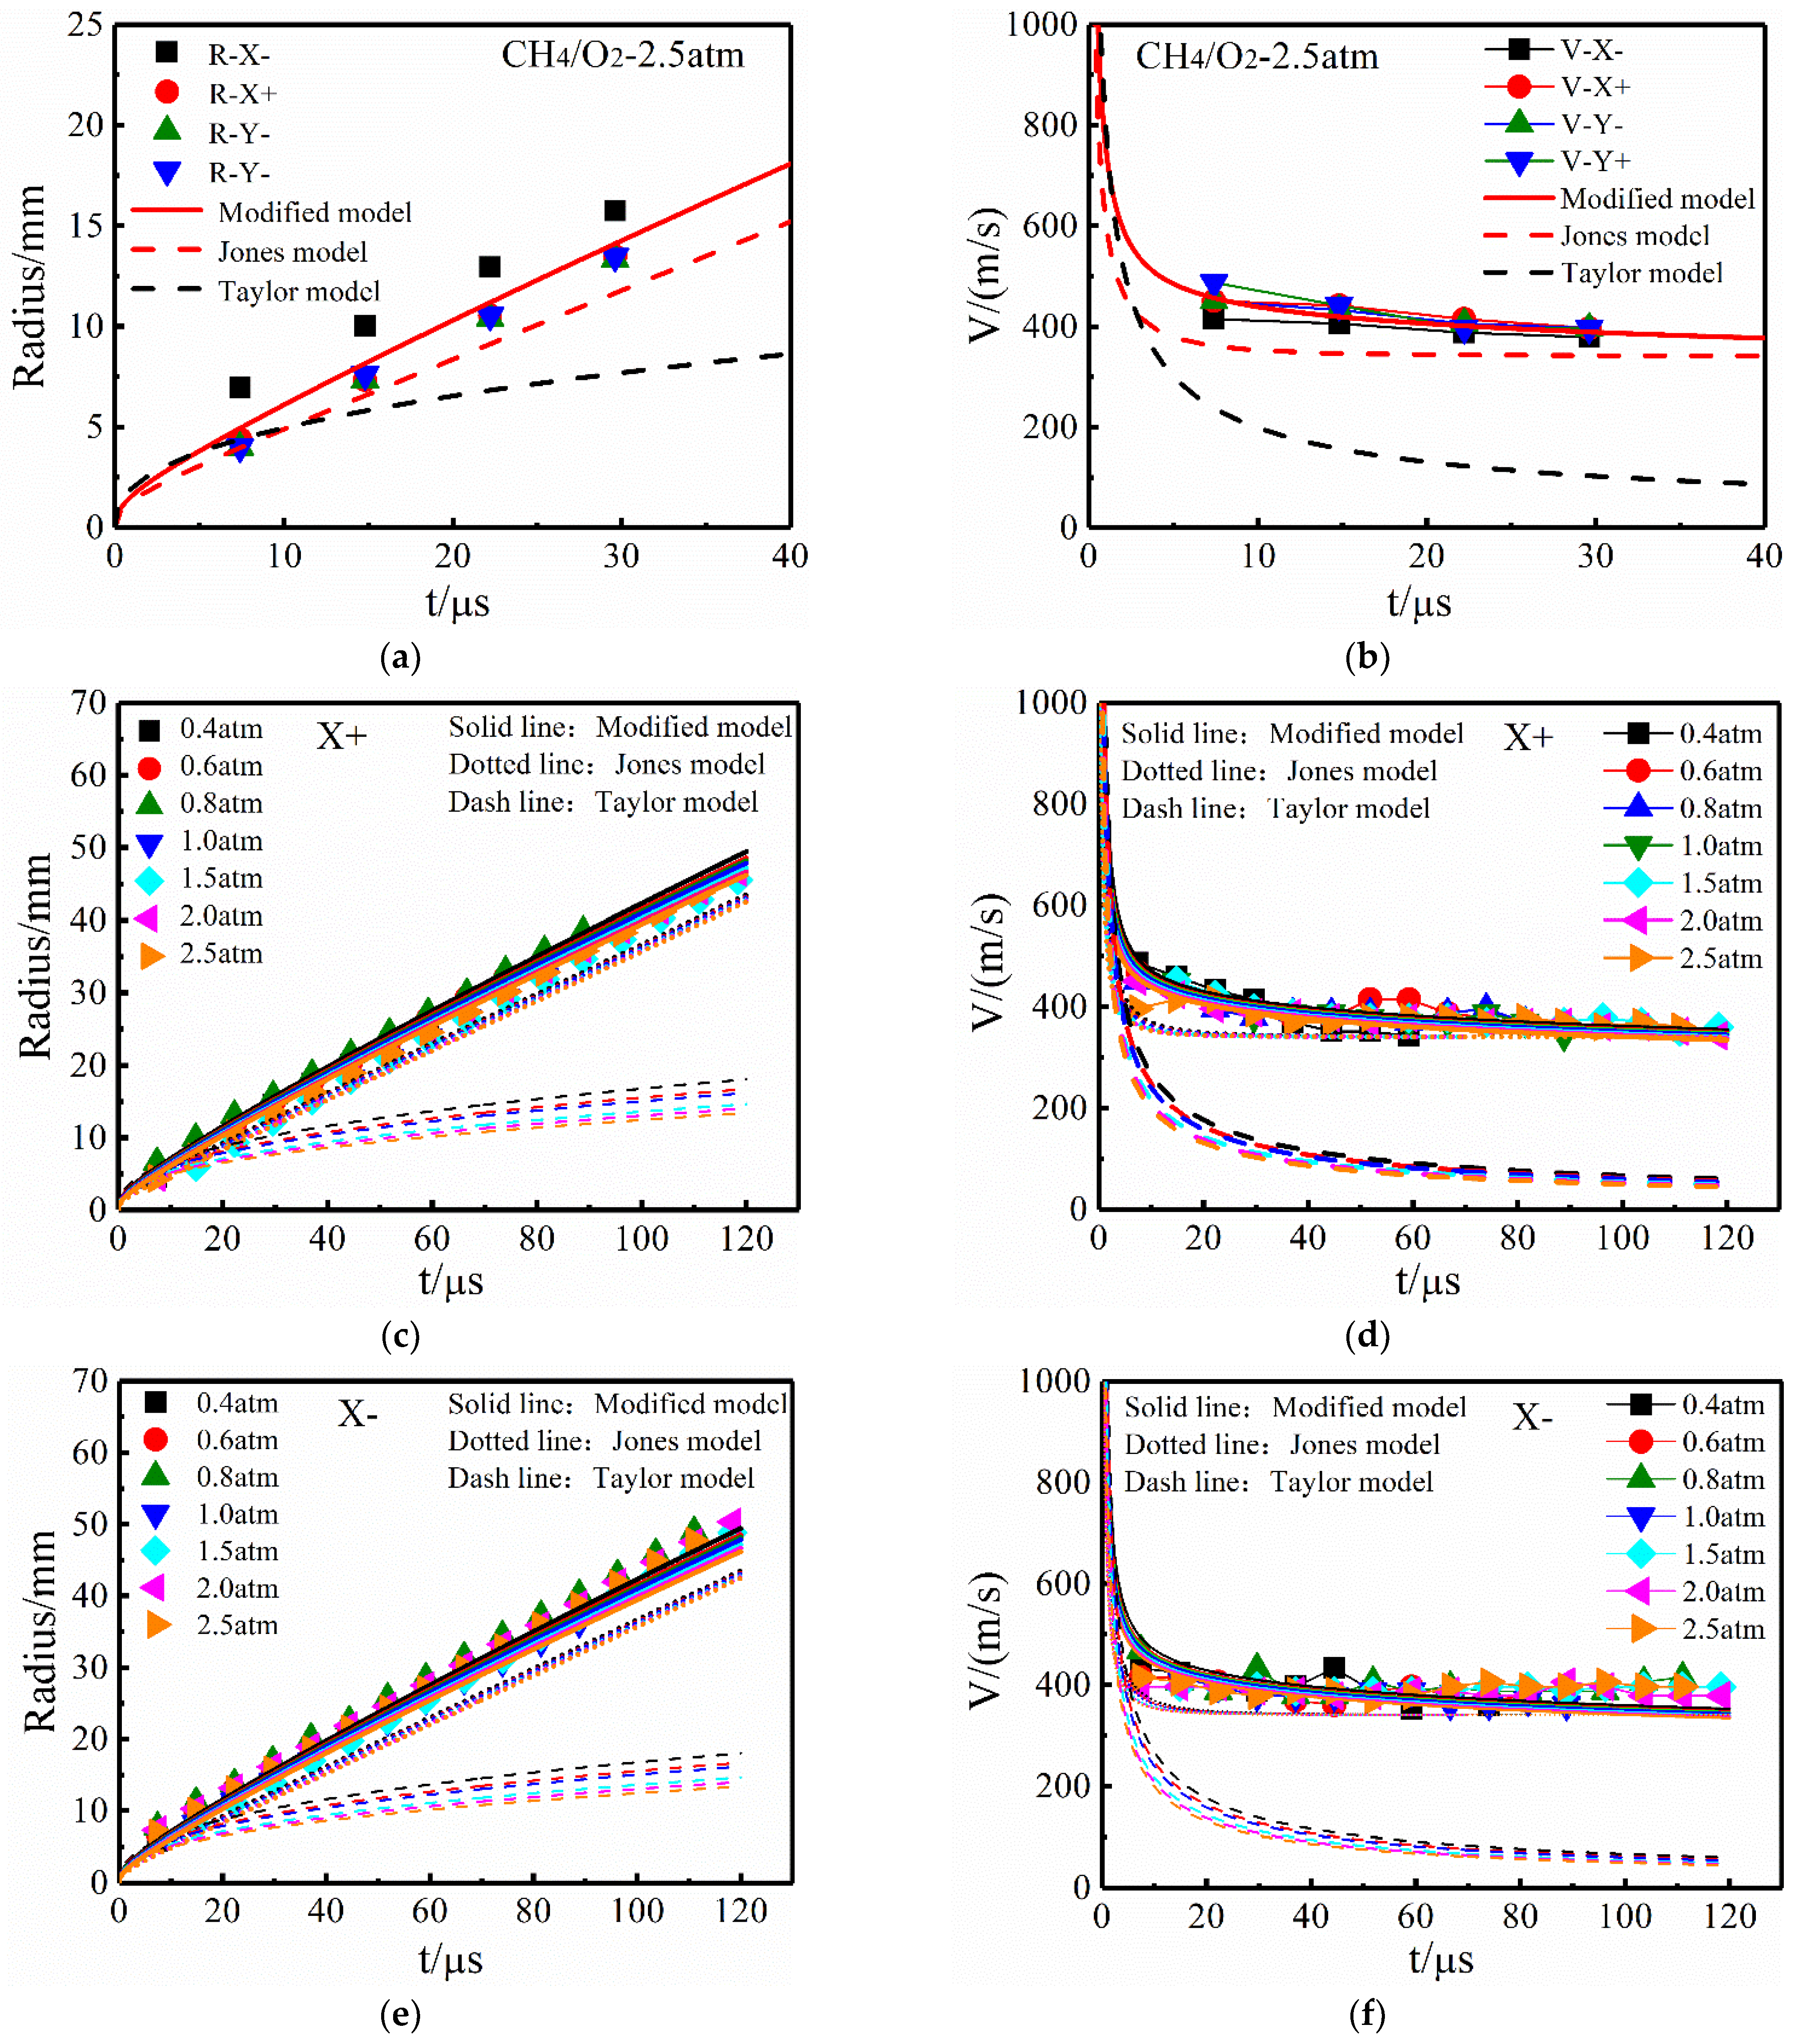
Figure 4 shows the changes of the radius and velocity of the shock wave of CH
4/O
2 laser ignition with the initial pressures when the equivalence ratio is 1, and compares the experimental data with three models.
Figure 4a,b compare the difference in radius and velocity in four directions with the initial pressure of 2.5 atm. The radius of the shock wave in the four directions gradually increases with the increase of time; the change of the velocity also gradually increases with time, and then stabilizes. In this paper, the radius of the shock wave is calculated by measuring the number of pixels in the pictures according to the scale. It is worth noting that the deviation of the radius in different directions in the figure is mainly caused by the deviation of the pixel point measurement, which directly leads to the large fluctuation of the velocity. In addition, the shock wave has thickness, and the boundary of the shock is not clear, which leads to a certain error in the number of pixels; the deviation of 1 pixel will cause an error of about 18 m/s.
It can be seen from the figure that there is a big deviation between the calculation results of the Taylor model and the experimental data. This is mainly because the model is only applicable to the strong explosion wave model and can predict the development and changes within a few microseconds after the shock wave is formed. However, after dozens of microseconds, the shock wave will gradually propagate to the sound speed due to energy loss and environmental pressure, so the Taylor model is not suitable for predicting the development of the shock wave in the later stage. Compared with the Taylor model, the Jones model fits the experimental data better. This is because the Jones model is used to predict the medium-intensity explosion wave, and the propagation of the shock wave in the later stage can be considered as the medium-intensity explosion wave propagation. Although the predicted results of the Jones model are relatively good, there are still deviations from the experimental data. For this reason, this paper has performed curve function fitting on the experimental data points in
Figure 4a,b based on the Jones model, and obtained the modified model (Equation (4)) based on the Jones model. As can be seen from the figure, compared to the Jones and Taylor models, the modified model has the best fitting results.
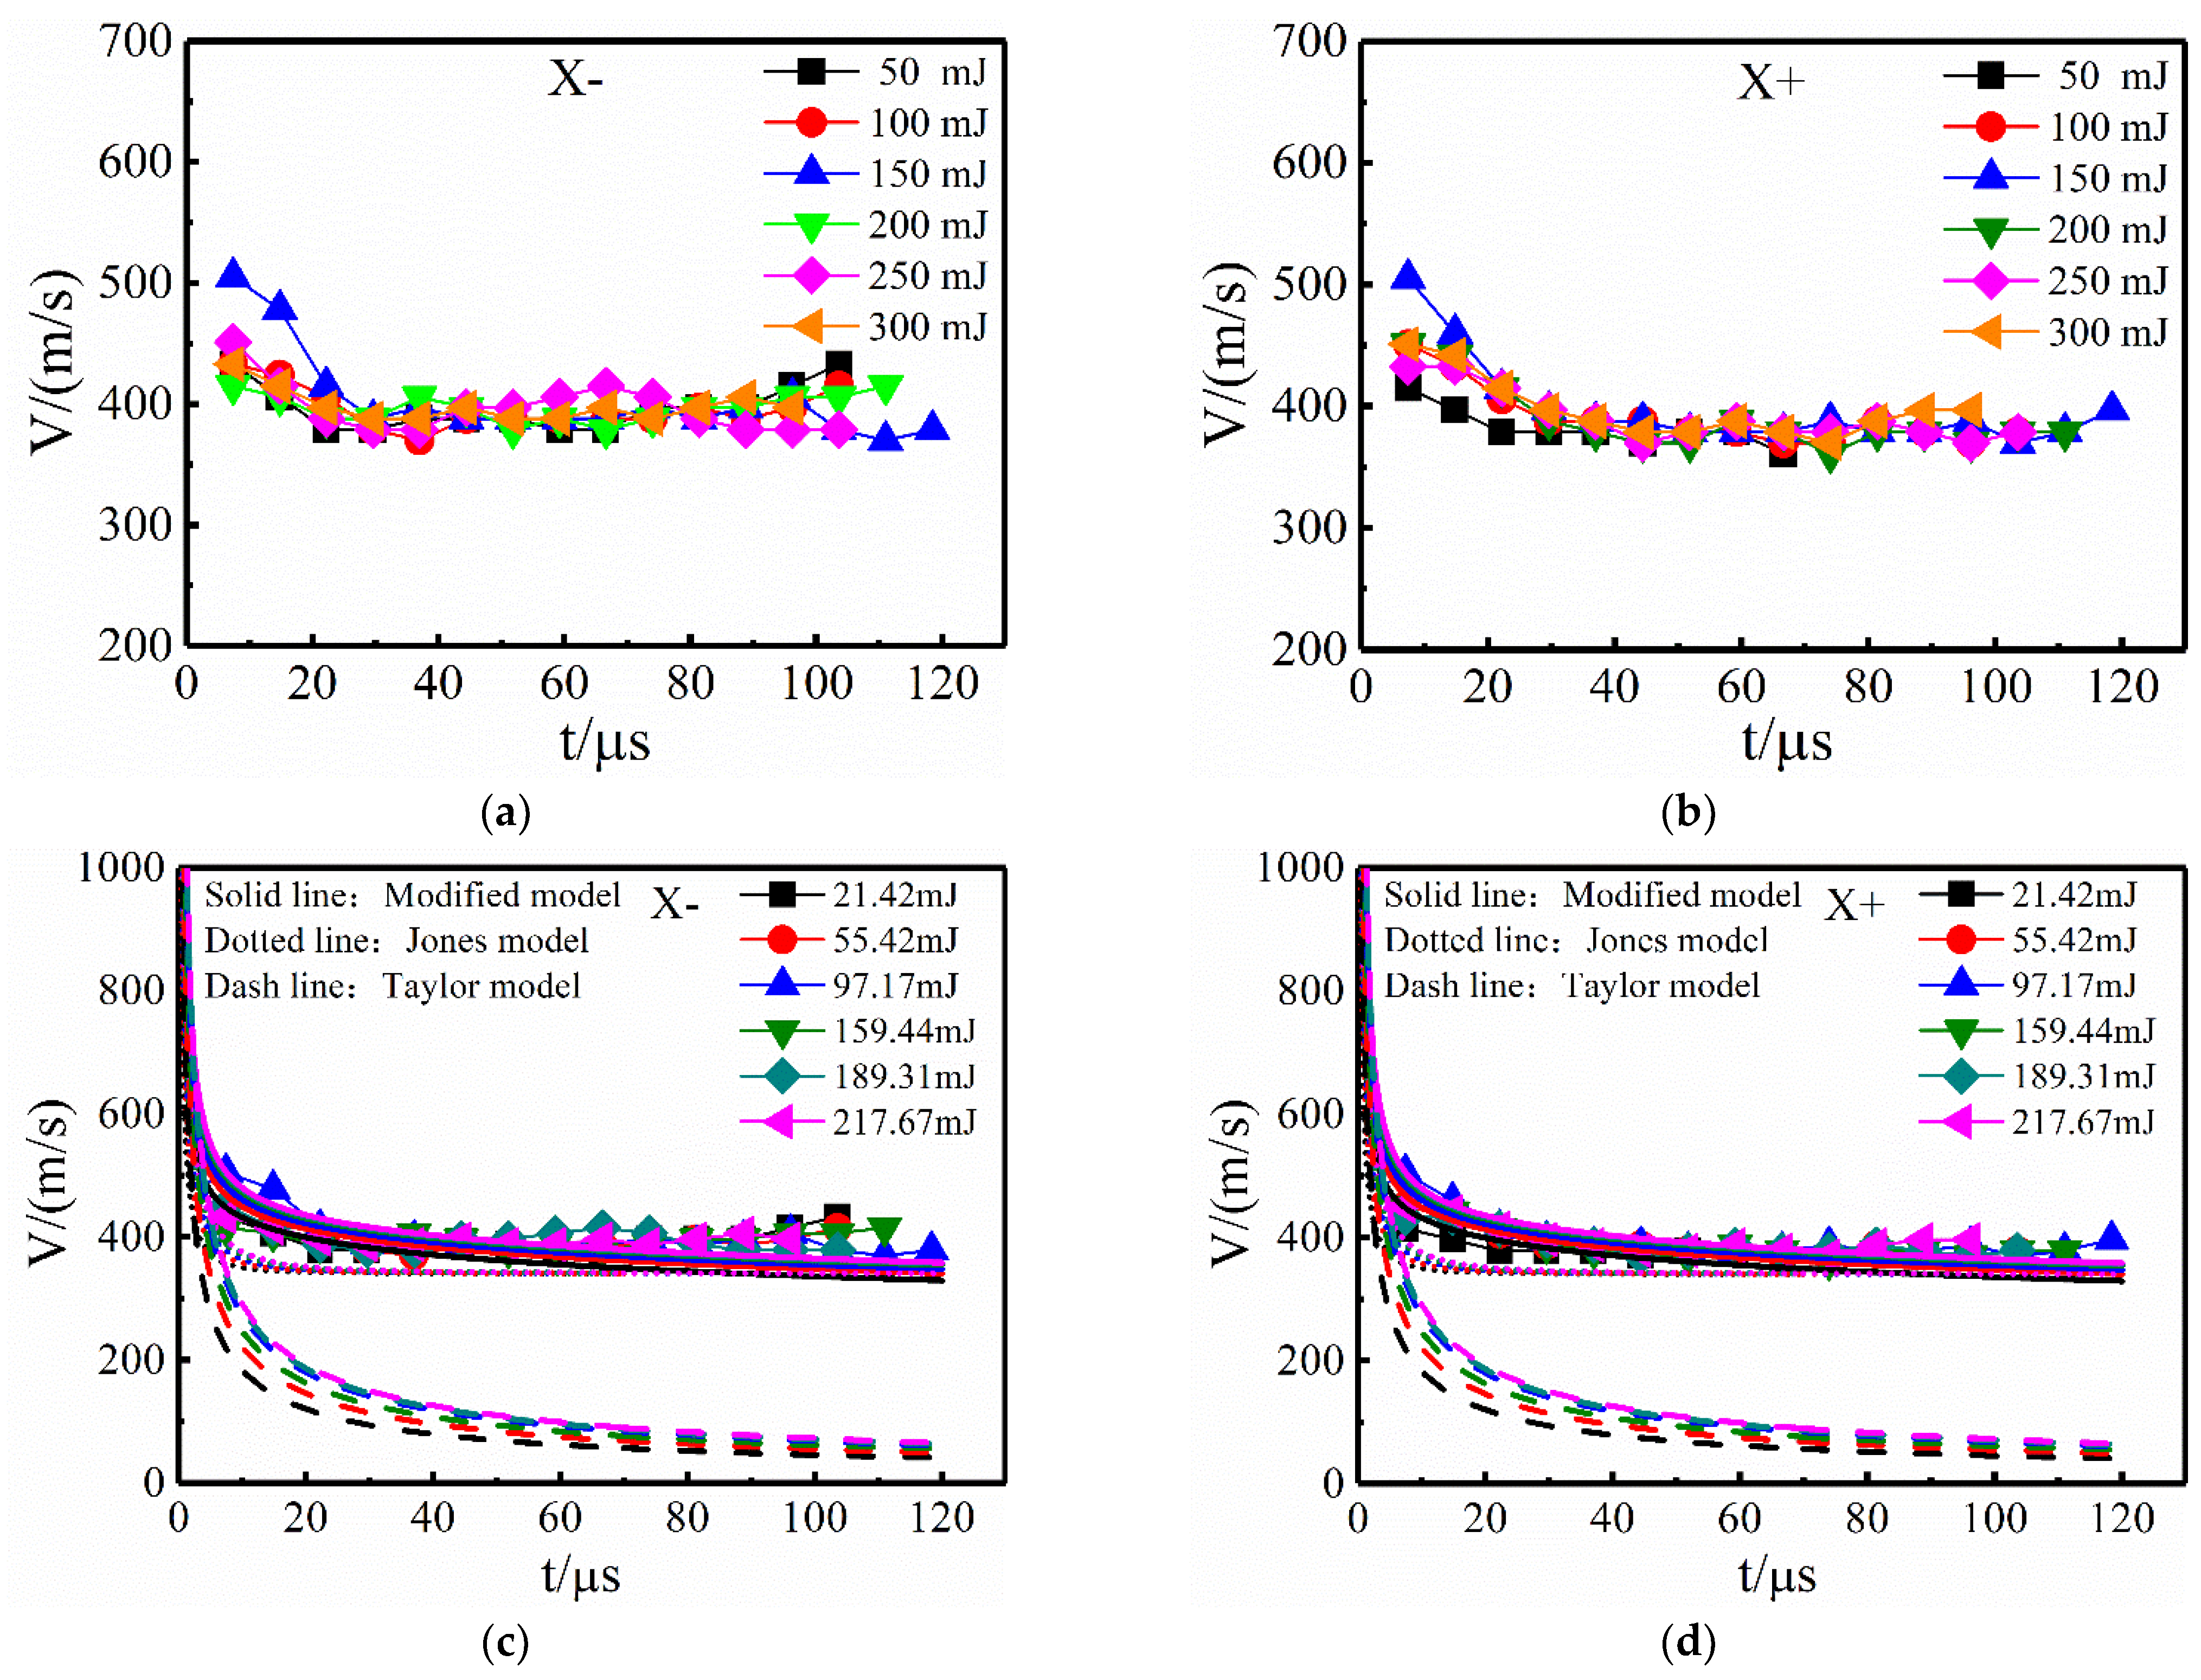
The changes in the radius and velocity of the shock wave in the X– and X+ directions with different pressures are shown in
Figure 4c–f. With the propagation of shock wave, its radius gradually increases, and its velocity gradually decreases and tends to be stable afterwards. It can be seen that, with the increase of pressure, there is no obvious change in the radius and velocity of the shock wave. The modified model fits well with the experimental results and can better show the development trend of the shock wave. Through the calculation results of the three models in the figure, it can be found that the initial pressure has a small effect on the velocity, but as the initial pressure increases, the shock wave velocity will gradually decrease, mainly because the increase in environmental pressure will hinder the propagation of shock wave. According to the calculation results of the modified model: the initial pressures are 0.4 atm and 2.5 atm, and the corresponding shock wave velocities are 428.96 m/s and 405.78 m/s at 20 μs respectively; the difference of the shock wave velocities corresponding to the two initial pressures are almost the same as the experimental data error, which may explain why the influence in the shock wave velocity of the initial pressure cannot be seen through the experimental data.
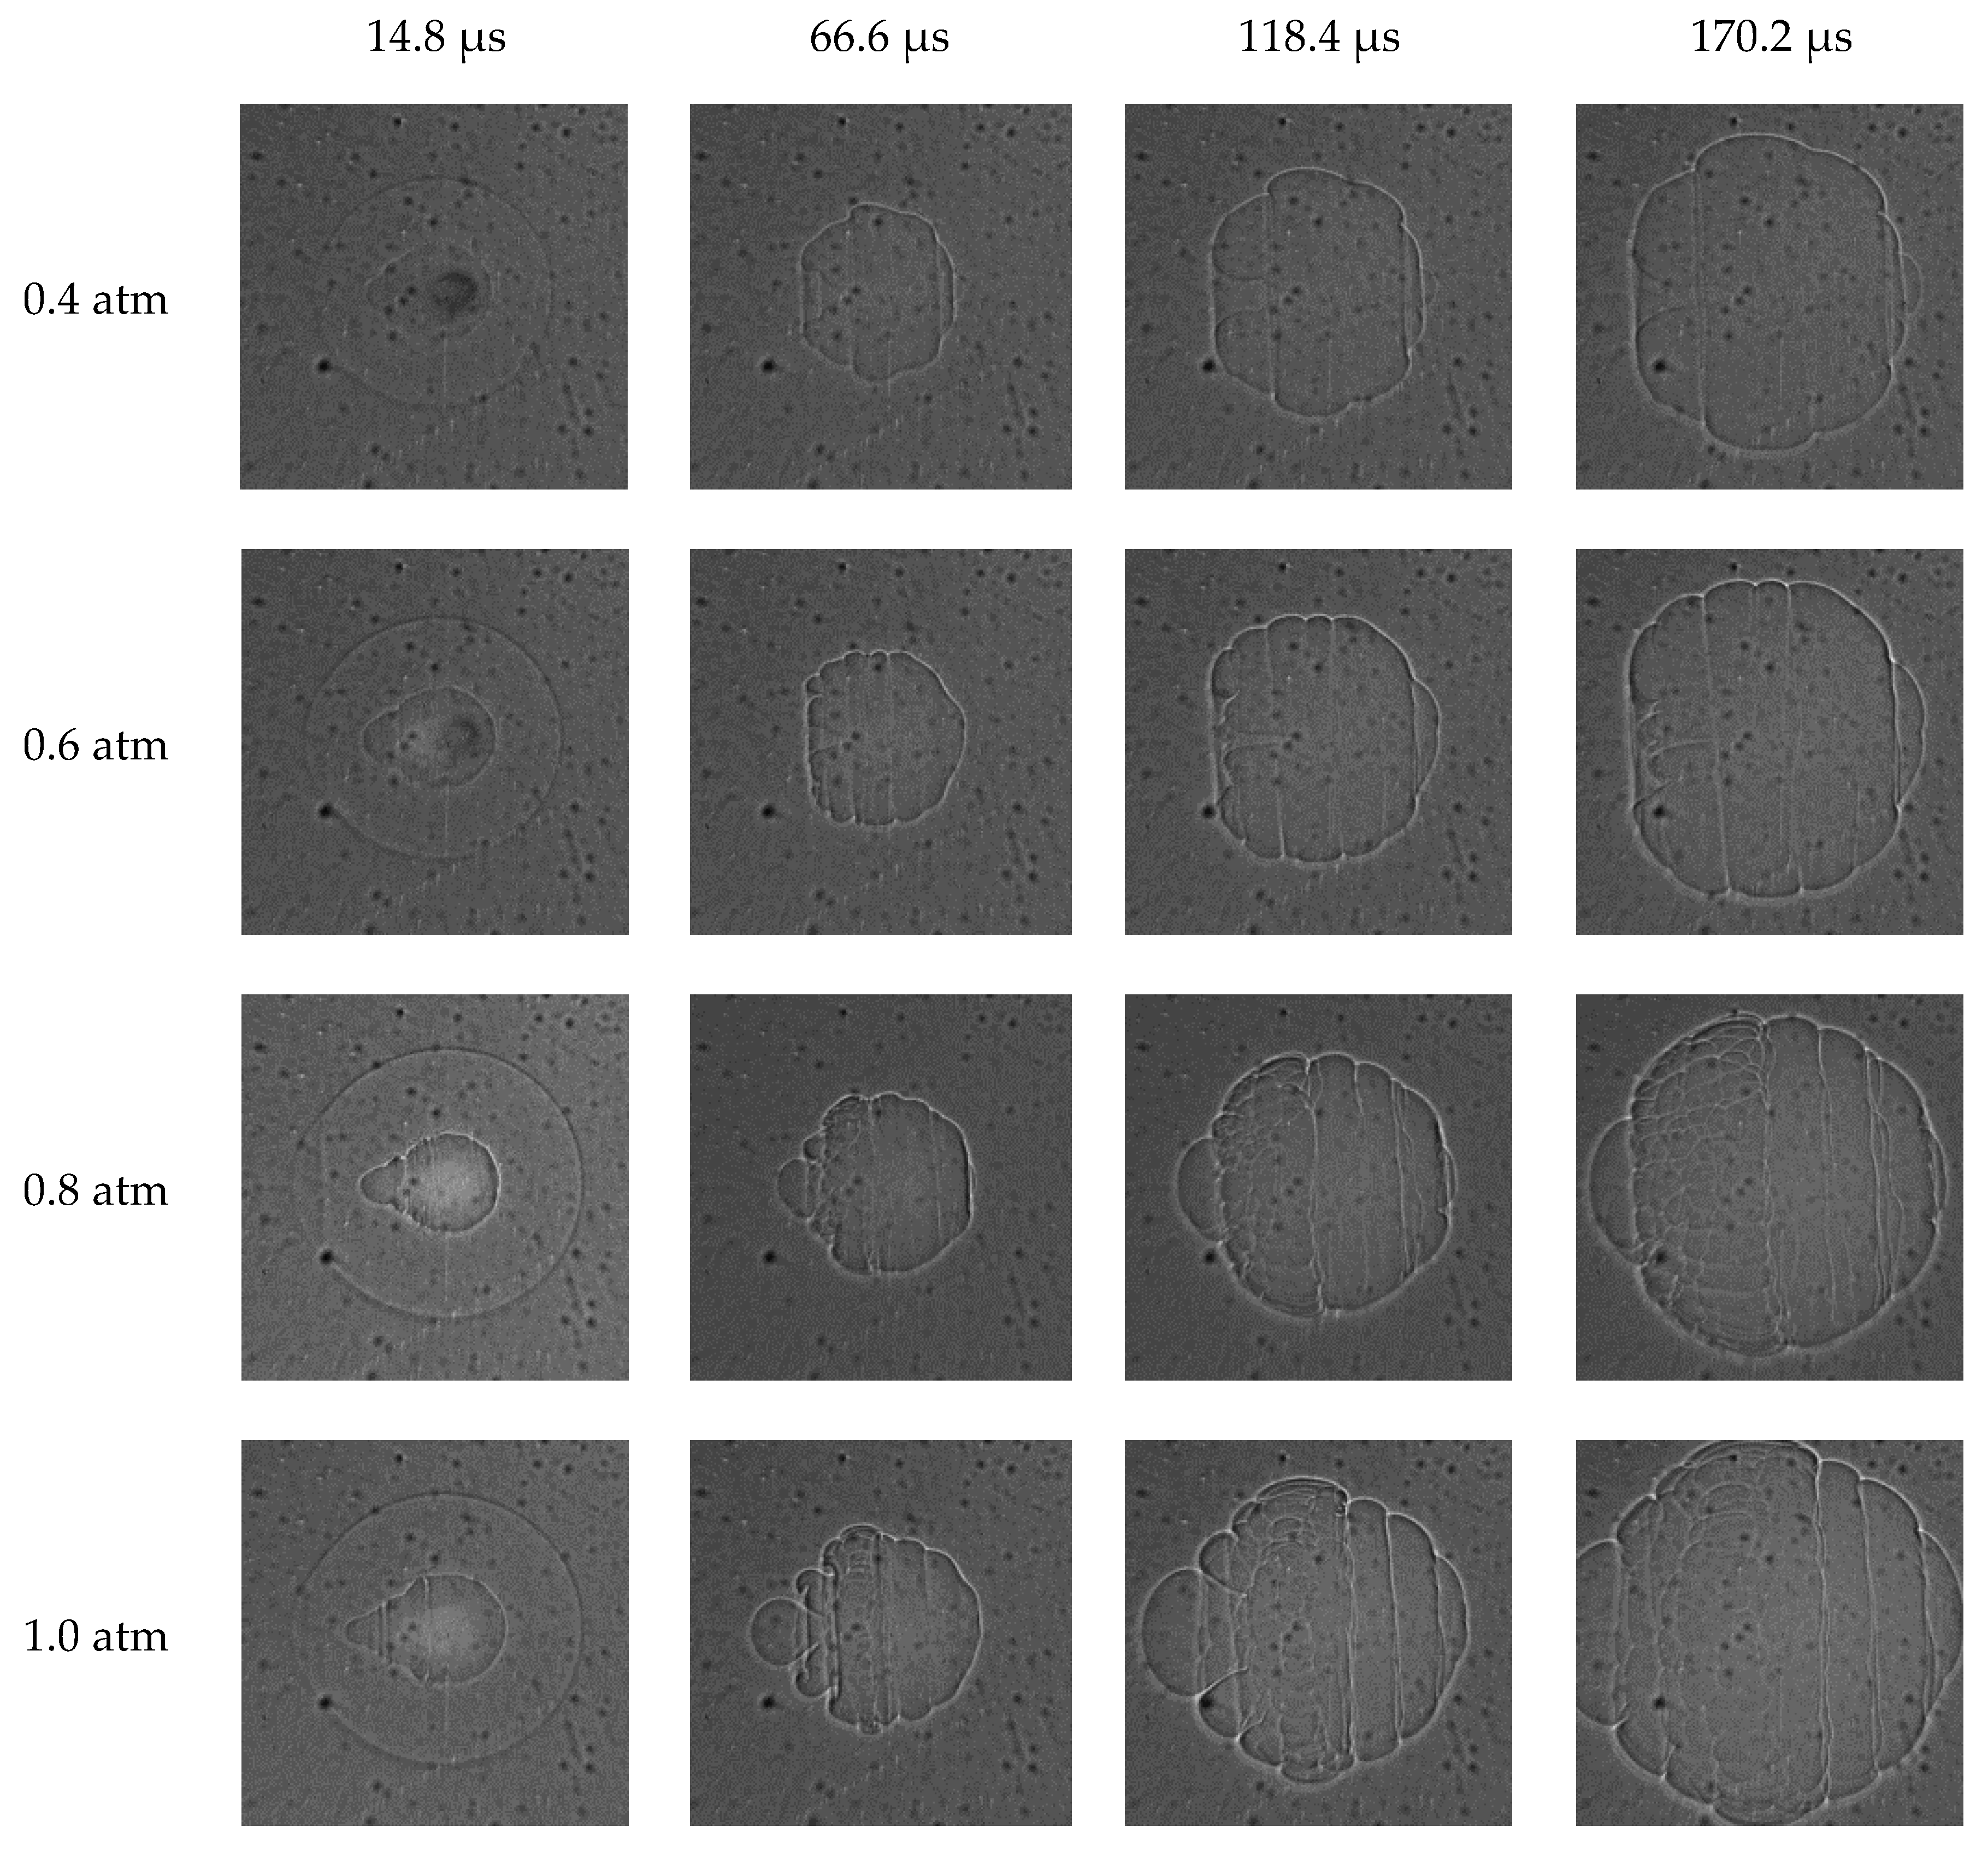
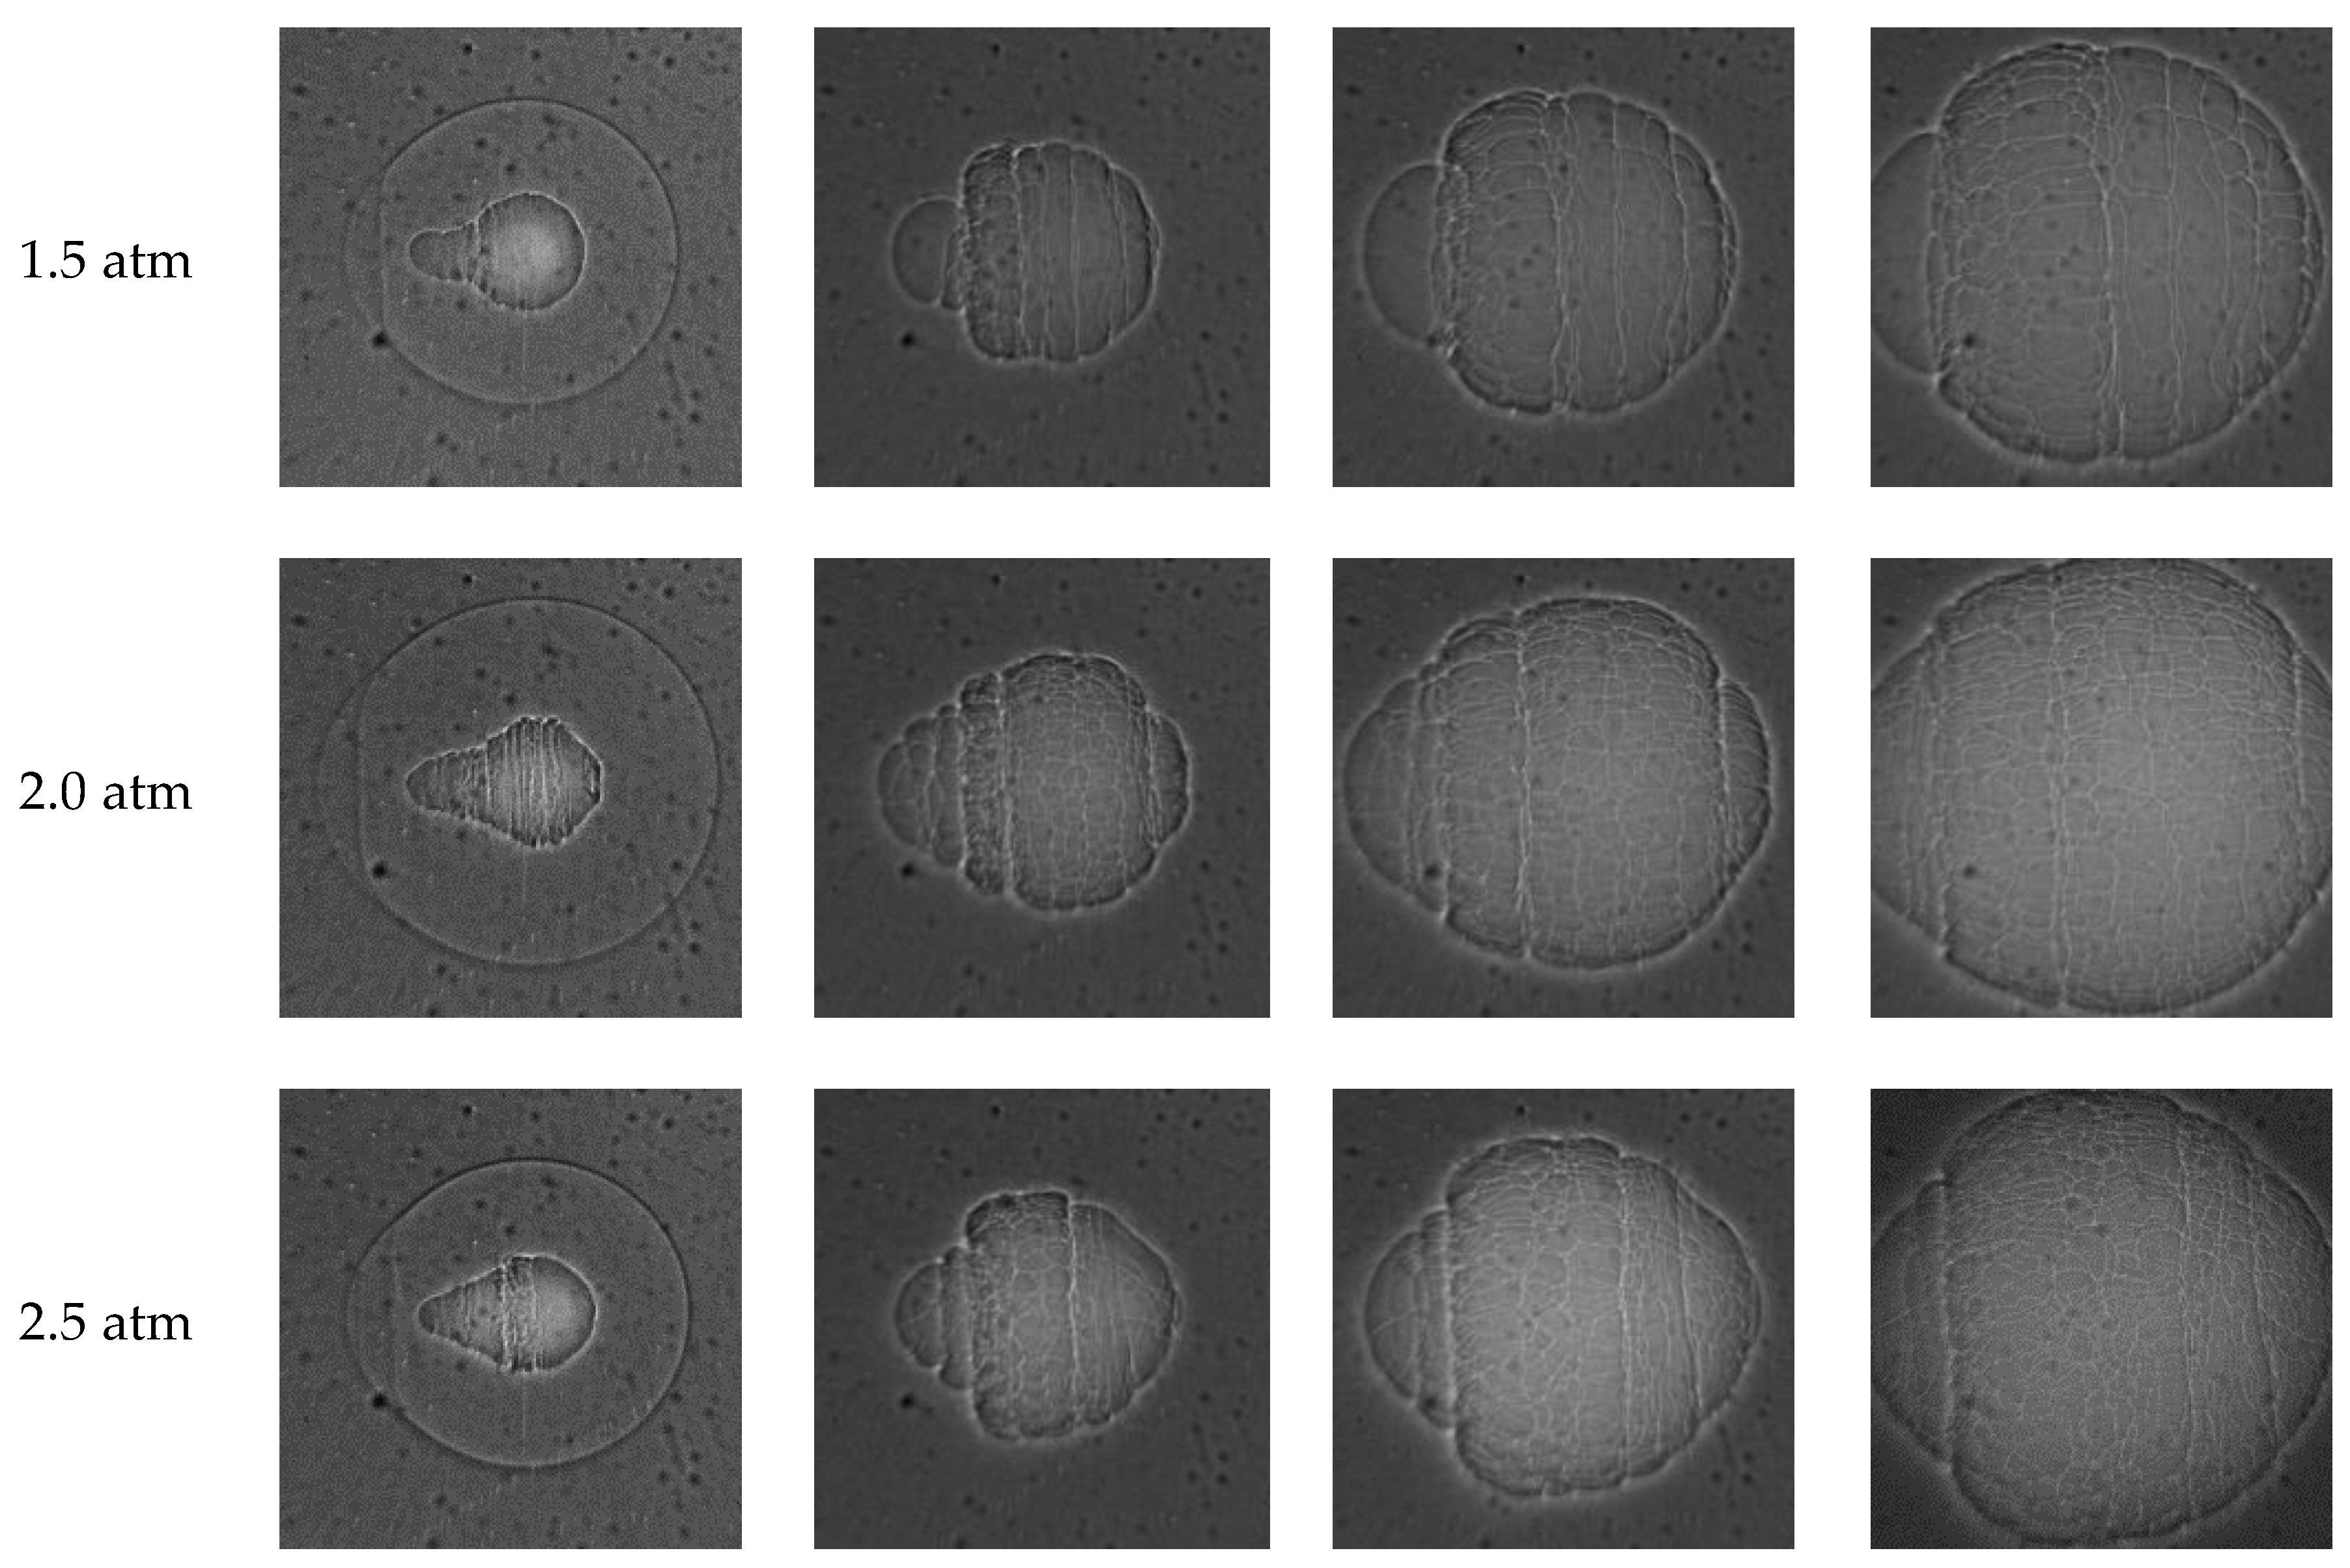
For the different initial pressures, the evolution of CH
4/O
2 flame kernel morphology, are shown in
Figure 5. When the initial pressure is 0.4 atm and t = 14.8 μs, the initial flame kernel is close to a circle, but a cone-shaped structure can be seen. At t = 66.6 μs, a ring structure gradually forms on the left side of the flame kernel, and a vortex appeared in the middle. However, the intermediate vortex will not develop into a more obvious ring structure, and the size of the vortex gradually decreases. In comparison, when the initial pressure is 0.6 atm and t = 14.8 μs, a more obvious cone-shaped structure can be seen on the left side of the initial flame kernel. At t = 66.6 μs, a small vortex appears in the middle of the left side of the flame kernel, and will gradually disappear. As the initial pressure continues to increase, the cone-shaped structure becomes more obvious, and the axial length of the flame kernel increases; while the vortex structure gradually disappears, the flame kernel gets closer and closer to an ellipse.
From the analysis of the hot gas kernel morphology, there are two possible reasons for the formation of the ring and third-lobe structure: one is the interaction between the sparse wave and the hot gas kernel, and the other is the asymmetric deposition of laser energy. In this paper, the possible reason is that only the vortex structure appears at the initial pressure of 0.4 atm, the ring and third petal structures are not formed, for the chemical reaction rate is accelerated in the pure oxygen environment. The hot gas nucleus quickly forms a stable flame kernel, which forms the ring structure, and the vortex motion of the third-lobe structure is weakened. In addition, when the initial pressure is low, the absorbed energy of the focused plasma is reduced, and the influence of asymmetric deposition of laser energy is also weakened. As the initial pressure increases, the flame kernel gradually forms a conical structure on the side far from the incident direction of laser (hereinafter referred to as the distal end); the side close to the incident direction of laser (hereinafter referred to as the proximal end) forms a spherical structure. This may be due to the combined effects of the asymmetric deposition of laser energy and the acceleration of the chemical reaction rate, but the asymmetric deposition of laser energy may lead to more deposition energy at the proximal end, which makes the area where the surrounding gas heated larger and the chemical reaction rate faster. Therefore, the flame spreads rapidly in all directions in this area and the propagation rate is almost the same, thereby forming a spherical structure, inhibiting the formation of the third-lobe structure. In addition, the accelerated chemical reaction rate not only weakens the vortex motion, but also promotes the formation of a cone-shaped structure.
3.2. The Effect of the Energy
The changes of the radius and velocity of the shock wave with different laser energy in the X− and X+ direction of the CH
4/O
2 mixture at initial pressure of 1 atm, as shown in
Figure 6a,b. The shock wave velocity gradually decreases, then tends to stabilize with the propagation of flame. It can be seen that there are certain fluctuations in the shock wave velocity in both directions, but there is no obvious relationship between the shock wave velocity and the laser energy. Furthermore, from
Figure 6c,d, it can be found that compared with the Jones and Taylor models, the modified model can still better predict the development of shock wave velocity. The model results show that as the laser energy increases, the shock wave velocity gradually increases, because the increase in laser energy will increase the energy absorbed by the plasma, which in turn increases the energy used to drive the shock wave. When t = 20 μs and the laser energy is 21.42 mJ and 217.67 mJ, the corresponding shock wave velocities are 399.56 m/s and 435.87 m/s respectively, and the velocity difference value is 36.31 m/s.
Through the above analysis, it can be known that the laser energy has no obvious effect on the shock wave velocity, and a few little differences in the velocity may be caused by the experimental errors. Therefore, further experimental measurements and research are needed in the future.
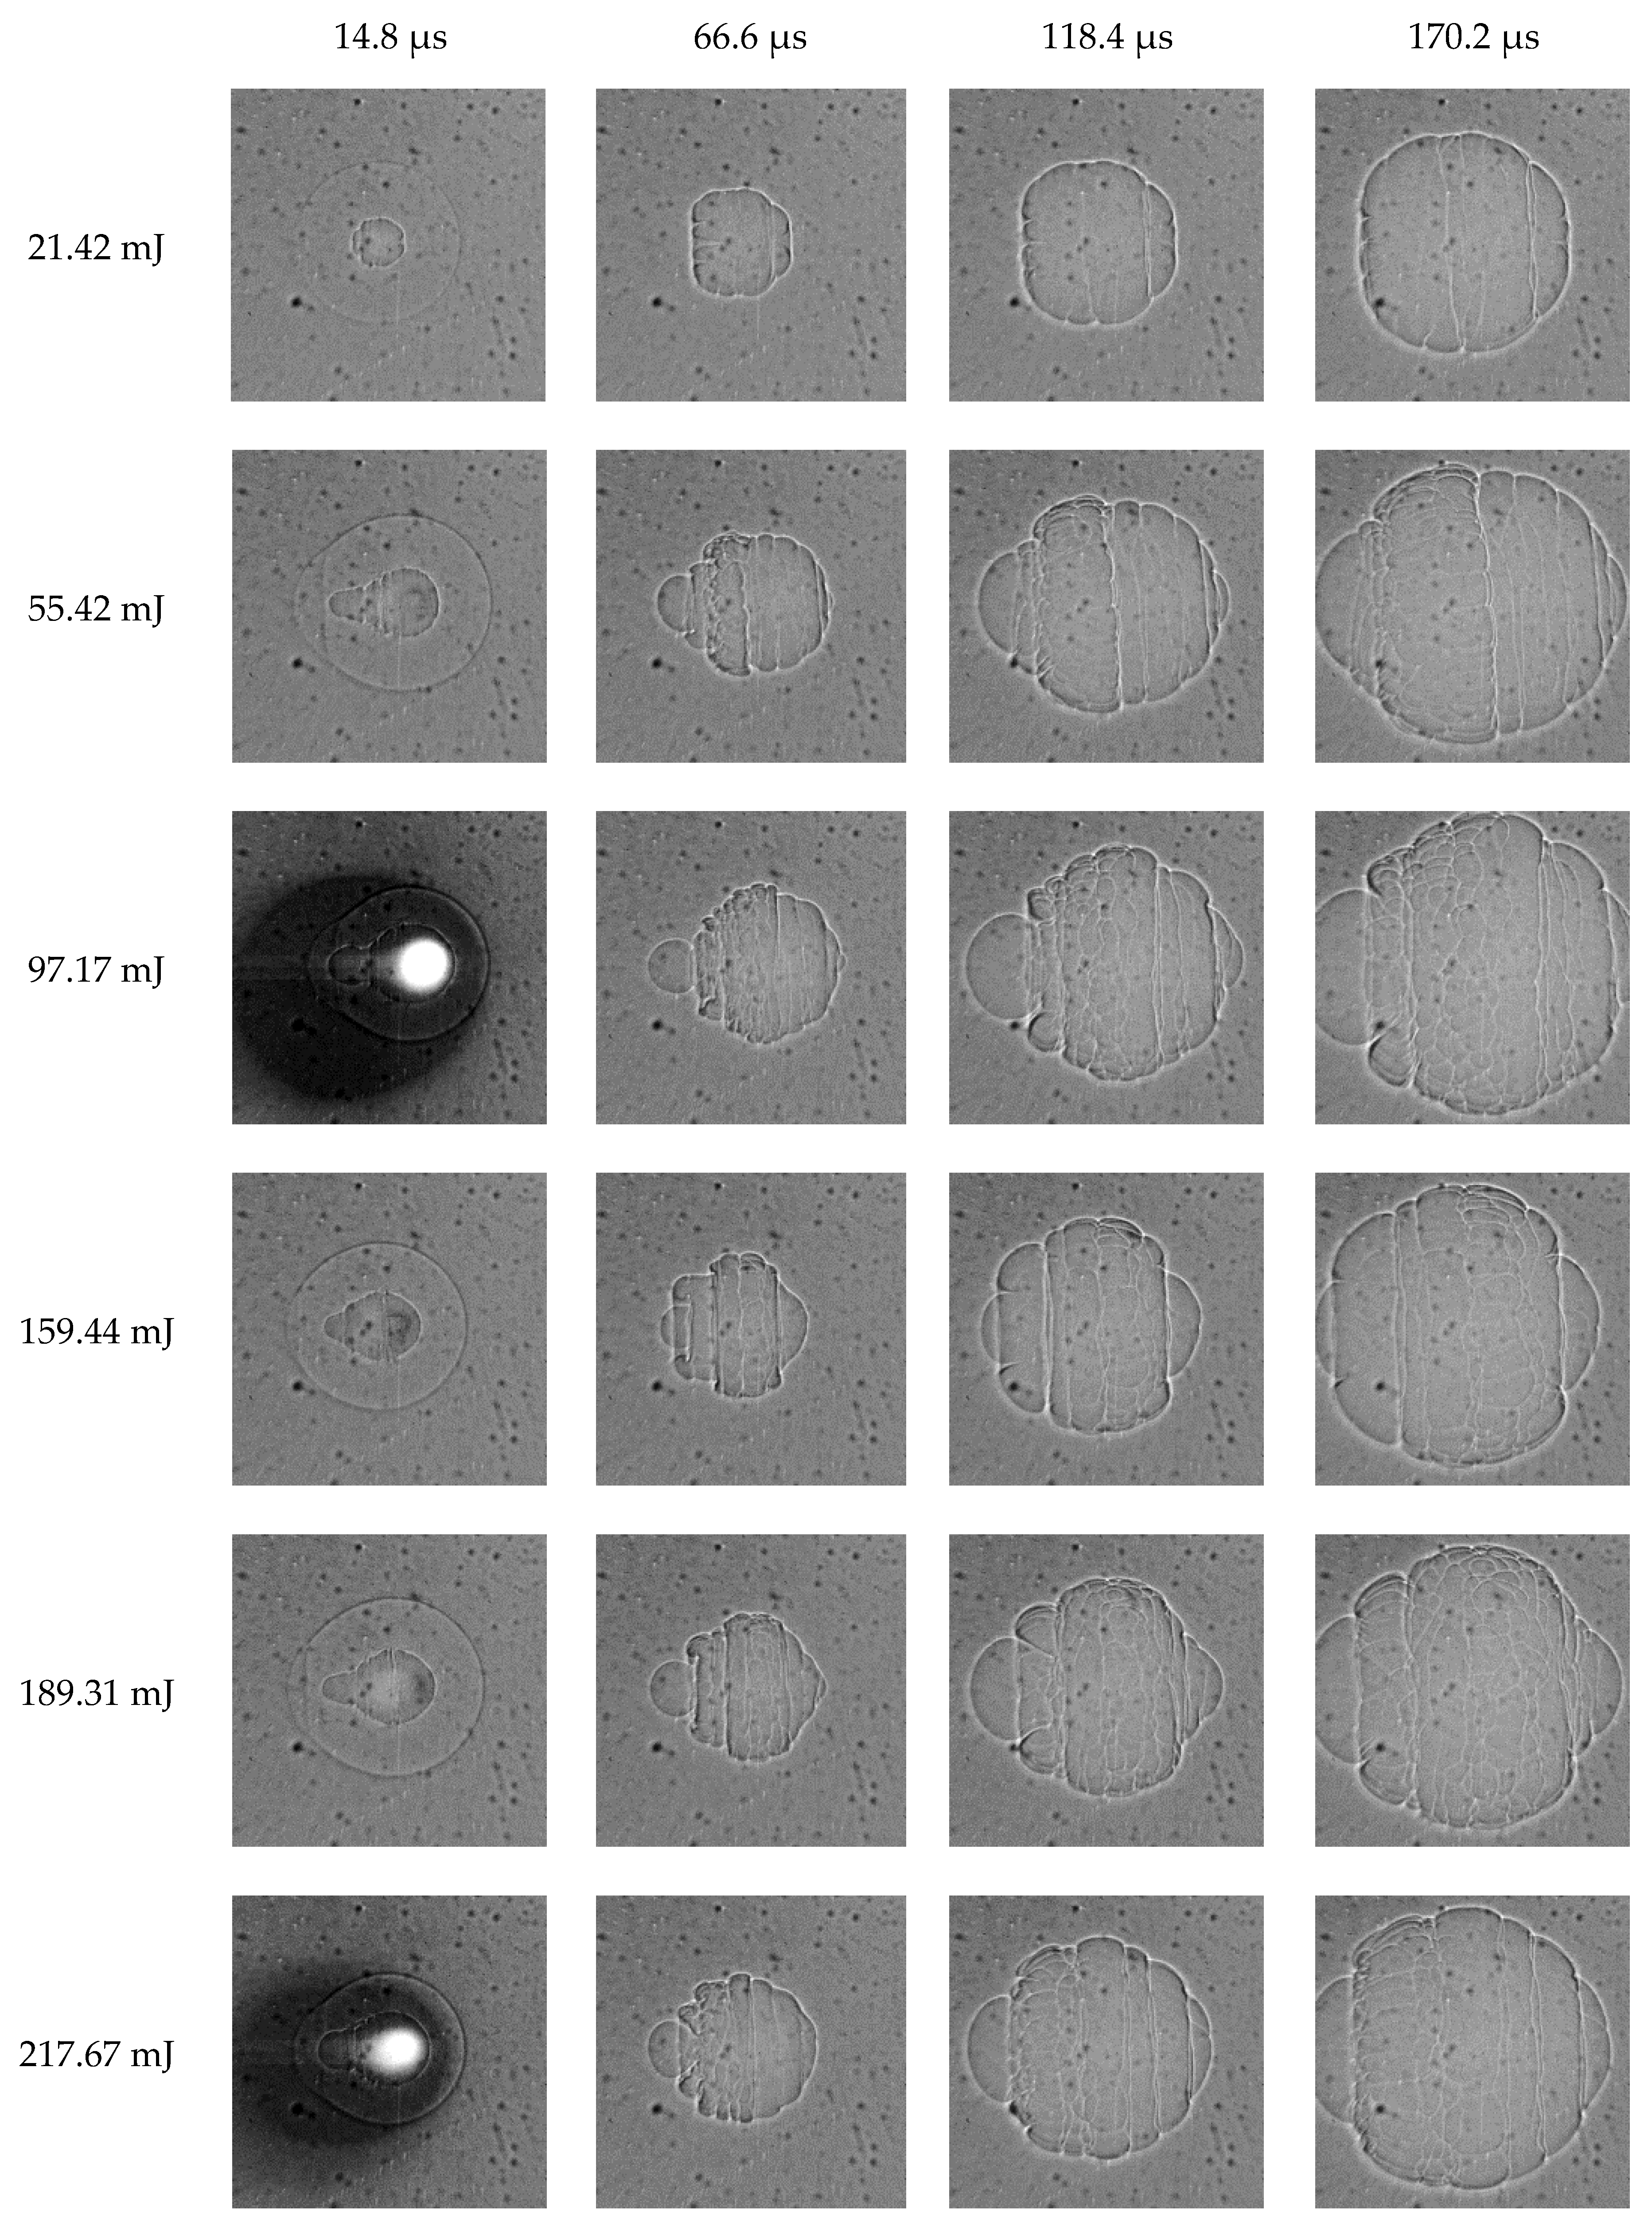
The development of CH
4/O
2 flame kernel morphology using different laser energy is shown in
Figure 7. When the laser energy is 21.42 mJ and t = 66.6 μs, a less obvious vortex structure appears on the left side of the flame kernel, while the vortex structure gradually disappears with the development of flame. With the increase of laser energy, a more obvious cone-shaped structure appears on the left side of the initial flame kernel, but the size of the flame kernel does not change significantly. This may be due to the fact that increasing the laser energy can speed up the chemical reaction rate, but when the energy is increased to a certain value, the chemical reaction will no longer be affected by the laser energy.
3.3. The Effect of Equivalence Ratio
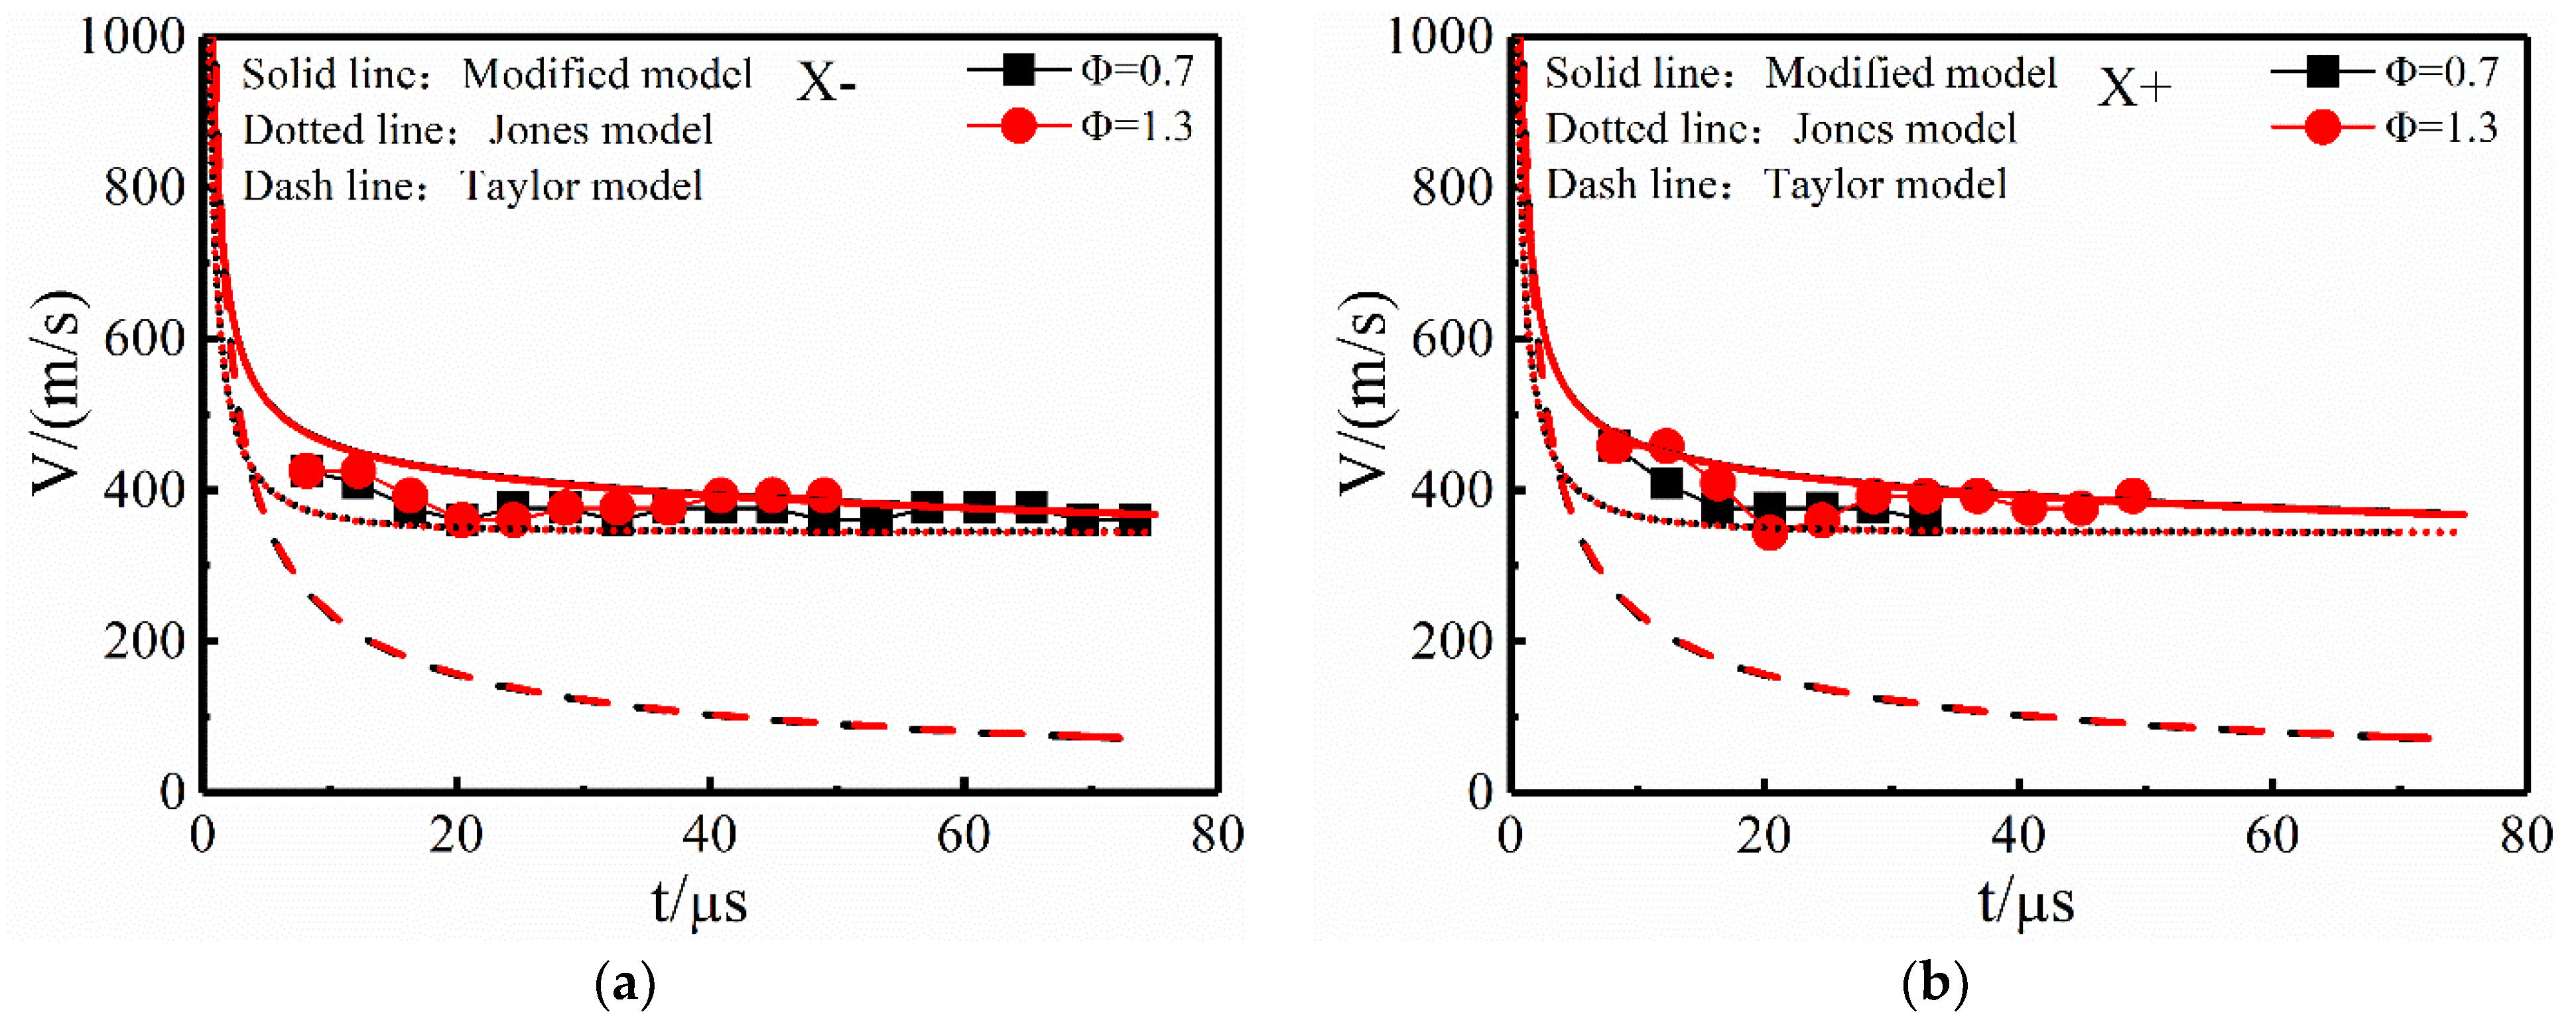
When the initial pressure is 1 atm, the influence of CH
4/O
2/N
2 mixture with different equivalence ratios on shock wave velocity is shown in
Figure 8. From the experimental data in the figure, it can be seen that the change in equivalence ratio will hardly affect the development of the shock wave. Moreover, the modified model can better predict the change trend of the shock wave velocity, especially in the X+ direction. The simulation results of the modified model reveal that at t = 20 μs, when the equivalence ratios are 0.7 and 1.3, the corresponding shock wave velocities are 424.29 m/s and 423.63 m/s, respectively. This shows that when the laser energy and initial pressure are constant, the change of the component concentration has little effect on the shock wave velocity.
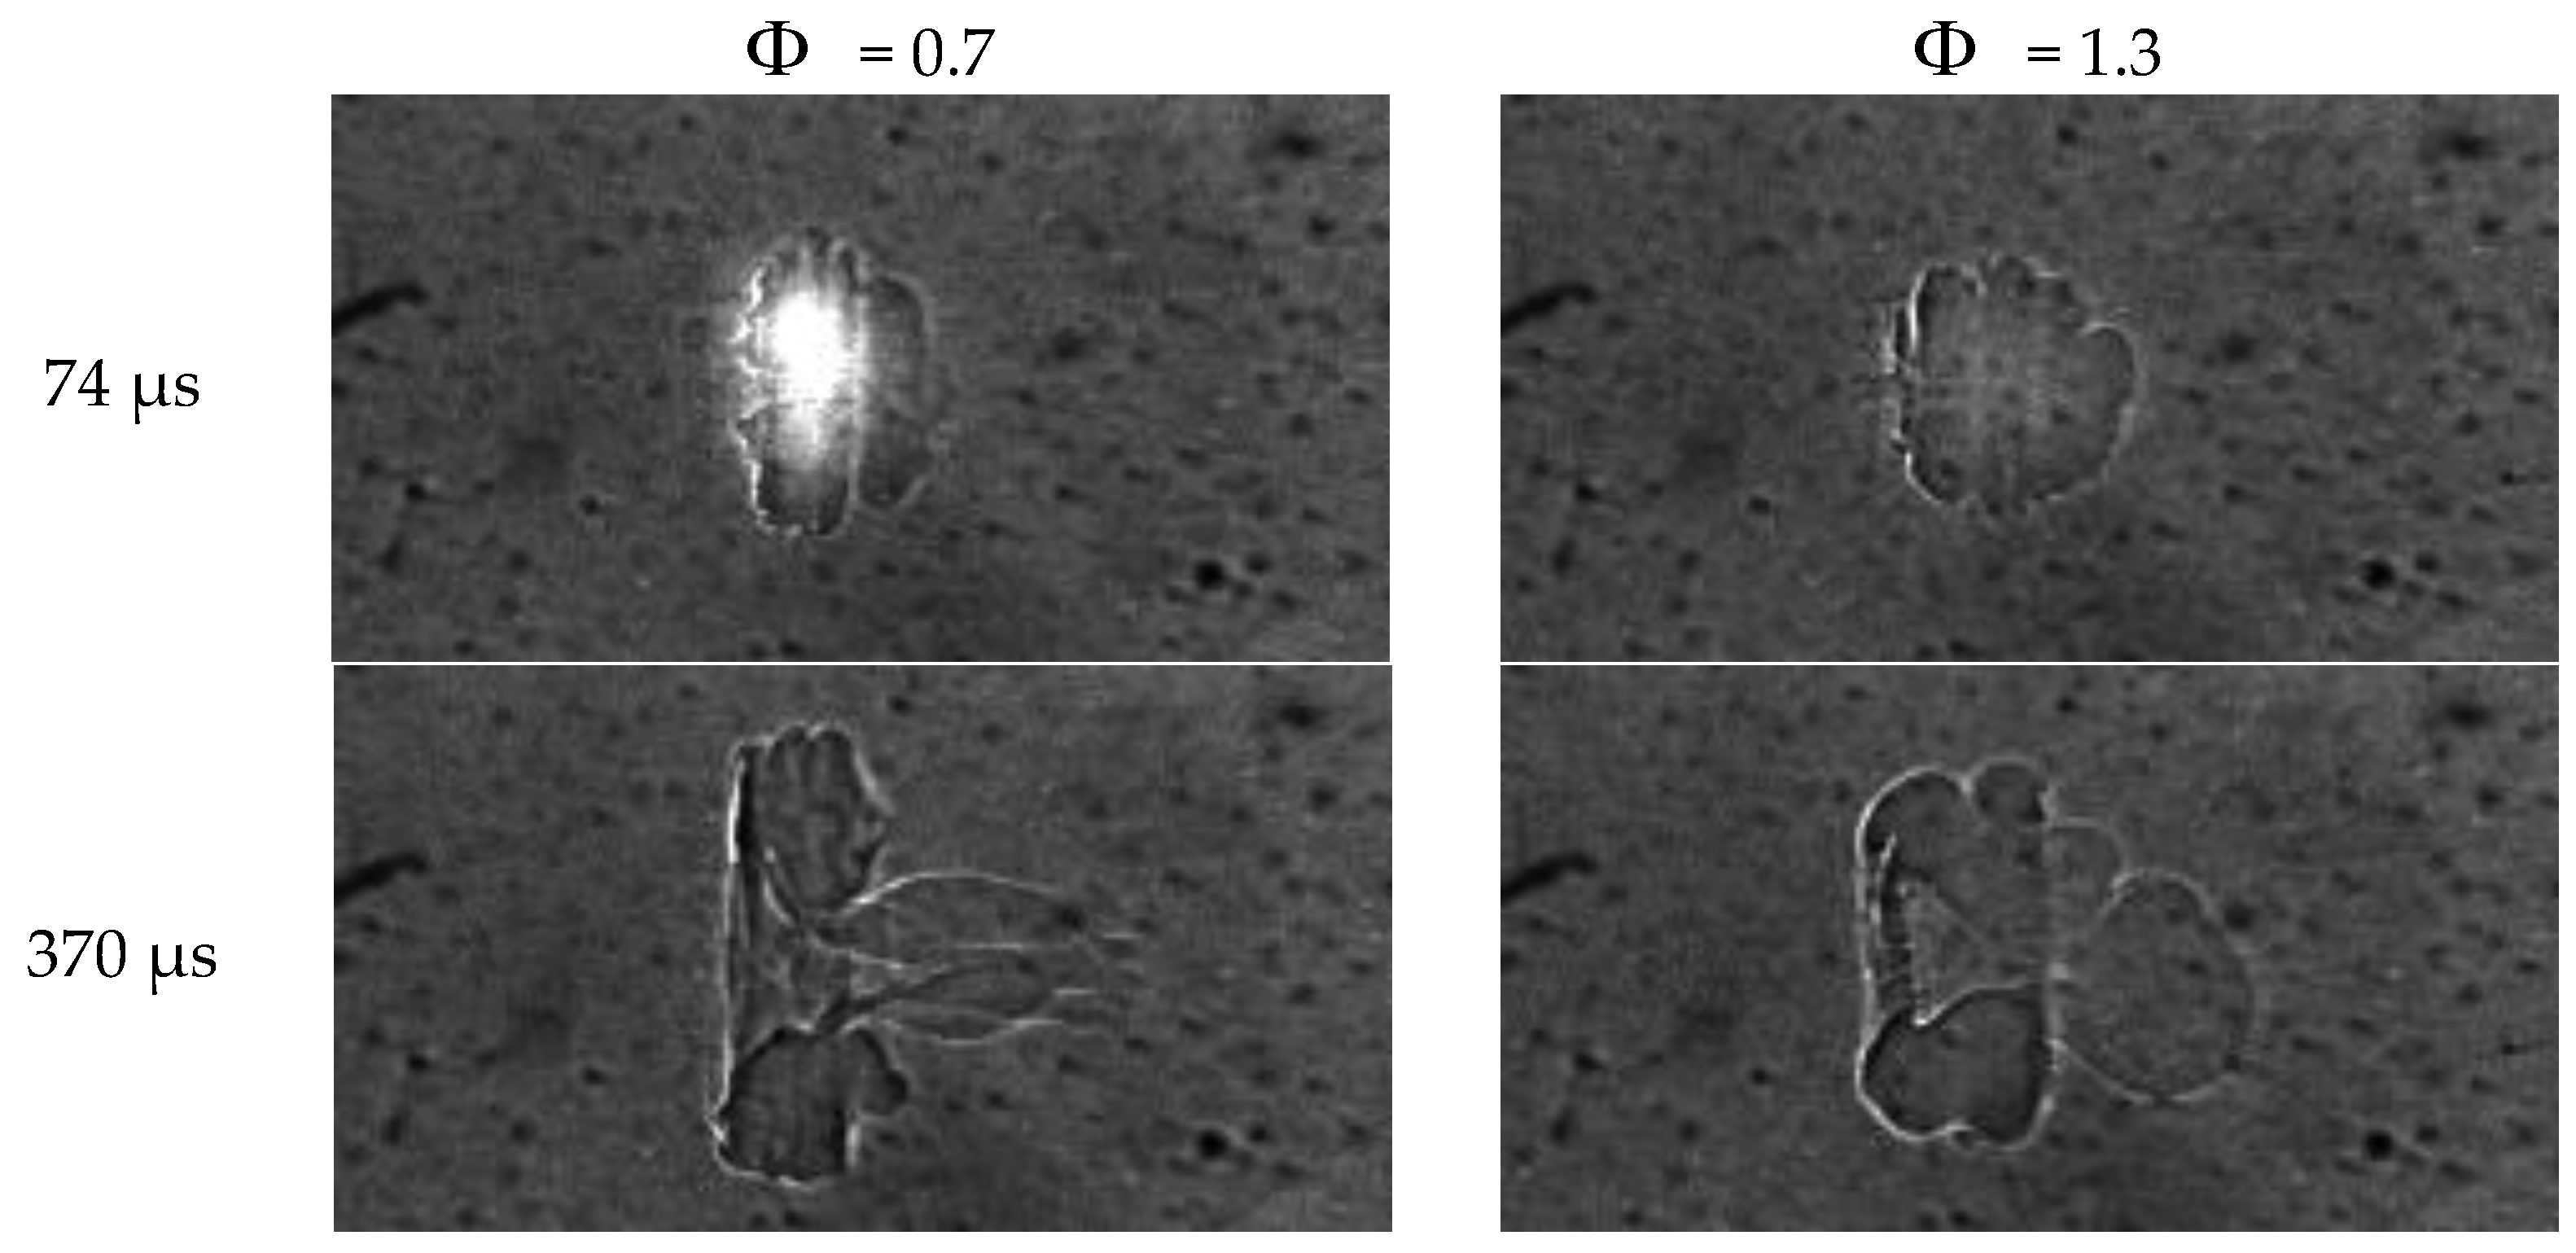
The flame kernel morphology of the CH
4/O
2/N
2 mixture with different equivalence ratios is shown in
Figure 9. Different from the shock wave, it can be seen that when the equivalence ratio is 0.7 and 1.3, the flame kernel has obvious ring-shaped and third-lobed structures, while when the equivalence ratio is 1.3, the characteristics of the ring-shaped and third-lobe structures are more obvious. This is mainly due to the fact that the flame development is more stable during rich combustion and the flame structure is easier to maintain.
3.4. The Effect of Oxygen Content
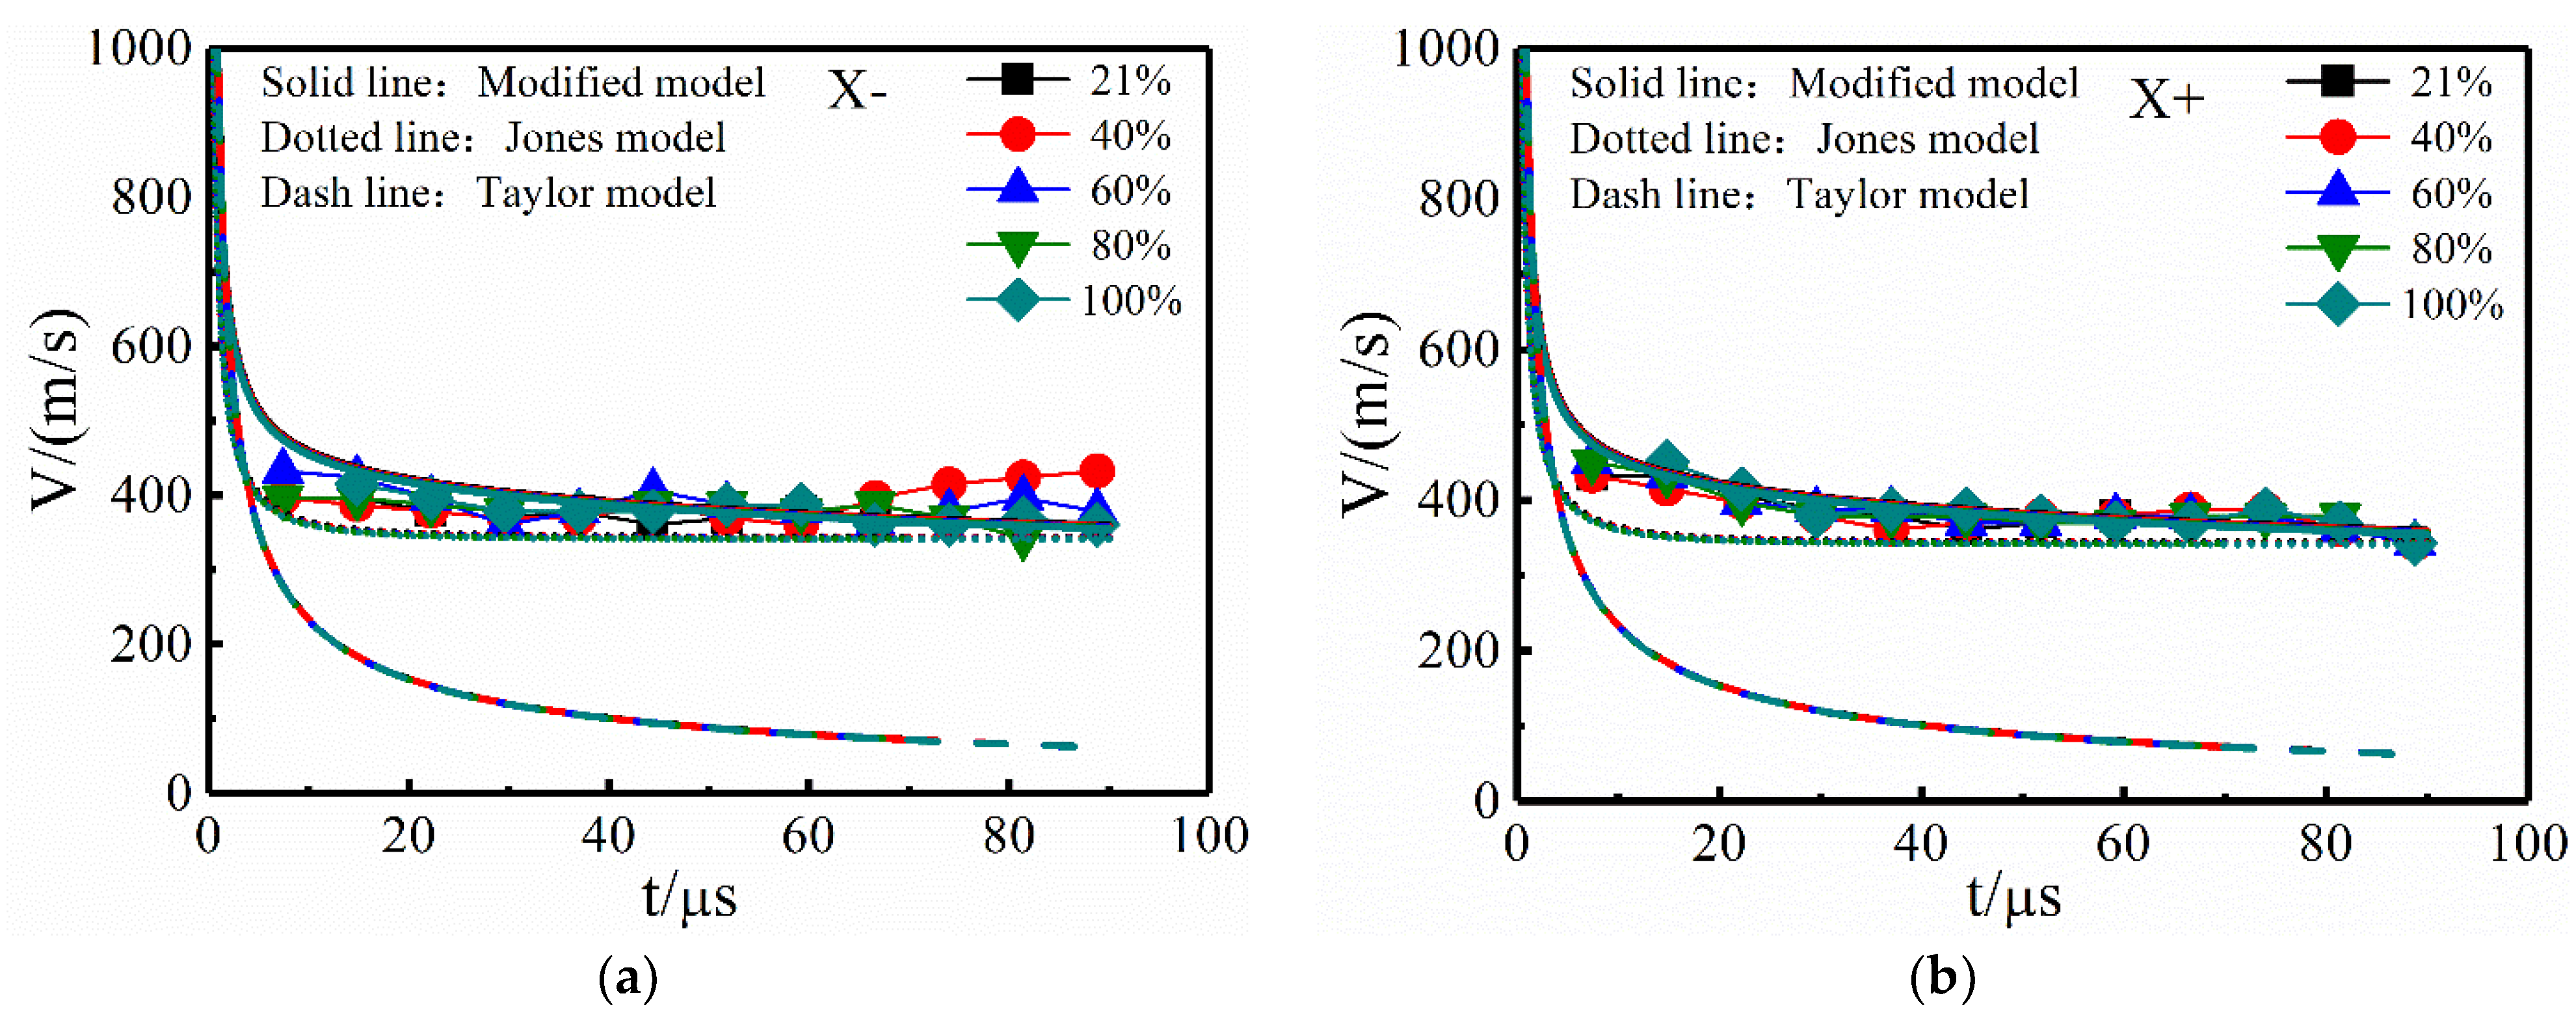
Figure 10 shows the relationship between the shock wave velocity and the oxygen content of the CH
4/O
2/N
2 mixture when the equivalence ratio is 1, and the initial pressure is 1 atm. It can be seen from the figure that the shock wave velocity does not change significantly with the increase in oxygen content. The modified model can still better predict the trend of shock wave velocity. According to the results of the modified model, at t = 20 μs and an oxygen content of 21% and 100%, the corresponding shock wave velocities are 422.89 m/s and 417.44 m/s, respectively. However, it can be seen from
Table 2 that γ decreases with the increase of oxygen content, so the change of component concentration has a certain effect on the shock wave velocity, and it decreases with the decrease of the ratio of the specific heat of the mixture. However, the change of velocity is not obvious, because the γ has only limited effect.
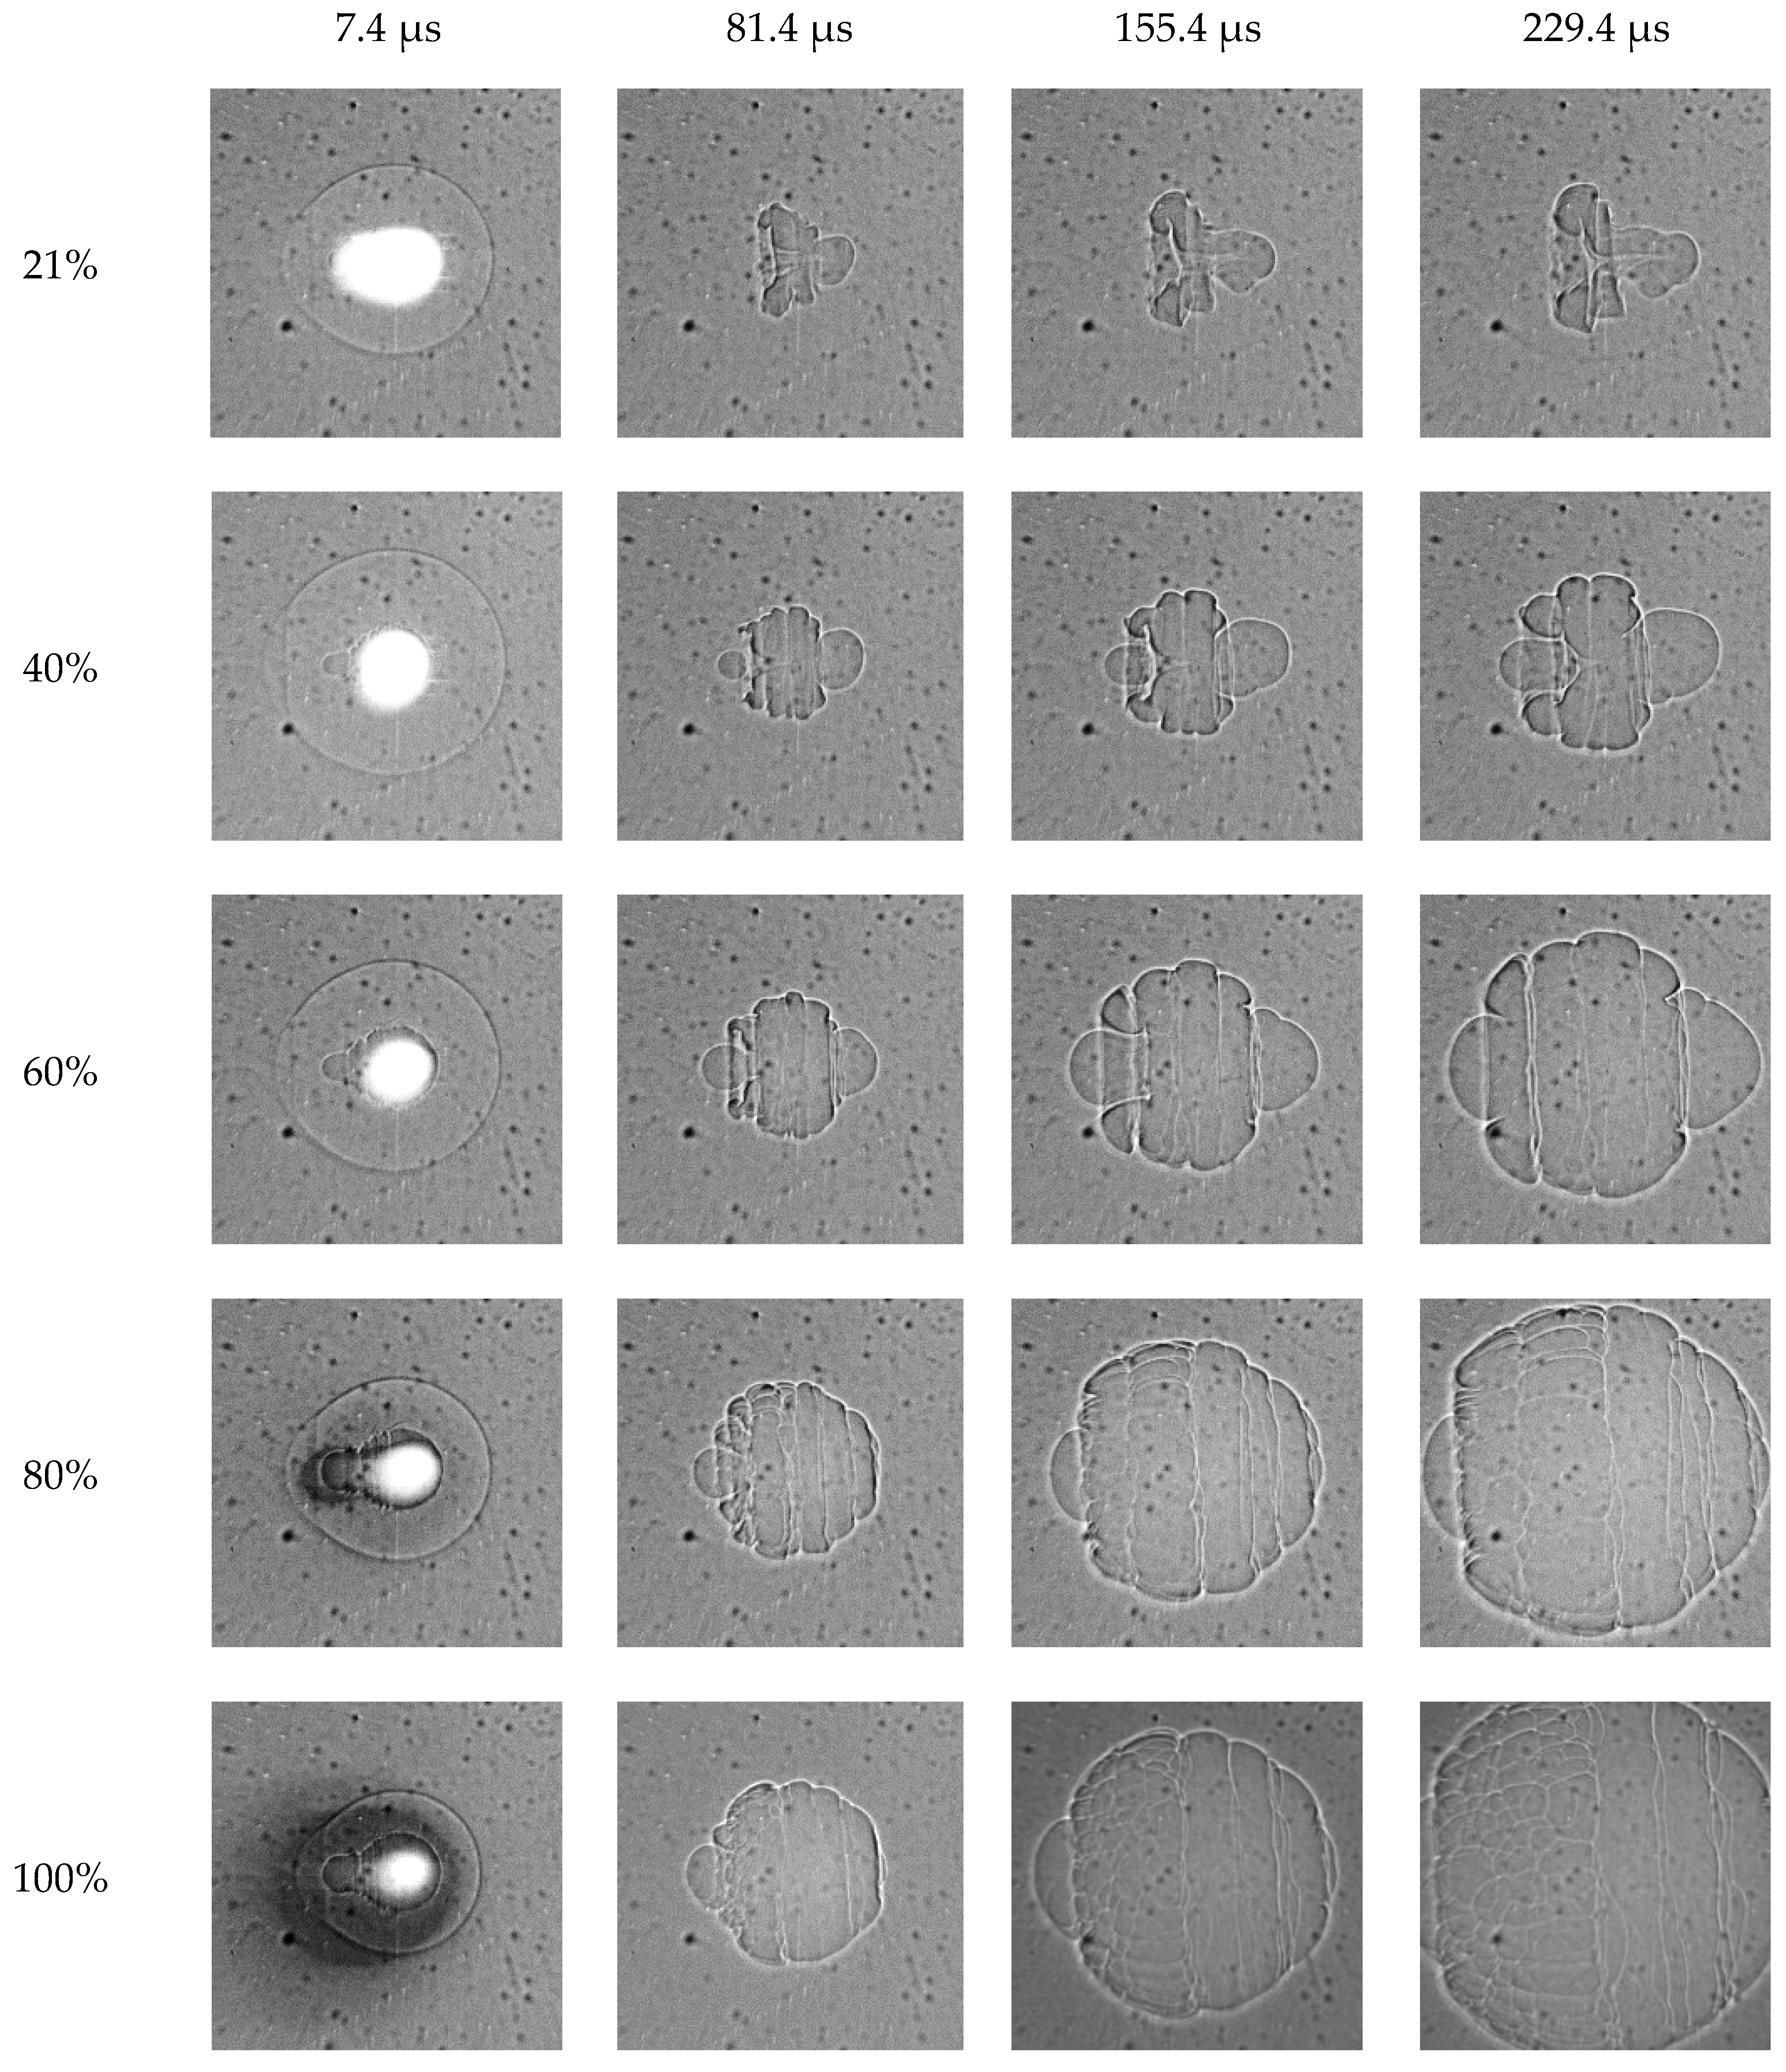
The change of the flame kernel morphology of the CH
4/O
2/N
2 mixture with different oxygen content is shown in
Figure 11. It can be seen that, as the oxygen content gradually increases, the plasma and flame kernel morphologies are obviously different. When t = 7.4 μs, as the oxygen content increases, the brightness of the plasma region gradually decreases, while the size of the flame kernel gradually increases. This may be due to the fact that the increase of oxygen content increases the rate of chemical reaction, then accelerates the absorption and dissipation of energy in the plasma region, so the brightness of this region decays rapidly. Meanwhile, a difference can be seen in the structure of the flame kernel with the increase of oxygen content, and the annular and third-lobed structures disappear completely when the oxygen content increases to 60%, but the size of the flame kernel also increases rapidly with the increase in oxygen content. Through comparative analysis of the development and changes of the flame kernel, the disappearance of the ring-shaped and third-lobe structures is mainly caused by the acceleration of the chemical reaction rate, so that the flame kernel rapidly develops and expands outwards, which will inhibit the airflow of the vortex, resulting in weakening of the vortex structure and the failure of the ring and third-lobe structures to form.


