1. Introduction
The role of local actions towards the achievement of global targets on climate change mitigation is widely recognized by academics and policy makers. The physical characteristics of local energy systems added to the regulatory competences of local authorities, prompt the local level as an appropriate level of action [
1]. The call for a paradigm shift towards more decentralized energy management and use (production/consumption), mentioned in several EU publications (including the Clean Energy Package [
2]) and in worldwide discussions, reinforces this relevance of local actions. Local authorities, as the regulatory bodies closest to the citizens, are in a strategic position to promote this transition towards decentralization, including lifestyle changes and local sustainable energy investments.
The recognition of local actions’ contribution towards climate change mitigation has been accompanied by an increasingly active role of local actors—including local authorities as well as other local stakeholders, such as local businesses, municipal utilities, citizens associations and individual citizens [
3]. For instance, more than 10,000 European municipalities have committed to reduce their GHG emissions level by at least 20%, becoming signatories of the Covenant of Mayors initiative [
4,
5]. There are also several initiatives promoted at national and EU level with the objective of levering sustainable energy planning and climate change mitigation at the local level, such as the European Energy Award, CIVITAS, Managenergy and others.
While local actions become more and more common, it is necessary to properly assess their impact on greenhouse gas (GHG) emissions, i.e., their contribution towards climate change mitigation. Nonetheless, a thorough assessment of local actions and respective effects is still challenging, given the technical difficulty in properly quantifying the effects of climate related policies. The evaluation of climate policies, in general, is already a challenge given the large interaction with other policies (including economic and demographic associated policies). For instance, ref. [
6] illustrates the difficulty in assessing policy effectiveness, focusing on national energy efficiency policies. This difficulty is amplified when dealing with policies implemented at the local level by the fact that they are implemented as a part of a complex multilevel governance framework, which also includes policies implemented at regional, national and international levels. The local energy system is part of a much larger system, influenced by several external factors, and the total change observed is the consequence of all of them. In [
7], the authors demonstrate the importance of local characteristics in the definition and implementation of climate change mitigation policies.
Current practice regarding the assessment of local actions for climate change mitigation consists mostly of the comparison of the local energy system before and after the policies’ implementation, without taking into account external factors, or taking into account, at most, the changes in the national or regional electricity systems [
8]. A more complex and rigorous analysis is still not common practice within local policy making, which is a limitation for the evaluation of local actions.
This paper consists of a demonstration of how a more detailed assessment of local actions, taking into account the effects associated external factors by decomposition analysis, can improve current practice on the evaluation of local actions. Herein, local actions refer to energy-related actions implemented in urban environments, i.e., aimed at the reduction of energy-related GHG emissions at the local level (i.e., scope 1 and 2 emissions). The work presented here includes a short review on the state of the art for the evaluation of local actions. The review is then followed by an explanation of how the decomposition of observed changes into the individual effects of the different factors of change, combined with the analysis of the actions taken by local actors, can be used to improve the assessment of local actions. Due to the nature of the urban nature of the most populated areas, and because the paper is energy-related, the emissions model accounts for CO2 but not for methane. The evaluation methodology is applied to one case study, Malmö, in order to demonstrate its applicability.
The paper is composed by this introduction and four additional sections. The following section is dedicated to a review of the current practice for evaluation of local actions towards climate change mitigation. Then,
Section 3 presents an analysis of how the disaggregation of observed changes can improve current evaluation practice, including a summarized description of the disaggregation model that is used and the discussion on how the model can be used as a tool for the assessment of the evolution of local energy systems.
Section 4 presents the case study of Malmö (Sweden). Finally,
Section 5 summarizes the main findings resulting from this work.
2. Review on the Evaluation of Local Actions for Climate Change Mitigation
The importance of assessing effectiveness, efficiency and relevance of different policies is globally recognized. Policy evaluation is key for the identification and transfer of good practices, as well as for the adjustment of ongoing and development of new policies. There have been several studies focusing on the assessment of energy, climate and environmental policies at different levels, which resulted on the development of a vast set of methodologies to quantify the effects of different policy actions.
Nonetheless, the specific methods for evaluation have not been a recurrent subject for study, at least not as much as would be expected. This might be due to the difficulty in properly assessing their effects. Given the unavoidable interaction with other policies, their contribution to climate change mitigation depends on factors that are not fully controlled by local authorities, and whose disaggregation is neither obvious nor immediate.
Current practice on the evaluation of local actions also reflects this difficulty. The most common assessment of the effects of the Sustainable Energy Action Plans (SEAPs) in the context of the Covenant of Mayors initiative corresponds to the comparison of the energy and emissions inventories before and after the actions’ implementation [
9,
10]. This comparison is relevant, as it provides an insight on the overall evolution of the local energy system, both in terms of energy use and in terms of GHG emissions [
11]. However, this is not sufficient to assess the specific impacts or merits of local actions for climate change mitigation.
There are already some studies that go beyond the analysis of observed changes, which provide more detailed analyses of specific actions [
12,
13]. Such studies use bottom-up models, where the effects are estimated according to the changes caused to the system by the specific policy actions that were implemented at the local level. This alternative approach requires a deep knowledge of the energy system and of the implemented actions, including the changes incurred in the system in physical units (e.g., number of photovoltaic (PV) panels installed, number of persons per kilometer shifted from diesel to electric car, number of appliances/lamps replaced)). Here, the major shortcoming is the difficulty in having the necessary data to establish a reliable and detailed baseline, and to perform a robust bottom-up analysis, especially when assessing the effect of a set of actions covering different sectors.
Thus, in practice, there is still a gap in the assessment of local policy actions, as state-of-the-art practices do not provide methodology for the evaluation of local actions and/or plans which: (1) can be used in a systematic manner with commonly available data and (2) provide an estimate of the real impact of local actions (disaggregated from the effects associated with external factors).
Therefore, taking into account existing limitations from current evaluation practices and considering recent advances in the understanding and representation of the local energy system and respective evolution over time, this paper proposes a new methodology for the assessment of local climate change related actions built upon the top-down decomposition model recently developed and published in [
14].
3. Assessing Local Actions Using a Decomposition Analysis of the Evolution of the Energy System
This section describes how the disaggregation of observed changes of a specific local energy system into the individual effects of the different factors of change can contribute to an improved assessment of local actions. First, there is a short description of the model published in [
14] and used in the quantification of the individual effects (including the methodology and the main inputs and outputs). Then, an explanation on how this model may be used as an assessment tool for local actions is presented, highlighting innovation compared to current practice.
3.1. Model for the Quantification of Local Actions Effects—Brief Description
The factors of change that are considered include the natural evolution of the local energy system, the higher-level governance framework and local climate change mitigation actions. The natural evolution of the system corresponds to the changes in local population and local economy which are not directly associated with energy and climate policies. Factors associated with higher-level governance framework refer to the energy-related policies implemented at international, national and regional level within the studied timeframe. Finally, local actions comprehend all local energy-related policy actions implemented with the aim of reducing local GHG emissions, including both actions taken under a formal plan and isolated actions. In total, the model disaggregates the observed changes into the effects of 18 individual factors, as identified in
Table 1.
The model itself corresponds to a decomposition analysis that, starting from the energy matrices from the base year, sequentially constructs new energy matrices that result from introducing the changes caused by the different factors of change into the local energy system (Equation (1)). Local actions effects are assumed to be the remaining gap between observed changes and the sum of all the effects from the external factors of change (Equation (2)).
where Δ
GHG is the variation in local
GHG emissions between the base year (
t0) and the reporting year (
t1) for the municipality
α, and
Ei is the effect of factor of change
i in local GHG emissions between the base year (
t0) and the reporting year (
t1) for the municipality
α.
The individual effects for the different factors of change are estimated by using already known relations (theoretical or empirically proven), taken from the literature, between those factors and the local energy system. These known relations are translated into mathematical formulas that reflect the changes caused by each individual factor of change to the local energy system. Assumptions have been made to adjust the formulas to the existing data and to allow for their applicability in different contexts.
Figure 1 presents a schematic representation of the decomposition process and the quantification of the different effects.
The model output consists of the quantification of the individual effects associated with each of the 17 external factors and the overall effect of local climate change mitigation actions in terms of final energy and GHG emissions.
Acknowledging the impossibility of guaranteeing the consideration of all the relevant factors (given the diversity of local contexts) and the risks of assuming the remaining effect as an estimation of the effect of local actions, the methodology includes a set of procedures that improve the robustness of the model results. These correspond to (1) the implementation of the model to municipalities that are within the same (or in a similar) context than the municipality being studied and (2) the comparison between obtained results and reported actions.
A more detailed description of the model, the governing equations and accompanying validation procedures can be found in [
14].
3.2. How to Use the Model as a Tool for the Assessment of Local Actions for Climate Change Mitigation
The disaggregation model described in the previous section can be a useful tool for the assessment of the local path towards a sustainable energy system. It provides an overview of the observed changes in the local energy system for a specific timeframe, and also a robust estimation of the effect of local actions per sector.
In what concerns the overall path of the local energy system, the model outputs can be useful in two distinct ways: first, on the assessment of the evolution of the local energy system over time and second, by assisting on the identification of external synergies and/or barriers regarding the achievement of the established sustainability goals. Concerning the first, the comparison between the energy matrices from the base and the reporting years may provide important insights regarding the evolution of the local energy system, regardless of the factors that have led to the observed changes. This analysis, done per sector and per energy carrier, gives a first overview of the changes that occurred in the local energy system and may result in a set of indicators regarding the unitary energy use and respective GHG emissions and their evolution over time. Concerning the second, as a specific feature of this model, the disaggregation of the observed changes into the individual effects of each factor of change can be used to have a better understanding what contributed more significantly to the observed changes. It can provide relevant insights on the influence of each factor upon the evolution of local GHG emissions, including the identification of which factors are hampering and which are contributing the local path towards a sustainable energy system.
In what concerns the quantification of the effects associated with the local actions towards climate change mitigation, their assessment can be used to evaluate the actual contribution of local actions (overall and per sector) for the achievement of a sustainable energy system. The comparison between the results of the disaggregation model and the targets established by local authorities can be seen as a tool to compare what was achieved with what was intended. This analysis may inform decision makers on the need to review, accelerate or simply maintain their actions towards climate change mitigation. On the other hand, a comparison between the ex-ante projections of the implemented actions with the estimated effects provides an assessment of the effectiveness of those actions.
4. Application to the Case Study of Malmö (Sweden)
This section is dedicated to the implementation of the evaluation methodology to the municipality of Malmö (Sweden). This choice was based on the following cumulative criteria: (1) to be a signatory of the Covenant of Mayors, with an approved SEAP (submitted in 2011) and with the first monitoring report already published in 2015; (2) being in the forefront on the availability of data from the local energy system and its evolution over time and (3) having a long history regarding climate change mitigation.
4.1. Characterization of the Case-Study
Malmö is a municipality located in the southern region of Sweden, in Skåne County. In 2015, it had a population of about 323 thousand inhabitants distributed in an area of 157 km
2. The municipality has grown over the last years due to its strategic location—15 min away from Copenhagen (Danish capital) and from Lund (with one of the largest Swedish universities). This growth has been accompanied by a continuous increase in local population, which increased almost 50% over the last 30 years. Malmö is mostly an urban municipality, and the provision of services corresponds to its main economic activity. A brief characterization of the municipality and its evolution between 1990 and 2015 is presented in
Table 2.
In what concerns energy and climate actions, Malmö has been a pioneer, with concerted actions since the 1990s. Its first interventions were done in the context of the Local Investments Program (LIP), a national investment program that promoted the development of local environmental plans and initiatives. Currently, Malmö local administration is committed to become climate-neutral by 2020. Moreover, in the Sustainable Energy Action Plan submitted to the Covenant of Mayors, the city set as a target the supply of local energy use to be exclusively from renewable sources by no later than 2030 [
15].
The timeframe considered for this case study is between 1990 and 2015. The choice of the base year is associated with the fact that 1990 was the year considered for the first inventory of local GHG emissions for the municipality of Malmö, being also the base year of the municipality’s SEAP. The reporting year corresponded to the most recent year with available statistical data for local energy use. The studied timeframe covers the period when concerted actions taken by the local authority towards climate change mitigation have been more significant.
4.2. Main Input Data
An important stage of the application of the model refers to the collection of input data.
Regarding the construction of the energy matrices, the main sources of input data were the official statistics on energy and end-use consumption published yearly by the Statistics Central Bureau (SCB) [
16,
17]. Moreover, as there are no empirical data regarding the end-use efficiency for the different energy uses for the municipality of Malmö, the estimations provided by the energy matrices for the Metropolitan Area of Porto [
18] (complete and readily available) were used as reference and adapted to the local context. The level of detail from the information available for the Metropolitan Area of Porto, along with the limited impact that the assumptions on end-use efficiency could have on the model results, justify this choice. The values for end-use efficiency were adapted to local context, taking into account existing data on technology options and average efficiency of different appliances in Portugal and Sweden.
Table 3 lists the main input data required to build both base and reporting years’ energy matrices with the respective data sources.
In what concerns the disaggregation of the individual effects per factor of change, an effort was made to collect data as accurate as possible (i.e., specific to the municipality and to the studied timeframe) in order to reduce uncertainty. When data was not available for the specific geographical context, the collected data corresponded to the closest territorial level to which the data was available and, if necessary, the values were adapted to the municipality level using downscaling indicators. Moreover, when specific values for base and/or reporting years were not found, these were estimated from the existing values using trend analysis.
Table 4 lists the collected input data along with the respective sources and geographical level.
Recognizing the relevance that assumptions and input data may have on the model results, the methodology includes a fine-tuning process that, as much as possible, ensures the adequacy of the assumptions and the reliability of the input data, in order to guarantee the robustness of the results. The decomposition model was applied to six surrounding municipalities (Helsingborg, Kristianstad, Landskrona, Lund, Trelleborg and Ängelholm) and the obtained results were assessed individually, and in comparison, with each other. This exercise provided additional validation of the results obtained for the municipality of Malmö, by assessing whether plausible results can be obtained for the other municipalities when using the same inputs’ data sources and assumptions.
4.3. Model Results for Malmö
4.3.1. Overall Evolution between 1990 and 2015
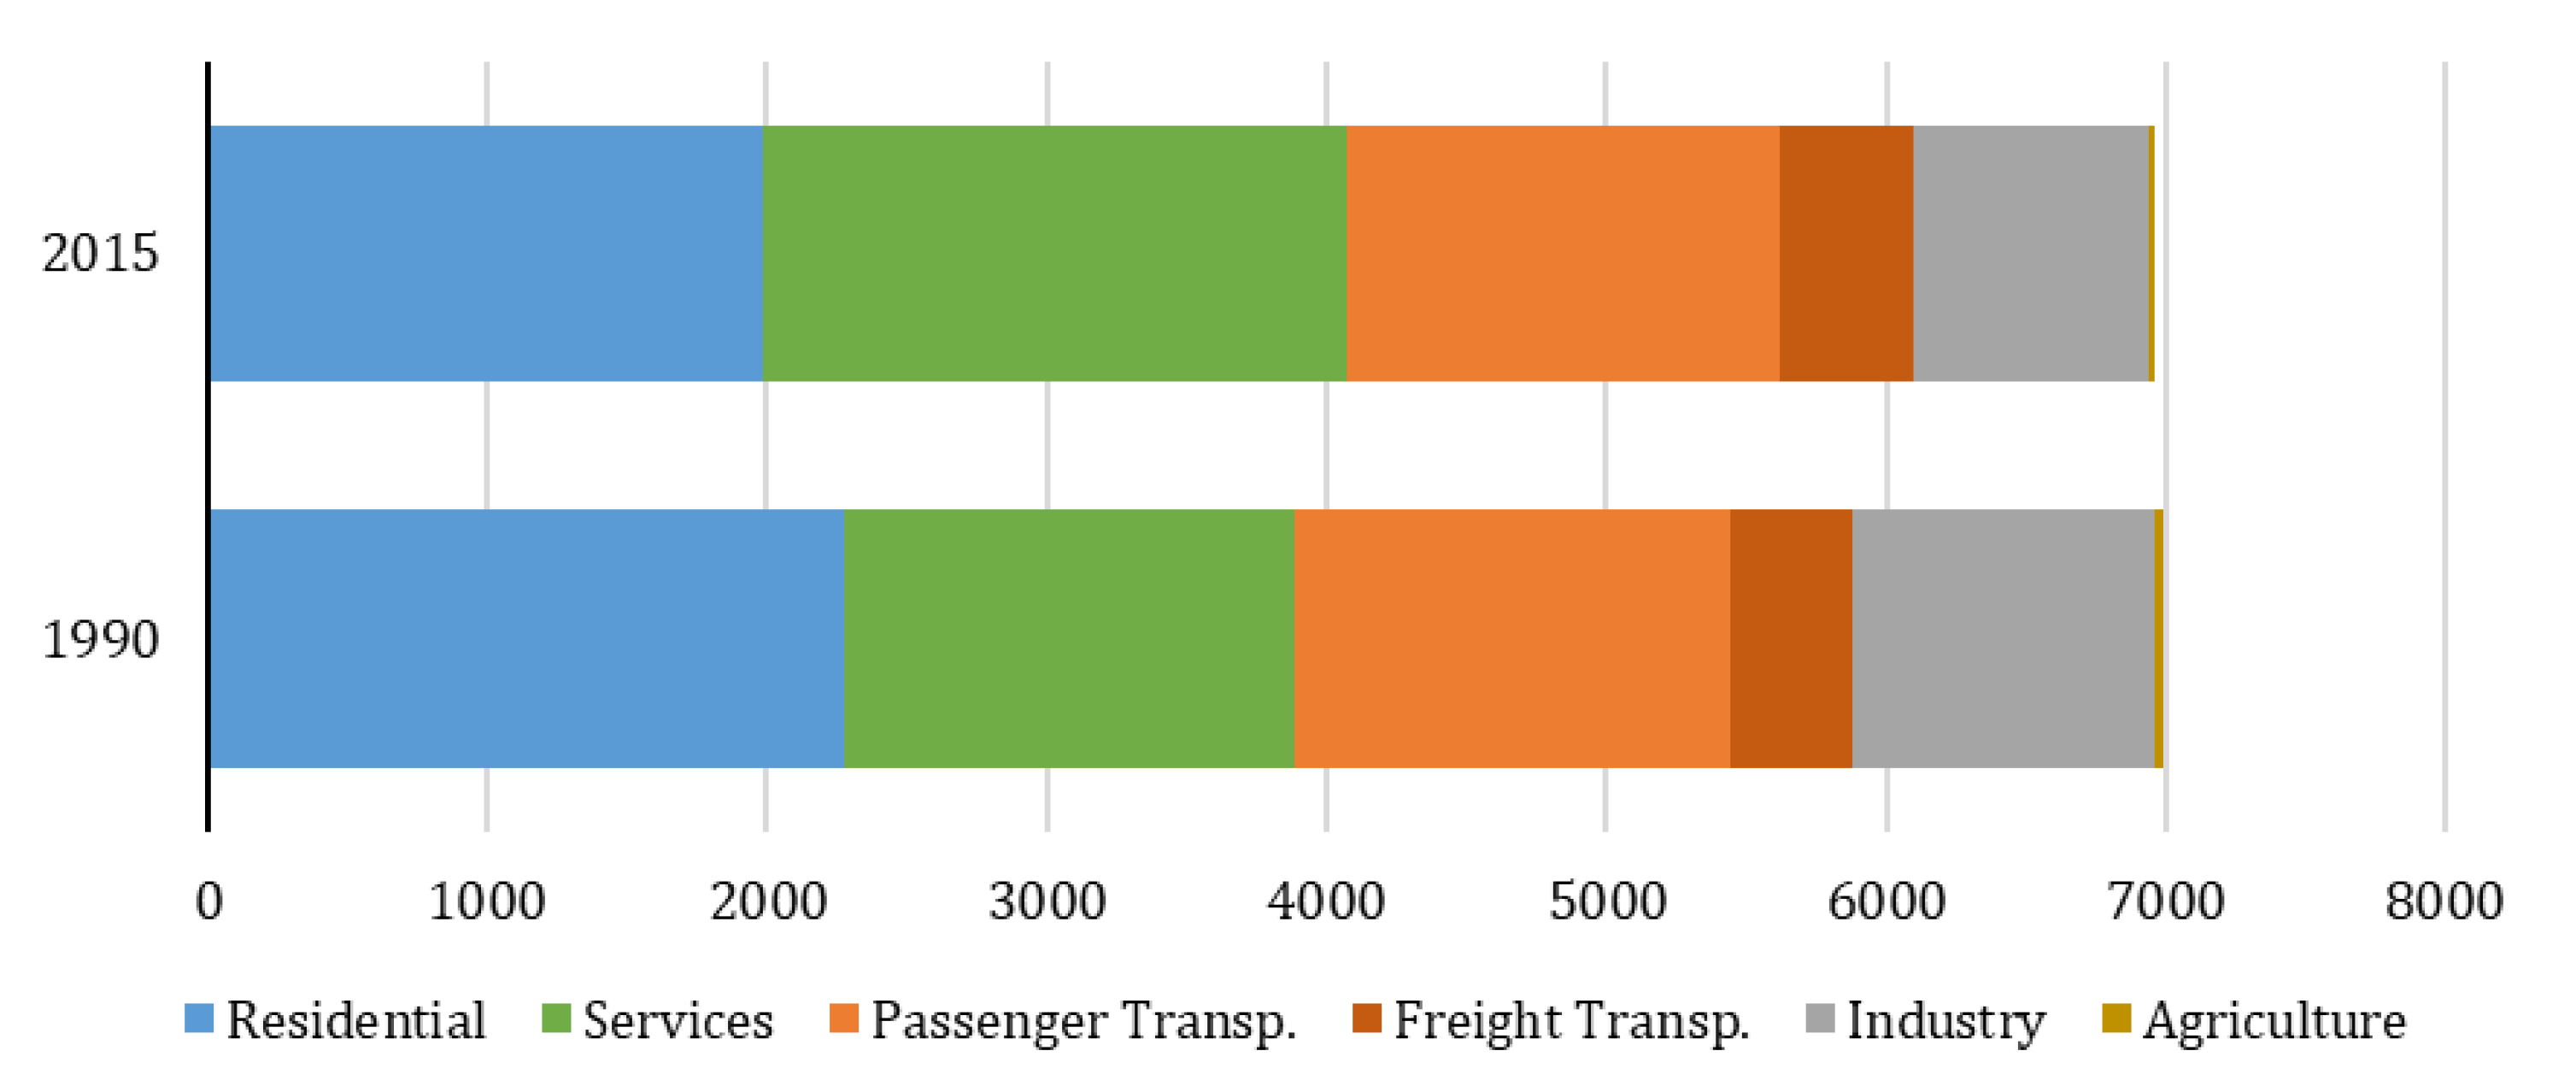
Figure 2 shows the change in annual final energy per sector (GWh) for the municipality of Malmö, between 1990 and 2015. In what concerns final energy, the overall energy use remained fairly constant over the considered timeframe. However, changes were observed at the sectorial level, with the exception of the transport sector (both passenger and freight) where the use of energy was kept almost constant. The services sector is the only sector with a significant increase in energy use (30%). The remaining sectors show a decrease in energy use over the studied timeframe. The sector with the highest absolute decrease is the residential sector, reducing about 290 GWh/year, what corresponds to 13% of the sector’s energy use in the base year. Nonetheless, the agriculture and fisheries sector is the sector with the highest relative decrease, reducing to 55% of the base year’s energy use by 2015.
The evolution of local GHG emissions between 1990 and 2015 shows a downward trend over all the sectors, as shown in
Figure 3. GHG emissions refer to CO
2, CH
4 and N
2O; and the level of emissions in tCO
2 eq. is estimated based on the carbon content of the different energy carriers and the respective global warming potential, as reported in the IPCC Guidelines for National Greenhouse Gas Inventories [
22]. Overall, the emissions in the reporting year correspond to 78% of the emissions in the base year. This reduction seems to be a combination of the shift to less carbon intensive energy carriers with the reduction of the carbon content of fossil heat distributed through district heating. Indeed, it is noticeable that, while final energy use in the services sector has increased, the equivalent GHG emissions decreased (almost 30%), due to the significant weight of district heating on the sectorial energy use. In addition, the decrease in GHG emissions in the residential and industry sectors (39% and 30%) is more significant than the decrease in the equivalent final energy use (13% and 22%).
Summarizing, the observed changes in the local energy system between 1990 and 2015 correspond to an almost negligible change in final energy use and a considerable decrease in the respective GHG emissions. The reduction of GHG emissions (19%) may be justified by the decarbonization of the heat production sector and by slight shifts of energy carriers. Despite the significant increase in the number of local inhabitants within the studied timeframe, the level of final energy use was kept constant and the equivalent GHG emissions decreased, which implies a decrease in the level of final energy use and GHG emissions per capita. The average use of final energy per capita decreased almost 30% between 1990 and 2015, while the observed reduction in GHG emissions per capita (41%) was considerably higher than the overall reduction (19%). The main energy indicators for the municipality of Malmö are presented in
Table 5, for both base year and reporting year, in order to provide an overview of the observed evolution of the local energy system.
4.3.2. Disaggregated Effects Associated with the Several Factors of Change
When applying the decomposition analysis to the case study of Malmö, the changes that occurred in the local energy system between 1990 and 2015 were disaggregated into 17 external factors plus the effects associated with local climate change mitigation actions [
14].
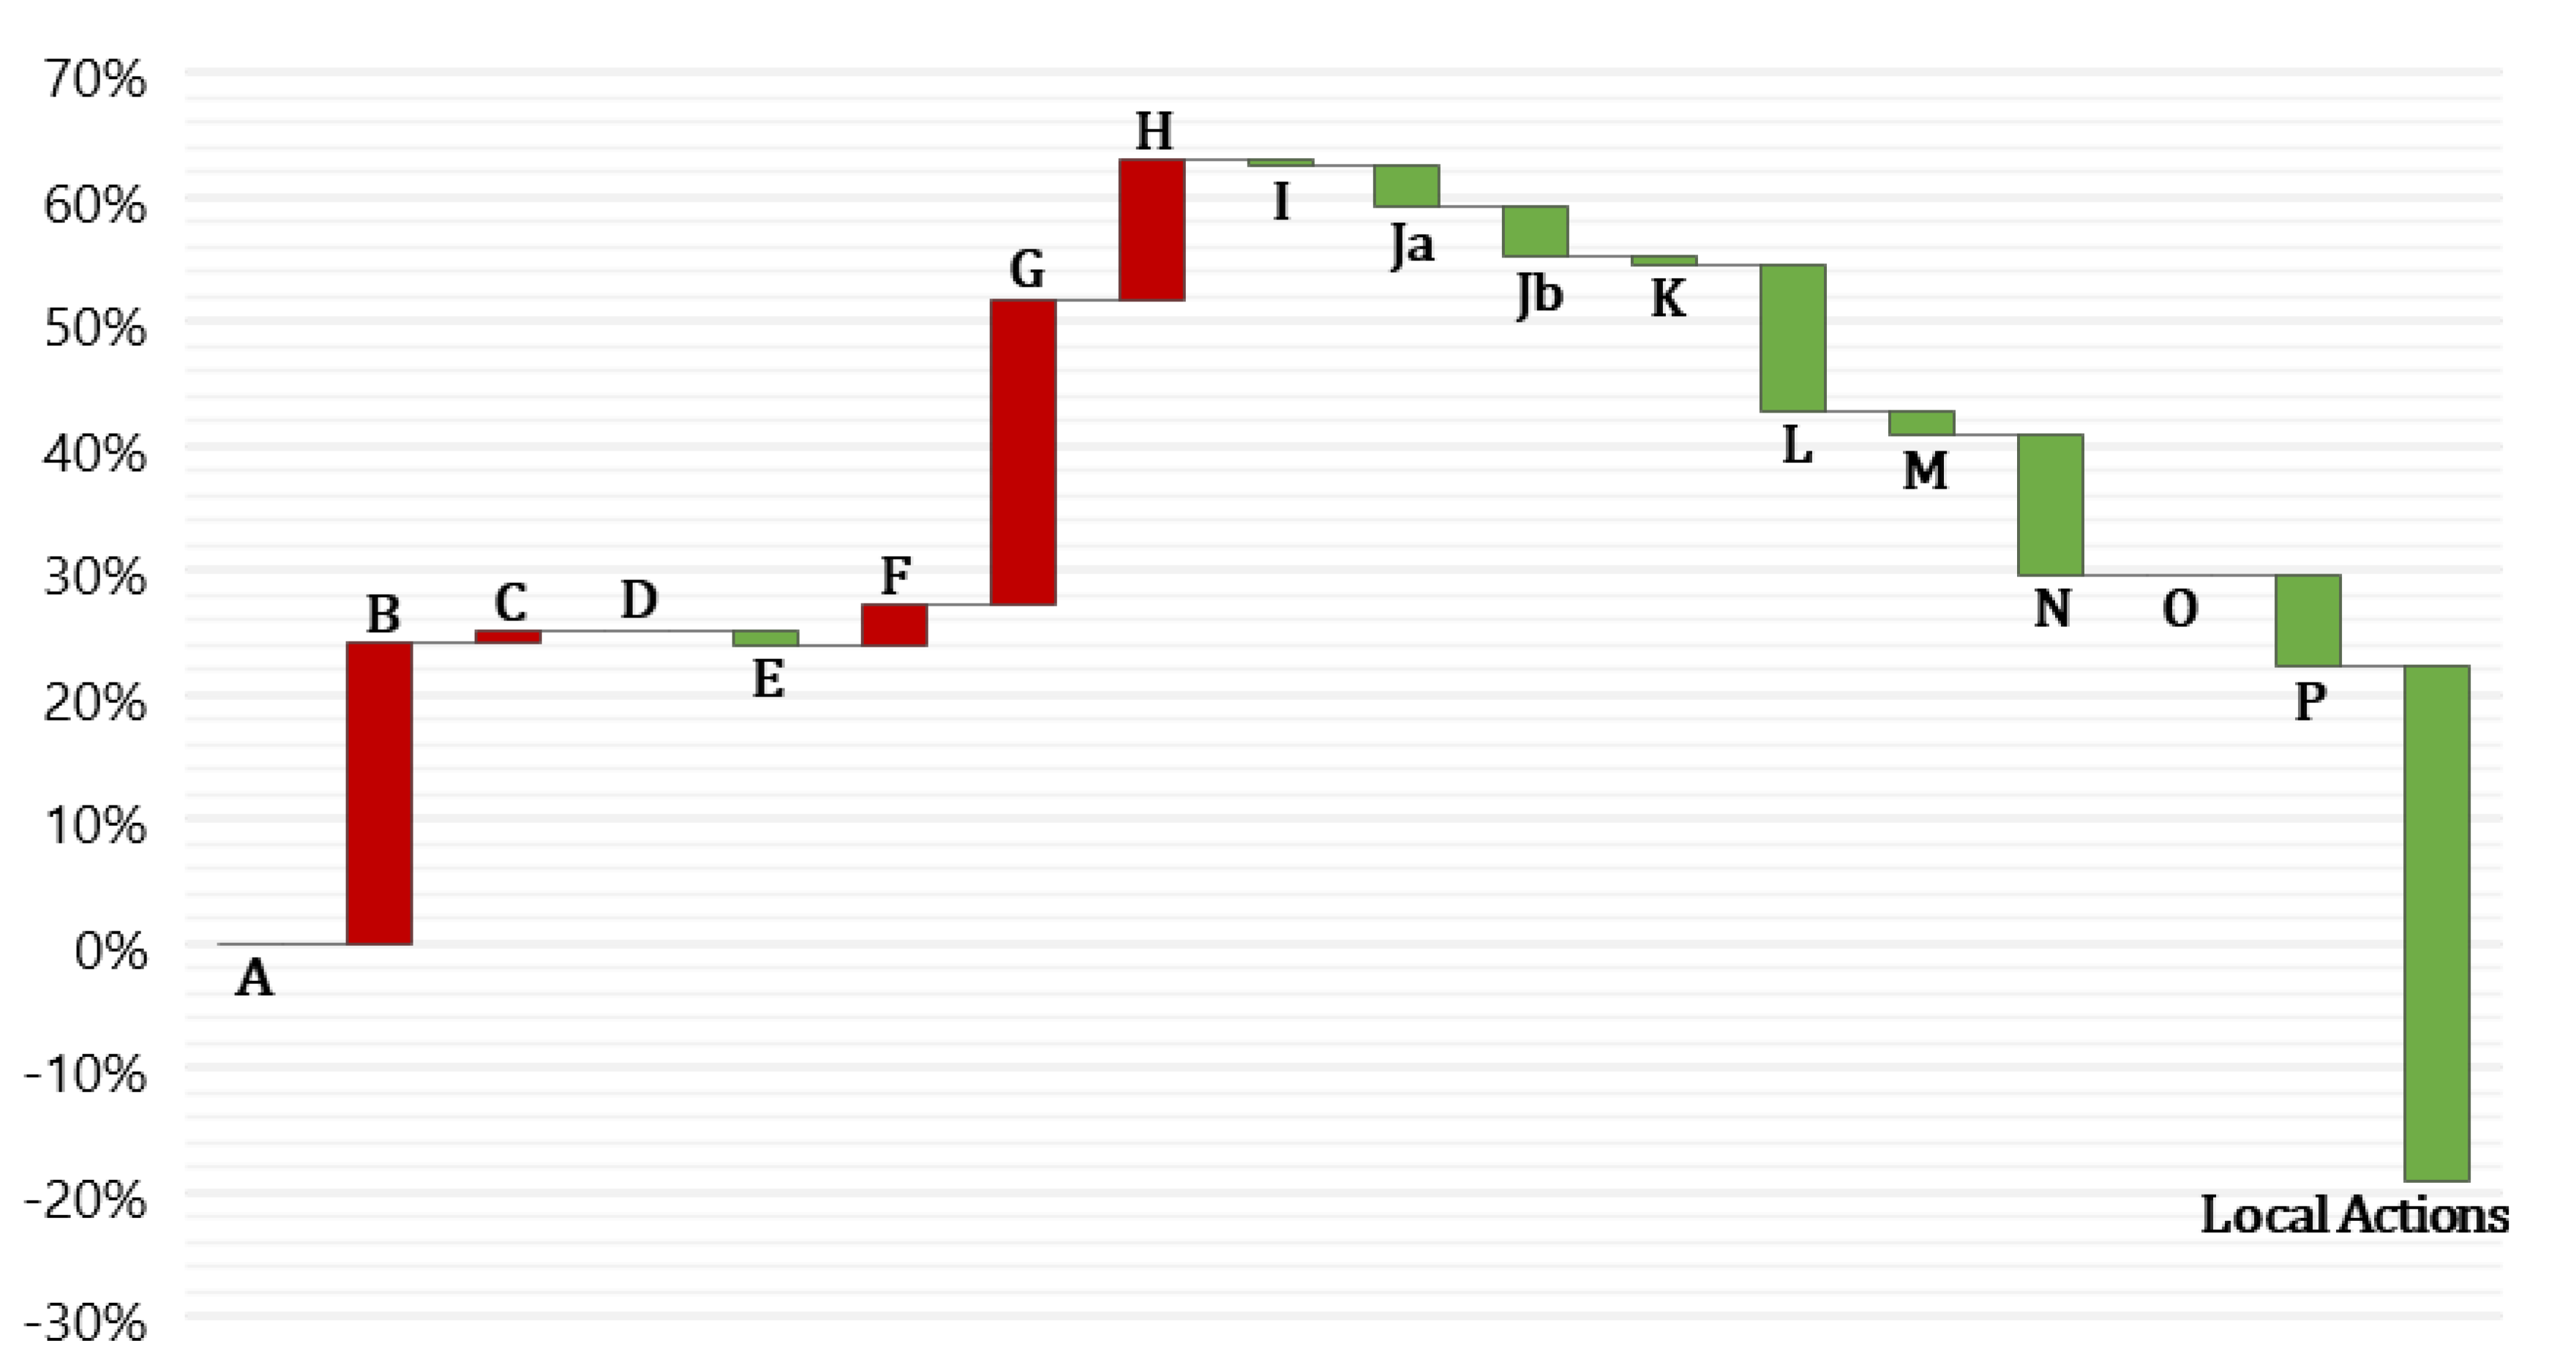
Figure 4 presents the estimated effects, in terms of GHG emissions, per factor of change.
From the analysis of the graphic, it is clear that the largest contributions towards the reduction of local GHG emissions are:
(1) Energy taxes, which are all the taxes applicable to energy products, which are associated with energy and climate policies. In Malmö, these include the energy tax (with the goal of improving energy efficiency), the CO2 tax (implemented to promote the shift to less carbon intensive energy carriers) and a special tax (associated with GHG emissions, other than CO2)).
(2) Transport regulations, which in the specific case of Malmö include the incorporation of biofuels in the traditional fuel mixtures and the incentives implemented to promote the substitution of traditional fuels light-weight vehicles with vehicles running with biofuels).
(3) Local climate change mitigation actions. Nonetheless, the contribution of local actions is significantly higher than the ones from the remaining factors. This could be explained by the long history of Swedish municipalities, in general, and Malmö, specifically, in having an active role towards climate change mitigation, a role that has been highly supported by national initiatives.
It was also estimated by the model that a few factors of change had a counteracting effect towards the reduction of GHG emissions. Here, the demographic evolution and the changes in activity level and structure of the local economy were the ones with a more significant effect, corresponding to an increase of 24.1% and 24.5%, respectively, of local GHG emissions compared to the base year’s level.
Moreover, when looking at
Figure 4, it is worth noticing that the first insights on the overall evolution of the local energy system did not reveal the changes that occurred in the demographic and socio-economic dynamics of the municipality. Even if the energy matrices from the base and reporting years did not reveal abrupt changes in the local energy system, the disaggregation into individual effects showed that there were, in fact, significant changes in the activity level and structure of the local economy as well as in the population size, and that these were counteracted by the effects of other factors of change.
4.4. Assessment of the Local Path towards Climate Change Mitigation
4.4.1. SEAP Malmö—Proposed Actions and Implementation Status
The municipality of Malmö was a pioneer in recognizing the importance of local actions towards climate change mitigation and environmental sustainability. Since the 1990s, the local authority has had an active role on the promotion of climate change mitigation by acting on their own infrastructure and by prompting others to act. Since then, there different plans and strategies were developed towards a sustainable future in terms of energy (but not only).
On the vision and goals established for Malmö’s energy system, the most recent publication refers to the Covenant of Mayors adhesion, in 2008, where the municipality established the target to reduce local energy use per capita by 20% (compared to average annual use during the period 2001 to 2005) and GHG emissions by 40% (compared to the 1990 level) by 2020. In the Sustainable Energy Action Plan submitted to the Covenant (herein, SEAP Malmö), Malmö’s city authority also committed to at least 50% of the local authority’s energy use to be from renewable energy sources, with a large proportion being produced locally [
15]. The proposed actions covered the different sectors and focused on achieving a more effective energy use and switching to renewable energy sources.
Table 6 presents a summary of the technical measures proposed by the local authority.
From 1997 up to today, the city authority publishes an annual report on the local actions towards local environmental sustainability [
64,
65,
66,
67,
68,
69,
70,
71,
72,
73,
74,
75,
76,
77,
78,
79,
80]. These documents allowed for an appropriate understanding of the efforts being done to achieve the vision described above.
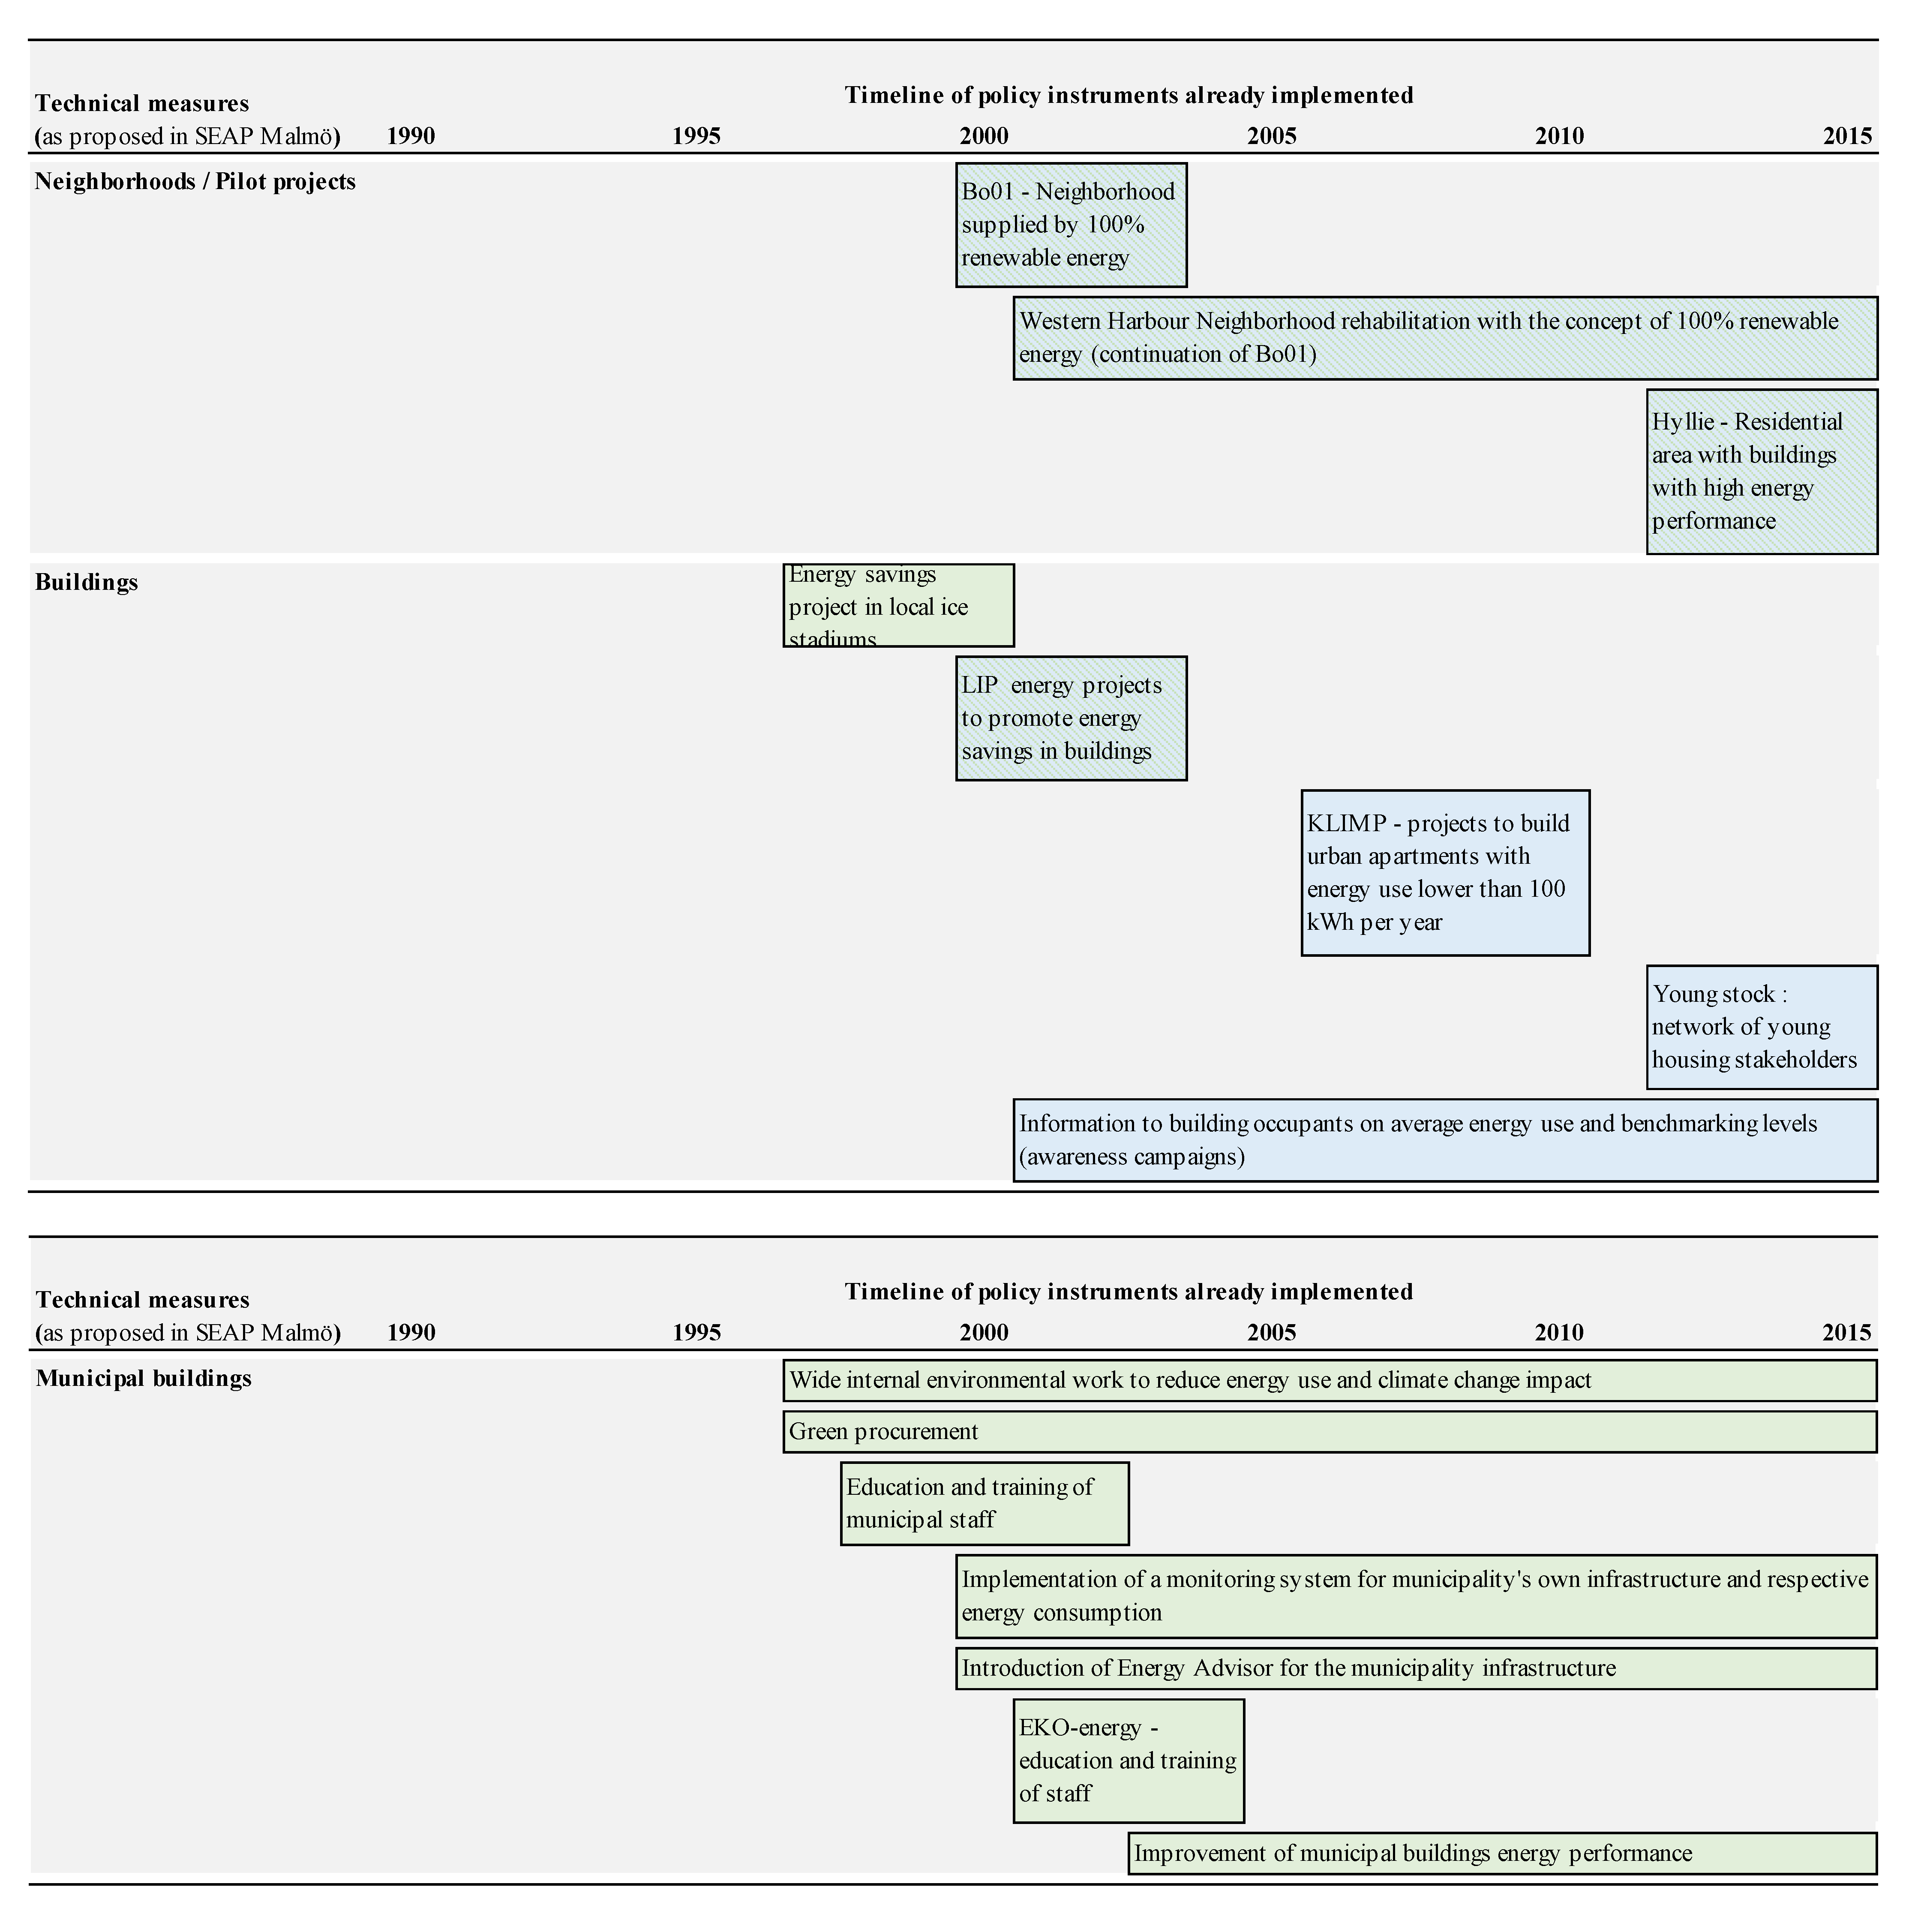
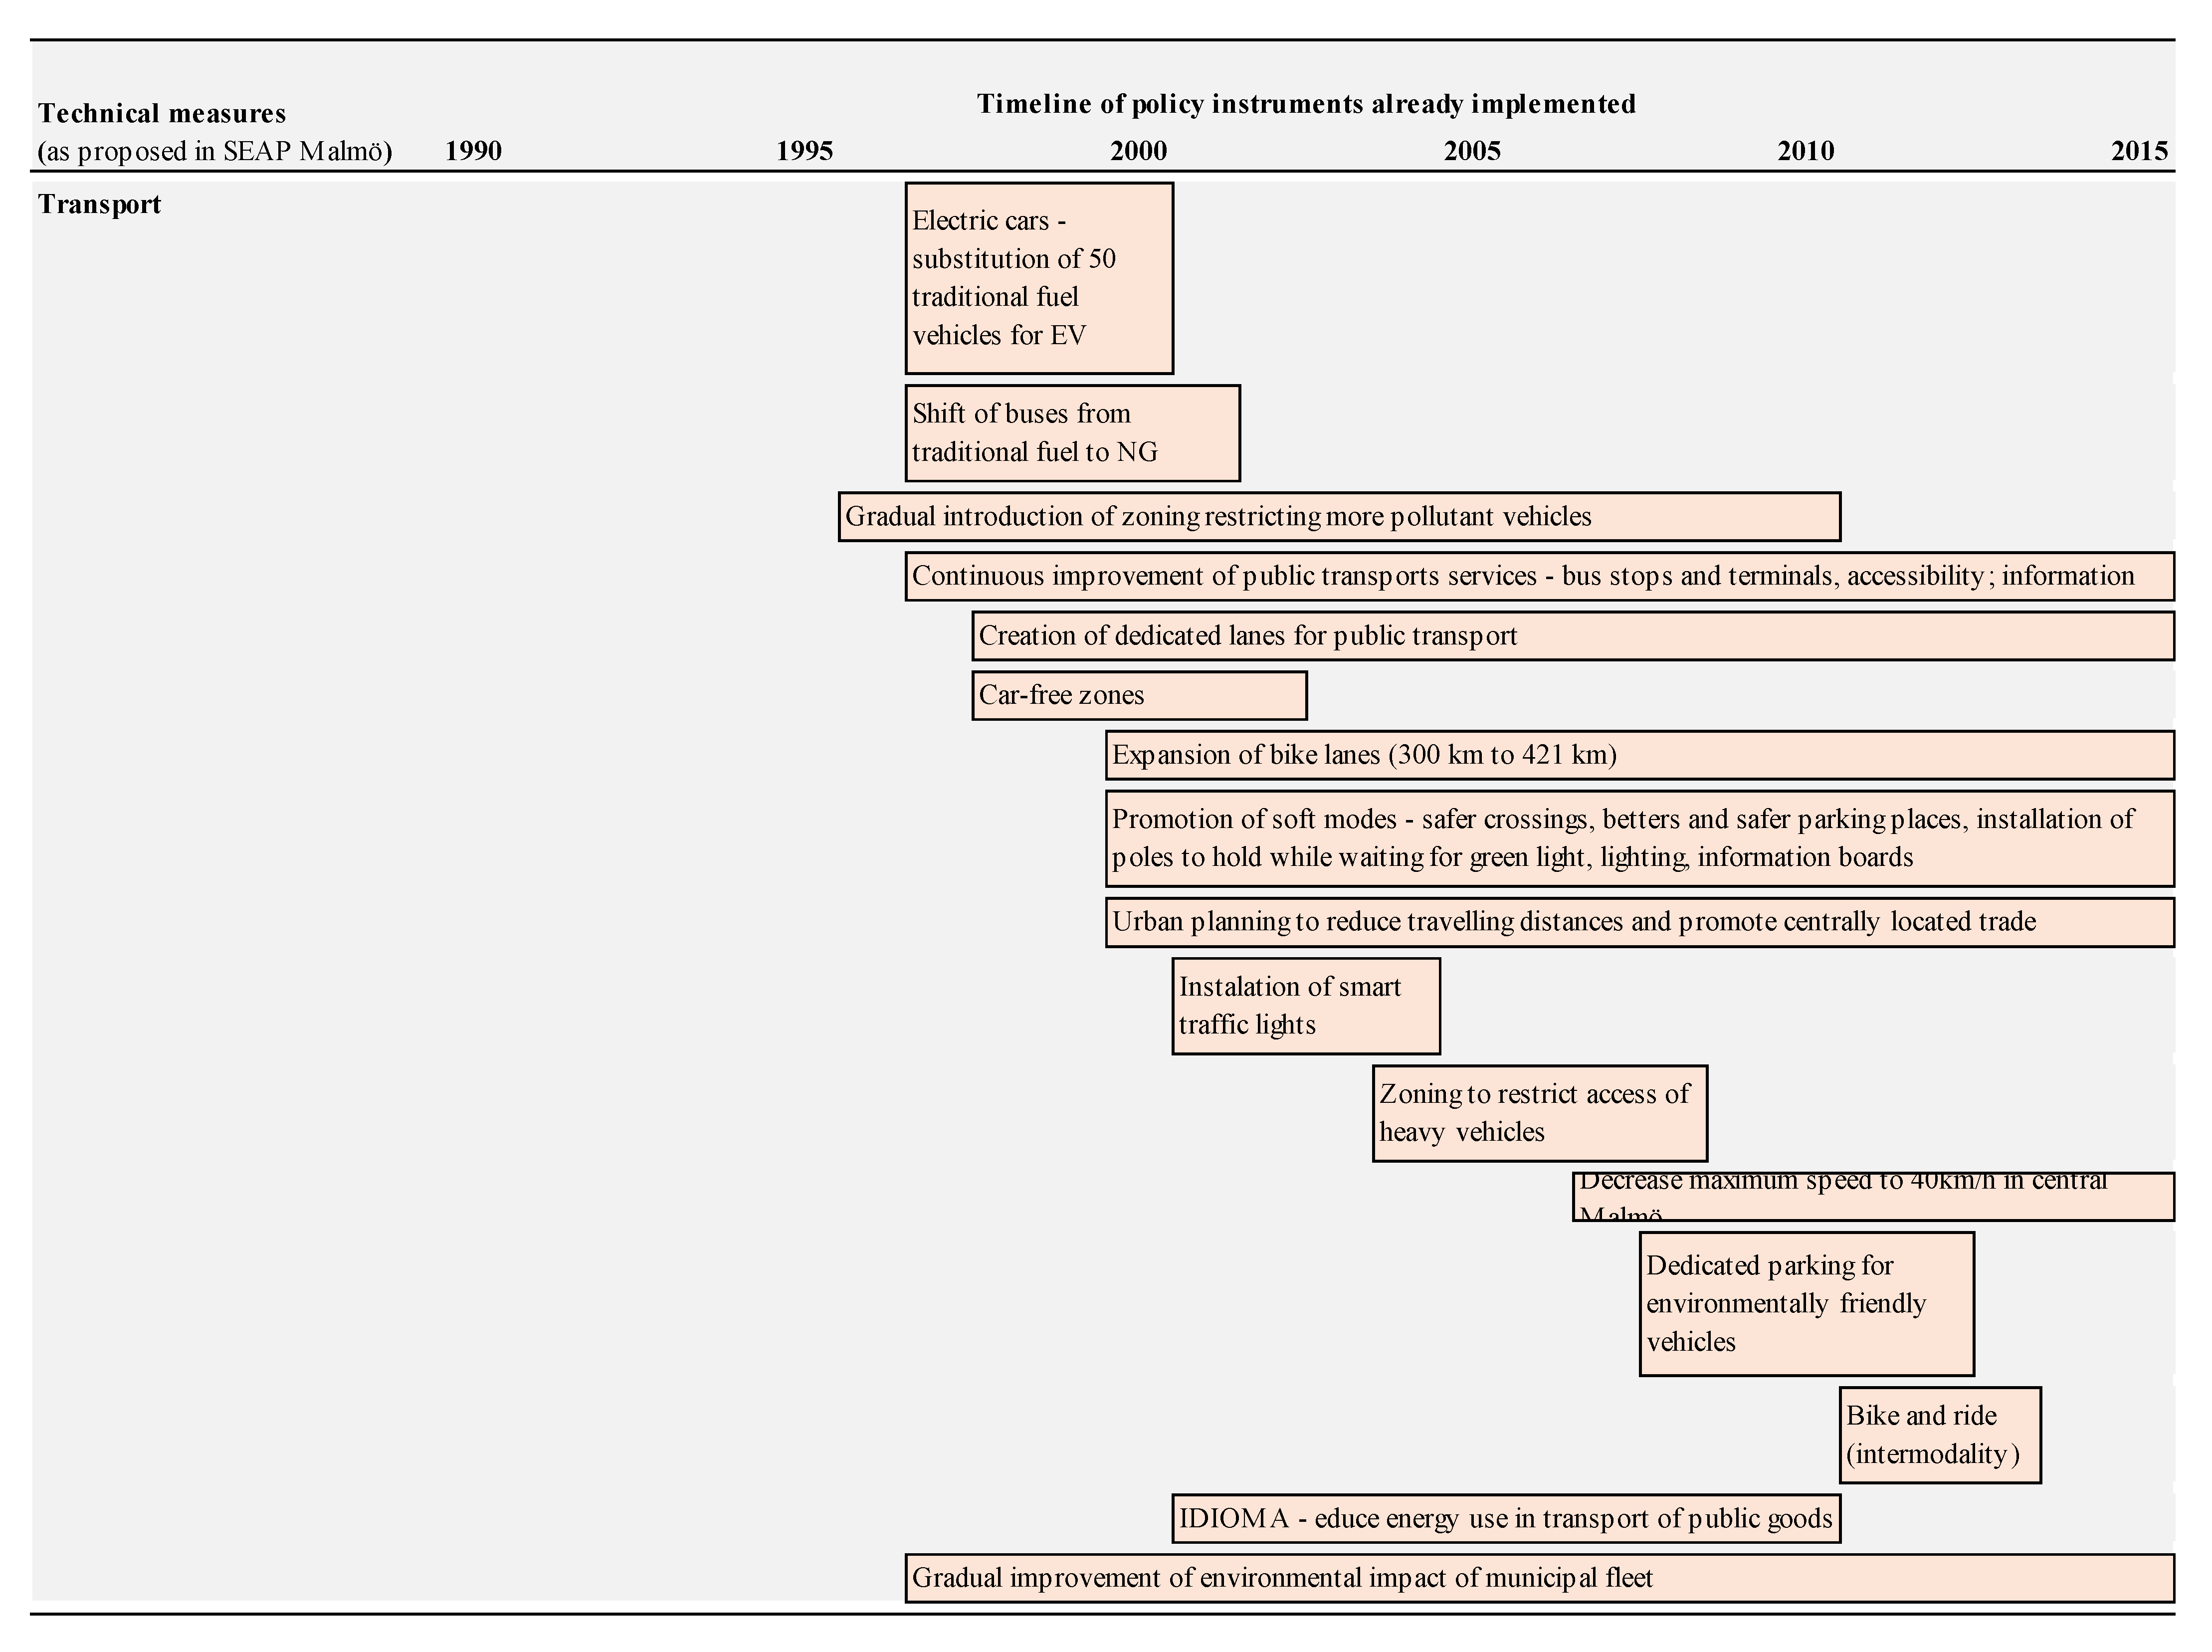
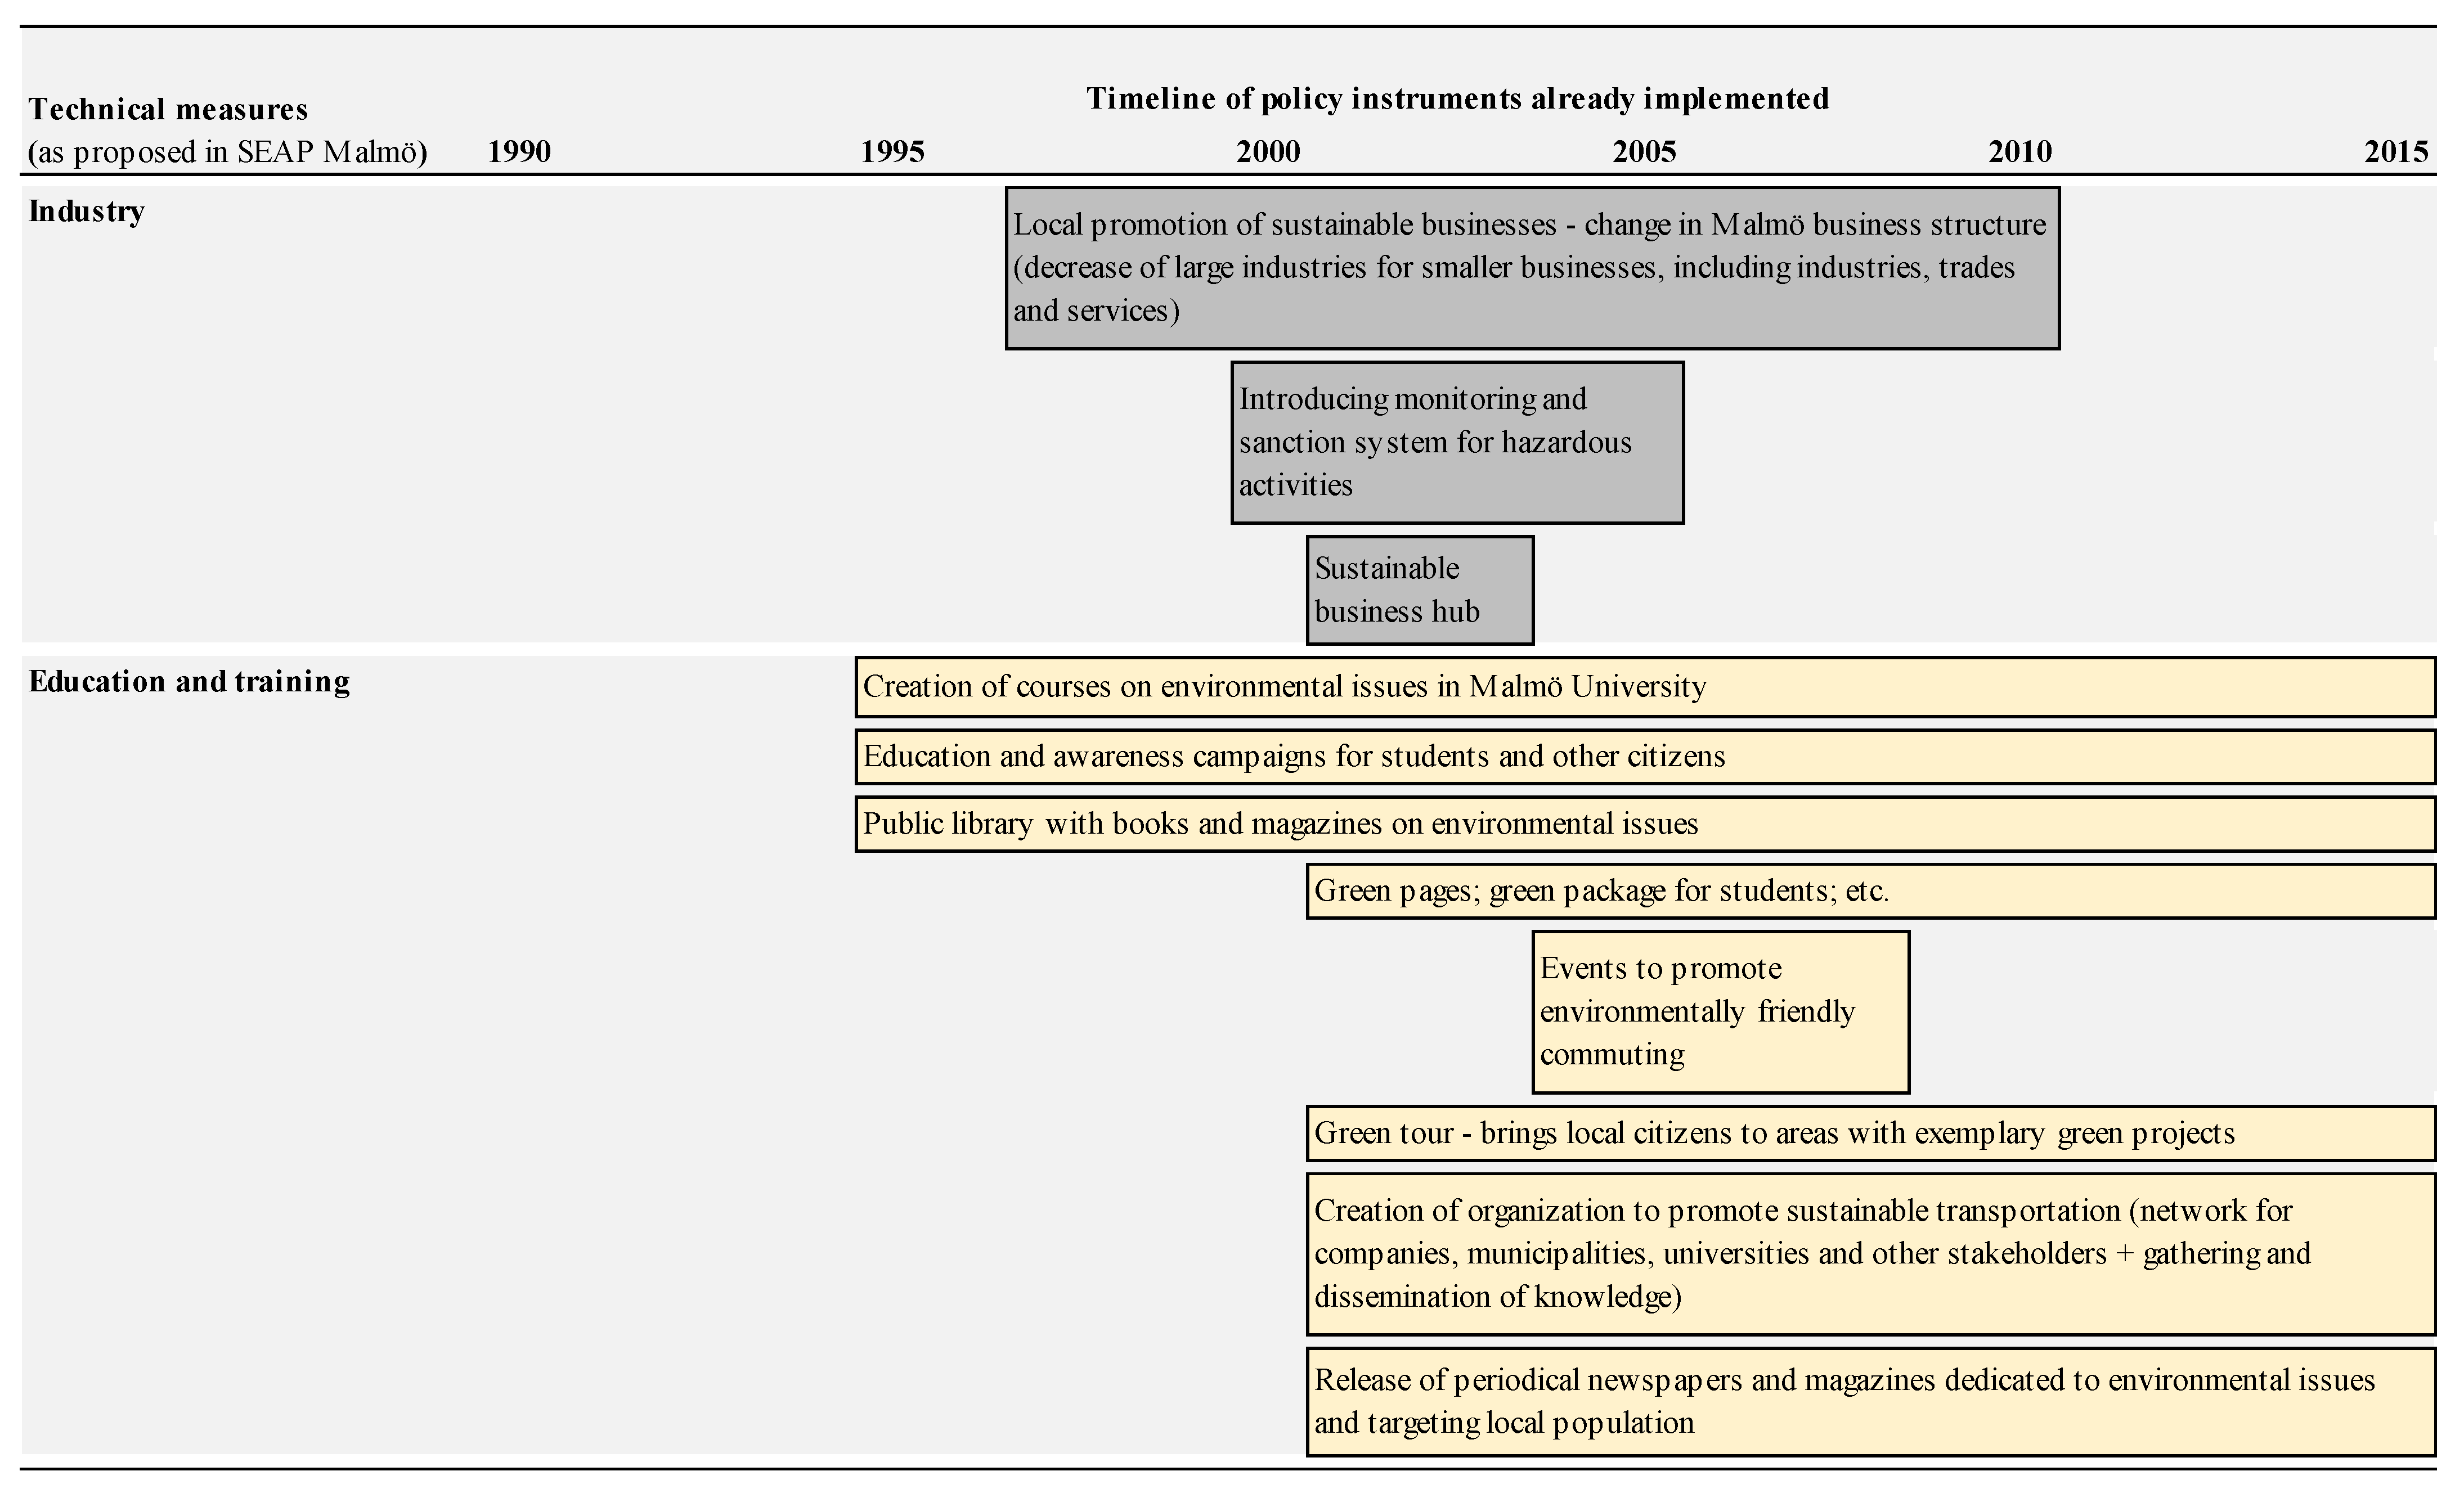
Appendix A (
Figure A1) presents a summarized timeline of the actions taken by the local authority towards a more sustainable energy system. Between 2013 and 2015, a survey on the status of implementation of the actions proposed by the city authority was performed. The respective activity reports present an overview of the survey outcomes, concluding that there is still a large number of actions ongoing or not yet implemented that should have been completed by the end of 2015.
4.4.2. Overall Pathway
Table 7 presents a comparison between the observed changes and the goals established for 2020 by the local authority in the SEAP Malmö, for the local energy system and specifically for the local public sector. This comparison shows that the municipality is indeed moving towards the established goals, especially in what concerns the reduction of final energy use per capita. The evolution of the final energy use associated with the infrastructure owned by the municipality is the exception, given that an increase of 13% in the respective energy use was observed while the established goal was a reduction of 30%. However, this evolution can be justified by the increase in local energy services, due to the municipality’s population growth. The comparison between observed changes (as assessed by the model) and the projected evolution of local GHG emissions provides an insight on the alignment of the actual evolution of the local energy system with the goals established for the municipality of Malmö (also considering national and international initiatives). This corresponds to the assessment of the overall distance to the projected pathway, regardless of the factors of change that have caused such evolution.
Regarding the reduction of local GHG emissions, the observed reduction by 2015 corresponds to about half of the reduction target established for 2020. Moreover, as visible in the plot presented in
Figure 5, if a linear evolution over time is considered (dotted line), it is possible to say that the observed reductions in local GHG emissions are behind what was projected by the SEAP. However, considering a trajectory where the decrease in GHG emissions would be smaller up to 2008 (when Malmö adhered to the Covenant of Mayors), the observed reductions would be in line with the established goal for 2020.
4.4.3. Local Actions’ Contribution
The expected contribution of each specific measure (or group of measures) towards the goals established by the local authority is not specified in the Environmental Program of Malmö. Thus, as referred previously, it is not possible to compare the projected outcomes with the estimated effects of local actions. Being so, a comparative analysis between the estimated effects associated with local actions and the overall goals established by the municipality is performed instead. This analysis is also useful to understand the level of contribution of local actions towards the overall targets.
On one hand, it was estimated that the effects associated with local actions between 1990 and 2015 corresponded to a reduction in GHG emissions of over 470 thousand tons of CO2 eq., which is equivalent to 41% of the base year’s level of emissions. On the other hand, the municipality established the goal of reducing GHG emissions by 40% compared to 1990 level, by 2020. Thus, it could be said that the contribution of local actions already exceeds the reduction targets established by the local authority, even if the overall reduction of GHG emissions is still behind.
Indeed, as visible in
Figure 6, in the case of Malmö, the sum of the effects associated with all the external factors (including natural evolution of the local energy system and higher-level policies) corresponds to an increase in the municipality’s GHG emissions. This may be justified by the high growth in terms of local demography and economy, which neutralizes the positive effects of national and international policy actions. Moreover, the overall effect of external factors partially counteracts the contribution of local actions towards climate change mitigation. Thus, the mere assessment of the overall change in GHG emissions would lead to an underestimation of the contribution of local actions towards climate change mitigation.
This analysis illustrates the importance of disaggregating the observed changes at the local level in order to properly understand and assess the effect of local actions and the respective contribution on the overall reduction of local GHG emissions. In this specific case, the assessment of the overall reduction of GHG emissions could be misleading, as it would hint that the actions promoted by the municipality of Malmö did not contribute towards climate change mitigation, while the actual contribution of local actions, even if behind what was planned and proposed in the SEAP, was still significant.
4.5. Main Findings
From the comparison between the estimated results and the goals defined by local authority, it was observed that the level of local GHG emissions is still far from what is targeted by the municipality. Nonetheless, the values per capita seem to be more satisfactory. The total level of emissions is not justified by ineffectiveness on action but rather by the actual population growth, which is higher than what was considered when developing the SEAP Malmö.
Moreover, when disaggregating the observed changes into the effects of local actions and the ones of external factors of change, the analysis shows that the local contribution to the reduction of GHG emissions nearly reached the proposed reduction goal. The gap between the accomplished and desired GHG emissions reduction is due to the effects associated with external factors, which counteracted the effect associated with local climate change mitigation actions.
Thus, this comparative analysis showed the importance of properly quantifying the actual effects of local actions. Indeed, the difference between the two comparative analyses revealed how the mere assessment of observed total changes can be misleading.
5. Conclusions
This work proposes a methodology for the assessment of the local path towards climate change mitigation, and of the contribution of local actions towards this path, based on the disaggregation model presented by Azevedo [
14]. The model provides a decomposition of the observed total changes of a local energy system into the individual effects of the several factors of change, including external factors and local actions for climate change mitigation. This may be an important asset for the evaluation of local energy systems and their evolution over time. The deeper understanding of what is behind the observed total change in local GHG emissions can help local authorities, as well as higher-level policy makers, to assess current policies and develop future ones.
The model was applied to the municipality of Malmö, for the timeframe 1990–2015.
On the overall change, an almost negligible change in final energy use and a reduction of 22% in the level of GHG emissions was observed. Given the large increase in the number of local inhabitants in the studied timeframe, the changes in energy use and associated GHG emissions per capita were considerably different, with a reduction of 28% and 41% respectively.
When disaggregating the observed change into the effects of the different factors of change, it was estimated that demographic evolution and changes in the local economy were the main drivers for increase of the GHG emissions. On the opposite trend, local climate change mitigation actions were the main driver for decrease in GHG emissions between 1990 and 2015 (41%). Initiatives promoted at the national level, as new energy taxes and transport regulations, also contributed to the reduction in the local GHG emissions, by 12% and 11% respectively.
The fact that the estimated impact of local actions on GHG emissions was a decrease of 41%, while the total observed decrease was only 22%, clearly shows the importance of disaggregating the contribution of local actions from the effects associated with external factors. The assessment of the overall change alone can be misleading, not being representative of the real contribution of local actions.
Moreover, the disaggregation by sector and energy carrier estimated by the model can also be used to assess the contribution of specific local actions towards the reduction of local GHG emissions. The comparison between projected outcomes and the estimated effects may be seen as a tool to assess whether the effects of already implemented actions are in line with the respective projections, identifying which mechanisms are effective and which need to be improved or even replaced.
Overall, this paper, with the implementation of the model to the municipality of Malmö, shows the importance of going beyond the quantification of the changes in the local level of GHG emissions over time. The assessment of the contribution of local policy actions towards climate change mitigation could be significantly improved with the disaggregation of the overall change in GHG emissions into the individual effects of the different factors of change.
Finally, considering that the proposed methodology only provides an estimate of the overall effect of local actions, further research on the individual contribution of specific policy instruments is still needed. Indeed, it would be beneficial to estimate the actual contribution of the different policy mechanisms implemented at a more disaggregated level to better assess their effectiveness and efficiency. In order to do so, it would be interesting to develop a bottom-up methodology that would use the overall effects of local actions as well as detailed information on the actions’ implementation to estimate these individual effects and to assess their contribution in terms of effectiveness and efficiency. Another area where more work may be useful is the assessment of the precision of input data, and of the typical impacts of data lack of precision upon the model results.
Author Contributions
Conceptualization, I.A. and V.L.; formal analysis, I.A. and V.L.; funding acquisition, I.A.; investigation, I.A.; methodology, I.A.; supervision, V.L.; validation, I.A. and V.L.; visualization, I.A.; writing—original draft, I.A.; writing—review & editing, I.A. and V.L. All authors have read and agreed to the published version of the manuscript.
Funding
The research was funded by “Fundação para a Ciência e Tecnologia” (FCT—Portugal), through the PhD Scholarship PD/BD/105862/2014, granted in the frame of the MIT Portugal Program.
Data Availability Statement
The data presented in this study are available in Azevedo (2019).
Conflicts of Interest
The authors declare no conflict of interest.
Appendix A. Local Actions of the Municipality of Malmö
Figure A1.
Timeline of policy instruments implemented by the municipality of Malmö per technical measure, between 1990 and 2015.
Figure A1.
Timeline of policy instruments implemented by the municipality of Malmö per technical measure, between 1990 and 2015.
References
- Meeus, L. Smart Cities initiative: How to foster a quick transition towards local sustainable energy systems. In THINK Project, EU 7th Framework Programme; European University Institute: Florence, Italy, 2011. [Google Scholar]
- EC, European Commission. Clean Energy for all Europeans; Publications Office of the EU: Luxembourg, 2019. [Google Scholar]
- Kern, K.; Alber, G. Governing climate change in cities: Modes of urban climate governance in multi-level systems, in Competitive cities and climate change. In Proceedings of the 2008 OECD Conference Proceedings, Milan, Italy, 9–10 October 2008; pp. 171–196. [Google Scholar]
- CoM, Covenant of Mayors, Covenant of Mayors—Official Website. 2020. Available online: https://www.eumayors.eu/en/ (accessed on 14 September 2020).
- Domorenok, E. Voluntary instruments for ambitious objectives? The experience of the EU Covenant of Mayors. Environ. Politics 2019, 28, 293–314. [Google Scholar]
- Bertoldi, P.; Mosconi, R. Do energy efficiency policies save energy? A new approach based on energy policy indicators (in the EU Member States). Energy Policy 2020, 139, 111320. [Google Scholar]
- Palermo, V.; Bertoldi, M.P.; Apostolou, A.K.; Rivas, S. Assessment of climate change mitigation policies in 315 cities in the Covenant of Mayors initiative. Sustain. Cities Soc. 2020, 60, 102258. [Google Scholar] [CrossRef]
- AdEPorto and CMPorto. Plano de Acção para a Energia Sustentável da Cidade do Porto; AdEPorto: Porto, Portugal, 2010. [Google Scholar]
- Millard-Ball, A. Do city climate plans reduce emissions? J. Urban Econom. 2012, 71, 289–311. [Google Scholar] [CrossRef]
- DG Energy. European Commission, Energy Solutions for Smart Cities and Communities—Lessons Learnt from the 58 Pilot Cities of the CONCERTO Initiative; Steinbeis-Europa-Zentrum der Steinbeis Innovation gGmbH, Ed.; European Commission: Brussels, Belgium, 2014. [Google Scholar]
- Hsu, A.; Tan, J.; Ng, Y.M.; Toh, W.; Vanda, R.; Goyal, N. Performance determinants show European cities are delivering on climate mitication. Nat. Clim. Chang. 2020, 10, 1015–1022. [Google Scholar] [CrossRef]
- de Melo, C.A.; Jannuzzi, G.d.M.; Ferreira Tripodi, A. Evaluating public policy mechanisms for climate change mitigation in Brazilian buildings sector. Energy Policy 2013, 61, 1200–1211. [Google Scholar] [CrossRef]
- Lin, J. Evaluating the effectiveness of urban energy conservation and GHG mitigation measures: The case of Xiamen city. China. Energy Policy 2010, 38, 5123–5132. [Google Scholar] [CrossRef]
- Azevedo, I. A methodology for ex-post evaluation of local climate change mitigation actions under a multi-level governance framework. In Faculty of Engineering; Universidade do Porto: Porto, Portugal, 2019. [Google Scholar]
- Ruben, A.; Pitkä-Kangas, L. Environmental Programme for the City of Malmö 2009-2020. Malmö Stad Miljoprogram; Malmö Stad: Malmö, Sweden, 2012. [Google Scholar]
- SCB, Statistiska Centralbyrån. Energidata (MWh) Efter Region, Kategori, Energityp och år (1990). 2018. Available online: http://www.statistikdatabasen.scb.se/pxweb/sv/ssd/START__EN__EN0203/EnergiKommKat/?rxid=a88e004e-ac34-496c-a2a6-43498221fd7a (accessed on 8 February 2018).
- SCB, Statistiska centralbyrån. Slutanvändning (MWh) Efter Region, Förbrukarkategori, Bränsletyp och år (2015). 2018. Available online: http://www.statistikdatabasen.scb.se/pxweb/sv/ssd/START__EN__EN0203/SlutAnvSektor/?rxid=a88e004e-ac34-496c-a2a6-43498221fd7a (accessed on 8 February 2018).
- AdEPorto, Agência de Energia do Porto. Matriz de energia da Área Metropolitana do Porto—Norte do Douro; AdEPorto: Porto, Portugal, 2014. [Google Scholar]
- Unander, F. Residential energy use: An international perspective on long-term trends in Denmark, Norway and Sweden. Energy Policy 2004, 32, 1395–1404. [Google Scholar] [CrossRef]
- SEA, Swedish Energy Agency. Energy in Sweden; SEA: Stockholm, Sweden, 2015. [Google Scholar]
- SCB, Statistiska centralbyrån. Elproduktion och bränsleanvändning (MWh), Efter Län Och Kommun, Produktionssätt Samt Bränsletyp. 2018. Available online: http://www.statistikdatabasen.scb.se/pxweb/sv/ssd/START__EN__EN0203/ProdbrEl/?rxid=092d056e-8b3a-4223-aa6e-7a0a76625bd6 (accessed on 30 January 2018).
- IPCC. 2006 IPCC Guidelines for National Greenhouse Gas Inventories; IPCC: Geneva, Switzerland, 2006. [Google Scholar]
- Eurostat. Cooling and Heating Degree days by NUTS 2 (Annual Data); Eurostat Database: Luxembourg, 2018. [Google Scholar]
- SCB, Statistiska Centralbyrån. Population by Region, Marital Status, age and Sex. Year 1968–2017. 2018. Available online: http://www.statistikdatabasen.scb.se/pxweb/en/ssd/START__BE__BE0101__BE0101A/BefolkningNy/?rxid=a88e004e-ac34-496c-a2a6-43498221fd7a (accessed on 23 January 2018).
- SCB, Statistiska centralbyrån. Inactive Population as a Percentage of the Total Population. 2018. Available online: http://www.statistikdatabasen.scb.se/ (accessed on 15 March 2018).
- Eurostat. Mean Consumption Expenditure per Adult Equivalent; Eurostat Database: Luxembourg, 2017. [Google Scholar]
- SCB, Statistiska Centralbyrån. Number of Dwellings by Region and Type of Building (Including Special Housing). 2018. Available online: http://www.statistikdatabasen.scb.se/pxweb/en/ssd/START__BO__BO0104/BO0104T01/?rxid=a88e004e-ac34-496c-a2a6-43498221fd7a (accessed on 24 January 2018).
- Eurostat. Average Household Size—EU-SILC Survey; Eurostat: Luxembourg, 2017. [Google Scholar]
- Trafikanalys. RVU Sverige—Den Nationella Resvaneundersökningen. 2018. Available online: https://www.trafa.se/kommunikationsvanor/RVU-Sverige/ (accessed on 1 February 2018).
- Trafikanalys, RVU Sverige—den Nationella Resvaneundersökningen 2014–2015; Trafikanalys & Sveriges Officiella Statistic: Stockholm, Sweden, 2016.
- SCB, Statistiska Centralbyrån. Passenger Cars in Use by Region and Type of Ownership. Year 2002–2017. Available online: http://www.statistikdatabasen.scb.se/pxweb/en/ssd/START__TK__TK1001__TK1001A/PersBilarA/?rxid=a88e004e-ac34-496c-a2a6-43498221fd7a (accessed on 24 January 2018).
- Hanly, M.; Dargay, J.; Goodwin, P. Review of Income and Price Elasticities in the Demand for Road Traffic; University College London: London, UK, 2002. [Google Scholar]
- SCB, Statistiska Centralbyrån. Bruttoregionprodukt (BRP, ENS2010), Löpande Priser, Mnkr Efter Region och år. 2018. Available online: http://www.statistikdatabasen.scb.se/pxweb/sv/ssd/START__NR__NR0105__NR0105A/NR0105ENS2010T01A/?rxid=28ea630e-d9ef-490a-b634-f13b39de2187 (accessed on 30 January 2018).
- SCB, Statistiska Centralbyrån. Disposable Income of Households (ESA2010) by Region (NUTS1-3) and Transaction Item. 2018. Available online: http://www.statistikdatabasen.scb.se/pxweb/en/ssd/START__NR__NR0105__NR0105A/NR0105ENS2010T02A/?rxid=9d75735b-e013-4215-8337-8cb45f99ce42 (accessed on 14 February 2018).
- Krishnamurthy, C.K.B.; Kriström, B. A cross-country analysis of residential electricity demand in 11 OECD-countries. Resour. Energy Econom. 2015, 39, 68–88. [Google Scholar] [CrossRef]
- Eurostat. Simplified Energy Balances—Anual Data EU27; Eurostat: Luxembourg, 2017. [Google Scholar]
- SCB, Statistiska Centralbyrån. Fjärrvärmeproduktion och Bränsleanvändning (MWh), efter län och Kommun, Produktionssätt Samt Bränsletyp. 2018. Available online: http://www.statistikdatabasen.scb.se/pxweb/sv/ssd/START__EN__EN0203/ProdbrFj/?rxid=8145d8f1-79df-479a-b96f-82e03dcd62a5 (accessed on 8 February 2018).
- Hiller, C. Sustainable energy use in houses: Will the energy use increase with time? In Study of Literature and Computer Estimations; Department of Building Physics, Lund Institute of Technology: Lund, Sweden, 2003. [Google Scholar]
- SCB, Statistiska Centralbyrån. Number of Dwellings by Region, Type of Building and Period of Construction. 2018. Available online: http://www.statistikdatabasen.scb.se/pxweb/en/ssd/START__BO__BO0104/BO0104T02/?rxid=352ec506-e10c-488c-8a79-cf1ae3e9176a (accessed on 24 January 2018).
- EU, European Parliament and Council of the European Union. Directive 2003/30/EC of the European Parliament and of the Council of 8 May 2003 on the Promotion of the Use of Biofuels or Other Renewable Fuels for Transport; Official Journal of the European Union: Brussels, Belgium, 2003. [Google Scholar]
- MSD. The Swedish Report on Demonstrable Progress under the Kyoto Protocol; MSD: Stockholm, Sweden, 2015. [Google Scholar]
- EC, European Commission. Commission Staff Working Document—Full Impact Assessment Accompanying Document to the Commission Regulation Implementing Directive 2005/32/EC of the European Parliament and of the Council with Regard to Ecodesign Requirements for Fluorescent Lamps without Integrated Ballast, for High Intensity Discharge Lamps, and for Ballasts and Luminaires Able to Operate Such Lamps, and Repealing Directive 2000/55/EC of the European Parliament and of the Council; European Commission: Brussels, Belgium, 2009. [Google Scholar]
- EC, European Commission. Commission staff Working Document—Full Impact Assessment Accompanying Document to the Commission Regulation Implementing Directive 2005/32/EC with Regard to Ecodesign Requirements for Televisions; European Commission: Brussels, Belgium, 2009. [Google Scholar]
- European Commission. E., Commission Staff Working Document—Full impact Assessment Accompanying Document to the Commission Regulation Implementing the Directive 2005/32/EC of the European Parliament and of the Council with Regard to Ecodesign Requirements for Non-Directional Household Lamps; European Commission: Brussels, Belgium, 2009. [Google Scholar]
- EC, European Commission. Commission Staff Working Document—Full Impact Assessment Accompanying Document to the Proposal for a Commission Regulation Implementing Directive 2005/32/EC with Regard to Ecodesign Requirements for Household Refrigerating Appliances; European Commission: Brussels, Belgium, 2009. [Google Scholar]
- EC, European Commission. Commission Staff Working Document—Impact Assessment Accompanying Document to the Draft Commission Regulation Implementing the Directive 2009/125/EC of the European Parliament and of the Council with Regard to Ecodesign Requirements for Household Dishwashers; European Commission: Brussels, Belgium, 2010. [Google Scholar]
- EC, European Commission. Commission Staff Working Document—Impact Assessment Accompanying Document to the Draft Commission Regulation Implementing the Directive 2009/125/EC of the European Parliament and of the Council with Regard to Ecodesign Requirements for Household Washing Machines; European Commission: Brussels, Belgium, 2010. [Google Scholar]
- EC, European Commission. Commission Staff Working Document—Full Impact Assessment Accompanying the Document Proposal for a Commission Regulation Implementing the Directive 2009/125/EC of the European Parliament and of the Council with Regard to Ecodesign Requirements for Air Conditioners and Comfort fans; European Commission: Brussels, Belgium, 2012. [Google Scholar]
- EC, European Commission. Commission Staff Working Document—Impact Assessment Accompanying the Document Commission Regulation Implementing Directive 2009/125/EC of the European Parliament and of the Council with regard to ecodesign requirements for Directional Lamps, Light Emitting Diode Lamps and Related Equipment; European Commission: Brussels, Belgium, 2012. [Google Scholar]
- EC, European Commission. Commission staff working document—Impact Assessment Accompanying the Document Commission Regulation Implementing the Directive 2009/125/EC of the European Parliament and of the Council with Regard to Ecodesign Requirements for Household Tumble Driers; European Commission: Brussels, Belgium, 2012. [Google Scholar]
- EC, European Commission. Commission Staff Working Document—Full Impact Assessment Accompanying the Document Proposal for a Commission Regulation Implementing the Directive 2009/125/EC of the European Parliament and of the Council with Regard to Ecodesign Requirements for Computers, Servers and Displays; European Commission: Brussels, Belgium, 2013. [Google Scholar]
- EC, European Commission. Commission Regulation (EC) No 244/2009 of 18 March 2009 Implementing Directive 2005/32/EC of the European Parliament and of the Council with Regard to Ecodesign Requirements for Non-Directional Household Lamps (Text with EEA Relevance); Official Journal of the European Union: Brussels, Belgium, 2009. [Google Scholar]
- EC, European Commission. Commission Regulation (EC) No 245/2009 of 18 March 2009 Implementing Directive 2005/32/EC of the European Parliament and of the Council with Regard to Ecodesign Requirements for Fluorescent Lamps without Integrated Ballast, for High Intensity Discharge Lamps, and for Ballasts and Luminaires Able to Operate Such Lamps, and Repealing Directive 2000/55/EC of the European Parliament and of the Council (Text with EEA Relevance); Official Journal of the European Union: Brussels, Belgium, 2009. [Google Scholar]
- EC, European Commission. Commission Regulation (EC) No 642/2009 of 22 July 2009 Implementing Directive 2005/32/EC of the European Parliament and of the Council with Regard to Ecodesign Requirements for Televisions (Text with EEA Relevance); Official Journal of the European Union: Brussels, Belgium, 2009. [Google Scholar]
- EC, European Commission. Commission Regulation (EC) No 643/2009 of 22 July 2009 Implementing Directive 2005/32/EC of the European Parliament and of the Council with Regard to Ecodesign Requirements for Household Refrigerating Appliances (Text with EEA Relevance); Official Journal of the European Union: Brussels, Belgium, 2009. [Google Scholar]
- EC, European Commission. E., Commission Regulation (EU) No 1015/2010 of 10 November 2010 Implementing Directive 2009/125/EC of the European Parliament and of the Council with Regard to Ecodesign Requirements for Household Washing Machines (Text with EEA Relevance); Official Journal of the European Union: Brussels, Belgium, 2010. [Google Scholar]
- EC, European Commission. Commission Regulation (EU) No 1016/2010 of 10 November 2010 Implementing Directive 2009/125/EC of the European Parliament and of the Council with Regard to Ecodesign Requirements for Household Dishwashers (Text with EEA Relevance); Official Journal of the European Union: Brussels, Belgium, 2010. [Google Scholar]
- EC, European Commission. Commission Regulation (EU) No 1194/2012 of 12 December 2012 Implementing Directive 2009/125/EC of the European Parliament and of the Council with Regard to Ecodesign Requirements for Directional Lamps, Light Emitting Diode Lamps and Related Equipment (Text with EEA Relevance); Official Journal of the European Union: Brussels, Belgium, 2012. [Google Scholar]
- EC, European Commission. Commission Regulation (EU) No 206/2012 of 6 March 2012 Implementing Directive 2009/125/EC of the European Parliament and of the Council with Regard to Ecodesign Requirements for Air Conditioners and Comfort Fans (Text with EEA Relevance); Official Journal of the European Union: Brussels, Belgium, 2012. [Google Scholar]
- EC, European Commission. Commission Regulation (EU) No 932/2012 of 3 October 2012 Implementing Directive 2009/125/EC of the European Parliament and of the Council with Regard to Ecodesign Requirements for Household Tumble Driers (Text with EEA Relevance); Official Journal of the European Union: Brussels, Belgium, 2012. [Google Scholar]
- EC, European Commission. Commission Regulation (EU) No 617/2013 of 26 June 2013 Implementing Directive 2009/125/EC of the European Parliament and of the Council with Regard to Ecodesign Requirements for Computers and Computer Servers (Text with EEA Relevance); Official Journal of the European Union: Brussels, Belgium, 2013. [Google Scholar]
- Ministry of the Environment Sweden. Sweden’s Sixth National Communication on Climate Change—Under the United Nations Framework Convention on Climate Change; ME: Stockholm, Sweden, 2014. [Google Scholar]
- Stenqvist, C.; Nilsson, L.J. Energy efficiency in energy-intensive industries—An evaluation of the Swedish voluntary agreement PFE. Energy Eff. 2012, 5, 225–241. [Google Scholar] [CrossRef]
- Malmö Stad, Miljöbokslut för Malmö Stad 1997; Malmö Stad: Malmö, Sweden, 1998.
- Malmö Stad, Miljöbokslut för Malmö Stad 1998; Malmö Stad: Malmö, Sweden, 1999.
- Malmö Stad, Miljöbokslut för Malmö Stad 1999; Malmö Stad: Malmö, Sweden, 2000.
- Malmö Stad, Miljöbokslut för Malmö Stad 2000; Malmö Stad: Malmö, Sweden, 2001.
- Malmö Stad, Miljöbokslut för Malmö Stad 2001; Malmö Stad: Malmö, Sweden, 2002.
- Malmö Stad, Miljöredovisning för Malmö Stad 2002; Malmö Stad: Malmö, Sweden, 2003.
- Malmö Stad, Miljöredovisning för Malmö Stad 2003; Malmö Stad: Malmö, Sweden, 2004.
- Malmö Stad, Miljöredovisning för Malmö Stad 2004; Malmö Stad: Malmö, Sweden, 2005.
- Malmö Stad, Miljöredovisning för Malmö Stad 2005; Malmö Stad: Malmö, Sweden, 2006.
- Malmö Stad, Miljöredovisning för Malmö Stad 2006; Malmö Stad: Malmö, Sweden, 2007.
- Malmö Stad, Miljöredovisning för Malmö Stad 2007; Malmö Stad: Malmö, Sweden, 2008.
- Malmö Stad, Miljöredovisning för Malmö Stad 2008; Malmö Stad: Malmö, Sweden, 2009.
- Malmö Stad, Malmö Stads Miljöredovisning 2012; Malmö Stad: Malmö, Sweden, 2013.
- Malmö Stad, Malmö Stads Miljöredovisning 2013; Malmö Stad: Malmö, Sweden, 2014.
- Malmö Stad, Miljöredovisning 2014; Malmö Stad: Malmö, Sweden, 2015.
- Malmö Stad, Miljöredovisning 2015; Malmö Stad: Malmö, Sweden, 2016.
- Malmö Stad, Miljöredovisning 2016—Uppföljning av Miljöprogram för Malmö Stad 2009–2020; Malmö Stad: Malmö, Sweden, 2017.
Figure 1.
Schematic representation of the decomposition analysis (based on [
14]).
Figure 1.
Schematic representation of the decomposition analysis (based on [
14]).
Figure 2.
Change in annual final energy per sector (GWh) for the municipality of Malmö, between 1990 and 2015.
Figure 2.
Change in annual final energy per sector (GWh) for the municipality of Malmö, between 1990 and 2015.
Figure 3.
Change in annual GHG emissions per sector (ktonCO2 eq.) for the municipality of Malmö, between 1990 and 2015.
Figure 3.
Change in annual GHG emissions per sector (ktonCO2 eq.) for the municipality of Malmö, between 1990 and 2015.
Figure 4.
Disaggregation of the observed changes in local GHG emissions, between 1990 and 2015, per factor of change for the municipality of Malmö, as a percentage of the base year emissions level. (A—Climate; B—Population; C—Activeness; D—Urbanization; E—Household conditions; F—Transportation habits; G—Local economy; H—Private consumption; I—Energy Prices; Ja—Autonomous savings private consumers; Jb—Energy intensity economic sectors; K—Energy supply sector; L—Energy taxes; M—Building regulations; N—Transport regulations; O—Energy efficiency requirements; P—Other policies; Local Actions).
Figure 5.
Projected reduction of local GHG emissions by 2020 as presented in the SEAP Malmö and the observed reduction in 2015 (compared to 1990 level), and two possible paths to achieve the desired reduction by 2020.
Figure 5.
Projected reduction of local GHG emissions by 2020 as presented in the SEAP Malmö and the observed reduction in 2015 (compared to 1990 level), and two possible paths to achieve the desired reduction by 2020.
Figure 6.
Change in GHG emissions for the municipality of Malmö (ktCO2 eq./year) due to local actions and to external factors and the overall change as estimated by the disaggregation model (1990–2015) and as projected by the SEAP (1990–2020).
Figure 6.
Change in GHG emissions for the municipality of Malmö (ktCO2 eq./year) due to local actions and to external factors and the overall change as estimated by the disaggregation model (1990–2015) and as projected by the SEAP (1990–2020).
Table 1.
List of factors of change considered by the disaggregation model for the decomposition of the observed changes in local greenhouse gas (GHG) emissions.
Table 1.
List of factors of change considered by the disaggregation model for the decomposition of the observed changes in local greenhouse gas (GHG) emissions.
| | Explanatory Factor |
|---|
| A | Climate |
| B | Overall population |
| C | Population activeness |
| D | Urbanization |
| E | Household conditions |
| F | Transportation habits |
| G | Local economy (scale and structure) |
| H | Private consumption |
| I | Energy prices |
| Ja | Autonomous savings private consumers |
| Jb | Energy intensity of economic sectors |
| K | Energy supply sector |
| L | Energy taxes |
| M | Building regulations |
| N | Transports regulation (Biofuel incorporation) |
| O | Energy efficiency requirements |
| P | Other policies |
| RY | Local Actions |
Table 2.
Main socioeconomic indicators of the municipality of Malmö for 1990 and 2015 and their variation over time.
Table 2.
Main socioeconomic indicators of the municipality of Malmö for 1990 and 2015 and their variation over time.
| | Base Year 1990 | Reporting Year 2015 | Variation
1990–2015 |
|---|
| Population | 233,887 | | 322,574 | | +38% |
| 111,089 | (47%) | 158,955 | (49%) | |
| 122,798 | (53%) | 163,619 | (51%) | |
| 34,849 | (15%) | 57,771 | (18%) | |
| 149,069 | (64%) | 215,127 | (67%) | |
| 49,942 | (21%) | 49,676 | (15%) | |
| Population density (inhab/km2) | 1491 | | 2056 | | +38% |
| Purchase Power per capita * | 123.9 | | 184.4 | | +49% |
| GVA ** (‘000 SEK) | 57,612 | | 149,907 | | +160% |
Table 3.
Input data to build the energy and emissions matrices for the municipality of Malmö for 1990 and 2015, with the identification of main sources and data geographical level.
Table 3.
Input data to build the energy and emissions matrices for the municipality of Malmö for 1990 and 2015, with the identification of main sources and data geographical level.
| Input Data | Main Source | Geographical Level |
|---|
| Final energy use per sector | SCB (statistics) [16] | Municipality |
| Distribution of sectorial energy use per end-use | Unander et al. (2004) [19] | n.a. |
| SEA (Energy in SE 2015) [20] | Country |
| AdEPorto (Matrix 2009) [18] | Country |
| Average end-use efficiency | AdEPorto (Matrix 2009) [18] | n.a. |
| Efficiency of energy supply sector | SCB (energy balances) [21] SCB (hydro and wind corrections) | Country/Municipality Country |
| Carbon content of electricity, heat and oil products | SCB (energy balances) [21] SCB (hydro and wind corrections) | Country/Municipality Country |
| Carbon content of other energy carriers | IPCC [22] | n.a. |
Table 4.
Input data for the decomposition analysis of the municipality of Malmö with the identification of main sources and data geographical level.
Table 4.
Input data for the decomposition analysis of the municipality of Malmö with the identification of main sources and data geographical level.
| Factor of Change | Indicators | Sources | Data Geographical Level |
|---|
| Climate | Heating Degree-Days | Eurostat [23] | Region |
| | Cooling Degree-Days | Eurostat [23] | Region |
| Population | Local inhabitants | SCB [24] | Municipality |
| Population activeness | Share of active population | SCB [25] | Municipality |
| Ratio of energy use between households with active and inactive inhabitants per sector | Eurostat [26] | Country |
| Urbanization | Share of households in rural area | - | - |
| Ratio between energy usage of rural and urban households per sector | Eurostat [26] | Country |
| Household conditions | Number of persons per household | SCB [27] | Municipality |
| Appliances ownership per capita | Unander et al. (2004) [19] | Country |
| Average household size | Eurostat [28] | Country |
| Transportation habits | Average commuting time (min) | National Travel Survey [29] | Type of city |
| Share of travels and duration per motive | National Travel Survey [30] | Country |
| Car ownership ratio | SCB [31] | Country |
| Elasticity of leisure travel with car ownership | ESRC * [32] | Multi-Country |
| Local economy (scale and structure) | GVA per sector | SCB [33] | Region |
| Private consumption | Private purchase power per capita | SCB [34] | Municipality |
| | Elasticity of residential energy use with private income | Krishnamurthy and
Kriström (2015) [35] | Country |
| | Elasticity of passenger transportation energy use with private income | ESRC [32] | Multi-Country |
| | Elasticity of freight transportation energy use with private income | ESRC [32] | Multi-Country |
| Energy prices | Average annual price per energy vector | SEA [20] | Country |
| | Elasticity of residential energy use with energy prices | Krishnamurthy and
Kriström (2015) [35] | Country |
| | Elasticity of passenger transportation energy use with energy prices | ESRC [32] | Multi-Country |
| Autonomous savings private consumers | Energy intensity of residential sector for EU countries | Eurostat [36] | EU27 |
| Energy intensity of passenger transportation for EU countries | Eurostat [36] | EU27 |
| Energy intensity of economic sectors | Energy intensity of services, industry and agriculture and fisheries sectors for EU countries | Eurostat [36] | EU27 |
| Energy supply sector | Annual energy balance | SCB [21,37] | Country/Municipality |
| | Hydro production normalization index | SCB | Country |
| | Eolic production normalization index | SCB | Country |
| Energy taxes | Energy-policy related taxes per vector | SEA [20] | Country |
| | Elasticity of residential energy use with energy prices | Krishnamurthy and
Kriström (2015) [35] | Country |
| | Elasticity of passenger transportation energy use with energy prices | ESRC [32] | Multi-Country |
| Building regulations | Average Nic of residential dwellings per building period—before regulation | Hiller (2003) [38]
IEA | Country |
| Average Nic of residential dwellings per building period—after regulation | IEA ** (Swedish Building Codes) | Climatic Zone |
| Average IEE *** of services buildings per building period—before regulation | Hiller (2003) [38]
IEA | Country |
| Average IEE of services buildings per building period—before regulation | IEA (Swedish Building Codes) | Climatic Zone |
| Average dwellings area per building type and building period | SCB [39] | Municipality |
| Number of dwellings built and rebuilt per building period | SCB [39] | Municipality |
| Transports regulations | Obligation to introduce biofuels—shares per year | Legislation [40] | Country |
| Substitution of traditional vehicles for other running with biofuels | Progress report under Kyoto [41] | Country |
| Energy efficiency requirements | Average annual consumption of existing stock per appliance | EU (impact assessment reports) [42,43,44,45,46,47,48,49,50,51] | EU level |
| Minimum requirements of annual consumption per appliance | EU (impact assessment reports) [52,53,54,55,56,57,58,59,60,61] | EU level |
| Other policies | | Progress reports under Kyoto [41,62] | Country |
| | | Stenqvist and Nilsson (2012) [63] | Country |
| | | SEA (Energy in Sweden 2015) [20] | Country |
Table 5.
Energy indicators for the base year (1990) and the reporting year (2015) for the municipality of Malmö.
Table 5.
Energy indicators for the base year (1990) and the reporting year (2015) for the municipality of Malmö.
| Main Indicators of the Local Energy System | 1990 | 2015 | Variation |
|---|
| Total final energy use (GWh) | 6992 | 6962 | −0.4% |
| Final energy use per capita (MWh/cap) | 29.9 | 21.6 | −28% |
| Total GHG emissions (tCO2 eq.) | 1,147,659 | 929,051 | −19% |
| GHG emissions per capita (tCO2 eq./cap) | 4.9 | 2.9 | −41% |
| Final energy for residential buildings (GWh) | 2280 | 1988 | −13% |
| Final energy for services buildings (GWh) | 1606 | 2084 | +30% |
| Final energy for transports (GWh) | 1995 | 2030 | +1.8% |
| Final energy for industry (GWh) | 1074 | 839 | −22% |
| Final energy for agriculture and fisheries (GWh) | 36 | 20 | −45% |
| Sector responsible for the highest share of energy use | Residential Buildings | Services Buildings | |
| | 33% | 30% | |
| Sector responsible for the highest share of GHG emissions | Residential Buildings | Passenger Transport. | |
| | 34% | 39% | |
| Most used energy carrier | Oil Prod. | Electricity | |
| | 35% | 35% | |
Table 6.
Technical measures proposed in the Sustainable Energy Action Plan (SEAP) Malmö.
Table 6.
Technical measures proposed in the Sustainable Energy Action Plan (SEAP) Malmö.
|
Technical Measures (as Proposed by the Local Authority)
|
|---|
| Decarbonize local electricity production | |
| Decarbonize local heat production |
| Buildings |
| Reduce energy needs |
| Use of energy from renewable energy sources for heat |
| Microgeneration from renewable energy sources |
| Municipal buildings |
| Reduce energy needs |
| Use of energy from renewable energy sources |
| Reduce electricity use |
| Microgeneration from renewable energy sources |
| Transports |
| Reduce transportation needs |
| Use of biofuels in public transports |
| Shift to soft modes |
| Shift to public transports |
| Use of biofuels in private cars |
| Optimization of transportation flow |
| Industry |
| Decrease energy intensity |
| Increase energy efficiency |
Table 7.
Comparison of the overall GHG emissions reduction observed (1990–2015) and the goals established by the municipality of Malmö in the SEAP Malmö (1990–2020).
Table 7.
Comparison of the overall GHG emissions reduction observed (1990–2015) and the goals established by the municipality of Malmö in the SEAP Malmö (1990–2020).
| | SEAP Malmö
By 2020 | Observed Changes
By 2015 |
|---|
| Local energy system | | |
| Reduction of final energy per capita (2001–2005 level) | 20% | 17% |
| Share of energy from renewable sources | 50% | 24% |
| Reduction of GHG emissions (1990 level) | 40% | 19% |
| Energy use in municipality owned infrastructure | | |
| Reduction of final energy (2001–2005 level) | 30% | −13% |
| Share of energy from renewable sources | 100% | 61% |
| Publisher’s Note: MDPI stays neutral with regard to jurisdictional claims in published maps and institutional affiliations. |
© 2021 by the authors. Licensee MDPI, Basel, Switzerland. This article is an open access article distributed under the terms and conditions of the Creative Commons Attribution (CC BY) license (http://creativecommons.org/licenses/by/4.0/).


