Abstract
Transportation of renewable wood is increasing, being a necessary operation in logistics of the environmentally sustainable forest industry. However, increasing the transportation capacity is a source of greenhouse gas emissions. In addition to trucks’ emissions, maintaining road infrastructure affects the environment by the emissions of increasing utilization of HCT (high-capacity transportation), that is, larger and heavier vehicles, affecting the backhauling transportation and the efficiency of road-network combinations. Environmental efficiency is an important metric which is used for comparisons among technological alternatives employed in the utilization of energy derived from both fossil and renewable resources. Based on the enterprise resource planning (ERP) data (2018–2020), CO2 emissions of increasing HCT were calculated for a forest industry corporation. The reduction in average fuel consumption (ml t × km−1), between 52% and 70% in backhauling transportation, was 18.88%. In this respect, CO2 emissions were reduced by 4.52 g t × km−1, achieving 19.48 g t × km−1, based on the data from the 76 t vehicle combinations. Furthermore, the metric of total environmental efficiency shows the potential of the alternative road-network combinations for the HCT. The environmental efficiency of the 92 t HCT increased by 11% via an intensive road-network combination, compared to the most efficient 76 t HCT alternative and the efficiency increased by 21%, compared to the most efficient line-hauling alternative. Thus, the results are in favor of the backhauling transportation by the means of 92 t vehicles for HCT development. Furthermore, a sensitivity analysis demonstrates that technological improvement of the forest roads is essential for HCT in an increasing harvesting of renewable wood energy. Also, to achieve the maximum environmental efficiency of the HCT during upgrading of the forest roads, efficiency measurements of the HCT should be implemented in the transportation planning systems.
1. Introduction
Provision of commodities and services from forests to the customers is commonly sustained by the use of energy from either fossil or renewable sources. Typical to the industrial supply chains is that there are several situations in which the energy is received in one form and then converted to another form or even to a non-energy form. Although the wood supply chains are sustainable in many countries, carbon dioxide emissions by the use of fossil fuels cause environmental problems in the EU’s forest industry [1,2,3]. To tackle this problem, one may aim to improve the wood harvesting infrastructure of the renewable forest energy sources. In this respect, there is a pressing need for research and technological development to characterize and reveal the energy efficiency of supply chains. An energy efficient supply chain is commonly defined as that chain which uses only a small part of the energy being delivered to a destination [4]. There is no doubt that a supply chain is efficient, when the fossil fuel use is minor or completely avoided. With respect to the efficiency of supply chains, road transportation represents an efficient operation within a sustainable forestry and wood harvesting activity [1]. However, there is a need to improve the environmental efficiency of wood transportation systems, mainly due to the carbon dioxide emissions from burning fossil fuels. Besides the transportation systems, an environmentally efficient transportation infrastructure is essential to sustain and balance the increasing wood demand in the forest industry. The present study reveals the technological development needs in a road network with the aim of increasing road freight transportation of the renewable wood energy.
Forest is the only major natural resource and energy source in Finland. Wood harvesting, which is being done sustainably, is an important part of the forest industry. It means that after harvesting, forests are always regenerated or replanted, leaving an overall wood energy balance that is actually positive [1]. Also, Finland was ranked highly (8th) against the top performer (Germany) in the EU region in terms of logistics performance index, that is, competence and quality of logistics services amongst countries in 2018 [5]. Nevertheless, ca. 20% of the total CO2 emissions in the EU come from the road transport sector [6,7]. In response to the EU regulations [8,9], recently, the Ministry of Transport and Communications published an action plan to eliminate greenhouse gas emissions in domestic transportation by 2045 [10]. According to the plan, the best solution for reaching the goals lies in an environmentally efficient transportation as a part of wood harvesting in the forest industry. From an environmental point of view, the forest industry has already advanced towards a carbon-neutral economy through the development of low-carbon logistics in the 21st century [11,12]. Actually, the development state indicators of the industry have justified the positive expectations in regards to the environmental efficiency of transportation systems. In a quite mature transportation situation, high-capacity transportation (HCT) would be an effective development step in raw-material processes towards an environmentally efficient forest industry. In addition, if introduced and used, the environmental emission efficiency metrics would be useful for the development of the Finnish road network, which has seldom been the focus of research.
The total length of public, private and forest roads and streets in Finland is about 450,000 km [13]. The network encloses highways, paved and gravel roads that are divided into five classes according to their local importance. As Finland is a large and sparsely populated country, there is no reason to upgrade all the roads to highways [14]. The total lengths of the paved and unpaved roads in the network are 50,305 and 27,688 km, respectively. There are also local roads used for forestry purposes in Finland. The total length of the forest road network is about 130,000 km [14]. Forest roads have been constructed to provide access for forest machines transportation vehicles into forest areas; some examples of forest roads are given in the supplementary material. Although there is not a general classification of forest roads in Finland, they may be subdivided into subsequent classes according to their traffic capacity, pavement type, driving speed and funding of construction and maintenance operations and, as such, their share may vary in different scientific reports and publications. In addition, many private roads, other than purpose-built forest roads, serve as access routes into forests. These are maintained rather well, often have a gravel coating and the traffic on them is usually minimal, being easily driven on by trucks; only the wet autumn season and the frosty spring season can be problematic for wood transportation and there is also a need for road maintenance and improvement of the infrastructure for this part of the forest road network. In this study, forest roads were considered those made of gravel for an average driving speed of up to 30 km h−1.
The construction of forest roads, which is subsidized by the government, peaked in the 1970s, when almost 5000 km of roads were constructed annually (Supplementary Materials). In the southern and central parts of the country, the forest road network has already reached the optimal density defined on the basis of current economic criteria [14]. According to the Temporary Act on the Financing of Sustainable Forestry, the maximum density of forests roads is 1.5 km km−2 on productive forest land [15]. In practice, the optimal distance to the nearest forest road has been commonly defined as from 200 to 400 m. For these reasons, only 500 km of new forest roads were constructed in 2018. Given the forest road network, which also serves public use, it is clear that an effective forestry can be implemented in the country, where ca. 80% of wood transportation is done by trucks, making the transportation conditions a key issue for an effective supply from forests to the industry (Supplementary Materials).
In recent decades, the focus has shifted from the construction of new forest roads to the maintenance of existing road network [16,17,18]. In 2011, more than 3800 km of forest roads were subjected to upgrading operations. However, the volume of road upgrading and consequently, the transportation conditions of the forest road network has declined over the last decade. The Forestry Experts’ Association estimated that one-third of the forest roads require improvement [18]. Those who work in wood harvesting operations have also suggested that the roads need improvements. Moreover, the machines used in the forestry have become heavier at the same pace as the roads have deteriorated. Therefore, the Temporary Act on the Financing of Sustainable Forestry allows applications for subsidies to renovate the roads, stipulating that a new road project must cover at least 500 m and supporting the idea of upgrading partial sections of roads [15]. The estimated costs of constructing a new forest road are about 20 € per meter, whereas for road upgrading, which is mainly done to improve the bearing capacity, they start at 15 € per meter [16,17,18].
High-capacity transportation (HCT) is often referring to the use of larger and heavier vehicles (LHVs), large capacity transport vehicles or high-capacity vehicles (HCV) [19,20,21]. Several studies reported that a large vehicle does not always utilize the total maximum weight allowed but it can be loaded to 100% capacity depending on the characteristics of the payload [21,22,23]. In this study, the concept of HCT was understood as any development intended to increase the contribution of the road transportation to both, transportation efficiency and environmental efficiency, by providing a way to reduce the exhaust emissions of wood transportation in line with the global targets [21]. Nowadays, the development of HCT must also improve its relative environmental efficiency and if the discourse is focused on the concepts of wood transportation and wood transportation in relation with CO2 emissions, the difference may become clear. CO2 emission is indicative for the vehicle’s loaded and/or empty turns, expressed in kilometers, as well as for the weight of transported wood per kilometer travelled (t × km−1).
A backhauling model of wood transportation describes well CO2 emissions in relation to the wood transportation volume per kilometer (Supplementary Materials) but this can also be imagined by the means of vehicles and kilometers. Both energetic metrics result in the benefits derived from the backhauling, that is, due to use of the HCT, which, however, should be evaluated accurately to improve the environmental sustainability. It is expected that backhauling is one of most effective operations for increasing transportation efficiency towards the HCT [24,25,26,27,28], because it reduces empty driving and the total transportation distance needed to deliver one payload to destination. In the backhauling model, transportation is formulated in three components: line-hauls, line hauls with backhauls and backhauls, which are graphically explained in the supplementary material. Using these components, which stand for a better description of real conditions, the effects of wood transportation on CO2 emissions can then be modelled more accurately, because transportation efficiency and environmental efficiency depend mainly on transportation distance and the type of road used [21].
Currently, fossil fuel is used by all the machinery operated in forestry, including that used in road improvement and maintenance. Consequently, EU provides guidance on reducing the emissions of these operations, being possible to control and reduce exhaust emissions, while still developing a sound forest road network for the HCT [29,30]. Based on the Temporary Act on the Financing of Sustainable Forestry, the Finish Forest Centre has published the same kind of guidance as the Forestry Commission in UK for the construction and improvement of the national forest road network [15,31]. In both countries, the forest road infrastructure appears to be changing, with the aim of reducing environmental emissions. At least, recommendations for forest road construction, maintenance and use aim at minimizing the damages from vehicle traffic and extreme weather and, thereby, at minimizing the need for repairing and rebuilding. A solution to the latter problem is an increase in the size and number of the drainage culverts to reduce seasonal problems [32,33], while a solution to the former problem would be the backhauling [24,26]. However, various HCT alternatives can take advantage of these possibilities to different extents. Acknowledging its own characteristics, the environmental efficiency of a HCT is still dependent on the transport conditions of the road network, share of loaded turns, empty driving, total weight and load volume or on their combination, to increase the capacity of wood transportation, which is partly a question of an increased total weight and of an increased vehicle length, that enable a higher payload volume, although they create flexibility and partial transport efficiency. Therefore, it is necessary to analyze the backhauling turns of vehicles and different road-network combinations, to meet the efficiency requirements of carbon-neutrality in the forest industry. Studies conducted in Sweden and Finland [24,25,26,27,28] have already suggested that 20–46% of the total wood transportation could be done by backhauling, reducing the direct transportation costs by 2–5% and the number of empty turns by 24% which, in turn, would bring environmental benefits. Currently, the vehicles are monitored by a synchronized transportation system (STS) of the forest industry which includes tools to estimate transportation efficiency, being used in the supply-chain management [20] and in the inter-enterprise collaboration at the operative level [26]. In the EU region, trucks’ exhaust emissions and energy efficiency of transportation have been studied using various approaches [34,35,36,37,38,39]. Recently, a useful energy efficiency model of wood transportation has been developed, tested and suggested for the calculation of line-hauling, which achieved a 20.5% increase in energy efficiency as a result of the development work on the HCT [1,40,41]. The model can be used to develop upstream logistics, when energy efficiency models of the forest industry are expanded to wood procurement [42,43,44,45]. With respect to environmental efficiency, the long-term CO2 reduction could even be 27–32%, figures which could be achieved when the transportation conditions are fully adjusted to the maximum weight limits [41]. Besides that, it has been suggested that improving the transportation conditions may contribute to the improvement of the HCT’s environmental efficiency. However, the promised environmental benefits have not yet been received. In this respect, the environmental efficiency analysis of increasing levels of backhauling transportation and shares of forest road network has seldom been a topic of research. Such research is necessary, because the wood transportation sector needs advanced HCT systems to ensure environmentally efficient transportation operations to be deployed in different road-network combinations. Once that has been achieved, the road network can be used, in practice, to develop HCT systems towards carbon-neutrality.
The adoption of environmentally efficient HCT technologies is part of the forestry’s process of adaptation to EU’s environmental regulations [1,2,3,4,46]. Recent studies have concluded that the increase in the environmental efficiency of the HCT depends on the transportation routes and fleet management [20,47,48]. However, these studies have analyzed and considered the efficiency of transportation, highlighting the potential impacts on the environmental benefits of the line-hauling transportation. In addition, the effect of road network combinations has not been properly examined.
This study analyses the environmental efficiency of the HCT in different road-network setups, by taking into consideration an increasing backhauling transportation, because engaging in a deeper development of the HCT for a mature forest road network requires a profound understanding of backhauling models. It is hypothesized that the road-network setup has an impact on the environmental efficiency of the increasing HCT. In addition to different road networks and backhauling models, 76 and 92 t vehicles were included in the study, which had the following objectives: (i) to evaluate the effects of the road-network setups on the environmental efficiency of the HCT between 2018 and 2020 and (ii) to evaluate the usefulness of backhauling transportation in the different road-network setups to achieve the maximum environmental efficiency of the HCT.
2. Material and Methods
2.1. Road Network
The previously developed system of mathematical calculation of environmental efficiency was expanded for the analysis of road network development needs in respect to backhauling transportation in the HCT [48]. The road-network setups were found to operate in three categories from an original group of eight classes of the forest industry corporation. For example, gravel roads with an average driving speed of up to 30 km h−1 belong to the forest road category (Table 1). In relation to the speed limits, the group of eight classes was too pretentious for an allocation of characteristics to enable the evaluation of HCT’s environmental efficiency in practice. The original group was defined by using the corporation’s GIS system (Table 1).

Table 1.
Categories of road-network setups based on the road classes used in forest industry. This was modified from References [14,16]. H = Highways, G = Gravel roads, F = Forest roads.
2.2. Wood Transportation Data
Wood transportation data were collected from the enterprise resource planning (ERP) system between 6 July 2018 and 19 August 2020 [48]. The system was used to automatically collect digital data from 152 vehicles (Table 2), which included all deliveries of the 76 and 92 t vehicle combinations to the corporation. In addition to data ranges, standard deviations were calculated to illustrate the variation of this data, although no statistical sampling methods were required or used for data collection [48].
Table 2.
Description of the main wood transportation parameters for the 2018–2020 intervals. Partial data from that reported in Reference [48].
The data on wood transportation used in this study represents a partition of that reported in Reference [48] and it consisted of 375,004 timber deliveries to mills of the industry corporation. Statistics of the data showing a wide range of the load sizes were treated similar to those reported in Reference [48] because the errors generated by the ERP were few, therefore they did not affect the whole dataset. As shown in Table 1, most of the data given (99%) accounted for transports done by the 76 t vehicle combinations. Figure 1 is giving a description of this data partition, on the total quantity transported by the considered vehicle combinations, which was about 525 million ton-kilometers (t × km).
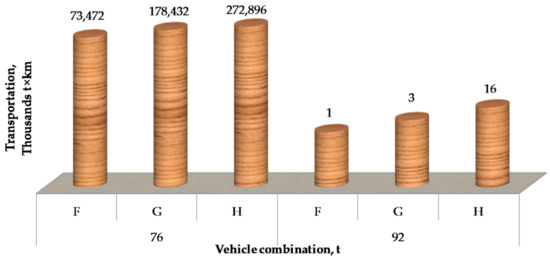
Figure 1.
Breakdown of the transported quantity (t × km) on vehicle combinations and road network setups. A partition of data from Reference [48]. Legend: F—forest roads with speed limit <30 km × h−1, G—gravel roads with speed limit ≥30 and ≤60 km × h−1 and H—highways and other roads with speed limit >60 km × h−1.
It is worth mentioning here that the ERP data used in this study stands for the average values of wood assortments loaded into the vehicles, which are computed based on the weight scaled by the cranes of each vehicle, as a part of the operative loading system of the forest industry corporation. Most importantly, the ERP provides data which is characteristic to different road-network configurations (i.e., shares of distances travelled by the vehicles), which was useful when analyzing the environmental efficiency of the backhauling transportation for selected road shares of the road-network setup. As such, the environmental efficiency analysis was based on the range of distances travelled by the vehicle combinations, which were accounted as 17 road-network setups which were also used to evaluate the usefulness of backhauling transportation in the different road-network setups of the HCT.
2.3. Fuel Consumption
A fuel consumption calculation system was developed to estimate the values of the fuel consumption variables that were needed for the environmental efficiency calculation system (Table 3). The former system is an integrated part of the efficiency calculation system, which enabled the variation of the different characteristics of the road-network setups.
Table 3.
Fuel consumption of fully loaded vehicle combinations on road-network setups. Legend: F—forest roads with speed limit <30 km × h−1, G—gravel roads with speed limit ≥30 and ≤60 km × h−1 and H—highways and other roads with speed limit >60 km × h−1.
As shown in Table 3, the average fuel consumption of a fully loaded 76 t vehicle was estimated at 62 L 100 km−1. In addition, the difference between the fuel consumption of the 76 t and 92 t combinations was estimated at 11.2 L 100 km−1. As the relations between the fuel consumption for different road-network setups were assumed to remain constant over the range of payload size and vehicles, the fuel consumption of the 92 t vehicle for a road-network setup (FCR92) can be calculated by using Equation (1).
where FCR76 is the observed average fuel consumption of the fully loaded 76 t vehicles for different road types of the road-network setup and FCT76 is the average total fuel consumption of the 76 t vehicles for the road-network setups. The shares of the 17 alternatives characterizing the road-network setups were changed manually in the system during the sensitivity analysis. In addition, the system calculated the fuel consumption of the vehicles for their different payload sizes. The fuel consumption of the vehicles was obtained by calculating the linear increase over the range of the fuel consumption values. Furthermore, fuel consumption of an empty vehicle was calculated and added to the total fuel consumption of the vehicles by the same system [1,41]. In the dataset, empty 76 and 92 t vehicle combinations consumed 36 and 38 L per 100 km, respectively.
2.4. Environmental Efficiency of the Increasing HCT
The environmental efficiency analysis of the HCT was conducted in three stages. Firstly, the CO2 emissions of the vehicles were calculated and modelled in respect to the road-network setups. In a second step, a more accurate analysis of the exhaust emissions was done in regard to the line-hauling and the backhauling transportation models. Finally, the index of the total efficiency of the HCT was calculated in respect to the road network setup and the backhauling transportation together. In this stage, the environmental efficiency of all 120 HCT alternatives was calculated. Thereafter, the environmental efficiency could be used to organize, from worst to best, the alternatives and to select the most efficient road-network setup.
At the beginning of the calculation system development process, the load emission data from VTT’s Lipasto database [49] was paired with the wood transportation data using the procedure of exhaust emission estimation provided by McKinnon [50,51]. Then, the method was adapted for the calculation of the emission parameters in relation to the road-network setups, which was also supported by data on load constraints that was collected following the provisions of the EU [4,52] under the assumption of a HCT made of vehicles compliant to the Euro VI emission standard. This standard regulates the maximum level of emissions for high-duty diesel engines [4].
Energy conversion efficiency is a decimal number between 0 and 1.0 or a share of 0 to 100%. However, the measures having values less than 0 or exceeding 1.0 can be used for devices and operations that move energy. The environmental efficiency metric and the index of total efficiency of the HCT for each road-network setup and transportation model were estimated having as a basis the methods presented in References [53,54,55,56]. To account for CO2 emissions, the index of total environmental efficiency (CEE) can be calculated by the use of Equation (2), for which a detailed interpretation is given [48].
where Co is the observed CO2 emission and Cs is the reference value of the CO2 emission. The target level of CO2 emissions was set for the 76 t vehicle combination, because this vehicle combination was targeted as the legal maximum vehicle size of the HCT [48]. In this study, in addition to organizing the alternatives from worst to best, the index of total efficiency shows the relative value of potential benefits or improvement possibilities for the road-network setup. The shares of road combination were used for the efficiency index.
3. Results
This study analyzed the effects of the road-network combinations on the environmental emissions of increasing HCT with line-hauling and backhauling transportations. In the first analysis, CO2 emissions of the line-hauling vehicles for the average transported load were calculated for different network setups consisting of highways, gravel roads and forest roads (Figure 2 and Figure 3). CO2 emissions of the vehicle combinations (76 and 92 t) increased by a stepwise pattern when the forest road’s share increased in the road network, although highways and gravel roads were used along with their maximum alternatives by shares of up to 100% of the road network. In this analysis, the maximum CO2 emissions per 100 vehicle-km (empty + loaded turns) were 16.13% higher than the lowest CO2 emissions for both vehicle combinations. Compared to the 76 t vehicles, the results from the calculations showed that the average CO2 emissions of the 92 t vehicles were 13.15% higher. Correspondingly, the 92 t vehicle consumed more diesel energy than the 76 t vehicle, when the line-hauling loads of renewable wood energy were delivered from forest to industry.
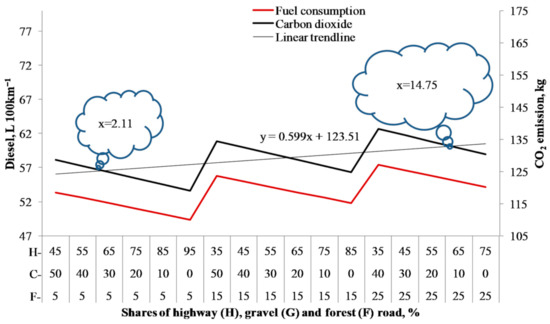
Figure 2.
The effect of road-network setup on CO2 emissions of 76 t vehicles in line-hauling transportation of renewable wood.
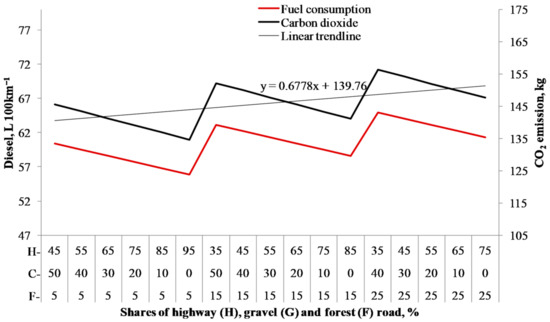
Figure 3.
The effect of road-network setup on CO2 emissions of 92 t vehicles in line-hauling transportation of renewable wood.
In respect to other greenhouse gas emissions, the analysis of line-hauling transportation of renewable wood is presented in Figure 4. To exemplify the analysis tool used in the study, the emissions of the 76 t vehicles are presented in this line-hauling case only, because differences as grams per 100 km between the vehicle combinations (and/or between the transportation technologies) were minor for the presentation of the results of all alternatives.
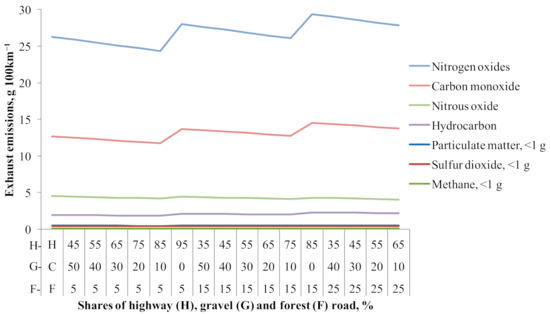
Figure 4.
The effect of road-network setup on exhaust emissions of 76 t vehicles in line-hauling transportation of renewable wood.
The straight lines crosscut the stepwise curves five times in Figure 2 and Figure 3. At these five intersections, the values of variable x were the same for the same road network setup or for the calculated average of two combinations next to each other, 2.11, 5.27, 10.04, 13.21 and 14.75, respectively. Variable x was used to measure and calculate the CO2 emission differences in Figure 2 and Figure 3. For an additional analysis, the effect of road-network setup on 76 t vehicles’ CO2 emissions in road transportation of renewable wood was calculated by using Equation (3). The CO2 emissions of these intersections were 124.772, 126.666, 129.527, 131.420 and 132.346 kg. As such, Equations (4), (5), (7) and (8) were used to estimate the CO2 emissions of the line-hauling cases in increasing transportation volumes of 60 and 70%.
Next, the road-network setup (F = 5, G = 30, H = 65), was analyzed, using a more detailed calculation method that revealed the impacts of increasing line-hauling on the exhaust emissions of the 76 and 92 t vehicles. The results are reported in Table 4 which shows an increase of the emissions in one road-network setup, when the total emissions were calculated at the level of ton-kilometer in respect to the average payload and transport distance. When the line-hauling transportation increased by 20%, from 50 to 70%, the CO2 emissions of the 76 t vehicles were 24.96 and 27.27 g t × km−1, respectively. Compared to the 76 t vehicles, the results of the calculations showed that the CO2 emissions of the 92 t vehicles were 21.72 and 24.16 g t × km−1 that is, 12.99 and 11.40% lower, respectively.
Table 4.
The effect of increasing line-hauling percentage on vehicles’ exhaust emissions (g t × km−1) and fuel consumption (diesel, ml t × km−1) in the selected road-network setup. F = Forest roads (5%), G = Gravel roads (30%) and H = Highways (65%).
Similarly, effects of the road-network setups on the exhaust emissions were analyzed to establish increasing transportation volumes, using the backhauling transportation. Figure 5, Figure 6 and Figure 7 show the CO2 emissions of the 76 t vehicle combination, when backhauling increased from 52 to 70%. The environmental emissions decreased, when the same road-network setups are compared to each other’s. By the same approach, Figure 8, Figure 9 and Figure 10 show the decreasing CO2 emissions of the 92 t vehicles. In this analysis, the maximum CO2 emissions per 100 vehicle-km (empty + loaded turns) were 43.12% and 40.51% higher than the lowest CO2 emissions for 76 and 92 t vehicle combinations, respectively. Compared to the 76 t vehicles, the results of the calculations showed that the average CO2 emissions of the 92 t vehicles were 13.15% and 15.25%, higher in the 52% and 70% backhauling, respectively.
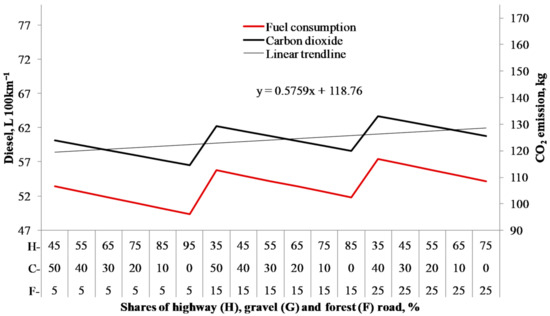
Figure 5.
Effects of road-network setups on CO2 emissions of 76 t vehicle in 52% backhauling transportation of renewable wood.
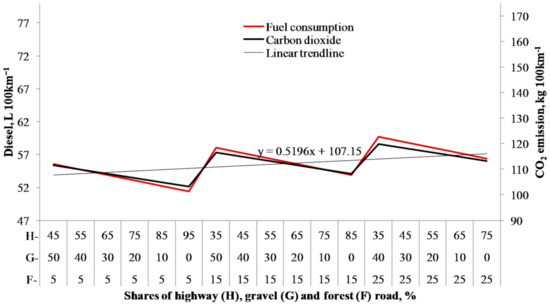
Figure 6.
Effects of road-network setups on CO2 emissions of 76 t vehicle in 60% backhauling transportation of renewable wood.
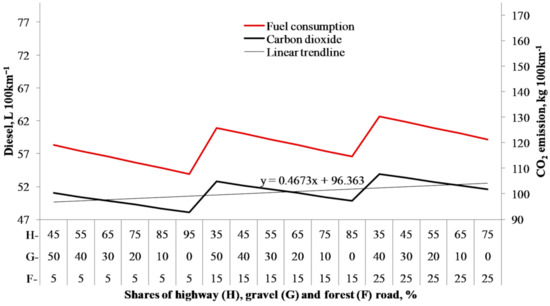
Figure 7.
Effects of road-network setups on CO2 emissions of 76 t vehicle in 70% backhauling transportation of renewable wood.
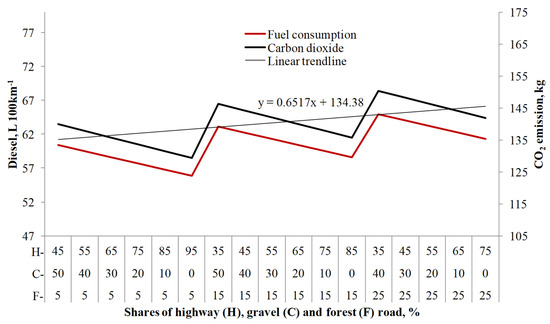
Figure 8.
Effects of road-network setups on CO2 emissions of 92 t vehicle in 52% backhauling transportation of renewable wood.
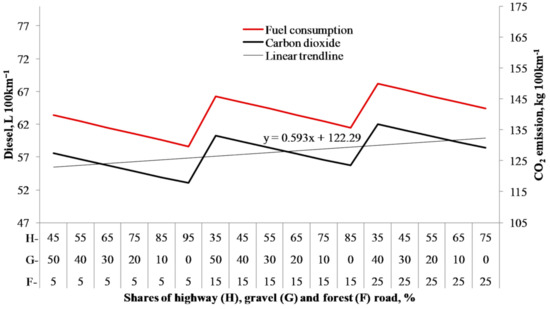
Figure 9.
Effects of road-network setups on CO2 emissions of 92 t vehicle in 60% backhauling transportation of renewable wood.
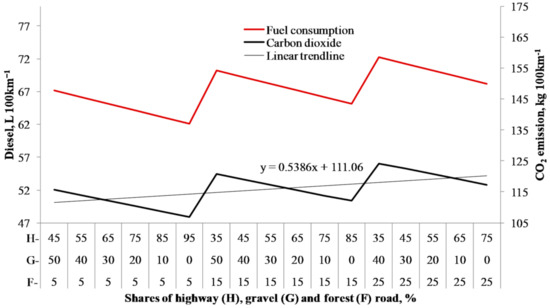
Figure 10.
Effects of road-network setups on CO2 emissions of 92 t vehicle in 70% backhauling transportation of renewable wood.
Table 5 shows how the exhaust emissions decreased in the same road-network setup (F = 5, G = 30, H = 65), if they are calculated at the level of ton-kilometer in respect to the average payload and transport distance, because of reduced relative fuel consumption. In reality, the fuel consumption and the corresponding emissions of environmental contaminants would decrease if the HCT would have been developed towards the 70% backhauling. The reduction in the average fuel consumption (ml t × km−1) between 52% and 70% of backhauling was 18.88%. In this respect, the CO2 emissions could be reduced by 4.52, achieving 19.48 g t × km−1 based on the data from the 76 t vehicle combinations. When the 92 t vehicle was assumed to be used in transportation, the reduction in fuel consumption (ml t × km−1) between 52% and 70% of backhauling was 17.35%. In this respect, the emissions of CO2 could be reduced by 3.62, achieving 17.26 g t × km−1.
Table 5.
The effect of backhauling transportation on environmental efficiency, in respect to increasing harvesting of renewable wood energy (m3), trucks’ exhaust emissions (g t × km−1) and fuel consumption (diesel, ml t × km−1) in the selected road-network setups. F = Forest roads (5%), G = Gravel roads (30%) and H = Highways (65%).
It was possible to use Equations (9)–(11) in the final stage of the analysis to reveal the total efficiency of the HCT in harvesting renewable wood energy. Accordingly, Equations (12)–(14) estimate CO2 emissions of the 92 t vehicle in the backhauling transportation model.
The analysis started by estimating the environmental emissions of the road-network setup, by calculating CO2 emissions as kilograms per 100 vehicle-km (empty + loaded turns) and as grams per ton-kilometer (g t × km−1). Following this step, Equations (3)–(14) were used to produce the results at this level (Table 6). The lowest CO2 emission, as kilograms per 100 vehicle-km (97.344), was produced by alternative A with Equation (12). On the other hand, the lowest CO2 emission as grams per ton-kilometer (17.52) was produced by alternative B with Equation (15).
Table 6.
Impact of road-network setup on vehicle combination’s CO2 emission per 100 vehicle-km (empty + loaded turns) and as grams per ton-kilometer (g t × km−1) in alternatives of increasing high-capacity transportation (HCT).
Next, the impacts of the road-network setup on the environmental efficiency order of the HCT were determined in respect to line-hauling and backhauling transportation models. There were 60 ordering values in both evaluation groups for the road-network setups (Table 7). Group O1 describes emissions per 100 vehicle-km (empty + loaded turns) and the group O2 describes CO2 emissions per t × km−1. There were six observations among the line-hauling alternatives that were better than the ordering value of 30 and 24 observations that belonged to the group of the backhauling transportation in the evaluation group of O2 (CO2 emissions per t × km−1). In addition, six line-hauling alternatives using the 92 t vehicle combinations were mentioned.
Table 7.
Impact of road-network setup on environmental efficiency order of HCT in harvesting of renewable wood energy. A to E = road-network setups as percentages of forest road, gravel road and highway; O1 = emissions per 100 vehicle-km (empty + loaded turns), O2 = CO2 emissions per t × km−1; 76 and 92 t are vehicle sizes in tons; L_% = transportation increase as line-hauling percentage; B_% = transportation increase as backhauling percentage.
Finally, impacts of road-network setups on the environmental efficiency were determined by comparing the total efficiency values of the HCT to the most efficient 76 t HCT alternative. That was the road-network alternative B with 76_B_70%. To this end, Equation (2) was used to produce the results at this level. Table 8 shows the relative values as the index of total efficiency of the HCT in respect to the road-network setup and to the backhauling transportation in harvesting of renewable wood energy. Road-network alternative B, with 92_B_70%, was the most efficient HCT alternative. When compared to the most efficient 76 t HCT alternative, the environmental efficiency increased by 11%. Furthermore, the efficiency increased by 21% when compared to the most efficient line-hauling alternative, which can be estimated by using Table 7 and Table 8.
Table 8.
The index of total efficiency of HCT in respect to road-network setup and backhauling transportation in harvesting of renewable wood energy. A to E = road-network setups as percentages of forest road, gravel road and highway; 76 and 92 t are vehicle sizes in tons; B_% = transportation increase as backhauling percentage.
4. Discussion
In a sustainable forest industry, road transportation represents an important part of the energy efficient supply chain of renewable wood energy. Together with transportation, environmentally efficient road infrastructure is essential to sustain the increasing wood demands of the forest industry. This study revealed the technological development needs in road-network infrastructure to increase the capacity of road freight transportation. Right at the beginning, it was hypothesized that the road-network setup might have an impact on the environmental efficiency of the HCT and the study has proved that the road-network setup affects the environmental efficiency. For example, CO2 emissions of the vehicle combinations increased when the forest road’s share increased in the road network, although highways and gravel roads were used, along with their maximum alternatives in terms of shares of the 100% road-network setup.
The results showed the development needs of the road-network setup towards the potential environmental efficiency of the HCT in renewable wood harvesting of the forest industry. It was expected that the indexes of the environmental efficiency of the HCT would be able to reveal differences between the road-network setups, which could be used in the mature stage of the development process of the forest road network to determine its potential efficiency in transportation planning. In reality, the road-network setup of the corporation consisted of forest roads (14%), gravel roads (34%) and highways (52%). According to the results of this study, the shares of the forest and gravel roads are currently too large and they should be upgraded to a higher standard. Typically, by upgrading, the bearing capacity of the forest road increases [15,16,17], which is also supporting the increase of the HCT.
In addition to the road-network setups, the backhauling transportation models and the 76 and 92 t vehicle combinations are considered in this discussion. Actually, when the average payloads of renewable wood energy were delivered from forest inventories to the industrial production, the average CO2 emissions of the 92 t vehicles were 13.15% higher, relative to the 76 t vehicles without the use of the backhauling transportation model. So far, other studies have analyzed and considered the environmental efficiencies of the HCT, highlighting the potential impacts on the environmental benefits of line-hauling transportation [20,47,48]. In reality, the wood transportation situation can be more efficient from an environmental point of view, if backhauling transportation is to be used instead of line-hauling transportation. The results show that road-network alternative B (forest roads 10%, gravel roads 25%, highways 65%) with the backhauling alternative 92_B_70% was the most efficient HCT option. When compared to the most efficient 76 t HCT combination, the environmental efficiency increased by 11%. Furthermore, the efficiency increased by 21%, relative to the most efficient line-hauling alternative. It is reasonable to mention that, when the environmental effects of the road-network setups were analyzed in increasing HCT from 52% to 70%, the use of road network was environmentally more efficient if the HCT relied on the backhauling transportation. Therefore, it is recommended an increment of the backhauling transportation share in the practices of the HCT. This suggestion is consistent with the findings of previous studies [24,25,26,27,28].
Basically, the environmental emissions of the vehicle combinations were calculated by the same method as in the study by Palander et al. [48], due to the usefulness of the method. Nevertheless, the method was developed further for the calculation of the emission parameters that could characterize both the road-network setups and the transportation model. This was possible by calculating the index of the total efficiency of the HCT, which was achieved by dividing the calculated emission target of energy use by the current emission level from energy use [50]. In addition, the development process produced a useful CO2 emission value table and the environmental efficiency order of the HCT alternatives. Actually, these environmental applications are often used in the context of energy conversion efficiency and the thermodynamic fundamentals of fuel production management [7], providing useful insights into the relationships of the road-network setups and the backhauling transportation, which represents novel knowledge, compared to previous studies in the EU concerning even the use of smaller vehicles (max 44–60 t) [1,2,3,4,21]. In addition, by its approach, this study provided a more comprehensive analysis and targets for the Finnish practice of road maintenance and wood transportation, which is also recommended for a broader use abroad for a sustainable forestry. The results suggest that the environmental emission values can be used as an operative state indicator in the process of developing the road network, if the exhaust emissions are calculated at the level of ton-kilometer (t × km). So, it is also a useful tool to monitor HCT-operations in practice. The other efficiency metric, which is based on the vehicle-km approach, could not be recommended as a useful indicator. The last indicator was the index of the total efficiency of the HCT-combination. This development indicator would be useful for tactical and strategic planning towards the potential benefits for the adaptation process to the HCT.
The results provide general information on the planning and design of the road-network setups, with a specific focus on upgrading the existing forest roads without reducing the road density, given HCT alternatives, by increasing backhauling and selecting the vehicle combination. A planning decision benefit index is provided to guide managers for their selection of the option with the lowest environmental emission impact. In this respect, additional information is provided on minimizing empty vehicle driving, minimizing CO2 emissions and minimizing the forest roads use. However, the cost efficiency of the forest roads upgrading was not considered in this study, while they could be substantial. They were estimated to about 15 € per meter of the forest road [16,17,18] and are aimed at improving the bearing capacity of the roads to increase the capacity of wood transportation. If one-third of the forest roads are to be upgraded to provide an increase of HCT, it will cost about 650 million €. On the other hand, wood transportation costs are about 500 million € per year in Finland. This leads to a cost reduction of 25 million per year, that is, it will take 26 years to pay the investment back without consideration of other benefits related to a sustainable forestry. According to this study, the environmental benefits of transportation alone may be increased by 40% when CO2 emissions related to the upgrading of forest roads are reduced from the worst transportation conditions to the minimum level.
Finnish studies have reported that CO2 emissions may be reduced by as much as 32% when using high-capacity vehicles [19]. However, it is clear that all of the expected environmental benefits will not be reached in the STS of the forest industry by increasing vehicle size and weight, by using optimal routing and by vehicle fleet management [41]. Although energy efficiency indicators (wood energy/fossil energy) have revealed that wood transportation is already carbon neutral in its current state [1,48], the adoption of 100% environmentally efficient HCT technologies is yet a part of the adaptation process of the national forestry to the EU regulations [1,2,3,4]. Therefore, it is important to continue this positive development driving towards carbon free road transportation in the logistics of the forest industry. Furthermore, without the research efforts of the forest industry, it is hardly likely to reach governments’ national environmental aims [1,20]. The results of this study justify the abovementioned suggestions, because engaging in development of the HCT in the mature forest road network required a profound understanding of the line-hauling and backhauling models of wood transportation. To sum up the national forestry aspect, it is confirmed that the environmental efficiency of the HCT is dependent on the forest road conditions. Together with the national road-network setups, they may affect vehicle routing, transport optimization and scheduling alternatives of transportation fleets in large forest industry corporations. The studied wood-procurement organization delivers wood to a large forest industry corporation. Currently, wood transportation volume is about 23 million m3 per year, corresponding to one-third of the used wood resources at the industrial factories in Finland [45]. Therefore, this study emulates well the wood transportation conditions in practice.
5. Conclusions
The harvesting of renewable wood energy is a necessary logistics operation of the environmentally sustainable forest industry. With respect to logistics, the corporations can address their responsibilities by developing a carbon-neutral wood transportation. Actually, the adoption of 100% environmentally efficient HCT technologies is also a part of the adaptation process of the forestry to the EU regulations. In this respect, the index of the total efficiency of the HCT revealed that decreasing the forest roads’ share in the road-network setup would increase the efficiency towards a maximum environmental efficiency for the current forest-road density in Finland. As such, the hypothesis of the study was true, because the results have indicated that the road-network setup has an impact on the environmental efficiency of the HCT, which was justified in respect to the backhauling transport by the 76 and 92 t vehicle combinations. Therefore, upgrading the forest roads is suggested for the forestry sector as a sustainable practice. However, upgrading activities will take 11 years, based on the current capacity to construct roads at a pace of 3800 km per year. In forestry, the discourse is often focused on the carbon balance and carbon sink. As the upgrading of forest roads will last for a long time, the backhauling of road transportation planning would support positive regional development in available road-network setups to achieve a maximum environmental efficiency of the HCT before the forest roads’ final upgrading. Therefore, the efficiency metrics of the HCT should be implemented in transportation planning systems and other companies could adopt them as a good practice example supposing that they operate in a mature development situation such as that of Finland. Otherwise, construction of new forest roads must be considered first instead of upgrading.
Supplementary Materials
The following are available online at https://www.mdpi.com/1996-1073/14/2/453/s1. Supplementary Figure S1: Three categories of road network in wood transportation: forest roads with speed ≤30 km h−1, rural gravel roads with speed >30 and <60 km h−1 and 2nd class highway with speed ≥60 km h−1. Supplementary Figure S2: Forest road construction and maintenance in Finland. Figure was modified from forest statistics of [17]. Supplementary Figure S3: High capacity transportation of renewable wood operates on environmentally friendly forest road network. Supplementary Figure S4: Transportation services of two-way backhauling (left) and tree-way backhauling (right) compared to line hauling: line hauls (black), line hauls with backhauls (green), and backhauls (green). The routes driven with an empty load are marked as dashed lines and the routes driven with a payload as solid lines.
Author Contributions
Conceptualization, T.P.; methodology, T.P.; software, T.P.; validation, T.P., S.A.B. and K.K.; formal analysis, T.P.; investigation, T.P.; resources, T.P.; data curation, T.P.; writing—original draft preparation, T.P.; writing—review and editing, T.P., S.A.B. and K.K.; visualization, T.P.; supervision, T.P.; project administration, T.P.; funding acquisition, T.P., S.A.B. and K.K. All authors have read and agreed to the published version of the manuscript.
Funding
This research received no external funding.
Institutional Review Board Statement
Not applicable.
Informed Consent Statement
Not applicable.
Data Availability Statement
Not applicable.
Conflicts of Interest
The authors declare no conflict of interest.
References
- Palander, T.; Haavikko, H.; Kortelainen, E.; Kärhä, K. Comparison of Energy Efficiency Indicators of Road Transportation for Modeling Environmental Sustainability in “Green” Circular Industry. Sustainability 2020, 12, 2740. [Google Scholar] [CrossRef]
- Herran, D.S.; Tachiiri, K.; Matsumoto, K. Global energy system transformation in mitigation scenarios considering climate uncertainties. Appl. Energy 2019, 243, 119–131. [Google Scholar] [CrossRef]
- Liu, D.; Guo, X.; Xiao, B. What causes growth of global greenhouse emissions? Evidence from 40 countries. Sci. Total Environ. 2019, 661, 750–766. [Google Scholar] [CrossRef] [PubMed]
- Marchi, B.; Zanoni, S. Supply Chain Management for Improved Energy Efficiency: Review and Opportunities. Energies 2017, 10, 1618. [Google Scholar] [CrossRef]
- Logistics Performance Index: Competence and Quality of Logistics Services. Word Bank. 2018. Available online: https://lpi.worldbank.org/international/scorecard/radar/2/C/FIN/2018 (accessed on 2 November 2020).
- Fernandez-Dacosta, C.; Shen, L.; Schakel, W.; Ramirez, A.; Kramer, G.J. Potential and challenges of low-carbon energy options: Comparative assessment of alternative fuels for the transport sector. Appl. Energy 2019, 236, 590–606. [Google Scholar] [CrossRef]
- Tucki, K.; Mruk, R.; Orynycz, O.; Wasiak, A.; Świć, A. Thermodynamic Fundamentals for Fuel Production Management. Sustainability 2019, 11, 4449. [Google Scholar] [CrossRef]
- EUR-Lex, A Roadmap for Moving to a Competitive Low Carbon Economy in 2050. Available online: https://eur-lex.europa.eu/legal-content/EN/ALL/?uri=CELEX%3A52011AE1389 (accessed on 2 November 2020).
- EUR-Lex, A Policy Framework for Climate and Energy in the Period from 2020 to 2030. Available online: https://eur-lex.europa.eu/legal-content/EN/TXT/PDF/?uri=CELEX:52014DC0015&from=EN (accessed on 2 November 2020).
- Ministry of Transport and Communications, Transport Emissions to Zero by 2045. Available online: https://valtioneuvosto.fi/en/article/-/asset_publisher/liikenteen-paastot-nollaan-vuoteen-2045-mennessa (accessed on 2 November 2020).
- Palander, T.; Haavikko, H.; Kärhä, K. Towards sustainable wood procurement in forest industry—The energy efficiency of larger and heavier vehicles in Finland. Renew. Sustain. Energy Rev. 2018, 96, 100–118. [Google Scholar] [CrossRef]
- Green and Vibrant Economy—The Climate Roadmap for the Forest Industry. 2020. Available online: https://www.metsateollisuus.fi/ilmastotiekartta/ (accessed on 2 November 2020).
- Finland’s State of Logistics, Ministry of Transport and Communications. 2012. Available online: https://julkaisut.valtioneuvosto.fi/handle/10024/78002 (accessed on 2 November 2020).
- Viitala, E.-J.; Saarinen, V.-M.; Mikkola, A.; Strandström, M. Evaluating the need for the building of new forest roads on the basis of GIS data. Metsätieteen Aikakauskirja 2004, 2, 175–192. [Google Scholar]
- Temporary Act on the Financing of Sustainable Forestry (34/2015; Amendments up to 202/2017 Included) Ministry of Agriculture and Forestry, Finland. 2017. Available online: https://mmm.fi/documents/1410837/2400751/Act+on+the+Financing+of+Sustainable+Forestry.pdf/1bc17e03-a5b3-8900-33c2-4a3678ca4344/Act+on+the+Financing+of+Sustainable+Forestry.pdf.pdf (accessed on 2 November 2020).
- Anon 2019. Forest.fi. Forest Centre. Available online: https://www.metsakeskus.fi/node/321 (accessed on 18 December 2020).
- Anon 2018. Forest Roads. Assessment of the Profitability of Investments in the Forest Economy. Available online: https://tuohtametsasta.fi/wp-content/uploads/2018/02/Mets%C3%A4tiet-LL.pdf (accessed on 18 December 2020).
- Anon 2019. Silvicultural and Forest Improvement Work. Natural Resources Institute Finland. Available online: https://stat.luke.fi/en/silvicultural-and-forest-improvement-work-2019_en (accessed on 18 December 2020).
- Better Competitiveness through New Masses and Dimensions for Heavy Goods Vehicles, Ministry of Transport and Communications. 2013. Available online: http://www.lvm.fi/tiedote/4150413/better-competitiveness-through-new-masses-and-dimensions-for-heavy-goods-vehicles (accessed on 2 December 2020).
- Palander, T.; Kärhä, K. Improving Energy Efficiency in a Synchronized Road-Transportation System by Using a TFMC (Transportation Fleet-Management Control) in Finland. Energies 2019, 12, 670. [Google Scholar] [CrossRef]
- OECD. Moving Freight with Better Trucks: Improving Safety, Productivity and Sustainability. 2011. Available online: http://www.oecd-ilibrary.org/transport/ (accessed on 2 December 2020).
- Sosa, A.; Klvac, R.; Coates, E.; Kent, T.; Devlin, K. Improving Log Loading Efficiency for Improved Sustainable Transport within the Irish Forest and Biomass Sectors. Sustainability 2015, 7, 3017–3030. [Google Scholar] [CrossRef]
- Liimatainen, H.; Pöllänen, M.; Nykänen, L. Impacts of increasing maximum truck weight–case Finland. Eur. Transp. Res. Rev. 2020, 12, 14. [Google Scholar] [CrossRef]
- Väätäinen, J.; Palander, T.; Harstela, P. Optimization model of backhauling transportation in wood procurement. Metsätieteen Aikakauskirja 2002, 1, 5–17. [Google Scholar]
- Bredström, D.; Lundgren, J.T.; Rönnqvist, M.; Carlsson, D.; Mason, A. Supply chain optimization in the pulp mill industry-IP models, column generation and novel constraint branches. Eur. J. Oper. Res. 2004, 156, 2–22. [Google Scholar] [CrossRef]
- Palander, T.; Väätäinen, J.; Laukkanen, S.; Malinen, J. Modeling backhauling on Finnish energy-wood network using minimizing of empty routes. Int. J. For. Eng. 2004, 15, 79–84. [Google Scholar] [CrossRef]
- Palander, T.; Väätäinen, J. Impacts of inter-enterprise collaboration and backhauling on wood procurement in Finland. Scand. J. For. Res. 2005, 20, 177–183. [Google Scholar] [CrossRef]
- Carlsson, D.; Rönnqvist, M. Supply chain management in forestry––Case studies at Södra Cell AB. Eur. J. Oper. Res. 2005, 163, 589–616. [Google Scholar] [CrossRef]
- Dickerson, A.; Nicoll, B.; Perks, M. Reducing greenhouse gas emissions from forest civil engineering. For. Comm. Tech. Note 2013, 20, 1–12. [Google Scholar]
- Mason, W.L.; Nicoll, B.C.; Perks, M. Mitigation potential of sustainably managed forests. In Combating Climate Change: A Role for UK Forests. An Assessment of the Potential of the UK’s Trees and Woodlands to Mitigate and Adapt to Climate Change; Read, D.J., Freer-Smith, P.H., Morison, J.I.L., Hanley, N., West, C.C., Snowdon, P., Eds.; The Stationery Office: Edinburgh, UK, 2009. [Google Scholar]
- Maintaining of Forest Roads, Finnish Forest Center, Ministry of Agriculture and Forestry, Finland. 2020. Available online: https://www.metsakeskus.fi/metsaautotiet (accessed on 2 December 2020).
- Nisbet, T.R. The role of forest management in controlling diffuse pollution in UK forestry. For. Ecol. Manag. 2001, 143, 215–226. [Google Scholar] [CrossRef]
- Nisbet, T.; Silgram, M.; Shah, N.; Morrow, K.; Broadmeadow, S. Woodland for Water: Woodland measures for meeting Water Framework Directive objectives. For. Res. Monogr. 2011, 4, 156. [Google Scholar]
- Sonne, E. Greenhouse gas emissions from forestry operations: A lifecycle assessment. J. Environ. Qual. 2006, 35, 1439–1450. [Google Scholar] [CrossRef]
- Holzleitner, F.; Kanzian, C.; Stampfer, K. Analyzing time and fuel consumption in road transport of round wood with an onboard fleet manager. Eur. J. For. Res. 2011, 130, 293–301. [Google Scholar] [CrossRef]
- Handler, R.M.; Shonnard, D.R.; Lautala, P.; Abbas, D.; Strivastava, A. Environmental impacts of roundwood supply chain options in Michigan: Life-cycle assessment of harvest and transport stages. J. Clean. Prod. 2014, 76, 64–73. [Google Scholar] [CrossRef]
- Palander, T. Environmental benefits from improving transportation efficiency in wood procurement systems. Transp. Res. Part D 2016, 44, 211–218. [Google Scholar] [CrossRef]
- Svenson, G.; Fjeld, D. The impact of road geometry, surface roughness and truck weight on operating speed of logging trucks. Scand. J. For. Res. 2017, 32, 515–527. [Google Scholar] [CrossRef]
- Lijewski, P.; Merkisz, J.; Fuć, P.; Ziółkowski, A.; Rymaniak, L.; Kusiak, W. Fuel consumption and exhaust emissions in the process of mechanized wood extraction and transport. Eur. J. For. Res. 2017, 136, 153–160. [Google Scholar] [CrossRef]
- Haavikko, H.; Kärhä, K.; Hourula, M.; Palander, T. Attitudes of Small and Medium-Sized Enterprises towards Energy Efficiency in Wood Procurement: A Case Study of Stora Enso in Finland. Croat. J. For. Eng. 2019, 40, 107–123. [Google Scholar]
- Palander, T. The environmental emission efficiency of larger and heavier vehicles—A case study of road transportation in Finnish forest industry. J. Clean. Prod. 2017, 155, 57–62. [Google Scholar] [CrossRef]
- Joelsson, J.M.; Gustavsson, L. CO2 emission and oil use reduction through black liquor gasification and energy efficiency in pulp and paper industry. Resour. Conserv. Recycl. 2008, 52, 747–763. [Google Scholar] [CrossRef]
- Ghose, A.; Chinga-Carrasco, G. Environmental aspects of Norwegian production of pulp fibres and printing paper. J. Clean. Prod. 2013, 57, 293–301. [Google Scholar] [CrossRef]
- Hämäläinen, E.; Hilmola, O.P. Energy efficiency at the paper mill—Dilemma of improvement. Energy Effic. 2017, 10, 809–821. [Google Scholar] [CrossRef]
- Stora Enso, Progress Book, Part of Stora Enso’s Annual Report 2017. 2018. Available online: https://www.storaenso.com/download-centre/ (accessed on 2 December 2020).
- Inkinen, T.; Hämäläinen, E. Reviewing Truck Logistics: Solutions for Achieving Low Emission Road Freight Transport. Sustainability 2020, 12, 6714. [Google Scholar] [CrossRef]
- Höök, C.; Asmoarp, V.; Edlund, B.; Bergström, D.A. Method of Finding HCT Roundwood Corridors for Reduction of GHG Emissions and Fuel Costs in Sweden. Forests 2020, 11, 220. [Google Scholar] [CrossRef]
- Palander, T.; Haavikko, H.; Kortelainen, E.; Kärhä, K.; Borz, S.A. Improving Environmental and Energy Efficiency in Wood Transportation for a Carbon-Neutral Forest Industry. Forests 2020, 11, 1194. [Google Scholar] [CrossRef]
- Lipasto, Road Traffic Emissions and Energy Consumption in Finland. 2012. Available online: http://lipasto.vtt.fi/liisae/emissiondata.htm (accessed on 2 December 2020).
- McKinnon, A. The economic and environmental benefits of increasing maximum truck weight: The British experience. Transp. Res. Part D 2005, 10, 77–95. [Google Scholar] [CrossRef]
- McKinnon, A.C.; Piecyk, M. Measurement of CO2 emissions from road freight transport: A Review of UK Experience. Energy Policy 2009, 37, 3733–3742. [Google Scholar] [CrossRef]
- European Modular Systems. 2013. Available online: http://www.modularsystem.eu/ (accessed on 2 December 2020).
- Hu, J.; Wang, S. Total-factor energy efficiency of regions in China. Energy Policy 2006, 34, 3206–3217. [Google Scholar] [CrossRef]
- Chang, Y.-T. Environmental efficiency of ports: A data envelopment analysis approach. Marit. Policy Manag. 2013, 40, 467–478. [Google Scholar] [CrossRef]
- Chang, Y.-T.; Zhang, N.; Danao, D.; Zhang, N. Environmental efficiency analysis of transportation system in China: A non-radial DEA approach. Energy Policy 2013, 58, 277–283. [Google Scholar] [CrossRef]
- Park, Y.S.; Lim, S.H.; Egilmez, G.; Szmerekovsky, J. Environmental efficiency assessment of U.S. transport sector: A slack-based data envelopment analysis approach. Transp. Res. Part D 2018, 61, 152–164. [Google Scholar] [CrossRef]


Publisher’s Note: MDPI stays neutral with regard to jurisdictional claims in published maps and institutional affiliations. |
© 2021 by the authors. Licensee MDPI, Basel, Switzerland. This article is an open access article distributed under the terms and conditions of the Creative Commons Attribution (CC BY) license (http://creativecommons.org/licenses/by/4.0/).