Article

Size- and Surface-Dependent Solubility of Cadmium Telluride in Aqueous Solutions

1
Institute for Photovoltaics and Research Center SCoPE, University of Stuttgart, 70569 Stuttgart, Germany
2
Institute for Sanitary Engineering, Water Quality, and Solid Waste Management, University of Stuttgart, 70569 Stuttgart, Germany
*
Author to whom correspondence should be addressed.
Energies 2021, 14(2), 398; https://doi.org/10.3390/en14020398
Submission received: 20 November 2020 / Revised: 18 December 2020 / Accepted: 23 December 2020 / Published: 12 January 2021

Abstract

:
Due to the toxicity of cadmium (Cd) and the scarcity of telluride (Te), CdTe-based photovoltaic modules have been under discussion during the last few years. In particular, the stability of CdTe in aqueous solutions is under debate. Here we show that the stability of CdTe depends not only on the pH of water-based solutions but also on size and surface treatment of CdTe particles. We compare milled module pieces with CdTe powders of different particle size. The leaching of CdTe is conditioned by the outdiffusion of Cd and Te at the interface between CdTe particles and the aqueous solution. The smaller the particle size, the faster the leaching. Therefore, milled module pieces decompose faster than CdTe powders with relatively large grains. We observe a dependence on time t according to t0.43. The room temperature diffusion coefficients are calculated as DCd ≈ 3 × 10⁻¹⁷ cm2/s for Cd, and DTe ≈ 1.5 × 10⁻¹⁷ cm2/s for Te in pH4. The chemical instability in aqueous solutions follows thermodynamic considerations. The solution behavior of Cd and Te depends on the pH value and the redox potential of the aqueous solutions. Chemical treatments such as those used in solar cell production modify the surface of the CdTe particles and their leaching behavior.

1. Introduction

At present, every year, small- and large-area photovoltaic systems are installed on the basis of cadmium telluride (CdTe)-containing modules with a power around 3 GWp, which corresponds to an annual area of 20 km2 and an annual distribution of about 230 tons of Cd. (A typical CdTe module of 16% efficiency (160 W/m²) with a CdTe thickness of around 4 µm contains about 78 mg Cd per W. At present (2020) about 3 GWp of CdTe modules are produced worldwide per year.) At the end of 2019, about 600 GWp module power were installed worldwide. From these, between 25 and 30 GWp, i.e., between 4% and 5% are modules on the basis of CdTe. This number corresponds to an area of 170 to 200 km2 for the CdTe modules containing a total mass of about 2000 t of Cd. This enormous distribution of CdTe on large areas clearly raises the question of the environmental effects of the toxic element Cd as well as of the compound CdTe.
Despite the toxicity and the cancerogenic action of the element Cd, its use in CdTe modules still is not yet legally restricted within the European Union. The lack of legal sanctions against CdTe modules usually is justified by arguing that cadmium telluride is “chemically stable”, in particular in aqueous solutions, for example, in rainwater. Indeed, when compared to the elements Cd and Te, as well as to other Cd compounds, the crystalline compound cadmium telluride (CdTe) has a higher stability [1]. Therefore, intact CdTe photovoltaic modules seem to impose no risks for environment and health [2]: In unbroken modules, the CdTe layers are protected by two glass plates and the edge sealing of the module. However, at the end of use of intact photovoltaic modules questions remain concerning the decommissioning and recycling of CdTe [3]. Possible ways of recycling of the CdTe-modules are crushing and leaching in acids like sulfuric acid with low pH (pH < 1) [4,5].
For a long time it has been stated that even unprotected CdTe layers would only decompose in strong acids. Neutral water and rainwater were stated to not decompose CdTe [1]. These statements were based on experiments that were carried out over 24 h only. Recently, however, we gave direct experimental proof that CdTe layers in photovoltaic module pieces do not only decompose in strong acids, but (if waited long enough) even in neutral water [6,7].
During the course of our studies [6,7] we speculated if the thickness and/or the grain size of the CdTe layers might have an influence on the stability and solubility of CdTe in aqueous solutions. In the case of our commercially obtained CdTe solar modules, we measured a thickness dCdTe ≈ 3 µm for the CdTe layer. This thickness is large enough to absorb about 90% of the sun’s light with photon energies hν ≥ Eg with the value Eg = 1.45 eV for the band gap of CdTe [8,9,10]. The size of CdTe particles and/or illumination may also play a role in the decomposition in aqueous solutions: illuminated CdTe particles of nm size show a higher mobilization of Cd due to a photochemical reaction [11]. The grain size of the crystals in the CdTe module pieces is in the µm-range [12], which we confirmed by own measurements.
Apart from thickness and/or grain size, the stability of the compound CdTe might also be influenced by the surface structure of the CdTe layers. During the production process of the solar module, the surface of the CdTe is modified by several steps [13,14,15], which alter the surface of the CdTe layers for solar modules. These steps may also change the solubility of CdTe layers either by protecting them or even by making them “weaker” against the attack of aqueous solution.
The present study reports on the influence of the grain size, and the surface properties of CdTe on its chemical stability. To cover a wide range of parameters, for most of our experiments, we do not only use CdTe-layers from solar modules. Instead, we also process CdTe powders of different grain sizes, and we emulate the influence of solar cell processes on these CdTe powders. Then, the differently prepared samples undergo stability experiments in aqueous solutions with pH-values of pH = 4, 7, and 10. Finally, we are able to explain the dissolution behavior of the CdTe layers not only qualitatively, but also quantitatively: (i) The dissolution of the CdTe-particles is a consequence of the diffusion of the Cd and Te towards the interface between the CdTe particles and the solution. (ii) The higher surface to volume ratio of small particles is responsible for their faster dissolution. (iii) The dissolution follows a dependence on time t according to t0.43. This experimentally observed power law is in line with a pharmaceutical model for spherical particles.

2. Experimental

2.1. Cadmium Telluride (CdTe) Sources

Our leaching experiments are carried out on three different CdTe-powders, commercially available from company Sigma Aldrich [16]. The powders have a purity between 99.99% and 99.9999%. In addition, we compare the results to those obtained from milled module pieces out of the experiments from reference [6]. In total, we perform five different kinds of leaching experiment, using four different sources for the samples:
  • Three sieved CdTe-powders with different maximal grain diameter d:
    (i)
    CdTe250 with d250 ≤ 250 µm, dmean,250 ≈ 4 to 5 µm (see below)
    (ii)
    CdTe840 with d840 ≤ 840 µm, dmean,840 ≈ 9 µm
    (iii)
    CdTe3000 with d3000 ≤ 3000 µm.
  • CdTe3,m pieces from milled modules:
The milled module particles from our reference [6] have a diameter around 200 µm and contain a CdTe layer of 3 µm thickness surrounded by the contacting metals and the glass layers from the front and back glass of the laminated module. After milling, the particles have a mean size dmean,3,m ≈ 1.2 µm (shown below).
The production of the powder involves a subsequent sieving by the manufacturer, therefore only a small amount of particles shows the given maximum sizes d250,max, d840,max, d3000,max. Determination of the powders’ surface by nitrogen adsorption with the Brunauer–Emett–Teller (BET)-method yields the surface area A. For CdTe250, we obtain A250 ≈ 0.22 m2/g. From this value and assuming a spherical shape, we derive the above given mean particle diameter dmean,250 ≈ 4.6 µm compared to d250,max ≈ 250 µm. In contrast, for CdTe840 we obtain A840 ≈ 0.11 m2/g with a mean particle diameter dmean,840 ≈ 9 µm compared to d840,max ≈ 840 µm. Thus, for the same mass of CdTe, the relative diameter rdiameter = 9 µm/4.6 µm of the directly measured (with BET) surface areas amounts to about rdiameter ≈ 2. If we calculate the diameter ratio only from the largest grains (840 vs. 250 µm), the relative ratio rgrain is rgrain = 840 µm/250 µm = 3.4.
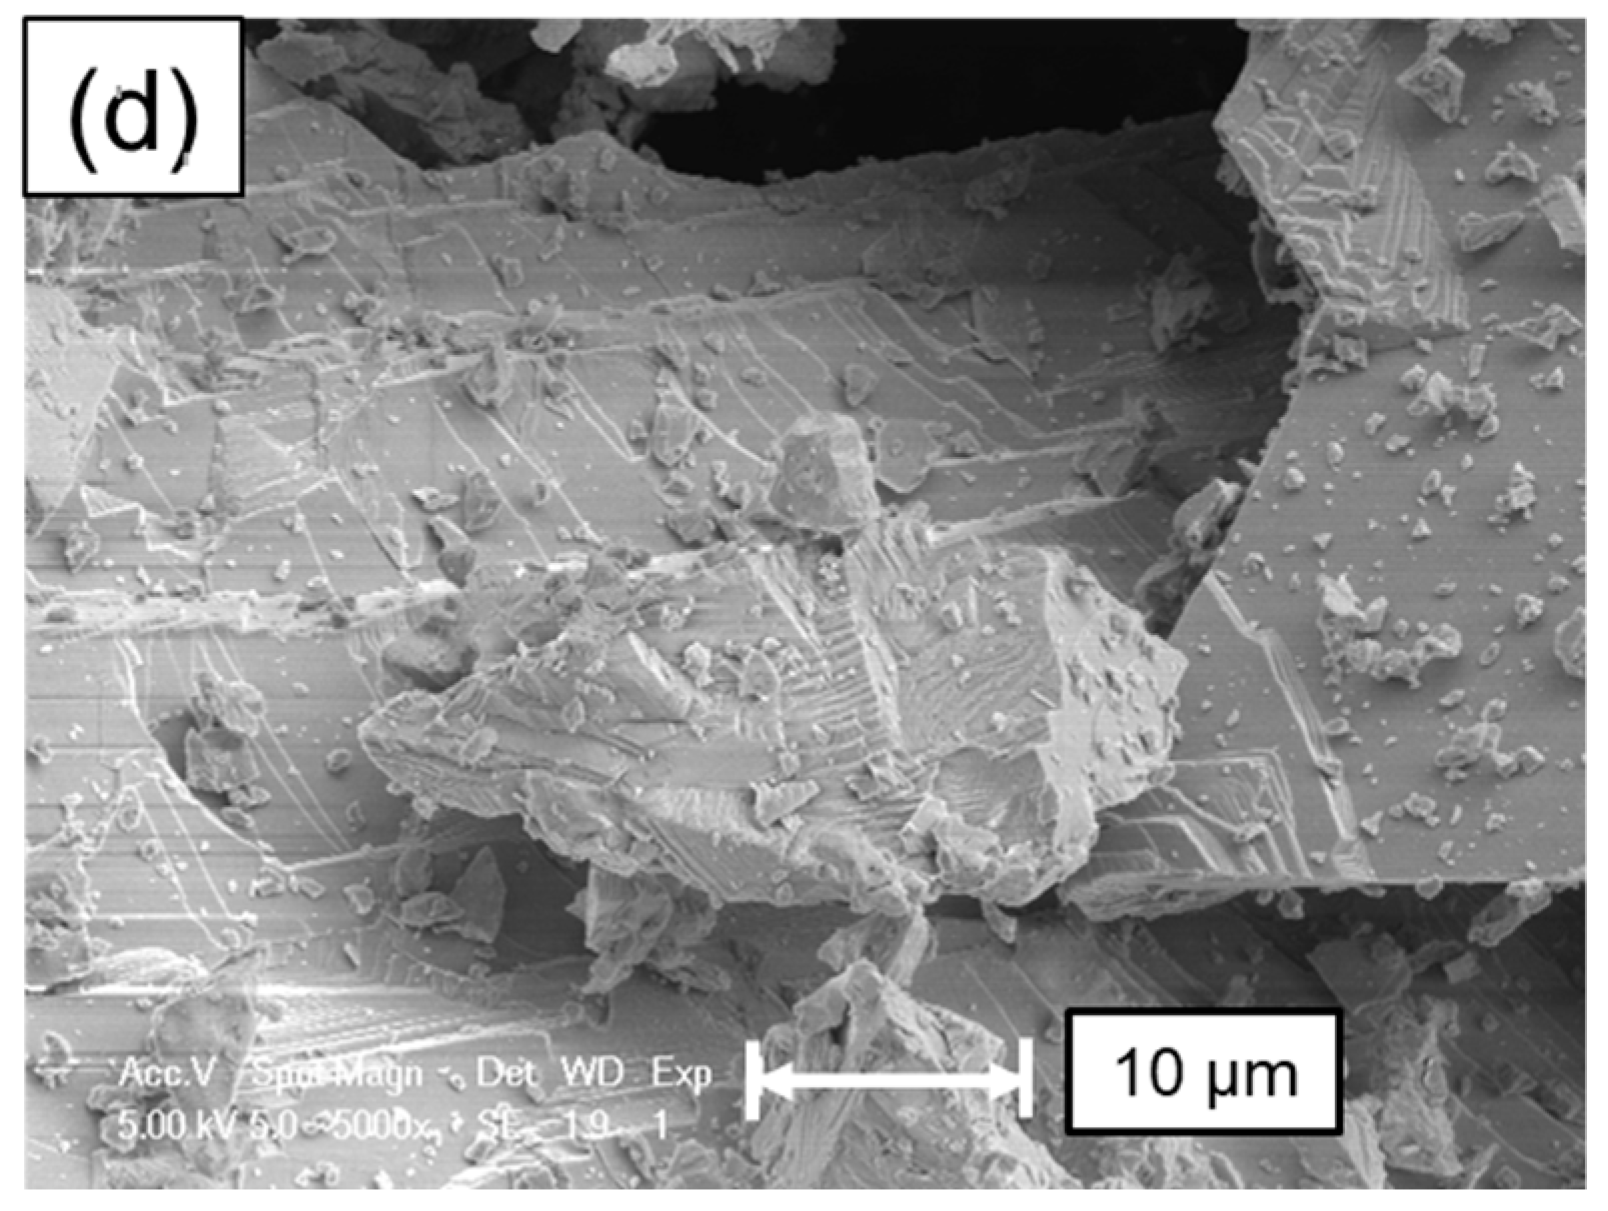
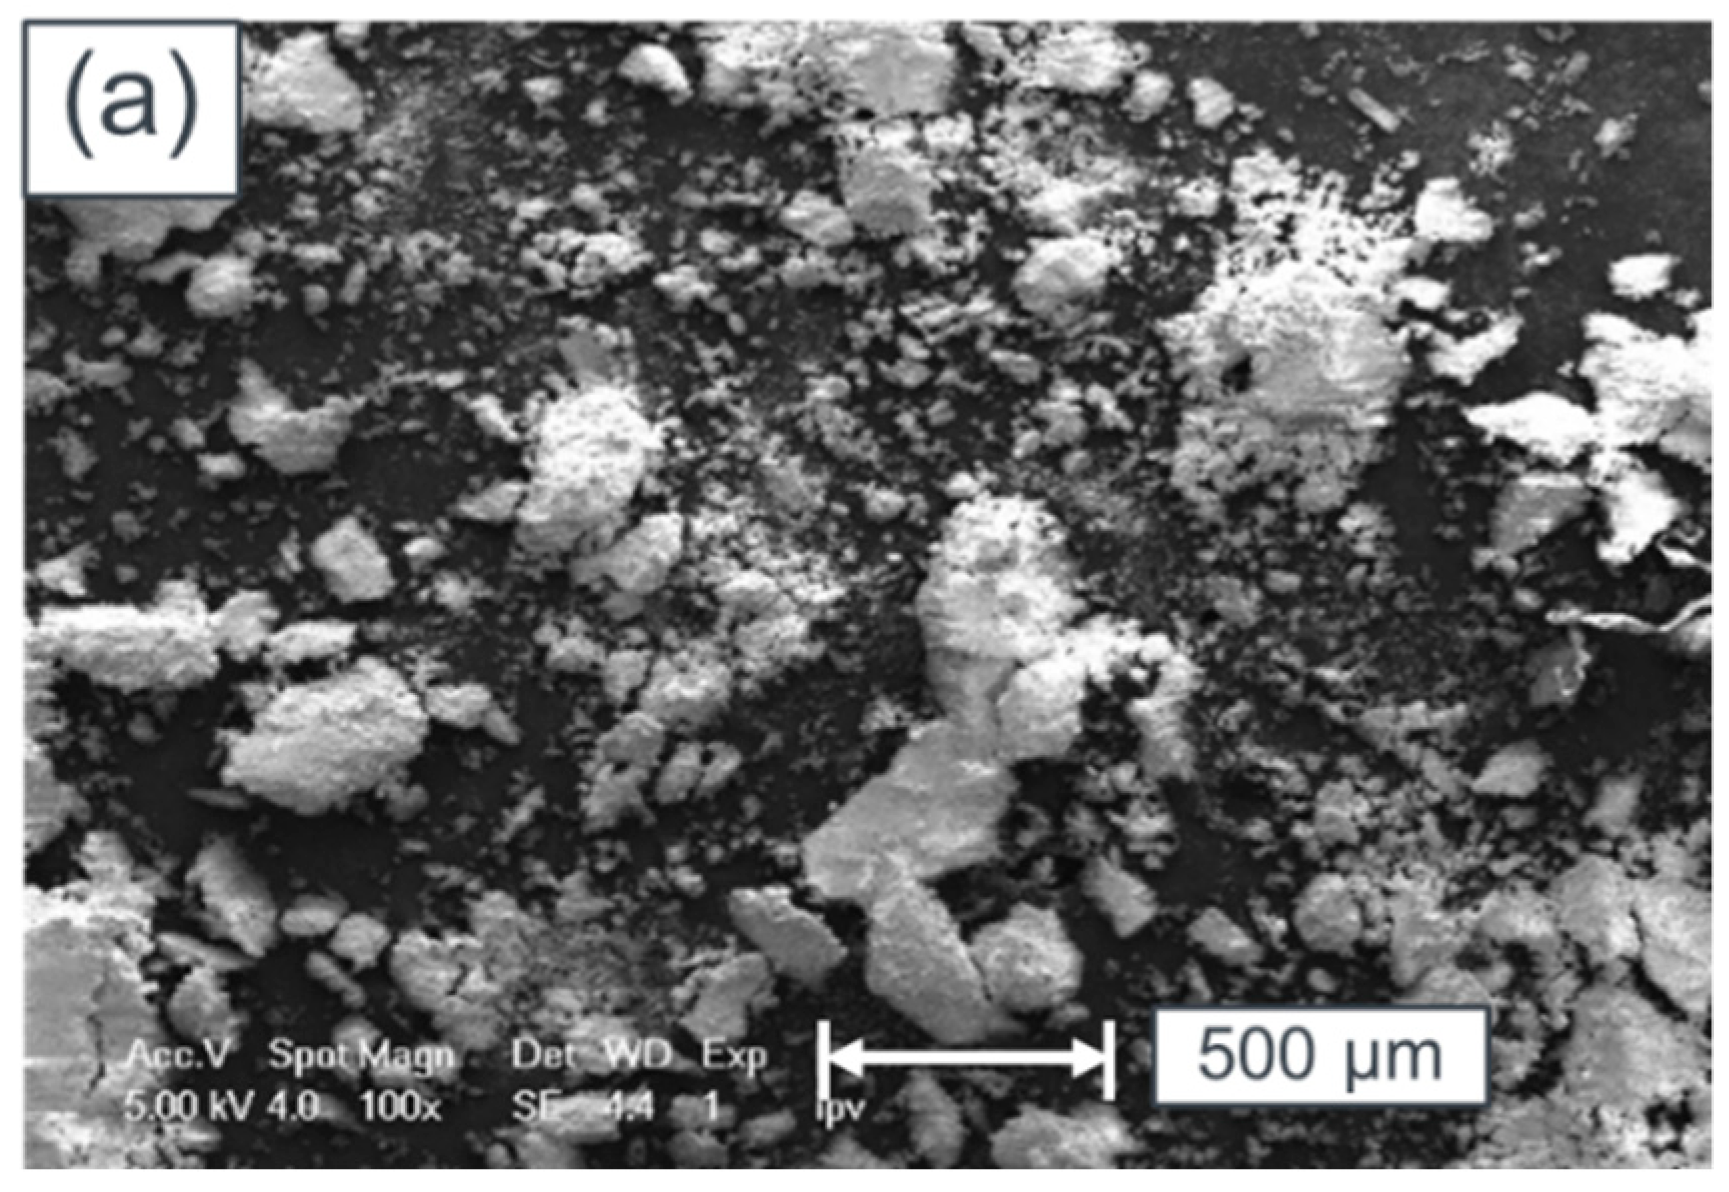
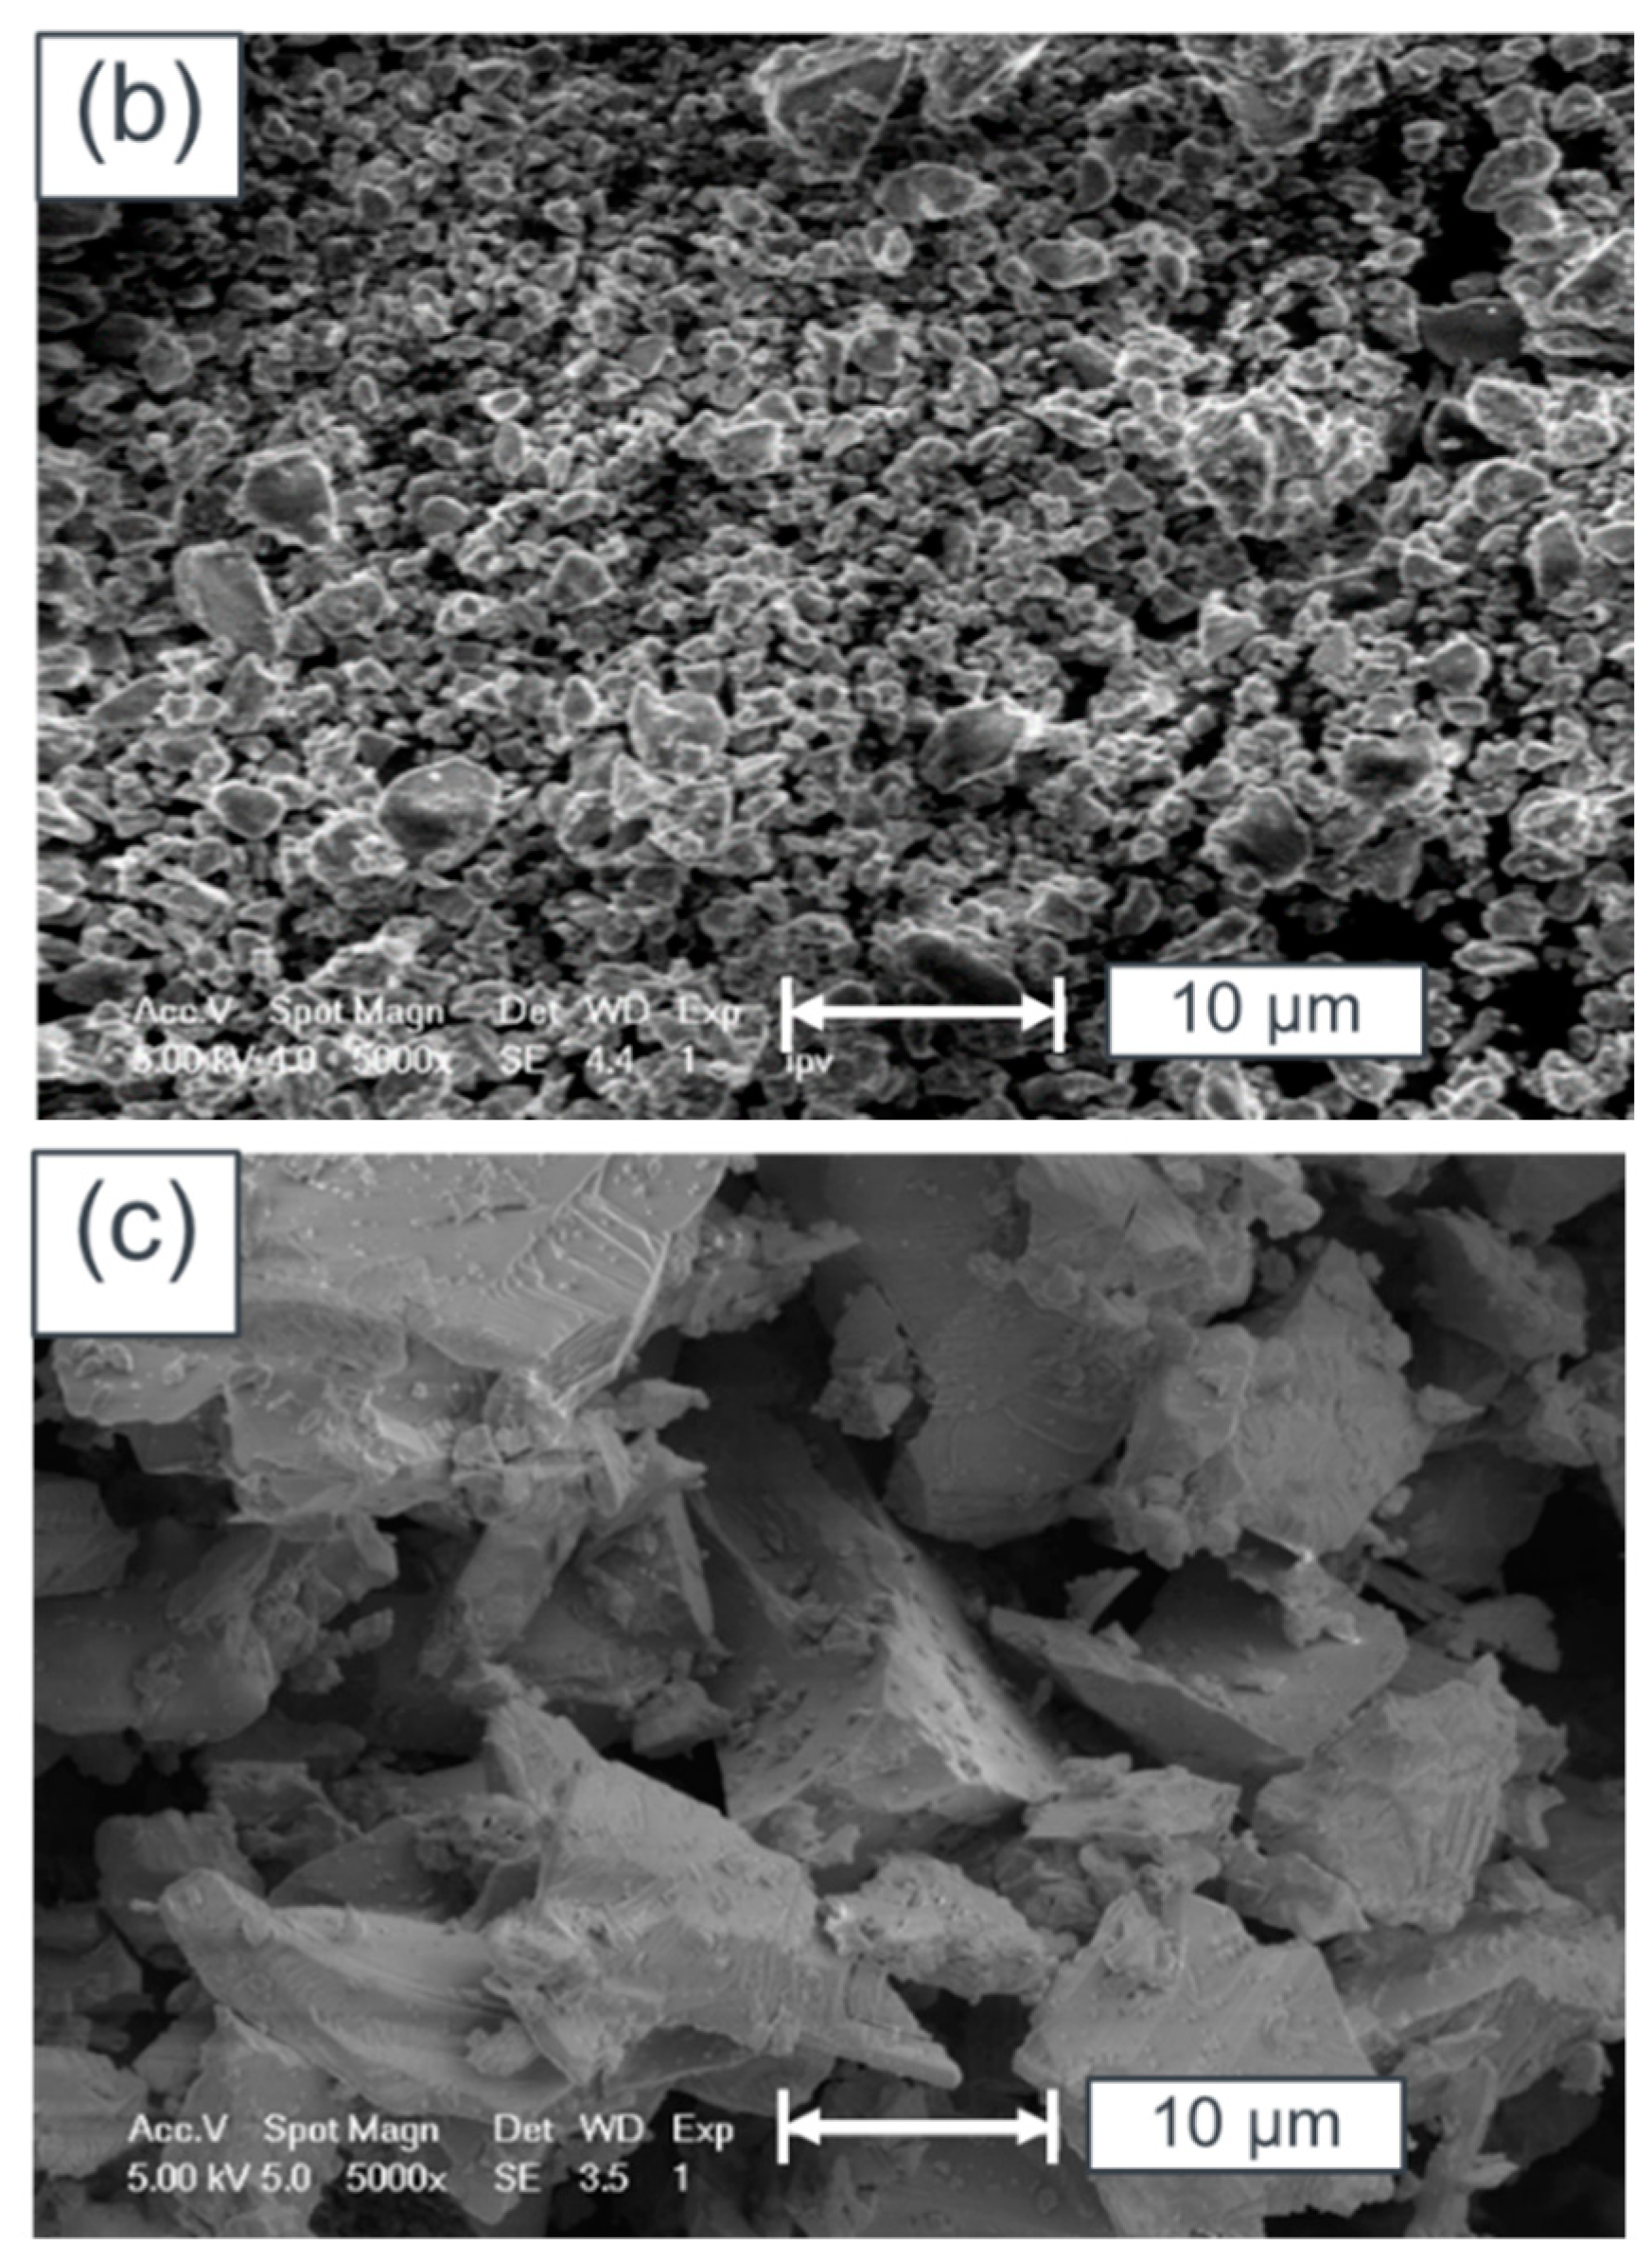
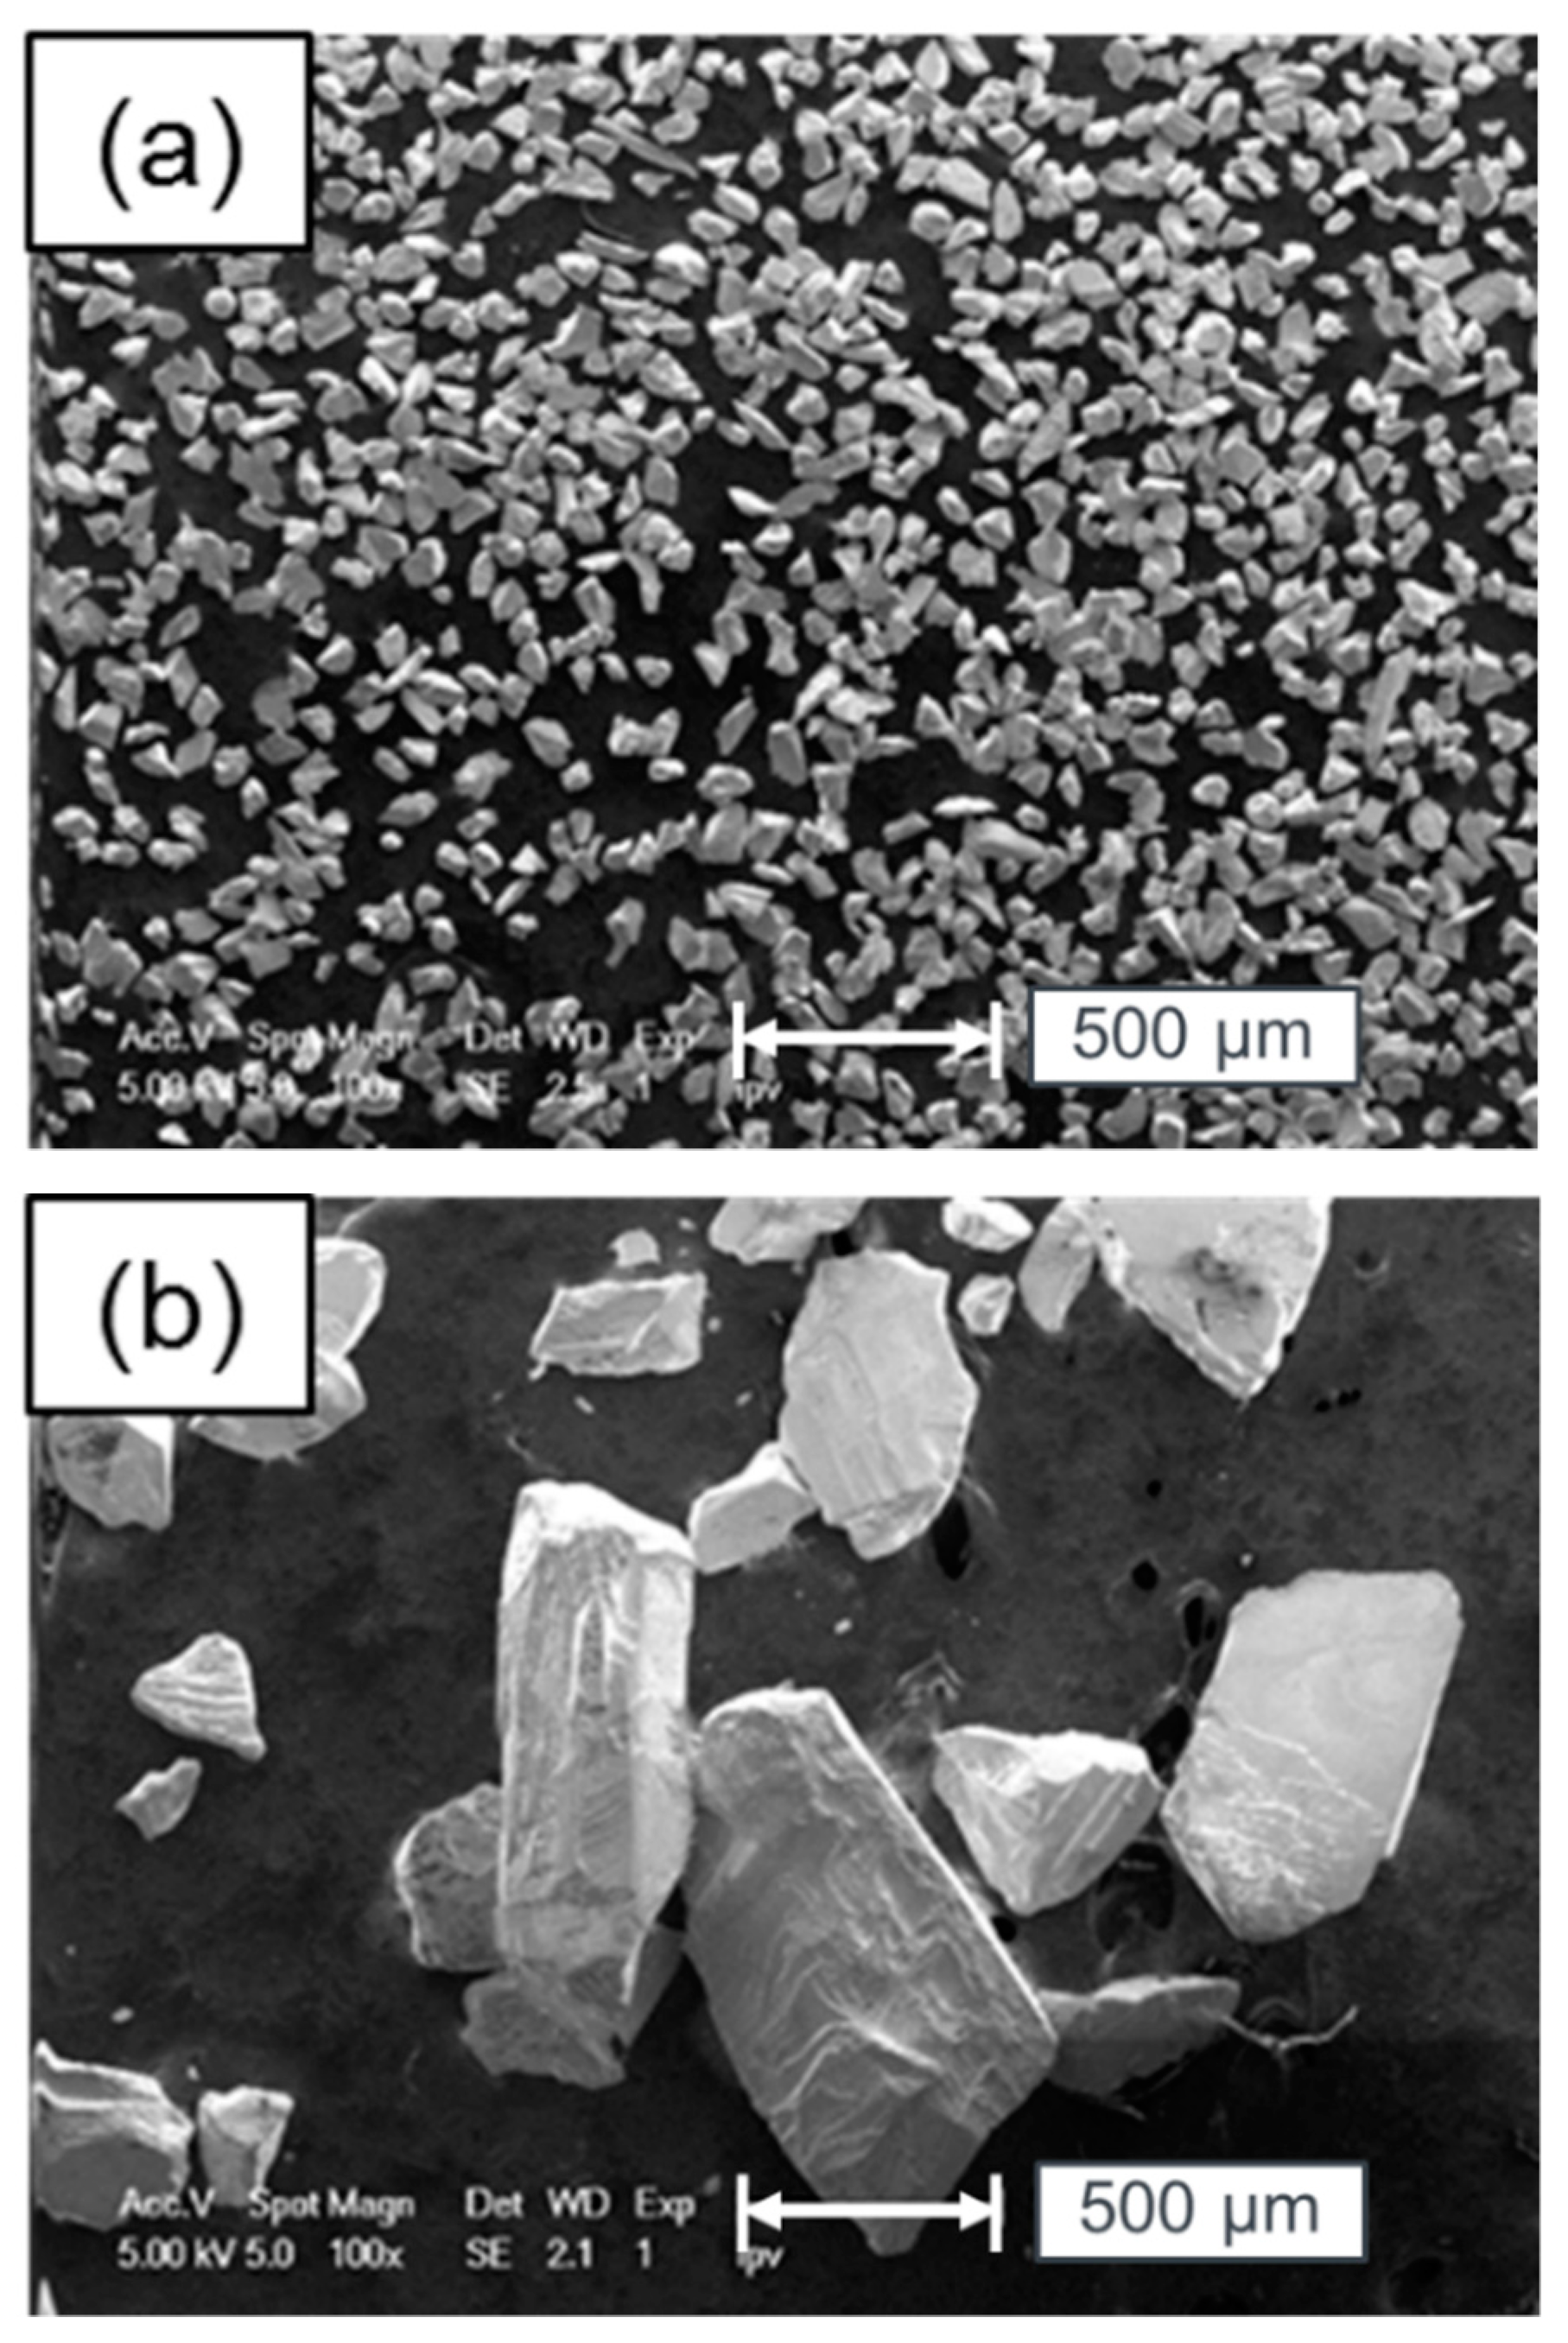
Figure 1a,b show micrographs taken with a Philips XL30 SFEG scanning electron microscope (SEM) from the as received CdTe powders. Figure 1a shows CdTe250 with the maximum particle size d250,max ≈ 250 µm, whereas Figure 1b exhibits maximal sizes d840,max ≈ 840 µm for the CdTe840 powder. Higher-resolution measurements with the SEM in Figure 1c for CdTe250 and in Figure 1d for CdTe840 indicate even smaller grain sizes than 1 µm for the sieved powder. The mean sizes dmean,250 ≈ 4.6 µm and dmean,840 ≈ 9 µm from the BET measurements roughly correspond with the SEM data for these powders.
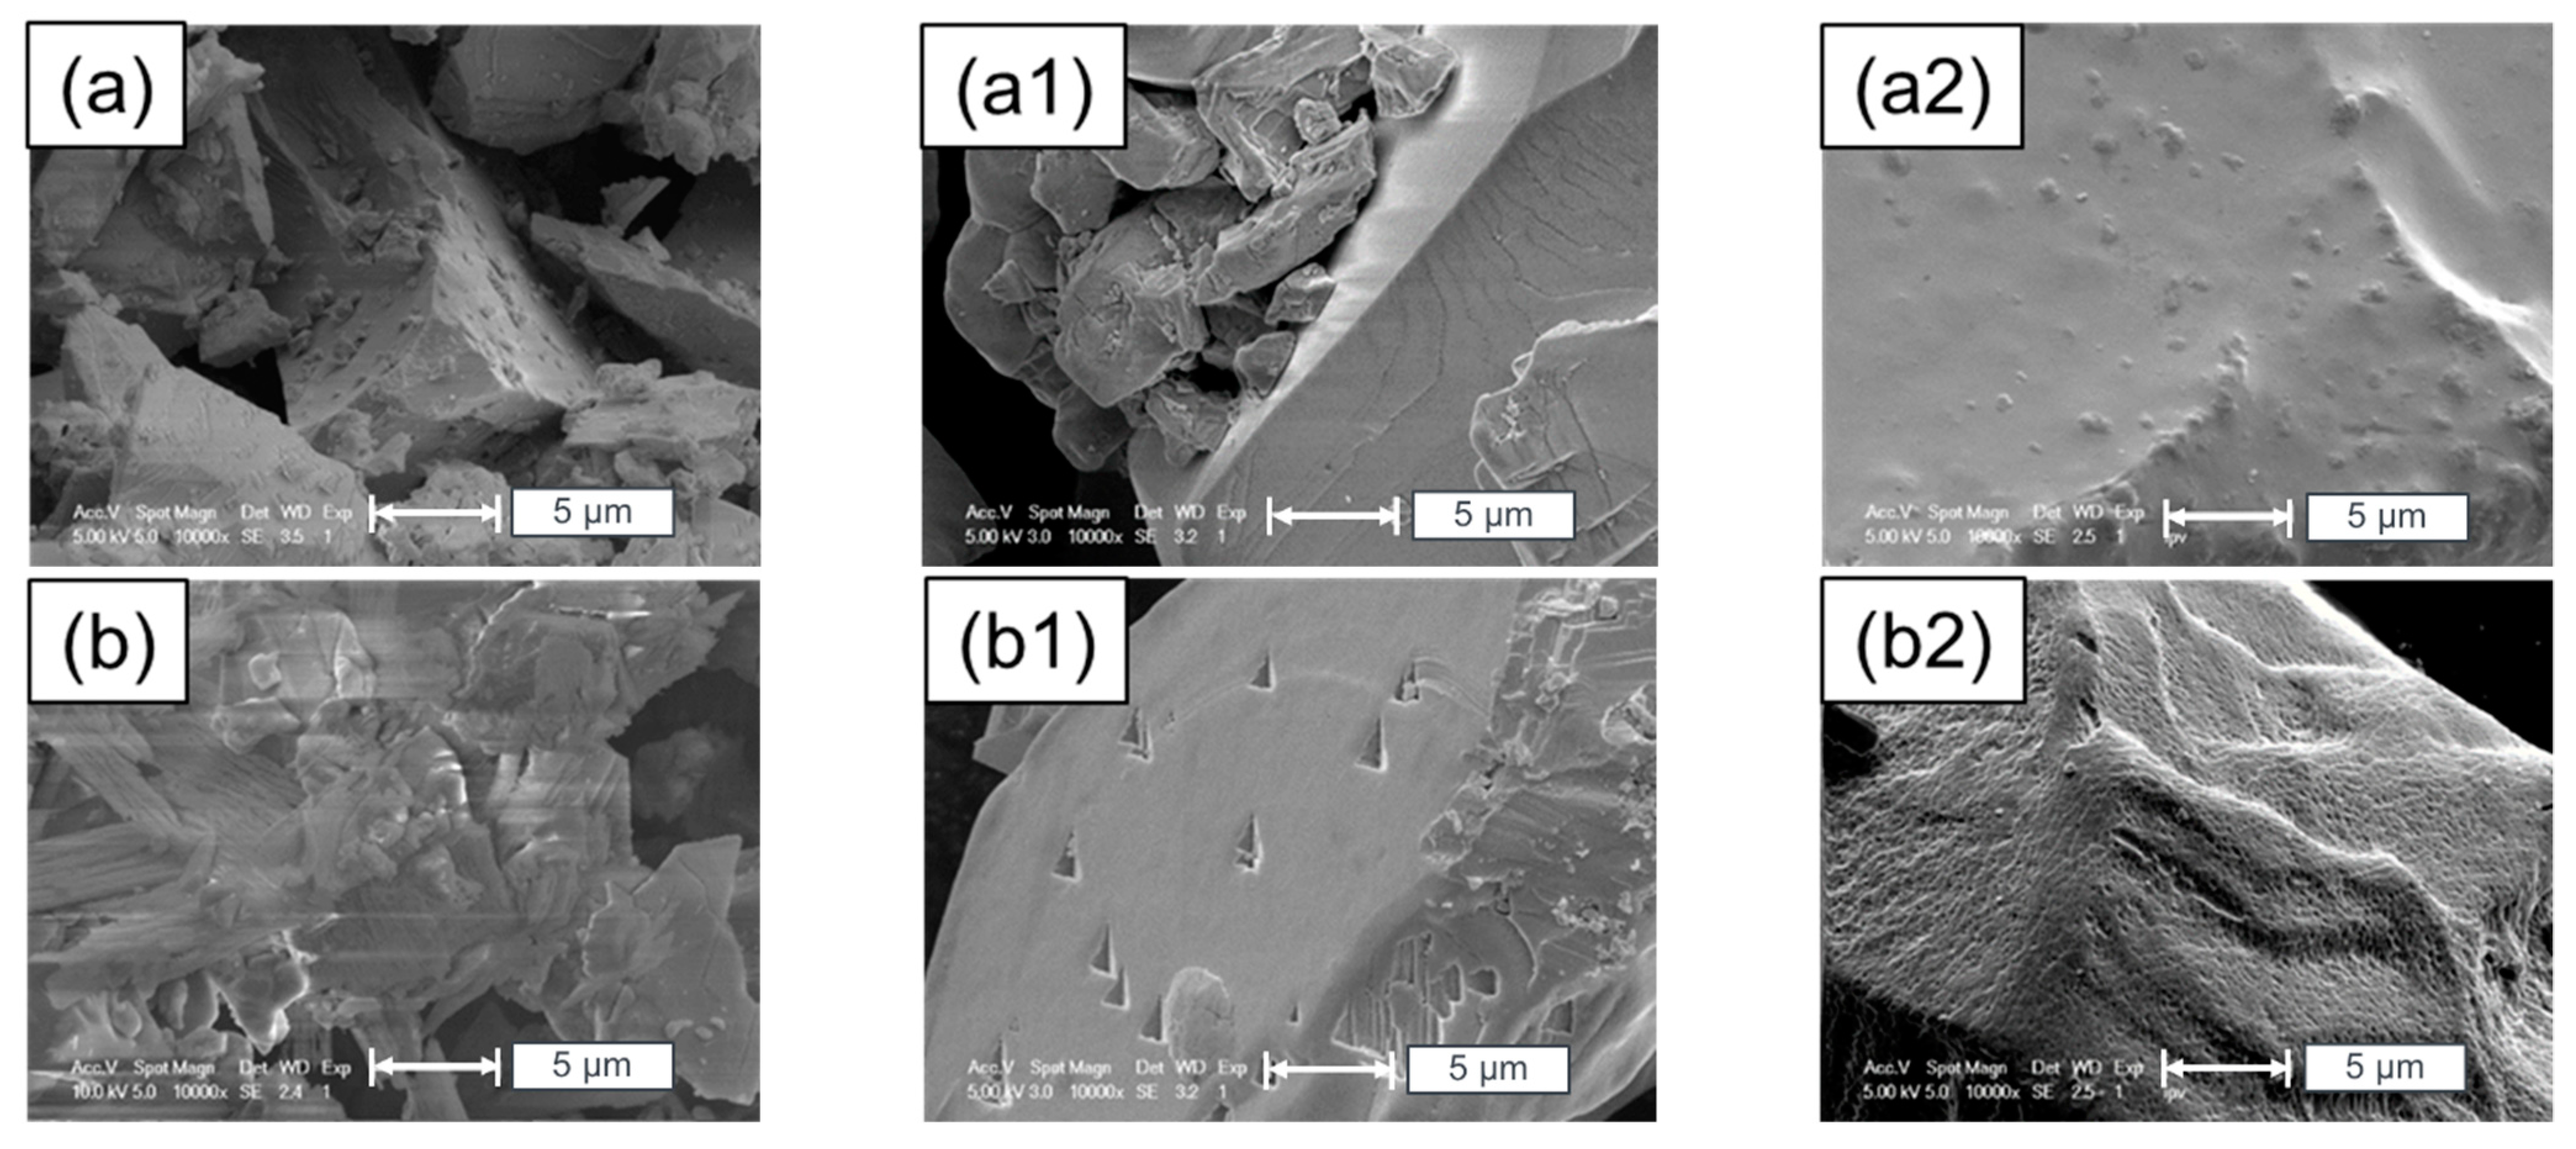
Figure 2a,b show micrographs of module pieces which were milled according to the recipes of reference [6]. If one compares Figure 2a with Figure 1a,b it seems that the milled module pieces have approximately the same particle size as the CdTe powders. However, measurements on a higher resolution scale indicate a much smaller particle size for the milled module pieces: From Figure 2b we derive a mean particle size dmean,3,m ≈ 1 µm compared to the much larger particle diameter of the CdTe250 powder from Figure 2c. For the CdTe3000 powder, from microscope pictures, we estimate a mean particle size around dmean,3000 200 µm. For further consideration of a size dependent elution we take the mean particle sizes into account.
Therefore, if we take the mean particle sizes of the CdTe250 powder as a reference (we have most leaching data for those films), the ratio of the mean particle size behaves as:
dmean,3,m : dmean,250 : dmean,840 : dmean,,3000 ≈ 1 µm : 4.5 µm : 9 µm : 200 µm = 0.2 : 1 : 2 : 50
Thus, if we take the CdTe250 powder as a reference, and assume that the etched mass C of CdTe in the solution is proportional to the relative ratio of the particles’ surface/volume ratio, i.e., to what we expect to be the concentrations C1/dmean, it roughly holds that:
C3,m : C250 : C840 : C3000 ≈ 5 : 1 : 0.5 : 0.02
for the eluted mass C3,m from the milled module pieces, C250 from the CdTe250 powder, C840 from the CdTe840 powder, and C3000 from the CdTe3000 powder. Here, for example, the C3,m is an abbreviation, standing for C3,m,Cd (the relative eluted mass of Cd) as well as for C3,m,Te (the concentration of Te) in the eluting liquid.

2.2. Samples for Leaching Experiments

We use five different kinds of sample for the leaching experiments:
  • The untreated CdTe-powders from Sigma Aldrich as described in Section 2.1.
  • Solar-cell-like activated CdTe-powder CdTeact as described in Section 2.3.
  • Solar-cell-like etched CdTe-powder CdTeetch as described in Section 2.3.
  • Solar-cell-like activated and etched CdTe-powder CdTeact+etch as described in Section 2.3.
  • The milled module pieces CdTe3,m as described in Section 2.1.
The activated and/or etched CdTe powders undergo “solar-cell-like” processes that are similar to those used in the production of CdTe solar modules, as described below.

2.3. Solar-Cell-Like Processing

During the production process of the solar module, the surface of the CdTe powder is modified by two steps, which improve the cells’ efficiency [10,13]:
  • “Activation” [10,13,14]; and
  • “Etching” [15].
Activation: The fabrication of the cells (in a superstrate configuration) starts with the deposition of a transparent conductive oxide (TCO) on a glass substrate, followed by depositing an n-type cadmium sulfide (CdS) layer. Then the activation occurs in the cell processes: after deposition of p-type CdTe on the CdS, an activation with cadmium chloride (CdCl2) via an annealing step increases the grain size of the CdTe and CdS and, therefore, the efficiency. [12] Interdiffusion of Te and S at the CdTe/CdS interface could also be found [14].
Etching: Then, before the deposition of molybdenum for the ohmic back contact, the surface of the low doped p-type CdTe, undergoes etching by a nitric-phosphoric acid mixture (N-P etch). This etching process creates a phosphorus rich and a Te enriched layer [15]. Soluble Cd compounds are removed leaving insoluble Te compounds on the surface. Moreover, a Te cap on the individual grains due to etching enlarges the contact area and thus lowers the contact resistance between the Mo metal and the CdTe layer [10]. The N-P etch etches primarily at grain boundaries. This effect leads to an elemental layer of Te with a thickness of 8 nm leaving Cd on top with a concentration of 10% [12,17].

2.3.1. Activated CdTe Powder CdTeact

Our experiments on the small sized CdTe-powder with d250 ≤ 250 µm simulate the “activation step” in the preparation of CdTe layers for solar modules. Following the processes of references [18,19,20] we use a chloride treatment and subsequent annealing: The CdCl2 treatment is done in methanol which contains dissolved CdCl2-powder. The activation of CdTe depends on the ratio of CdTe to CdCl2: with a given CdTe thickness dCdTe = 4 µm the optimal thickness of the CdCl2-layer should be dCdCl = 0.35 µm [18,19]. For activation of the powder we use the ratio of thicknesses as a ratio for the mass ratio CdTe:CdCl2 = 1:0.057 with a mass density of 6.20 g/cm3 for CdTe and 4.047 g/cm3 for CdCl2. The CdCl2-powder dissolves in methanol with a maximum solubility of 1.5 g CdCl2 in 100 mL methanol [20]. We stay below this value and dissolve the mass mCdCl2 = 0.286 g of CdCl2 in the mass mMeth = 28.6 g of methanol within a time tusb = 45 min by using an ultrasonic bath. Then, CdTe of mass mCdTe = 5 g is suspended in the CdCl2/methanol mixture in the mass ratio CdTe:CdCl2 = 1:0.057. Thereafter, in order to prepare the powder for the activation step, a rotary evaporator evaporates the methanol at a temperature Trot = 40 °C and a pressure prot = 200 mbar. Afterwards, freeze drying removes the possible remaining methanol. Finally, we perform the annealing in order to support grain growth by the activation. We anneal the CdTe/CdCl2-powder for a time tsb = 30 min in a sand bath with a sand temperature Tsand = 360 °C. These parameters also follow the processes described in references [18,20]. The excess CdCl2 which might deposit on the surface of the CdTe powder is not rinsed after heat treatment to see the effect of change in the surface of CdTe.

2.3.2. Etched CdTe Powder CdTeetch

We also simulate the wet chemical etching for oxide removal and formation of a Te-rich surface as done on CdTe in solar cell fabrication. For that purpose, following reference [10], we use a mixture of 65% nitric acid (HNO3) and 85% phosphoric acid (H3PO4) (NP-etch) in the volume ratios HNO3:H3PO4:DI-water = 1:70:29 for a time tetch = 60 s. Then, a paper filter separates the etched CdTeetch from the acid, followed by rinsing with water for a time trinse = 10 min in order to remove remaining acid. Freeze-drying instead of annealing makes sure that the etched CdTe powder does not oxidize [21].

2.3.3. Activated and Etched CdTe Powder CdTeact+etch

This preparation uses first step A, then step B.

2.4. Leaching Solutions and Sampling

The leaching experiments are carried out at room temperature. To test the chemical stability of the differently prepared CdTe powders, we use the following three buffered aqueous solutions:
(a)
pH4: 3.9 g citric acid with 4.5 g disodium hydrogen phosphate in 1000 mL deionized water.
(b)
pH7: 1.2 g citric acid with 9.6 g disodium hydrogen phosphate in 1000 mL deionized water.
(c)
pH10: 2.0 g sodium hydroxide in 1000 mL deionized water.
For the leaching experiments, 100 mg CdTe-powder (either in the unprocessed or in the solar-cell-like processed state) is put in bottles with 100 mL of aqueous solution, which corresponds to a concentration of 1 g/L. Bottles are made out of low-density polyethylene (LDPE) to ensure that there is no reaction of the solutions with the material, especially in acidic solutions. To make sure that the pH value remains constant, we use buffered solutions. The buffered solutions stabilize the pH values during the experiments, while the pH value is monitored on a regular basis.
The bottles with the aqueous solutions and the different CdTe powders are shaken overhead for several weeks at room temperature. To exclude a photochemical reaction during the experiments, the bottles are packed in cartons, which are impervious to light. For the analysis of leached elements, we periodically take samples from the solutions. The volume and composition of the leaching solution is corrected by the amount of solution and leached elements, which are removed during sampling. Inductively coupled plasma mass spectroscopy (ICP-MS) analyzes the amount of leached substances. The measurement uncertainty is around ±10%. All leaching experiments are carried out in triplicate, thus each one of our data points represents the mean value of three experiments.
Our pH values are representative for pHs that could occur in the environment whether in rain, ground water or within waste disposal sites—from the acidic pH4 to the alkaline pH10. In comparison, the pH values of rainwater and landfills differ with location and conditions: In Brazil, the pH of rain water ranges within 4.2 < pH < 6.1 [22], whereas in Germany it ranges within 4.1 < pH < 5.3 [23]. Depending on the classification of waste, landfills in Germany range within 3.4 < pH < 11.9 [24], i.e., from strongly acidic to strongly alkaline. In contrast, seawater with 7.5 < pH < 8.5 [25], covers a relatively narrow pH range, more in the range of neutral water with pH7. Mineralized water also, depending on its origin, varies in the range 4.9 < pH < 8.4 [26]. The solubility of almost all elements in aqueous solutions strongly depends on the pH of the solution. Our experiments aim at the quantification of this pH dependency. Thus, e.g., the experiments at pH4 and pH7, allow us to conclude about the behavior at pH values in between.

3. Leaching Results

Here, we show the results of the leaching of CdTe powder as well as of the milled module pieces in aqueous solutions with the three different pH. The pH value of the eluted milled module pieces (but not for the powders) varied because of non-buffered solutions (only for the milled module pieces) with ΔpH ≈ 2 [6]. The data for the eluted Cd and Te are presented as concentration in relation to their total mass (i.e., the 100 % value) contained in the prepared CdTe powder/module pieces before the leaching experiments. The leaching lasts up to a time t = 83 days, partly also to t = 56 days. Due to our measurements with ICP-MS, we only obtain the amounts of elements which are dissolved in the solutions; precipitates in the solution are not measured by the ICP-MS.

3.1. Leaching of Untreated CdTe Powder with Different Grain Sizes in pH4

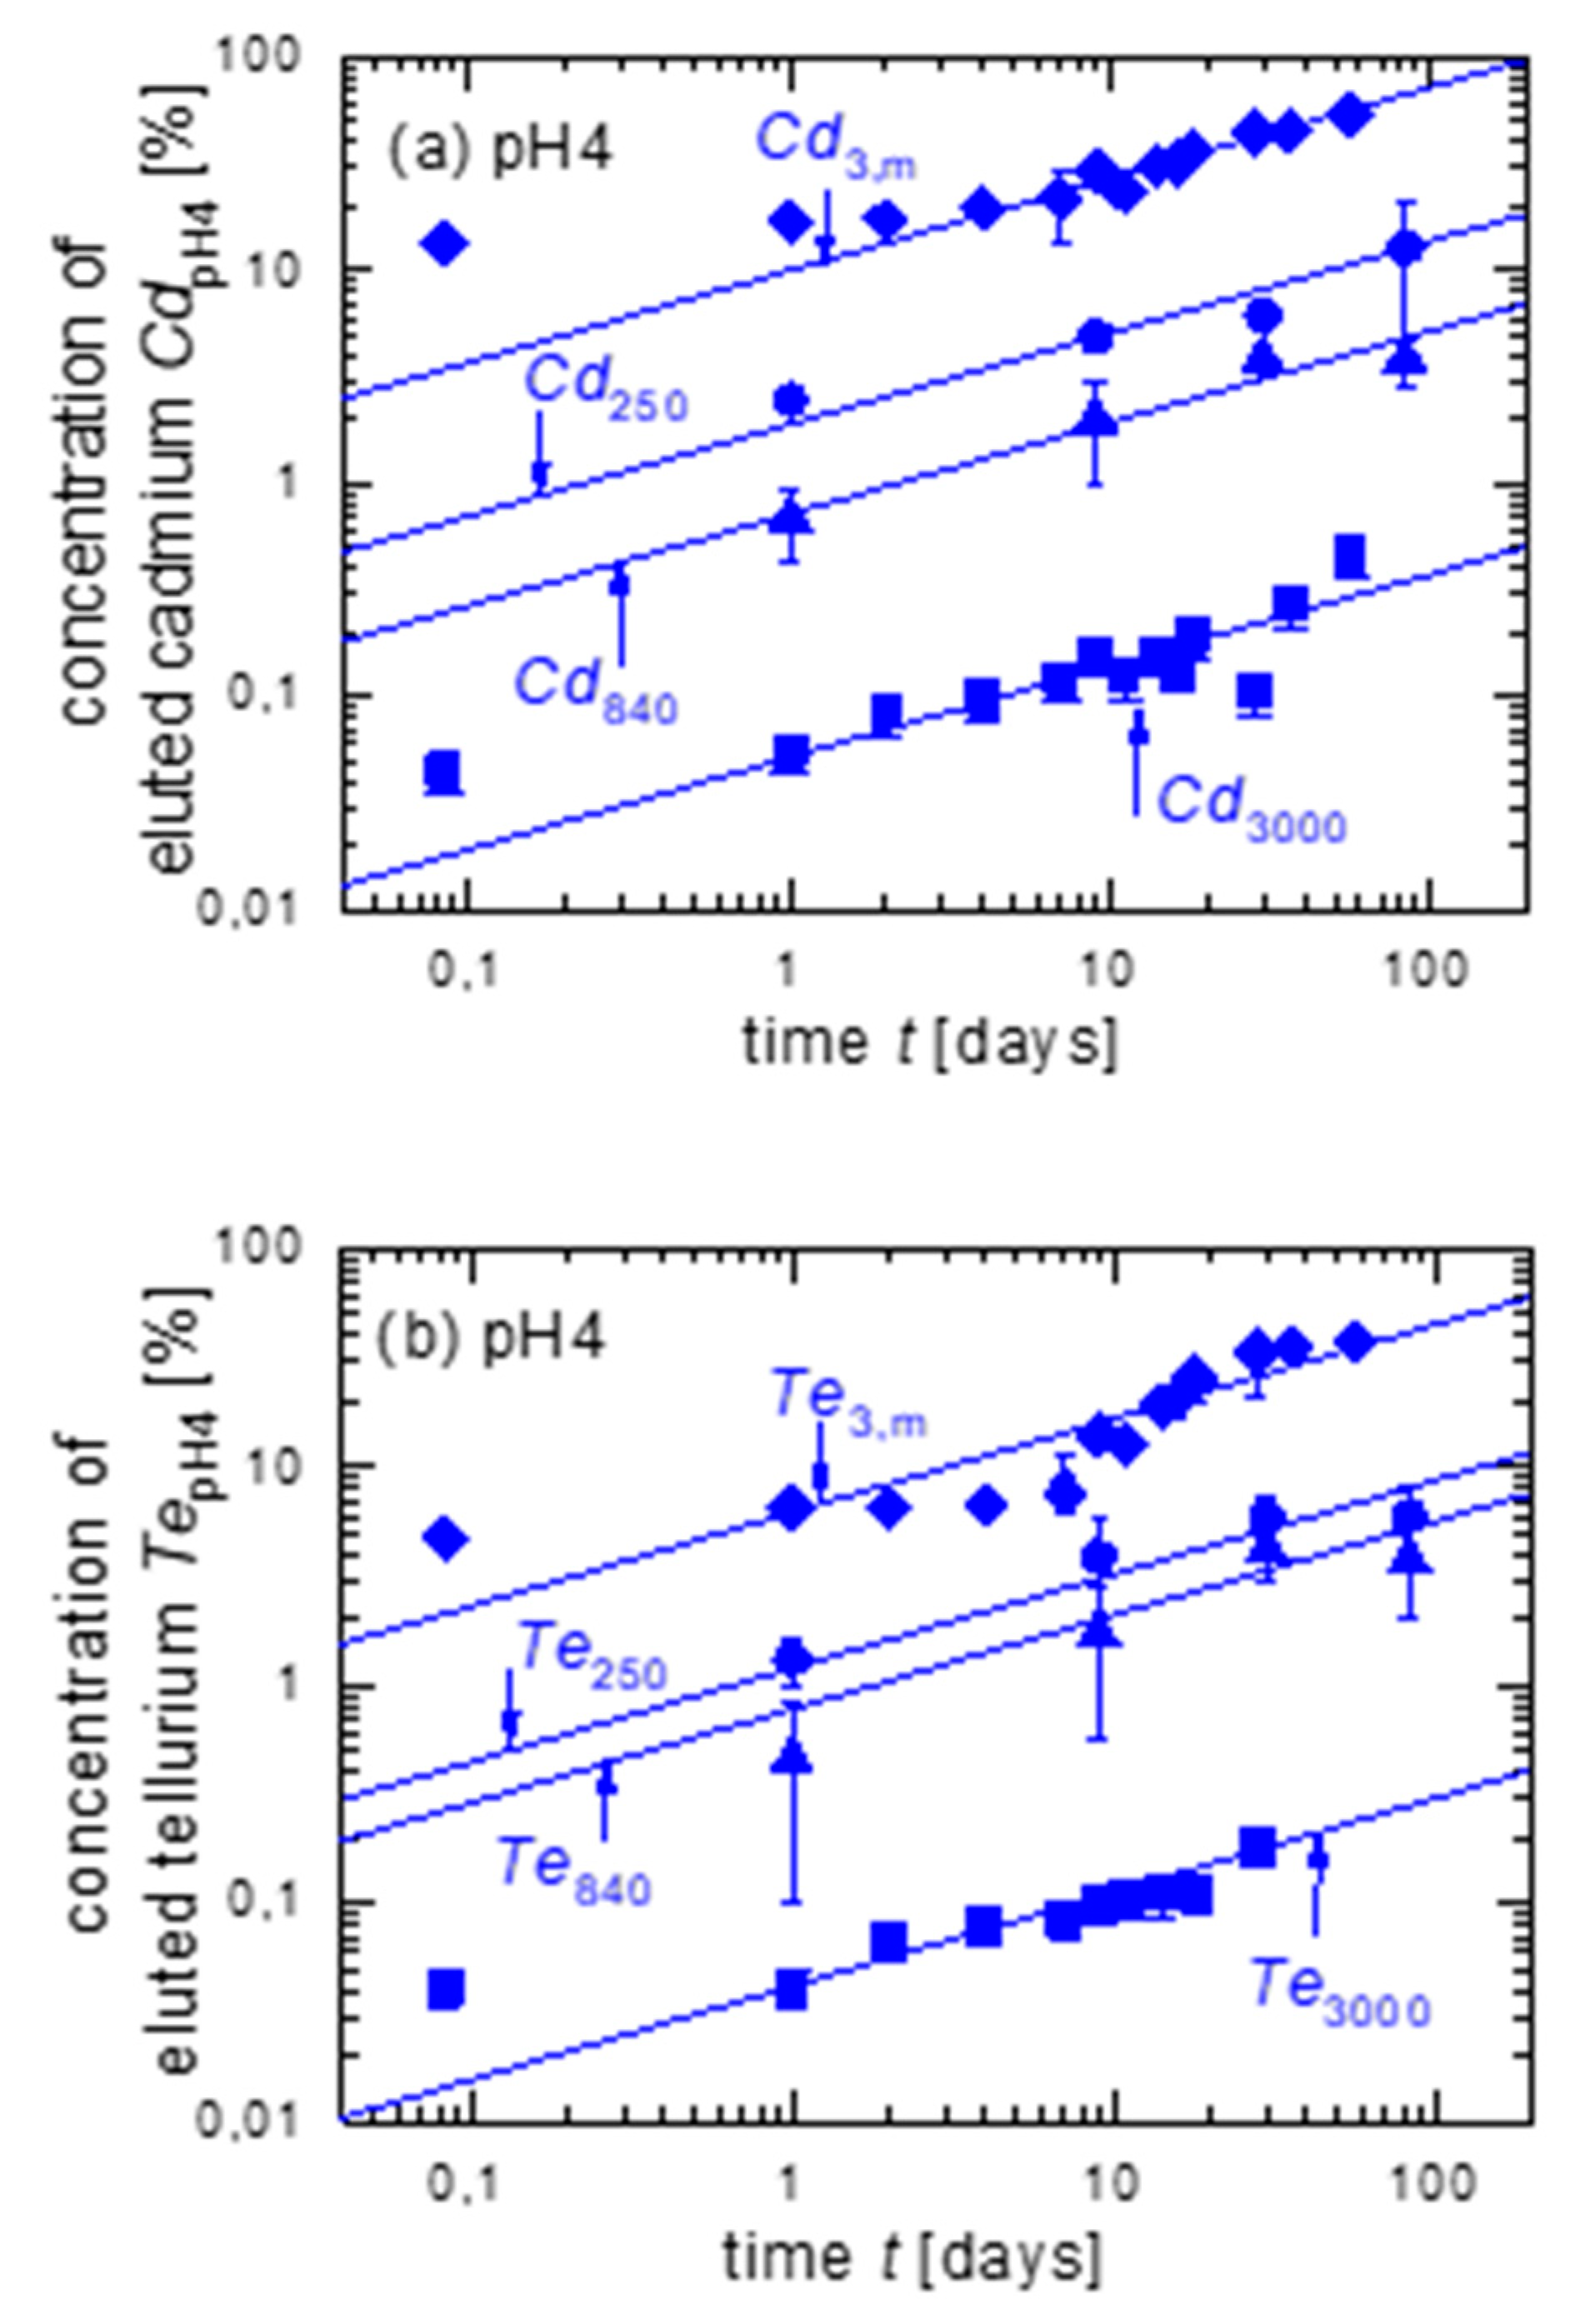
Figure 3a,b show that Cd and Te eluted out of CdTe samples follow a dependence on time t with a power law tn, with n = 0.43, as discussed below. In addition, we observe a strong dependence of leaching on the particle size of the CdTe-powder: the smaller the particle diameter, the higher the elution rate. The highest elution rates are obtained for the milled module pieces. The maximum of the y-axis in Figure 3a,b, Figure 4a,b and Figure 5a,b is C = 100%.
Figure 3a presents detailed data about the release of Cd, termed as CdpH4, when Cd is leached out from CdTe powder in and with the solution of pH4. The weakest elution is found for the powder CdTe3000 with grain diameters d3000 ≤ 3000 µm: After t = 56 d, less than 1% of the Cd contained in the original powder is found to be dissolved in the leaching solution, i.e., Cd3000 (t = 56 d) < 1%. For the powder CdTe840, the elution of Cd840 is one order of magnitude higher, while eluted Cd250 from CdTe250 reaches Cd250 (t = 83 d) > 10%. In addition to the data for the three different CdTe powders with different maximum grain sizes, Figure 3a also contains leaching results, which we obtain from the milled CdTe module pieces with a thickness dCdTe ≈ 3 µm [6]. These data are termed Cd3,m in Figure 3a. The data for the milled module pieces closely match the data of the CdTe powders: the instability of the compound CdTe increases with smaller grain sizes. For the leached out concentrations, it clearly holds that Cd3000 < Cd840 < Cd250 < Cd3,m.
Figure 3b presents the data for the elution of TepH4 out of CdTe powder; in addition, we also show data for the elution of Te from the milled module pieces [6]. Again, as for the Cd elution, we find not only the same power law dependence t0.43 for the elution, but also Te3000 < Te840 < Te250 < Te3,m for the elution of the Te.

3.2. Leaching of Untreated CdTe Powder with Different Grain Sizes in pH7

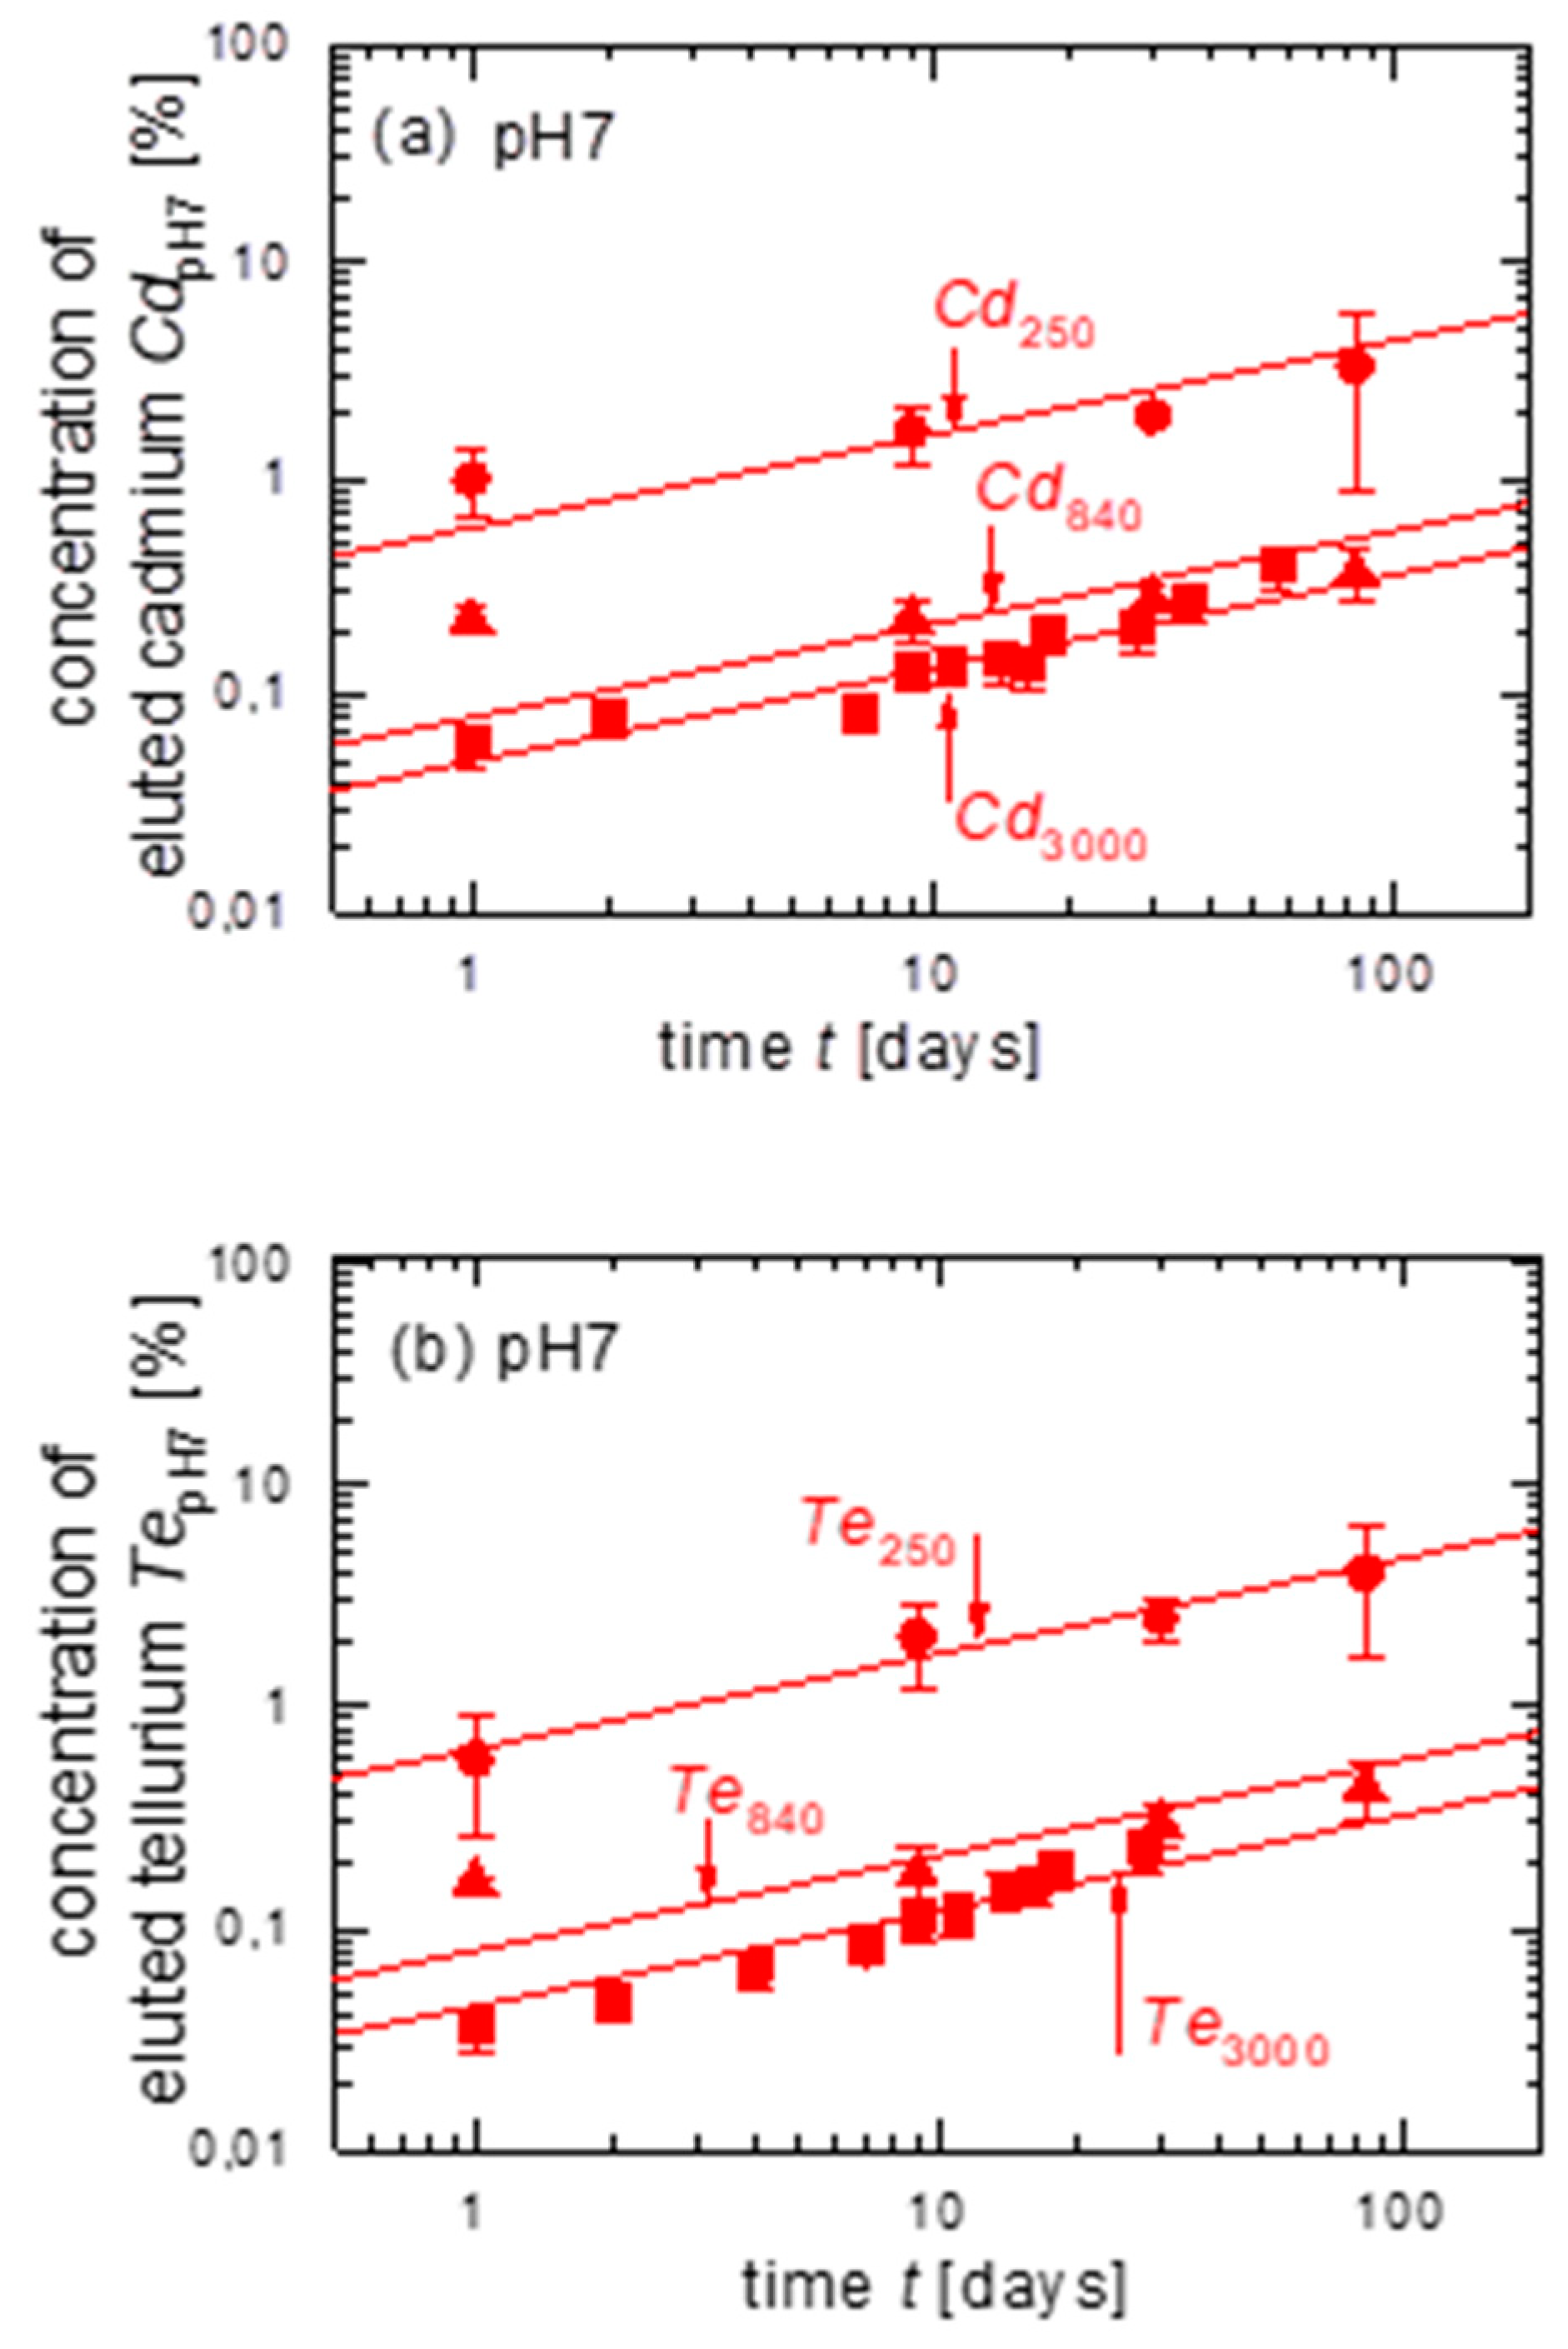
Figure 4a,b present our data for the elution of CdTe powder in aqueous solutions with pH7. Clearly, the total values for the elution of Cd as well as of Te are lower than those in pH4 (compare Fissure 3a,b). Nevertheless, we find the same time dependence for both Cd and Te; their eluted amount increases with t0.43. The elution out of Cd840 and Cd3000 show small narrow differences. We observe Cd3000Cd840 < Cd250 as well as Te3000 ≈ Te840 < Te250. Unfortunately, no elution values of milled CdTe modules exist for pH7.

3.3. Leaching of Untreated CdTe Powder with Different Grain Sizes in pH10

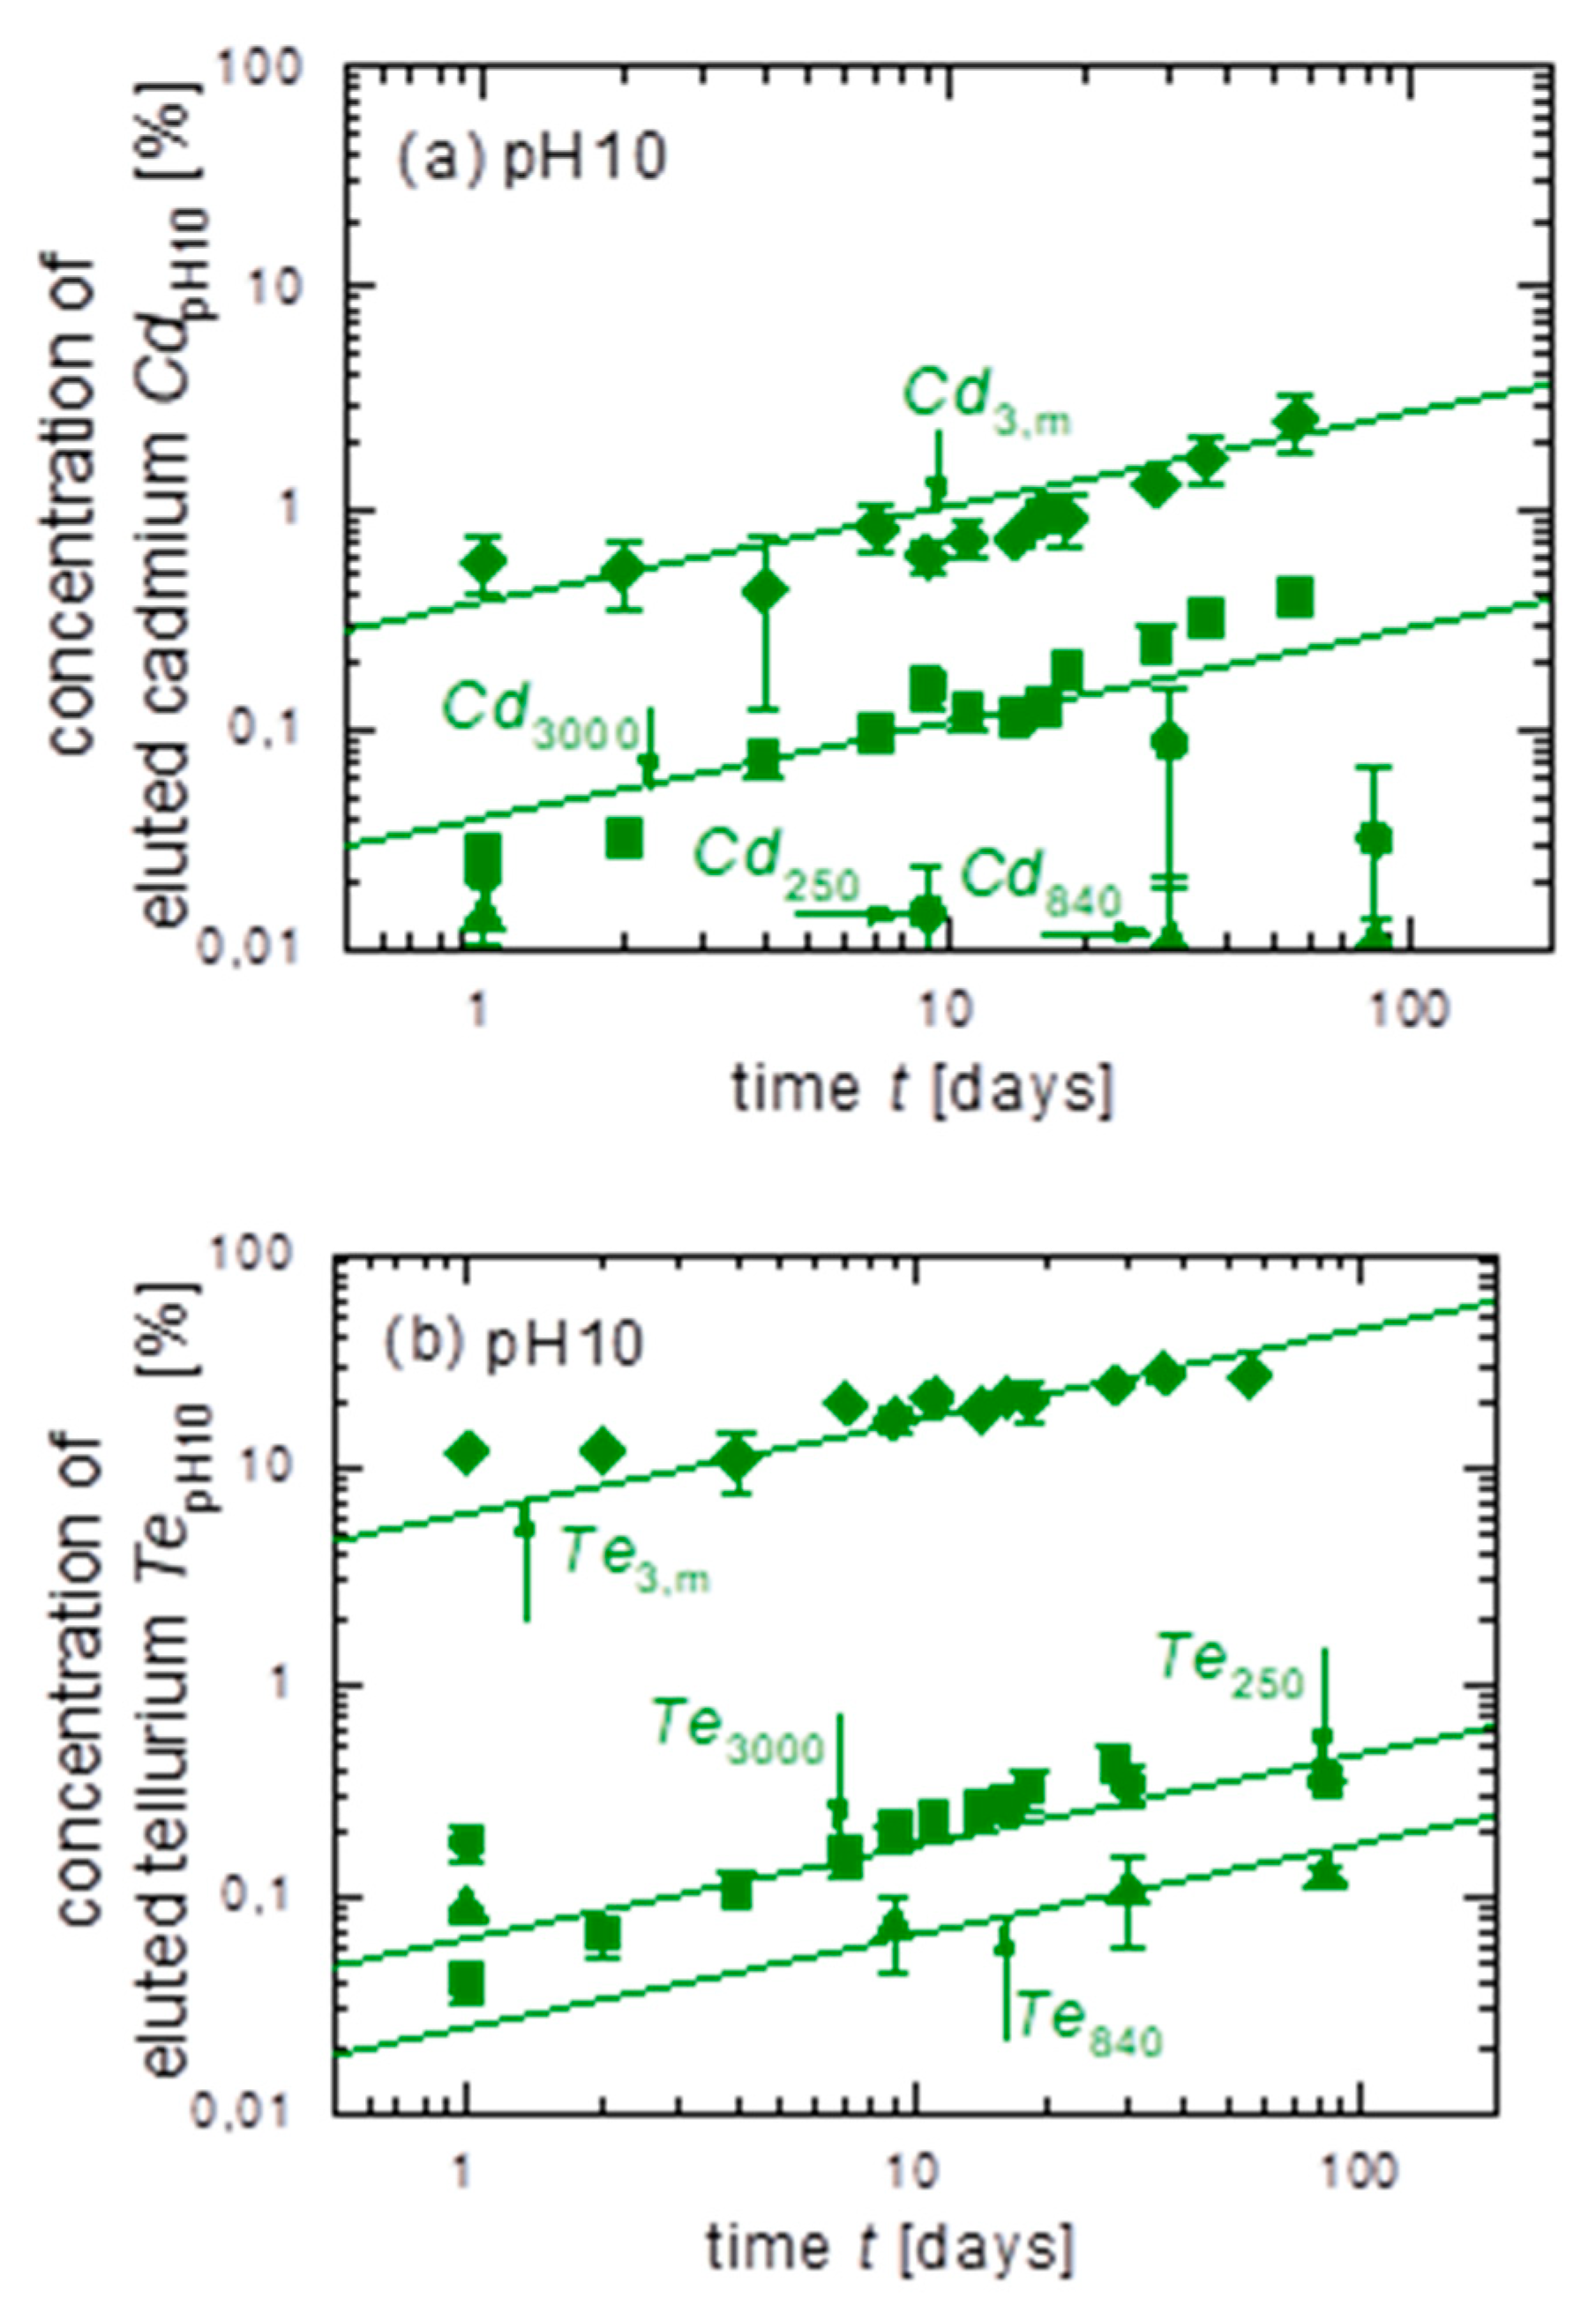
Figure 5a,b present the stability of the CdTe powders and the milled module pieces [6] in the alkaline solution with pH10. Again, we observe the same time dependence t0.43 as in Figure 3a,b and Figure 4a,b. Also, again, the elution for the milled module pieces is the highest. However, for the CdTe powders, in contrast to the elution in pH4 and pH7, now with pH10, not the powder with the smallest grains is eluted fastest, but the powder with the largest grains in aqueous solutions. In Figure 5a it holds that: Cd250Cd840 < Cd3000 < Cd3,m. Similarly, for the eluted TepH10, illustrated in Figure 4b, it holds Te3000 < Te840 < Te250 < Te3,m. In the alkaline range, a higher amount of eluted TepH10 than CdpH10 is measured. The elution of Te3,m with Te3,m (t = 56 d) ≈ 26% from the milled modules is two orders of magnitude higher when compared to Te250 with Te250 (t = 83 d) ≈ 0.3%.

3.4. Maximum Values after t = 83 d

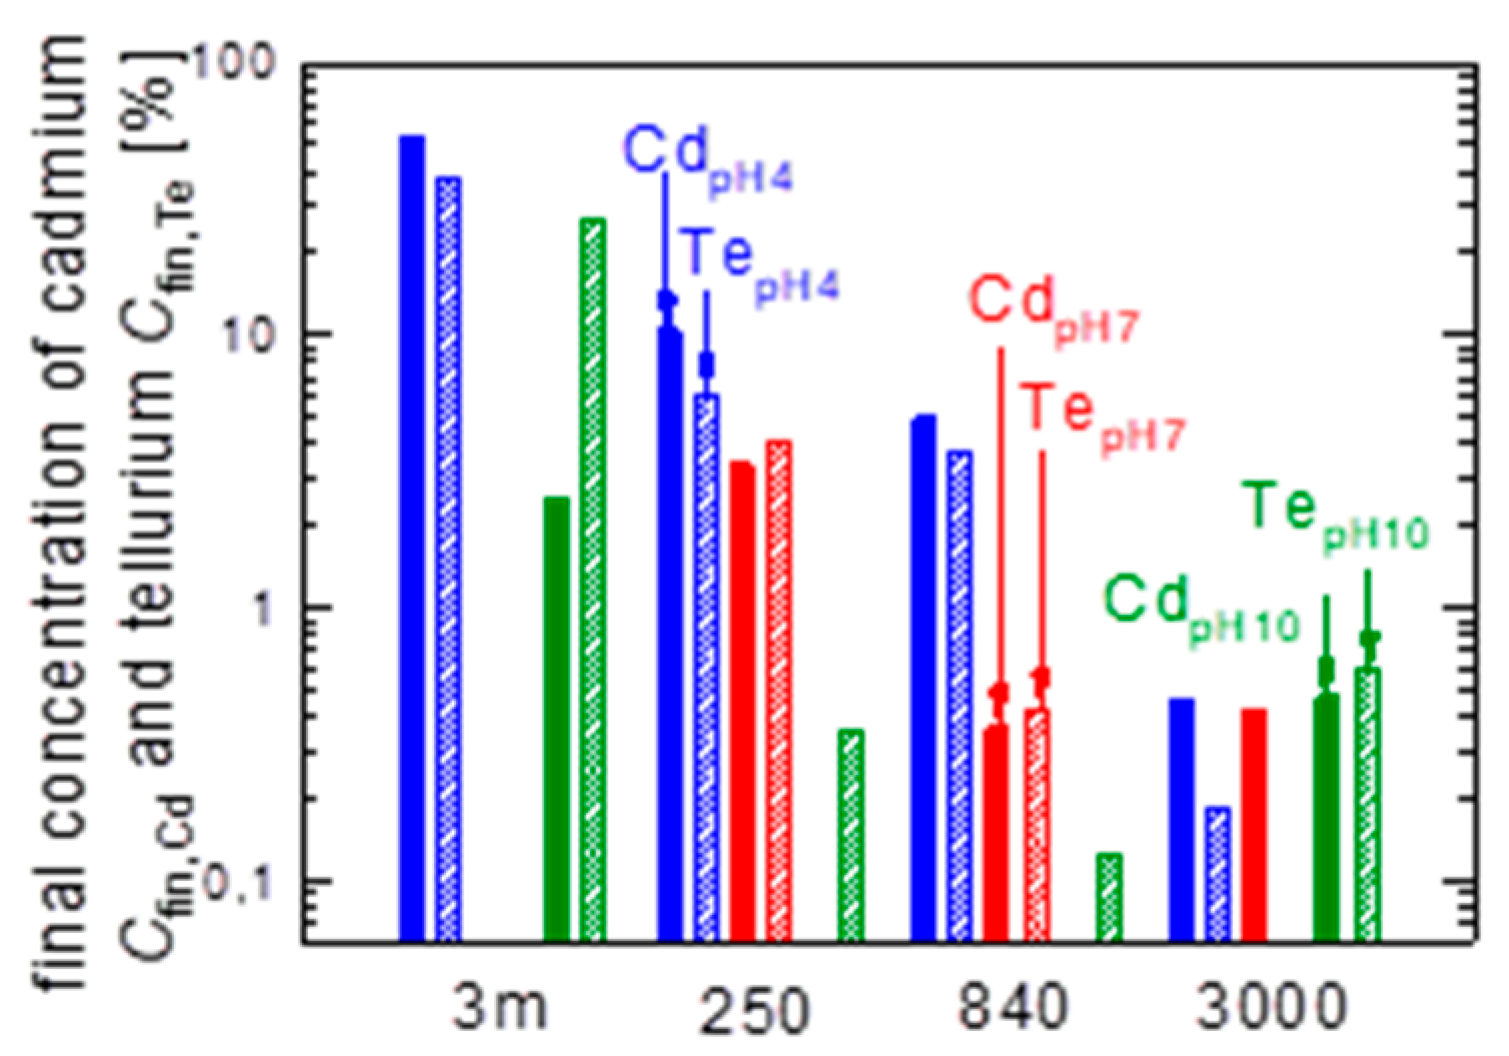
Figure 6 summarizes the data from Figure 3a,b, Figure 4a,b and Figure 5a,b after 83 days for the maximum concentration of Cd and Te that is found in the solutions with different pH. From the Cd contained in the milled module pieces (3m), close to 54% are leached out in the solution with pH4. In the same time under the same conditions, 30% of Te are found in the same solution. For acidic conditions (pH4) the quantity ratio Cd:Te in the solution is Cd:Te ≈ 2:1, for neutral conditions (pH7) it holds Cd:Te ≈ 1:1, whereas for alkaline conditions (pH10) it holds Cd:Te ≈ 1:2.

3.5. Comparison with Equation (2)

Table 1 compares the relative leaching ratios of the data in Figure 3, Figure 4 and Figure 5 to the values from Equation (2). Here, we take the values for the CdTe250 films as a reference. The data for pH4 agree very well with the expected behavior: The dissolution/elution is proportional to the surface/volume ratio, i.e., to the inverse of the mean particle diameter dmean. For the other pH values, the prediction goes in the right direction. However, there are noticeable deviations. Note, Equation (2) does not consider that the mean particle size changes during the dissolution. After leaching in aqueous solution with pH4 for t = 274 d,
CdTe250 and CdTe840 powder show that the smaller particles disappear, leaving particles with larger sizes. Nonetheless, Equation (2) with the assumed mean particle size seems to be valid in Figure 3, Figure 4 and Figure 5. This assumption is allowed as long as the particles are not completely dissolved, and smaller than the mean particle size. Also, we do not consider any chemistry or hindered transport in the solutions. Also, this simple reflection does not consider any change of the particle distribution upon dissolution. It is just assumed that smaller particles dissolve faster than larger particles. One would also expect that not only the original mean particle sizes, but the exact chemistry of the particles’ surface plays a role in the dissolution behavior. For this purpose, we compare CdTe powders with different surface treatment.

4. Leaching of ‘Solar-Cell-Like’ Processed CdTe Powder

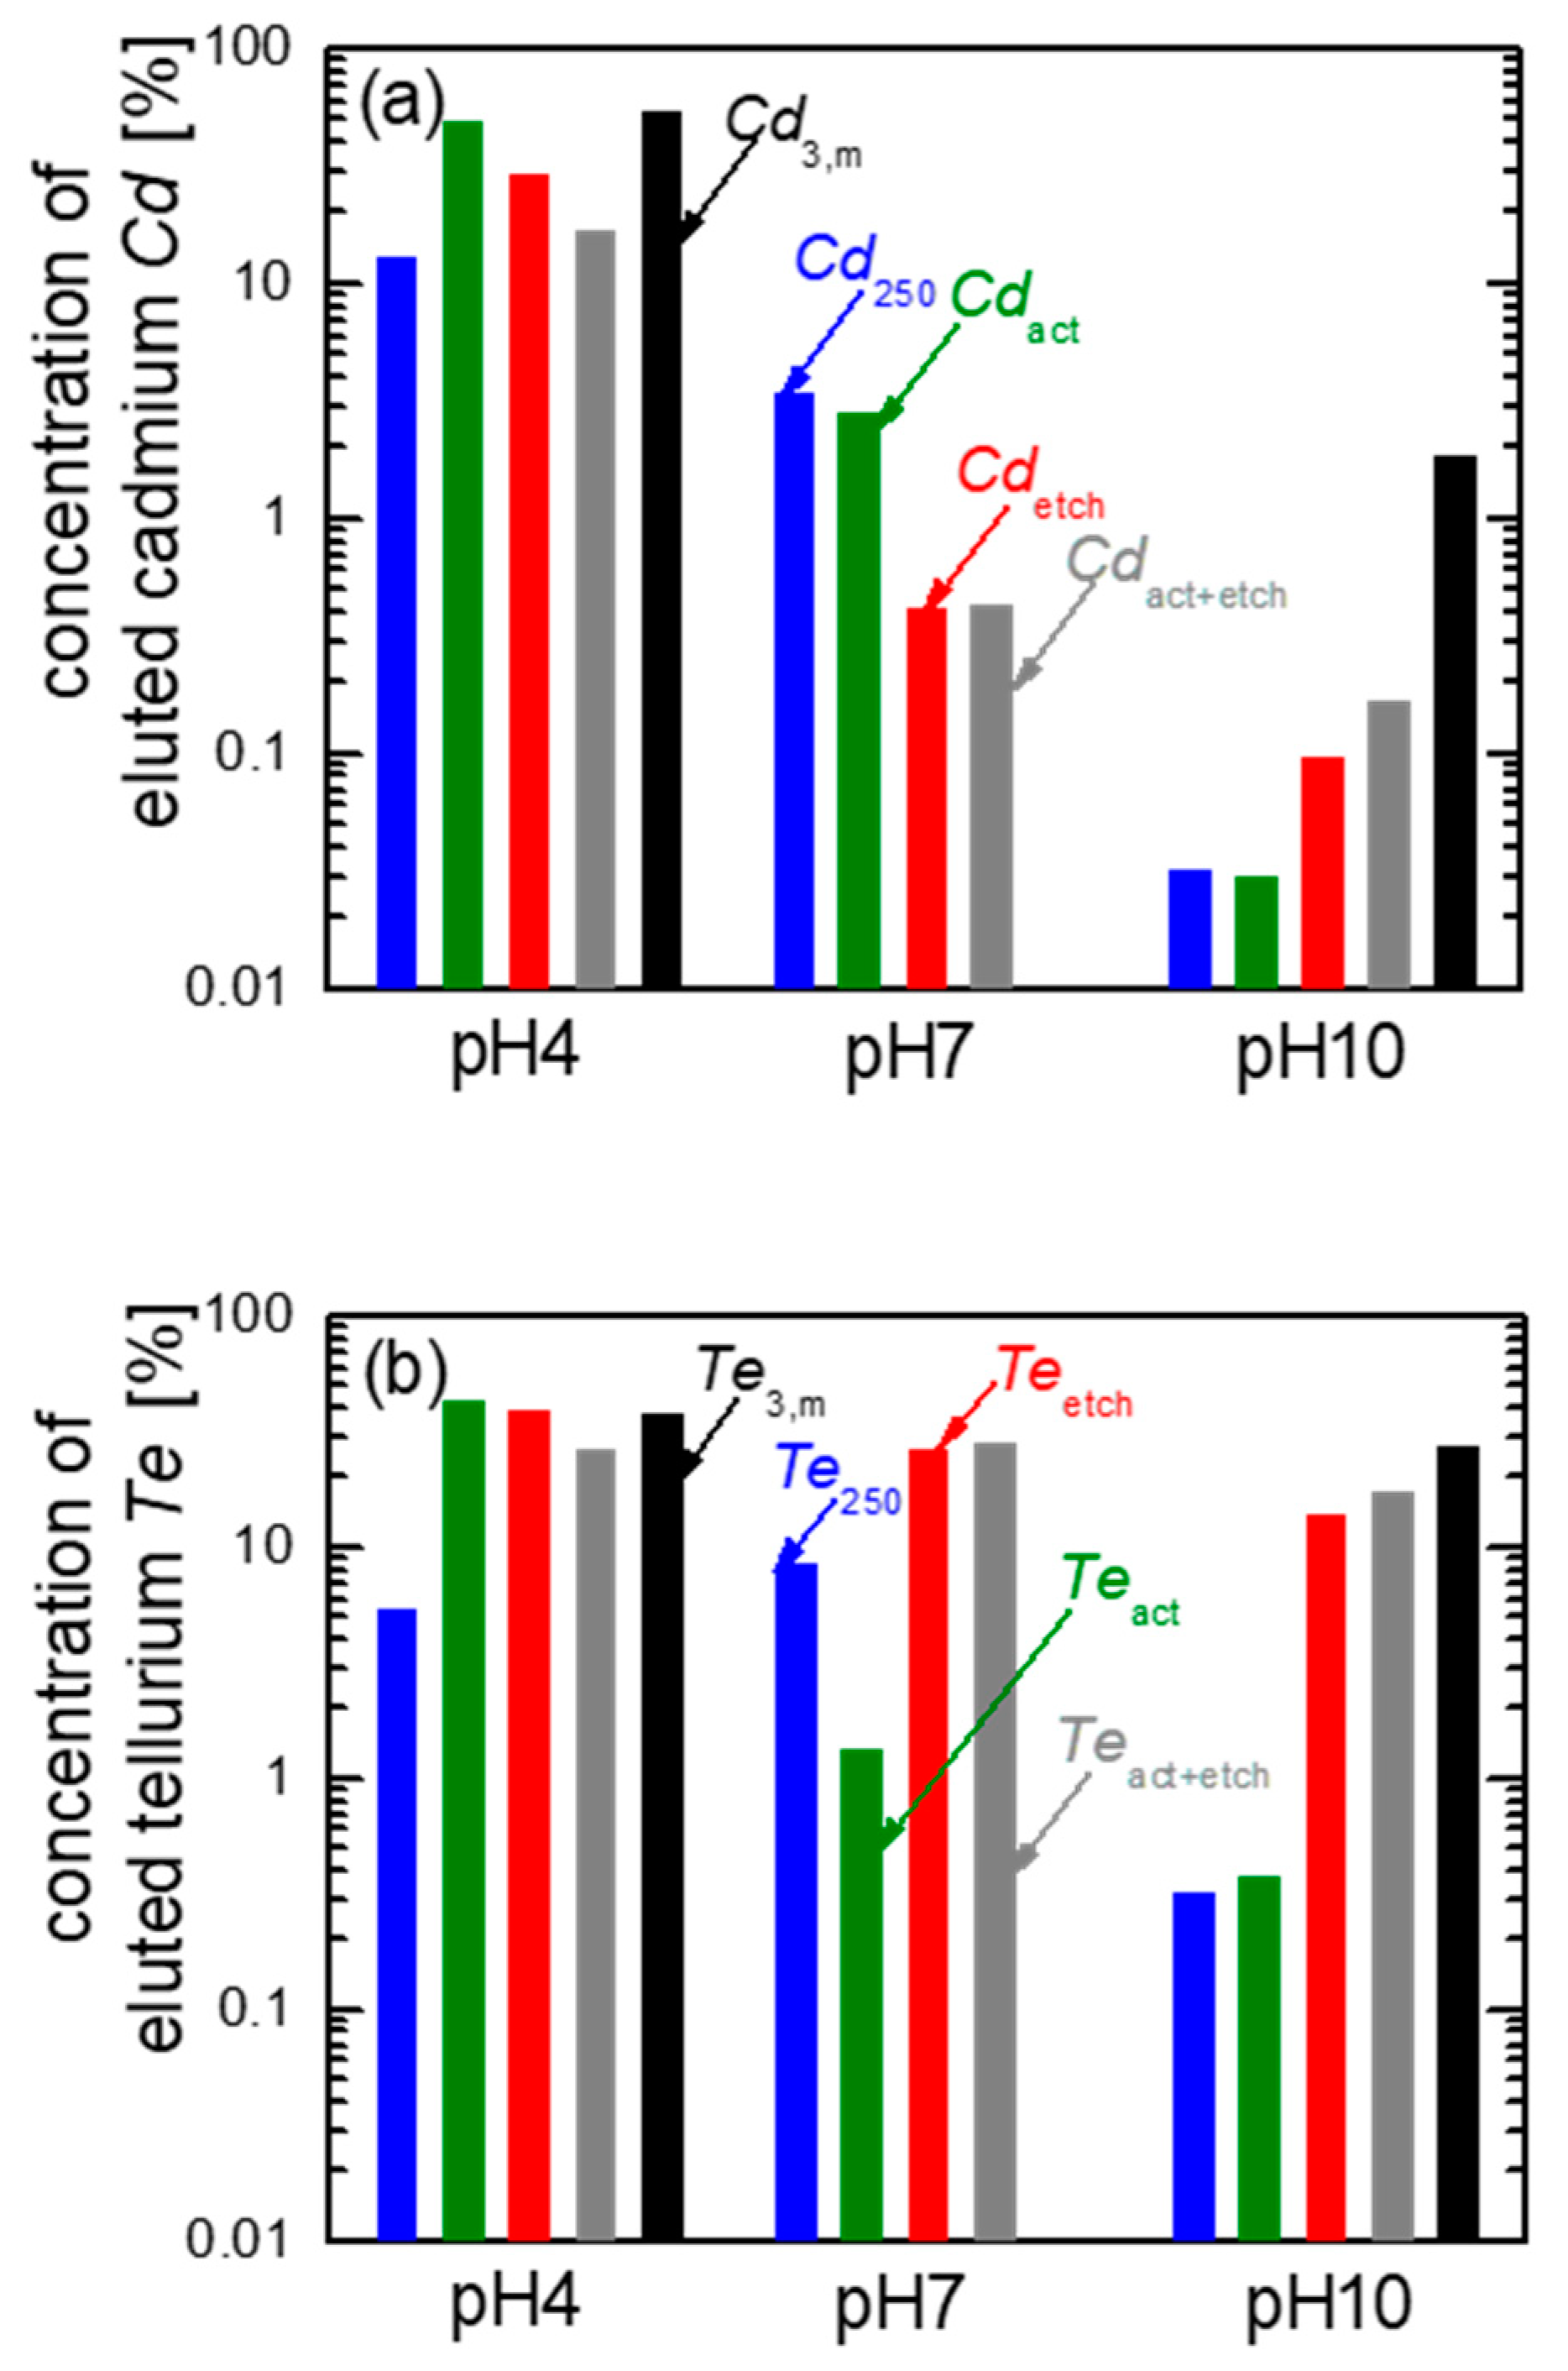
Table 1 gives an indication that not only the particle size but also the detailed surface chemistry plays a role in the dilution behavior. Therefore, Figure 7a,b compare the influence of solar-cell-like processes on the leaching behavior of the CdTe250 powder in different aqueous solutions. We distinguish:
  • Powder CdTe250, untreated, initial powder (blue bars);
  • Powder CdTe250, activated by CdCl2 (green bars);
  • Powder CdTe250, etched in NP-etch (red bars);
  • Powder CdTe250, activated and etched (grey bars);
  • Milled module pieces from Ref. [6] (black bars).
The data in Figure 7a, b is taken after eluting with pH4, pH7, and pH10 after a time t = 83 d after processing of the CdTe-powders. The data Cd3,m and Te3,m from milled module pieces stem for eluting for t = 56 d.
  • pH4: The eluted Cd of the initial powder is Cd250 ≈ 10% (data in blue). Activation (green data) strongly increases the elution to Cdact ≈ 50%, whereas the etching (red data) and the combination of activation plus etching (grey data) decelerates the elution to Cdetch ≈ 30% and Cdact+etch ≈ 16%.
  • pH7: All solar cell like processing steps decrease the elution in pH7, when compared to the unprocessed powder: the data in blue are still the highest for pH7.
  • pH10: Solar cell-like processing leads to higher elution in pH10 with the highest value observed for the milled module pieces (see black data Cd3,m).
Figure 7b shows the amount of eluted Te: in pH4 the Te250 ≈ 5% displays the lowest elution, while Teact, Teetch and Teact+etch increase and become close to Te3,m ≈ 38%. In solutions with pH7 and pH10, the solar cell like processing increases the elution of Te, except the activation step, which decreases eluted Te to Teact ≈ 1.3% and Teact ≈ 0.4%, respectively.
Due to a possible deposition of excess CdCl2 on the Cd250-powder, as shown in Figure 10 by energy-dispersive X-ray (EDX) spectroscopy analysis, the Cd-elution might be increased. The mass of Cd—if the whole Cd out of CdCl2 deposits on CdTe—adds up to an increase in mass of around 7.5%. The increase in the elution between Cdact–CdT250 ≈ 50–12% ≈ 38% is still much higher.

5. Surface Analysis of CdTe Powder

Surface Analysis of Leached and Processed CdTe Powder

The solar-cell-like processing and the leaching change the surface conditions and the particle size of the CdTe powders. Here, we present measurements taken from the CdTe-powders CdTe250 and CdTe840. In addition to SEM, we also show EDX data, which identify elements at the surface of the powder grains. For the analysis by SEM the leached powders are filtered by paper filters with a retention of particles with the sizes 7 to 12 µm. The smallest particles we found in SEM have sizes of around 5 to 7 µm.
Figure 8a,b show CdTe powder after leaching for t = 274 d in the aqueous solution with pH4. The same powders before leaching are shown in Figure 1a,b. From the comparison of Figure 1a (before leaching) with Figure 8a (after leaching) for the CdTe250 powder and Figure 1b (before leaching) with Figure 8b (after leaching) for the CdTe840 powder, it becomes obvious that in both powders, the smaller particles are dissolved faster than the large particles. This observation is in line with the data of Figure 4a: in the same time, the powder with the smaller grains is eluted faster than the powder with the large grains. Thus, it is understandable, that mainly the largest particles within the powders are left after leaching. Therefore, in the case of both powders, the size distribution of the particles became more homogeneous, when compared to Figure 1a,b. After leaching, the particles in Figure 8a from the CdTe250 powder have a relatively similar diameter d250,274d ≈ 100 µm. In contrast, Figure 8b from leached CdTe840 still shows different particle diameters with d840,274d > 100 µm and all particles with small diameters (compare to Figure 1b) disappeared completely.
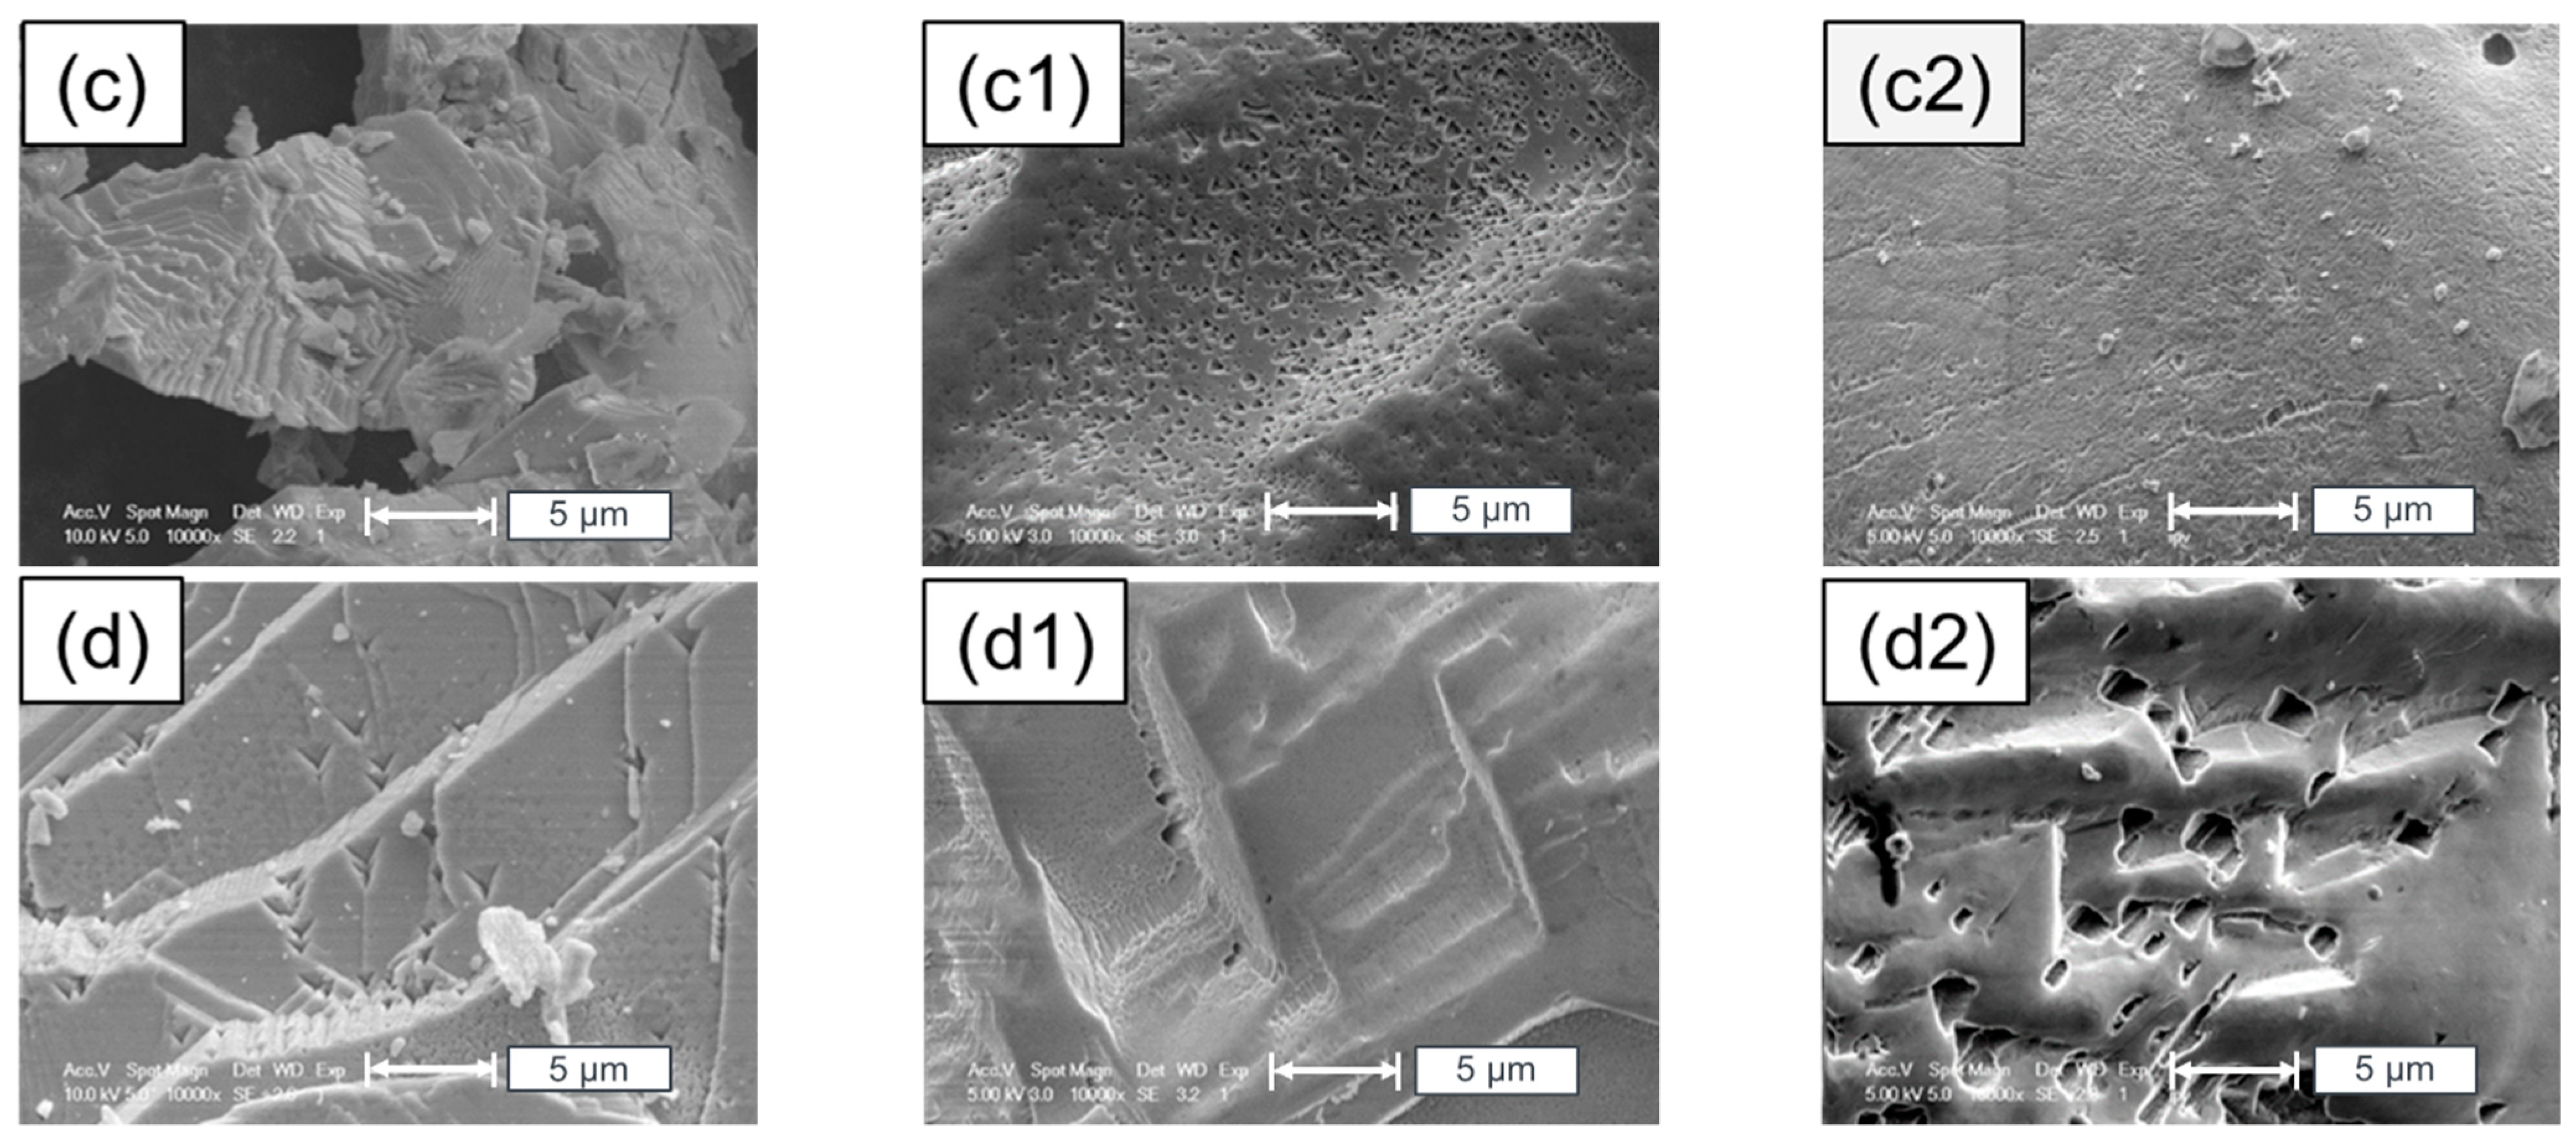
Leaching and processing of CdTe-powder modifies not only the particles’ size and their distribution, but also their surface. The matrix-like Figure 9a–d2 show SEM-pictures of the CdTe250 powders in 12 different stages:
  • Figure 9a–d represent the changes due to the “solar-cell-like” processing, all images are taken before leaching.
  • Figure 9a1–d1 show the powders from Figure 9a–d after leaching them for tpH4 = 20 d in solutions with pH4.
  • Figure 9a2–d2 show the same powders after leaching them for tpH4 = 274 d in solutions with pH4.
Figure 9a presents the rough surface of initial, untreated CdTe250 powder. The “activation” step in the “solar-cell-like” processing deposits CdCl2 on the surface, as indicated in Figure 9b. Figure 9c displays the surface of the CdTe powder after the “etching step” of the “solar-cell-like” processing and Figure 9d shows the surface after “activation plus etching” of the “solar-cell-like” processing.
Each one of the powders from Figure 9a–d is now leached out in pH4 solution: Figure 9a1–d1 show the powders after tpH4 = 20 d, Figure 9a2–d2 after tpH4 = 274 d of leaching in pH4 solution.
If one follows the series from Figure 9a–a2 one observes that the surface of the initial untreated film from Figure 9a becomes smoother with ongoing leaching. In contrast, the deposition of the CdCl2 via the “activation” (see Figure 9b) leads to an increasing number of etch pits during the leaching (see Figure 9b1,b2) of the active powders. The “etching” forms steps on the grains of the powder, as visible in Figure 9c. Leaching for tpH4 = 20 d forms etch pits as shown in Figure 9c1, but after tpH4 = 274 d of leaching smoother surfaces are observed (see Figure 9c2). The “activation plus etching” already creates etch steps and pits before leaching in pH4 solution, as shown in Figure 9d. Short term leaching for tpH4 = 20 d smoothens the surface, visible in Figure 9d1, while long-term leaching for tpH4 = 274 d forms deep etch pits in µm-size, as illustrated in Figure 9d2.
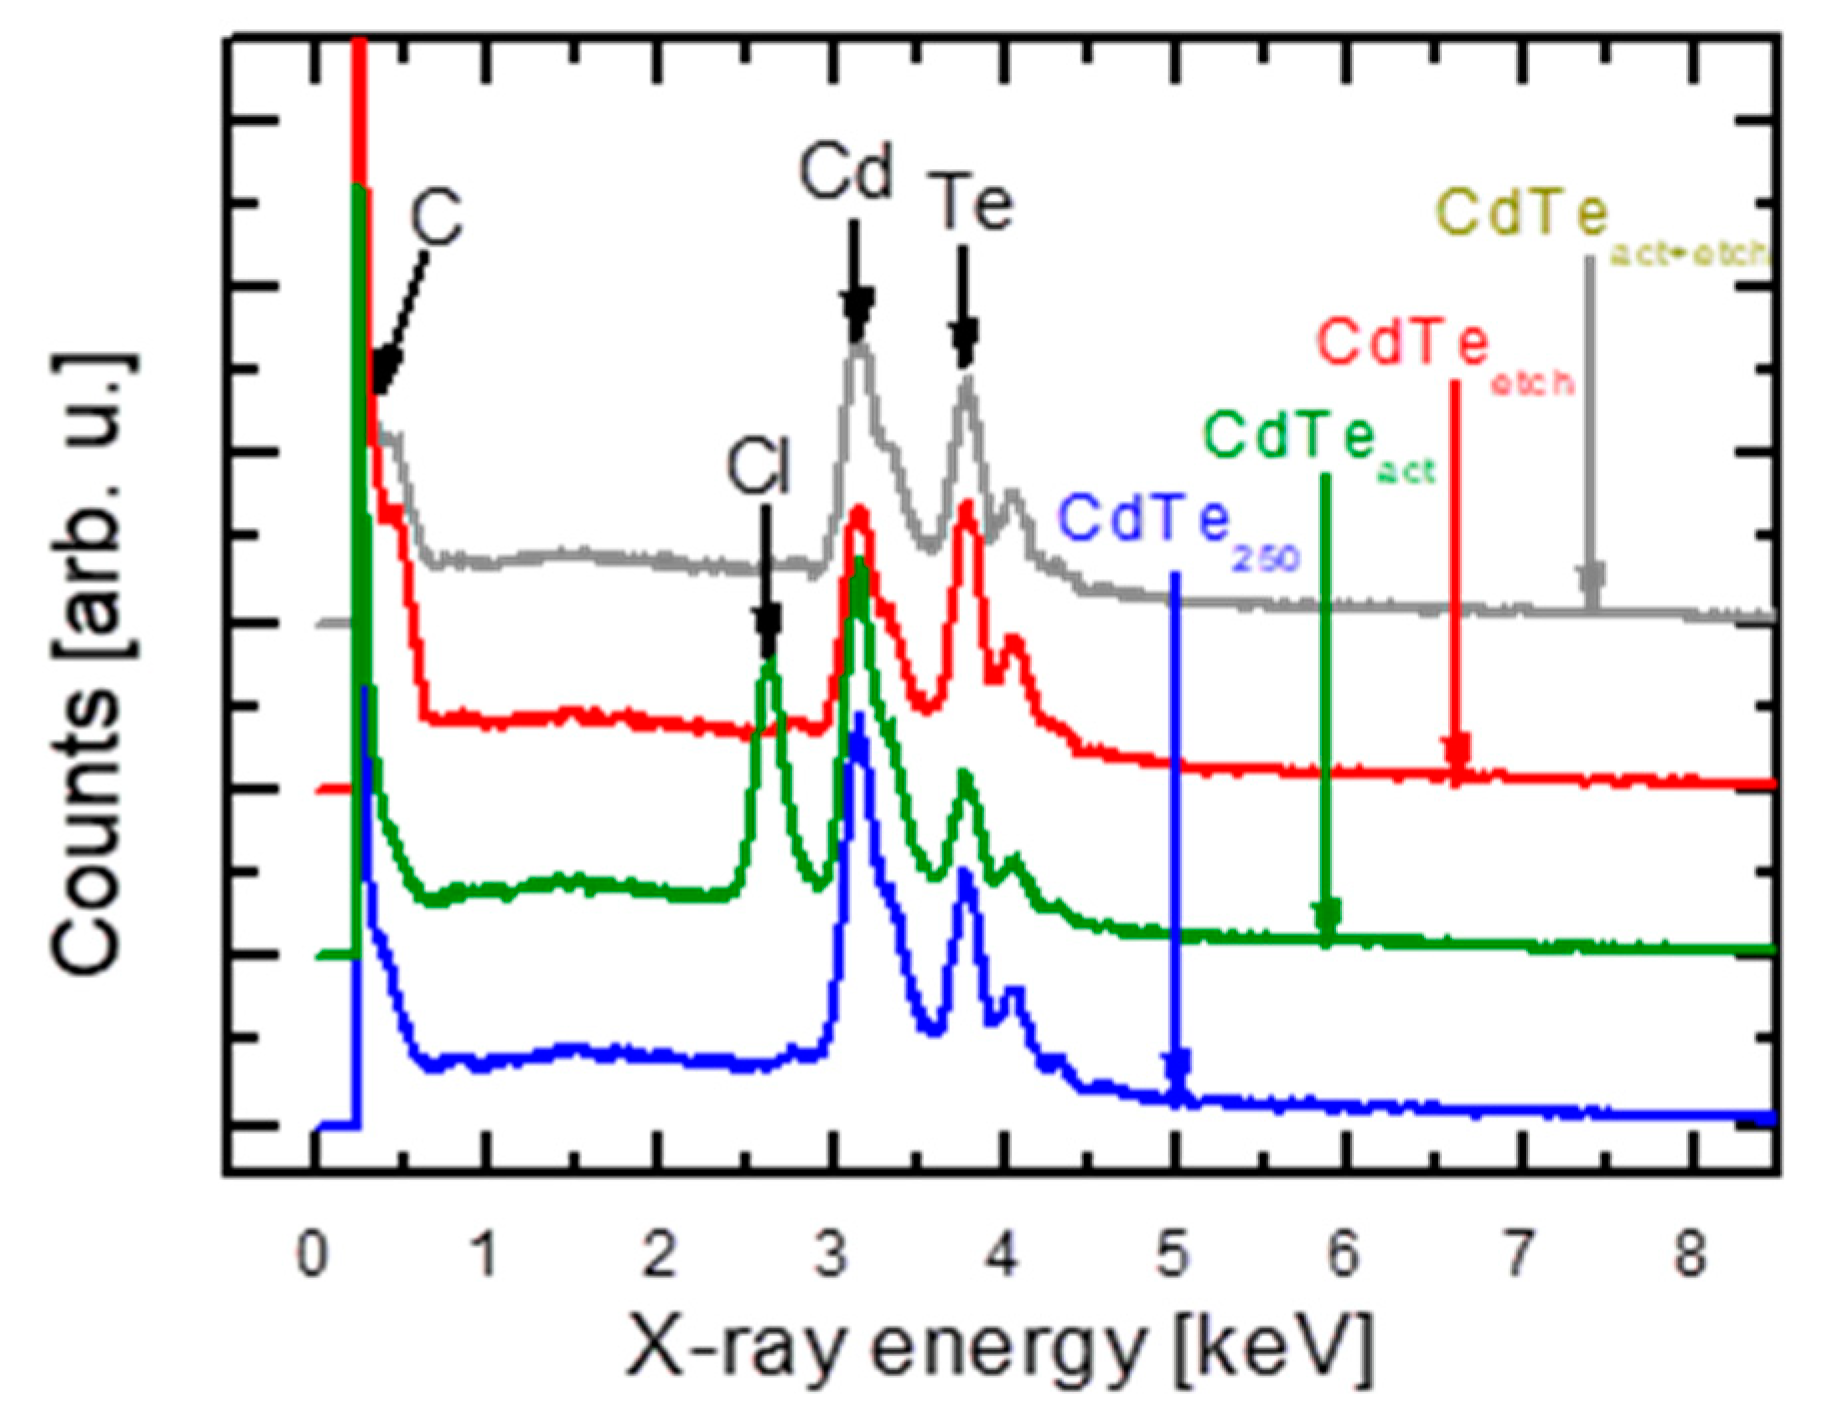
The “solar cell-like” processing steps change the physical and chemical composition of the CdTe-grains with the consequence of different leaching behavior, when compared to the untreated powders. The change of the chemical properties is confirmed by the different X-ray spectra in Figure 10. The EDX spectra are taken in a scanning electron microscope. To see differences in more detail, the spectra are shifted in the zero line of the counts. Due to “activation” by CdCl2, the composition of the surface of CdTeact changes to a higher amount of Cd and Cl and a lower amount of Te. The “etching” forms a more Te-rich surface on CdTeetch. However, the combination of “activation plus etching” still leaves more Te on the surface of CdTeact+etch which boosts the elution of Te.

6. Discussion

6.1. Thermodynamics and Surface Chemistry

The experimental data in Figure 3a,b, Figure 4a,b and Figure 5a,b do not show any saturation for leaching out Cd and/or Te from the CdTe powders as well as from the milled module pieces. Thus, without any question: CdTe powders and module pieces are not stable in aqueous solutions. It is only a matter of time, until the CdTe is completely decomposed. Leaching of Cd and Te out of CdTe-powder strongly depends on the pH of the aqueous solutions.
Our results are completely in accordance with earlier data [27,28], which explain the instability of CdTe in aqueous solutions on the basis of thermodynamic considerations: Zeng et al. explained the leaching behavior of CdTe in aqueous solutions with the help of a Pourbaix-diagram for reductive and oxidative conditions [27]. Ramos-Ruiz et al. confirmed these results on CdTe modules [28]. In oxidative conditions, as we measure in our solutions, the probability of the formation of Cd++ ions in pH < 6.9 is high, whereas for pH > 6.9 the released Cd forms the compound cadmium hydroxide Cd(OH)2. The Cd(OH)2 precipitates in water and is not accessible in our measurements of dissolved elements. Formation of Cd++ ions in low pH and a precipitation of Cd(OH)2 in higher pH is in agreement with our elution results. Except in acidic solutions, Te elutes in a higher amount than Cd. The Pourbaix diagram indicates a generation of non-soluble tellurium oxide TeO2 at low pH, whereas in alkaline conditions the formation of soluble Te ions predominates.

6.2. Particle Size and Time-Dependent Elution

Dependence on particle size: the data in Figure 3 and Table 1 (in particular for pH4) reveal the strong influence of the particle size on elution. Smaller particles dissolve faster than larger particles. Such behavior is well known in the field of pharmacy: Hintz et al. [29] increased the dissolution of drugs by milling them to smaller particle sizes. The study indicated that the solubility is proportional to the inverse diameter of the particles if in the micrometer range, just as assumed in our Equation (2). As a consequence, during elution/dissolution, the particle distribution will become more homogeneous: the larger particles survive longest.
Time dependence: apart from the detailed influence of the surface, as well as of the particle size/distribution, as well as of the pH, we observe a universal behavior: Figure 3a,b, Figure 4a,b and Figure 5a,b reveal a particular dependence of the eluted concentration C on time t. Before saturation is reached, the concentration C of the eluted elements follows a power law
C t n  
In our case, we find n = 0.43 ± 0.02.
Our experimental result with n = 0.43 from leaching CdTe-powders in different pH is in agreement with an earlier pharmaceutic model of Ritger and Peppas [30]. They modeled the release of drugs from polymeric devices. Similar to our system, where Cd and Te are released from CdTe particles, they modelled the release of drugs from polymeric devices of different shapes. As in their case, also in our case, the “drugs” Cd and Te are dissolved at the surface of the particles, then they diffuse into the solvent. Ritger and Peppas [30] assumed a Fickian diffusion within the polymeric matrix. Earlier it was shown by Crank [31], that the mathematically exact solution for a diffusion from spherical particles with radius r is
C ( t ) C = 1 6 π 2 n = 1 1 n 2   e x p ( D n 2 π 2 t r 2 )
Here, in our notation, C(t) is the eluted concentration of the “drug” (e.g., Cd, Te) in the solution, C stands for the mass C for time t = ∞, and D is the diffusion constant of the drug (i.e., Cd, Te) within the surface of the CdTe matrix. Instead of the complete Equation (4), a good approximation to Equation (4) for the first 60% of drug release is given by [30]
C ( t ) C = k t n
Equation (5) is a good approximation not only to Equation (4) for spheres, but also to the respective mathematical solutions for other geometries: for thin films and cylinders instead of spheres [31]. If the dissolution is limited by diffusion in the matrix, then it holds that n = 0.5 for thin films, n = 0.45 for cylindrical particles and n = 0.432 ± 0.007 for spherical particles of uniform size. These n-values are a good approximation for the first 60% release. For the first 10% to 15% release from spherical particles, n = 0.5 is also a good approximation. If one considers not only spheres of the same size, but also size distributions, one obtains n-values between n = 0.41 to n = 0.43 [30].
The elution behavior in Figure 3a,b, Figure 4a,b and Figure 5a,b is well described by Equation (5) with n = 0.43. It is also understandable why a size distribution of spheres does not change much the exponent n: the smaller particles accelerate the outdiffusion and the elution, the larger particles lead to retardation of the diffusion process within the CdTe particles.
The elution behavior from the spheres is different but not much far from a time dependence with n = 0.5. In this case, it holds for particles with a diameter d [30]:
C t C = 4 ( D t π r 2 ) 1 2 = 8 D t π d 2  
Here, D is the diffusion constant of the diffusing substance within the matrix of the drug. In our interpretation, D is the diffusion constant DCd of Cd and DTe of Te within the CdTe particles. The Cd and the Te diffuse to the surface of the CdTe particles, and the solution acts as a perfect sink for Cd and Te just as in the pharmaceutic model.
Equation (6) allows us to estimate the diffusion constant D from measured values of the eluted mass Ct = C(t) at time t with respect to the value C, the saturation value at t = ∞ and the diameter d of the particles, according to
D =   π 64 ( C t / C ) 2 d 2 t  
We derive the D-values from the data in Figure 3a for pH4 and the Cd-elution from the milled module pieces (uppermost curve), assuming d = dmean,mod = 1 µm. The extrapolation shows that the extrapolated C-value for the Cd3,m-data is reached after t = 200 d. At this time, it holds Ct = C200 = C = 100% and Ct/C = 1. From these values, we obtain DCd ≈ 3 × 10⁻¹⁷ cm2/s for the diffusion constant of Cd. In case of the Te-elution, the extrapolated 100% value would be reached after 400 days. This yields a diffusion constant DTe ≈ 1.5 × 10⁻¹⁷ cm2/s for Te. The shift downwards of the other curves in Figure 3a,b with respect to those of the milled module pieces within one figure is simply explained with the larger particle sizes: the powders contain larger particles than the milled module pieces. Therefore, it simply takes longer to reach the saturation value.
For the calculation of DCd and DTe from Equation (7) we have to assume the value C for the Cd as well as for the Te. For the determination of the diffusion constants from the data for pH4 in Figure 3a,b we assume that this value is at 100% of the amount of Cd and Te, which are contained in the CdTe particles, simply because the experimental data Cd3,m and Te3,m come close to 100%. Thus, if we had just measured long enough, all the Cd and Te would have been found in the solution. However, this assumption is not generally valid: the values C for Cd and Te cannot exceed the solubility limits of the solution. Therefore, generally, even if the CdTe particles were dissolved completely, part of the Cd and Te could fall out in the form of precipitates. In the case of Cd, these are cadmium hydroxides. Such precipitates are not detected by our analysis method. We only measure the dissolved Cd and Te. However, the data for pH4 approach the 100% for Cd as well as for Te. Therefore, for this pH the amount of precipitates can be neglected.
The result for the lower diffusion constant DTe for Te compared to DCd for Cd stems from the shift downwards of the Te curves in Figure 3b when compared to the Cd curves in Figure 3a. Note, these diffusion constants hold for room temperature. Therefore, it is not easy to compare them to literature data [32,33,34], which are taken at temperatures above 500 °C. In 2015 Shcherbak et al. [35] analyzed the literature data for diffusion in CdTe in the high-temperature regime. For most diffusing species in CdTe there holds an Arrhenius law for the dependence of the diffusion constants D on absolute temperature T according to D = D0 exp (−EA/kT) with prefactor D0 and activation energy EA. Depending on the experimental technique as well as on the diffusion mechanism (e.g., interstitial, vacancy) and charge, there is substantial scatter even for Cd and Te and even for the high-temperature regime. In our case for room temperature, we neither know the charge nor the diffusion mechanisms for Cd and Te but, probably, they diffuse as neutral species. To put our data in perspective, we compare them to the radiotracer self-diffusion data in Figure 2, Figure 3, Figure 5 and Figure 6 of reference [34], which also showed Arrhenius-type behavior in the high temperature regime (T > 1000 K) with exponential tails for lower temperatures, and absolute values of D ≈ 10−13 cm2/s at T ≈ 800 K. If we extrapolate the data in the Arrhenius plots of reference [34] data towards room temperature T ≈ 300 K, our results with D ≈ 10−17 cm2/s range in an expected order of magnitude. There seems to be also agreement that the diffusivity of Te in CdTe is smaller than that of Cd. Thus, our data fit into the trend of the literature data towards lower temperatures. These findings support our assumption that the elution of Cd and Te out of the CdTe is mainly controlled by the diffusion of Cd and Te in and across the surface of the particles. The solution acts as a perfect sink because, during the experiment, we shake the containers with the solutions and the powders/particles.
The behavior of the data for Cd for pH7 and pH10 is different, but also understood. Compared to the Cd-data for pH4, for the same elution time t, we find much less Cd in the solution. We explain this finding with the formation of Cd-containing precipitates: Depending not only on the pH, but also on the kind of solvent, Cd forms different hydroxides in water-based solutions. For pH4, the species distribution plots of Cd [35,36] show only Cd2+-ions. The higher the pH, depending on the redox potential, the more hydroxides that appear. The species distribution plot of Wilkin [36] shows 100% of Cd2+ at pH4. In contrast, at pH10, much less Cd2+ is available. Therefore, it is understandable that the Cd curves in Figure 5a are shifted downwards: the extrapolated data for the Cd3m-pieces for pH4 (Figure 3a) and t = 200 d end up at C ≈ 100%, whereas the data for the Cd3m-pieces for pH10 (Figure 5a) and t = 200 d end up at C ≈ 4%. This means that only about 4% of the Cd will go into solution for pH10, if we ascribe all missing Cd in the solution to precipitates. Under this assumption the missing 96% of Cd in case of pH10 would precipitate in the form of hydroxides. The data for pH7 in Figure 4a lie between the data from Figure 3a and Figure 5a. Therefore, we also expect some precipitation of hydroxides even for pH7. However, it is also possible that for pH7 a surface layer preventing outdiffusion is formed.
In contrast to the Cd-data, we do not have an indication for the formation of Te precipitates for pH7 and pH10. We speculate that the lower values in Figure 4b and Figure 5b compared to Figure 3a are related to the surface of the CdTe. For the Te, apart from a substantial scatter of the data in Figure 4b and Figure 5b for the larger particles, there is almost no change of the data for different pH, in particular for the milled module pieces. The Te3,m-data for pH4 (Figure 3a) and pH11 (Figure 5a) agree almost exactly with each other. Therefore, it seems that—independent of pH—there is no formation of precipitates for Te. Obviously, we are far from the solubility limit for Te. The scatter of the data for larger particle sizes, probably is a consequence of a passivation of the surface by tellurium oxide. In this case, the etching/outdiffusion of Te would also be hindered with the consequence of a lower diffusion constant.

7. Conclusions

Our time-dependent leaching experiments have demonstrated severe leaching of Cd out of CdTe which is not finished until day 83. The measured elution of Cd and Te indicates a destabilization and corrosion of the compound CdTe. The CdTe particles are not stable in water, even for neutral water with pH7.
Our leaching experiments on CdTe particles with different sizes are not only qualitatively but also quantitatively understood:
  • The faster dissolution for the smaller particles is simply understood by their larger surface to volume ratio. The dissolution rate is proportional to the inverse diameter.
  • The time-dependent aggregation of the dissolved species with t0.43 is understood on the basis of a model that, originally, stems from pharmacy. The dissolution is controlled by the diffusion of Cd and Te in and across the surface of the spherical particles.
  • The total behavior of the data in Figure 3a,b, Figure 4a,b and Figure 5a,b is understood on the basis of the room temperature diffusion coefficients DCd ≈ 3 × 10⁻¹⁷ cm2/s for the Cd, and DTe ≈ 1.5 × 10⁻¹⁷ cm2/s for Te.

Author Contributions

Conceptualization, R.Z.-G. and M.K.; Funding acquisition, R.Z.-G.; Investigation, R.Z.-G., M.Z., J.N. and C.F.; Methodology, R.Z.-G. and M.K.; Project administration, R.Z.-G.; Resources, J.N.; Validation, J.H.W.; Visualization, J.N.; Writing—review & editing, R.Z.-G., M.K. and J.H.W. All authors have read and agreed to the published version of the manuscript.

Funding

Parts of this work were funded by the German Federal Ministry of Economics and Technology (BMWi) project No. 0325718.

Institutional Review Board Statement

Not applicable.

Informed Consent Statement

Not applicable.

Data Availability Statement

Not applicable.

Acknowledgments

The authors thank Christine Herrmann (Institute for Modelling Hydraulic and Environmental Systems, University of Stuttgart) for the BET measurements.

Conflicts of Interest

The authors declare no conflict of interest.

References

  1. Patterson, M.; Turner, A.; Sadeghi, M.; Marshall, R. Health, safety and environmental aspects of the use of cadmium compounds in thin film PV modules. Sol. Energy Mater. Sol. Cells 1994, 35, 305–310. [Google Scholar] [CrossRef]
  2. Fthenakis, V.M. Life cycle impact analysis of cadmium in CdTe PV production. Renew. Sustain. Energy Rev. 2004, 8, 303–334. [Google Scholar] [CrossRef] [Green Version]
  3. Kato, K.; Hibino, T.; Komoto, K.; Ihara, S.; Yamamoto, S.; Fujihara, H. A life-cycle analysis on thin-film CdS/CdTe PV modules. Sol. Energy Mater. Sol. Cells 2001, 67, 279–287. [Google Scholar] [CrossRef]
  4. Bohland, V.J.; Anisimov, I.I.; Dapkus, T.J.; Sasala, R.A.; Smigielski, K.A.; Kamm, K.D. Reclaiming Metallic Material from an Article Comprising a Non-Metallic Friable Substrate. U.S. Patent No. US 6129779 A, 10 October 2000. [Google Scholar]
  5. Wang, W.; Fthenakis, V. Kinetics study on separation of cadmium from tellurium in acidic solution media using ion-exchange resins. J. Hazard. Mater. 2005, 125, 80–88. [Google Scholar] [CrossRef]
  6. Zapf-Gottwick, R.; Koch, M.; Fischer, K.; Schwerdt, F.; Hamann, L.; Kranert, M.; Metzger, J.; Werner, J. Leaching Hazardous Substances out of Photovoltaic Modules. Int. J. Adv. Appl. Phys. Res. 2015, 2, 7–14. [Google Scholar] [CrossRef]
  7. Nover, J.; Zapf-Gottwick, R.; Feifel, C.; Koch, M.; Metzger, J.W.; Werner, J.H. Long-term leaching of photovoltaic modules. Jpn. J. Appl. Phys. 2017, 56, 08MD02. [Google Scholar] [CrossRef]
  8. Mitchell, K.W.; Fahrenbruch, A.L.; Bube, R.H. Photovoltaic determination of optical-absorption coefficient in CdTe. J. Appl. Phys. 1977, 48, 829–830. [Google Scholar] [CrossRef]
  9. Birkmire, R.W.; Candless, B.E. CdTe thin film technology: Leading thin film PV into the future. Curr. Opin. Solid State Mater. Sci. 2010, 14, 139–142. [Google Scholar] [CrossRef]
  10. Bonnet, D. Manufacturing of CSS CdTe solar cells. Thin Solid Films 2000, 361, 547–552. [Google Scholar] [CrossRef]
  11. Institut für Arbeitsschutz der DGUV. GESTIS-Stoffdatenbank. Available online: https://gestis.dguv.de/data?name=109355 (accessed on 8 January 2021).
  12. Terheggen, M.; Heinrich, H.; Kostorz, G.; Baetzner, D.; Romeo, A.; Tiwari, A. Analysis of Bulk and Interface Phenomena in CdTe/CdS Thin-Film Solar Cells. Interface Sci. 2004, 12, 259–266. [Google Scholar] [CrossRef]
  13. Bosio, A.; Menossi, D.; Mazzamuto, S.; Romeo, N. Manufacturing of CdTe thin film photovoltaic modules. Thin Solid Film. 2011, 519, 7522–7525. [Google Scholar] [CrossRef]
  14. Emziane, M.; DuRose, K.; Romeo, N.; Bosio, A.; Halliday, D. Effect of CdCl2 activation on the impurity distribution in CdTe/CdS solar cell structures. Thin Solid Film. 2005, 480, 377–381. [Google Scholar] [CrossRef]
  15. Rosenberg, R.J.; Zilliacus, R.; Lakomaa, E.L.; Rautiainen, A.; Mäkelä, A. Study of CdTe/CdS-thin films by isotope dilution, neutron activation analysis, inductively coupled plasma mass spectroscopy and secondary ion mass spectroscopy. Fresenius J. Anal. Chem. 1996, 354, 6–10. [Google Scholar] [CrossRef]
  16. MilliporeSigma. Available online: www.sigma-aldrich.com (accessed on 18 December 2020).
  17. Kraft, D.; Thissen, A.; Broetz, J.; Flege, S.; Campo, M.; Klein, A.; Jaegermann, W. Characterisation of tellurium layers for back contact formation on close to technology treated CdTe surfaces. J. Appl. Phys. 2003, 94, 3589–3598. [Google Scholar] [CrossRef]
  18. Zorn, M. Solubility of cadmium telluride. Bachelor’s Thesis, Institute for Photovoltaics, University of Stuttgart, Stuttgart, Germany, 2015. Chapter 4. [Google Scholar]
  19. Hajimammadov, R.; Fathi, N.; Bayramov, A.; Khrypunov, G.; Klochko, N.; Li, T. Effect of “CdCl2Treatment” on Properties of CdTe-Based Solar Cells Prepared by Physical Vapor Deposition and Close-Spaced Sublimation Methods. Jpn. J. Appl. Phys. 2011, 50, 05FH01. [Google Scholar] [CrossRef]
  20. McCandless, B.E.; Dobson, K.D. Processing options for CdTe thin film solar cells. Sol. Energy 2004, 77, 839–856. [Google Scholar] [CrossRef]
  21. Mack, S. Herstellung und Charakterisierung von CSS-CdTe-Dünnschicht-Solarzellen. Diploma’s Thesis, Friedrich-Schiller-Universität Jena, Jena, Germany, 2006. [Google Scholar]
  22. De Mello, W.Z.; de Almeida, M.D. Rainwater chemistry at the summit and southern flank of the Itatiaia massif, Southeastern Brazil. Environ. Pollut. 2004, 129, 63–68. [Google Scholar] [CrossRef] [PubMed]
  23. Hochschule für Angewandte Wissenschaften (HAW) Hamburg. Available online: http://www.haw-hamburg.de/fileadmin/user_upload/FakLS/08LABORE/Chemie/Regenwasseranalyse/Regenwasser_Analyse_WS_12_13_Els.pdf (accessed on 1 September 2017).
  24. Landesamt für Natur, Umwelt und Verbraucherschutz Nordrhein-Westfalen (lanuv). Fachbericht 24, Beschaffenheit von Deponiesickerwässer. 2012. Available online: http://www.lanuv.nrw.de, (accessed on 1 September 2017).
  25. Marion, G.M.; Millero, F.J.; Camões, M.F.; Spitzer, P.; Feistel, R.; Chen, C.T. pH of seawater. Mar. Chem. 2011, 126, 89–96. [Google Scholar] [CrossRef]
  26. Alcademics. Available online: http://www.alcademics.com/2013/04/measuring-ph-of-mineral-waters.html (accessed on 1 September 2017).
  27. Zeng, C.; Ramos-Ruiz, A.; Field, J.A.; Sierra-Alvarez, R. Cadmium telluride (CdTe) and cadmium sulfide (CdS) leaching behavior and surface chemistry in response to pH and O2. J. Environ. Manag. 2015, 154, 78–85. [Google Scholar] [CrossRef]
  28. Ramos-Ruiz, A.; Wilkening, J.V.; Field, J.A.; Sierra-Alvarez, R. Leaching of cadmium and tellurium from cadmium telluride (CdTe) thin-film solar panels under simulated landfill conditions. J. Hazard. Mater. 2017, 336, 57–64. [Google Scholar] [CrossRef] [Green Version]
  29. Hintz, R.J.; Johnson, K.C. The effect of particle size distribution on dissolution rate and oral absorption. Int. J. Pharm. 1989, 51, 9–17. [Google Scholar] [CrossRef]
  30. Ritger, P.L.; Peppas, N.A. A simple equation for description of solute release. I. Fickian and non-Fickian release from non-swellable devices in the form of slabs, spheres, cylinders or discs. J. Control. Release 1987, 5, 23–26. [Google Scholar] [CrossRef]
  31. Crank, J. The Mathematics of Diffusion; Clarendon Press: Oxford, UK, 1875. [Google Scholar]
  32. Zanio, K. Chemical Diffusion in Cadmium Telluride J. Appl. Phys. 1970, 41, 1935–1940. [Google Scholar] [CrossRef]
  33. Kröger, F.A. The defect structure of CdTe. Rev. Phys. Appl. 1977, 12, 205–210. [Google Scholar] [CrossRef]
  34. Borsenberger, P.M.; Stevenson, D.A. Self-diffusion of Cd and Te in CdTe. J. Phys. Chem. Solids 1968, 29, 1277. [Google Scholar] [CrossRef]
  35. Shcherbak, L.; Kopach, O.; Fochuk, P.; Bolotnikov, A.E.; James, R.B. Empirical Correlations between the Arrhenius Parameters of Impurities’ Diffusion Coefficients in CdTe Crystals. J. Phase Equilibria Diffus. 2015, 36, 99–109. [Google Scholar] [CrossRef]
  36. Wilkin, R.T. Cadmium. In Monitored Natural Attenuation of Inorganic Contaminants in Ground Water; Ford, R.G., Wilkin, R.T., Puls, R.W., Eds.; U.S. Environmental Protection Agency: Ada, OK, USA, 2007; Volume 2, pp. 1–9. [Google Scholar]
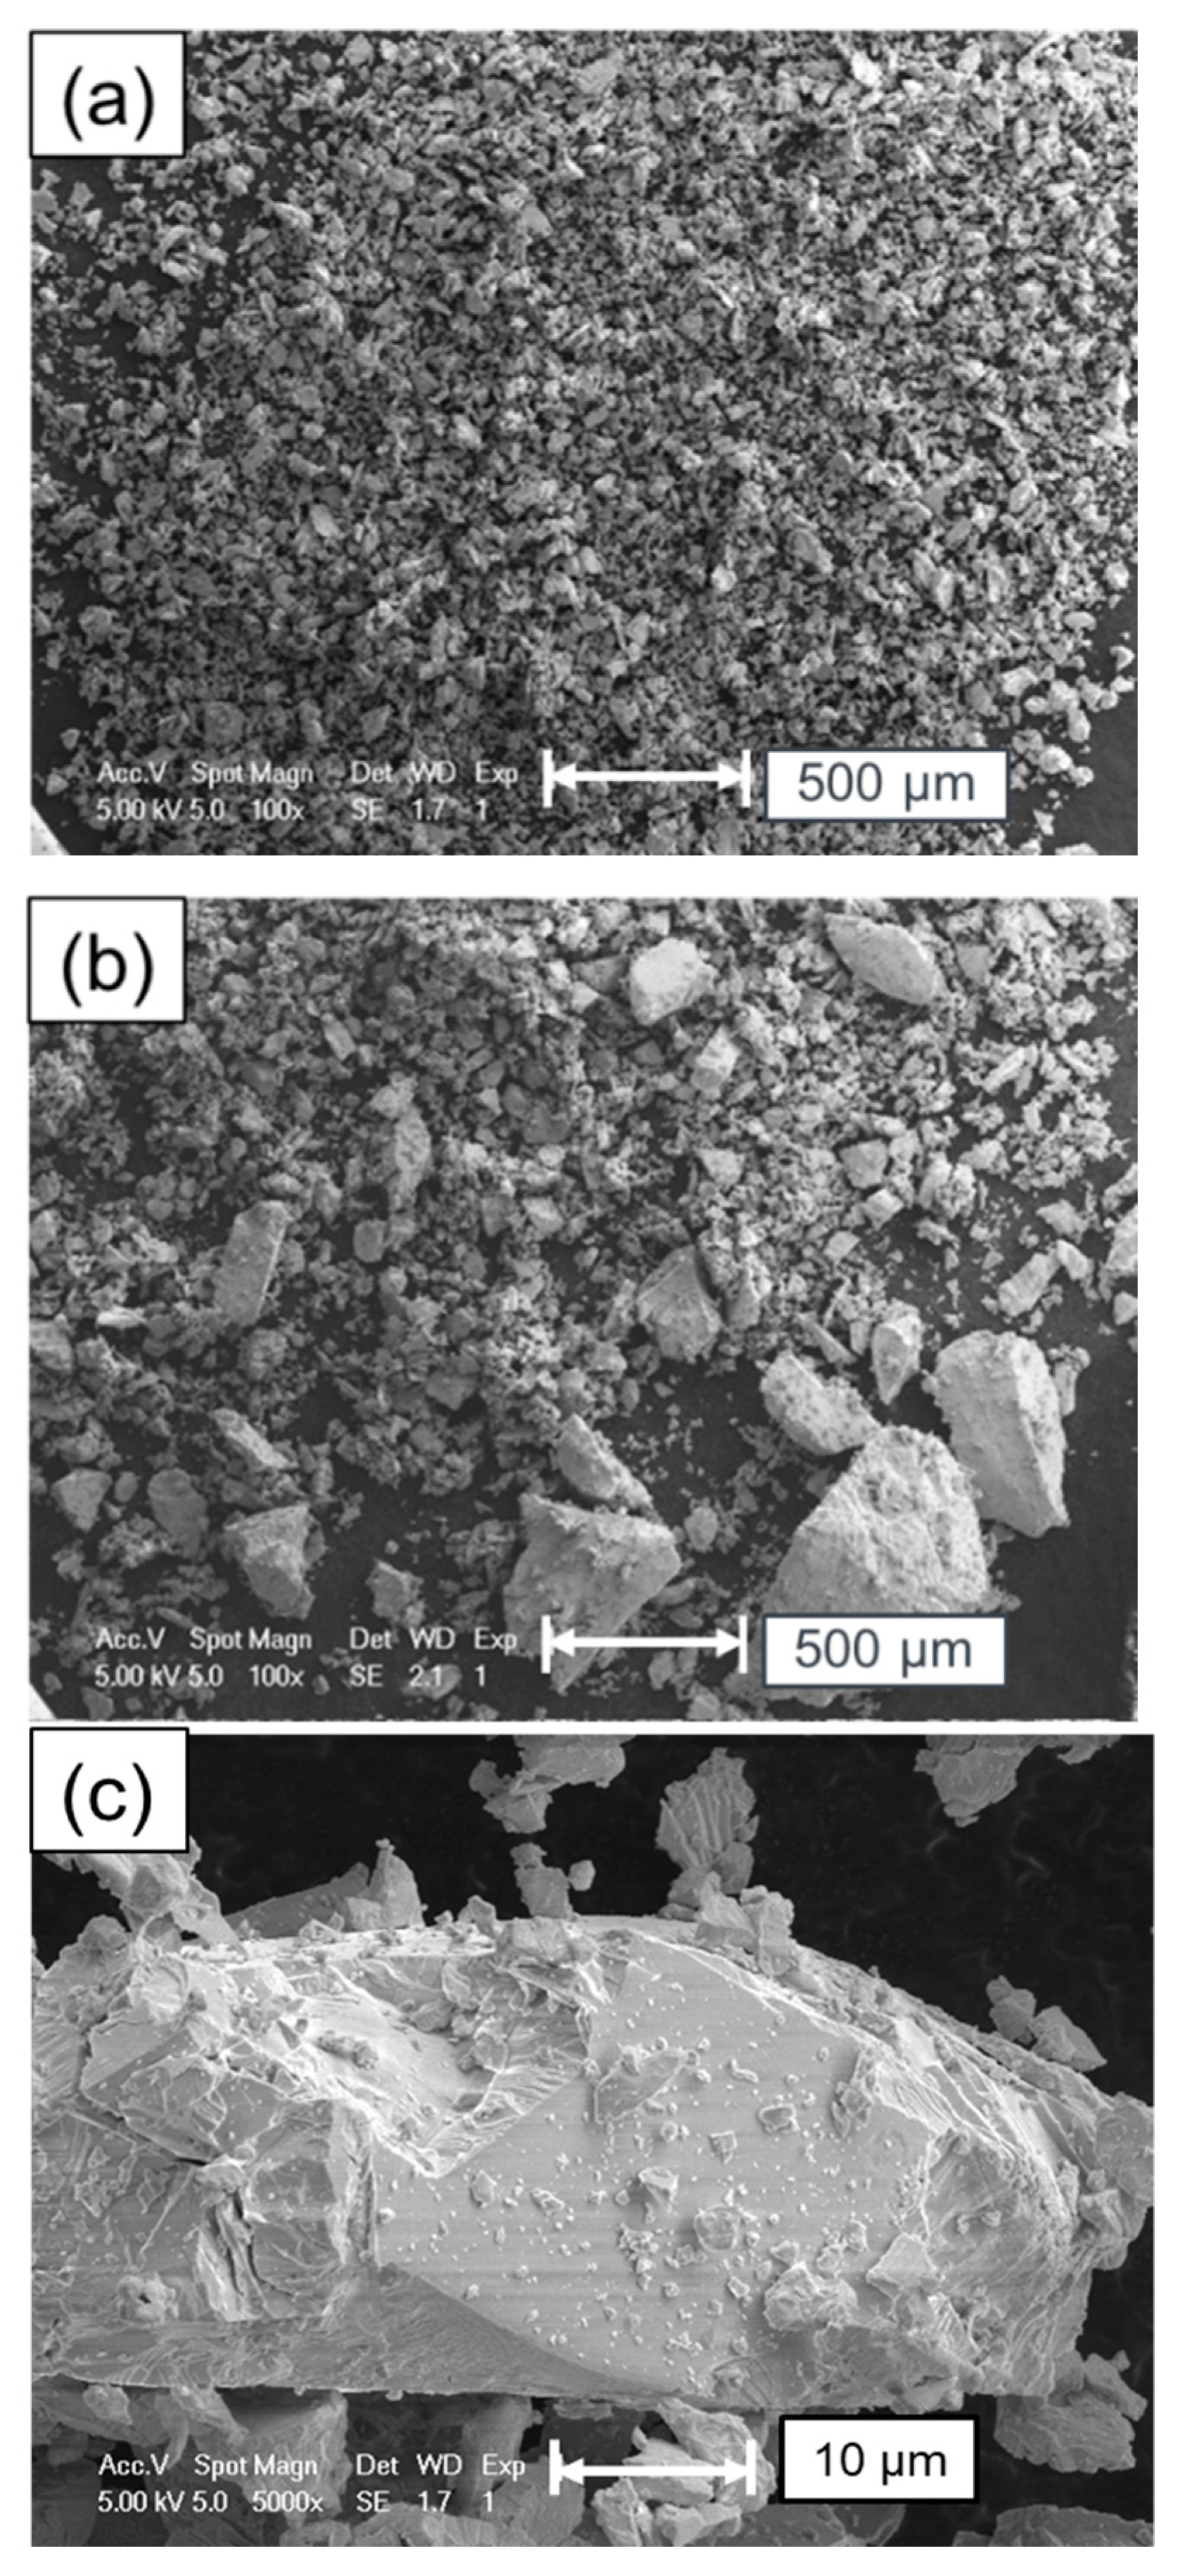
Figure 1. Secondary electron images taken by scanning electron microscope (SEM) of cadmium telluride CdTe powders: (a) CdTe250 with grain sizes d250 < 250 µm and (b) CdTe840 with grain sizes d840 < 840 µm. Due to sieving, the powder contains also smaller sized grains: (c) CdTe250 with grain sizes d250 < 250 µm and (d) CdTe840 with grain sizes d840 < 840 µm with higher resolution.
Energies 14 00398 g001aEnergies 14 00398 g001b
Figure 2. Secondary electron images from milled, unleached CdTe module pieces (a) same resolution as in Figure 1. (b) higher resolution. (c) Higher resolution micrograph from unleached CdTe250 powder for comparison. Compared to the sieved CdTe powders, the milled module pieces have a much smaller mean particle size.
Energies 14 00398 g002aEnergies 14 00398 g002b
Figure 3. Elution of CdpH4 and TepH4 in solutions with pH4 out of three different CdTe powders in comparison to the elution from milled module pieces Cd3,m and Te3,m [6] (uppermost curves). Lines in both figures represent simulations after Equation (2), with CdpH4 ~ tn with the diffusional exponent n = 0.43. (a) Cd3000 released from powder with d3000 ≤ 3000 µm shows the weakest elution; the values Cd250 for powder with d250 ≤ 250 µm are about a factor of 40 higher. Even higher are the Cd3,m-values of the milled module pieces: They almost exceed more than 50% after 56 days. It holds Cd3000 < Cd840 < Cd250 < Cd3,m. (b) Leaching of Te resembles that of Cd: It holds Te3000 < Te840 < Te250 < Te3,m.
Energies 14 00398 g003
Figure 4. Elution of CdpH7 and TepH7 in solutions with pH7 out of CdTe powder. Compared to Figure 2, the absolute values for eluted Cd and Te are lower. However, we observe the same time dependence CdpH7 ~ t0.43 and TePh7 ~ t0.43. (a) The elution of Cd for the CdTe-powder with the smallest grain diameter is the highest, it holds Cd250 > Cd840 ≈ Cd3000. The elution out of Cd840 and Cd3000 show only small differences. (b) Also for Te it holds Te250 > Te840 ≈ Te3000. Elution values from milled CdTe-modules are not available for pH7.
Energies 14 00398 g004
Figure 5. Elution of CdpH10 and TepH10 in solutions with pH10 out of CdTe powder and for milled module pieces. (a) The size dependent leaching of CdpH10 changes when compared to the acidic elution in Figure 1. Here it holds Cd3,m > Cd3000 > Cd840 ≈ Cd250. The Cd3,m-value for the milled modules pieces is highest. (b) Leaching of TepH10 is also size dependent. However, for the powders, there is not much difference for the different particle sizes. The lines, again, represent a fit of Equation (5) with the time dependence t0.43.
Energies 14 00398 g005
Figure 6. Maximum values of the data from Figure 3a,b, Figure 4a,b and Figure 5a,b after t = 83 days, respectively t = 56 days. For acidic conditions (pH4) more Cd than Te is found in the solution, for neutral conditions (pH7) the relative amount of Cd and Te in solution is about the same, whereas for alkaline conditions (pH10) the tendency is less Cd than Te in the solution. The smaller the particles, the more Cd and Te is found in the solutions.
Energies 14 00398 g006
Figure 7. Eluted Cd and Te out of CdTe250-powder after t = 83 d in aqueous solutions with pH4, pH7 and pH10. The powder is processed like CdTe in solar cells. Data for Cd3,m and Te3,m out of milled CdTe-modules (black data) are only available until t = 56 d in pH4 and pH10 [6]. (a) Activation (green data) increases the elution of Cd in pH4. While it holds Cdact > Cd250 etching to Cdetch (red data) and the combination of activation and etching Cdact+etch (grey data) decreases eluted Cd. Nonetheless, however, the data from the milled modules, Cd3,m, (black data) are highest. Leaching in pH7 and pH10 shows different absolute values. (b) In the case of Te, activation, etching and the combination of both increase the elution of Te250 in pH4 while in pH7 and pH10 only Teetch and Teact+etch increase to Te3,m. Activation only decreases the elution of Te in pH7 when compared to the unprocessed powder (blue data), while for pH10, the Te elution is only slightly increased.
Energies 14 00398 g007
Figure 8. Same CdTe powders as in Figure 1a, b but after leaching in aqueous solution with pH4 for t = 274d. (a) In the CdTe250 powder, the smaller particles disappear (compared with Figure 1a), leaving back particles with diameters d250,274d ≈ 100 µm. (b) In the CdTe840-powder, the small particles are dissolved fast, leaving back mainly particles with d840,274d > 100 µm.
Energies 14 00398 g008
Figure 9. Surface of CdTe250 powder shown by secondary electron images. (a) Initial, untreated powder; (b) “Solar cell-like activation” deposits CdCl2; (c) “solar cell-like etching” forms steps on the particles grains; (d) “Solar cell-like activation and etching” creates etch steps and pits; (a1) Initially untreated powder after 20 d of leaching in pH4-solution. (b1) “Activated” powder after 20 days of leaching; (c1) “Etched” powder after 20 d of leaching; (d1) “Activated and etched” powder after 20 d of leaching; (a2) Originally untreated powder after 274 d of leaching; (b2) “Activated” powder after 274 d of leaching. (c2) “Etched” powder after 274 d of leaching. (d2) “Activated and etched” powder after 274 d.
Energies 14 00398 g009aEnergies 14 00398 g009b
Figure 10. Energy-dispersive X-ray (EDX) spectroscopy data of CdTe250 powders with differently treated surfaces. The surface treatments change the ratio of Cd to Te at the surface, represented by the relative heights of the peaks. “Activation” in CdCl2 (green curve) leads to a deposition of Cl and lowers the Te concentration in relation to Cd. In contrast, “etching” (red curve) increases the Te concentration and lowers the Cd concentration. “activation plus etching” (grey curve) also leaves a (relatively) more Te-rich surface when compared to the original surface (blue curve). Clearly, for Te-rich surfaces, the elution of Te is increased (compare Figure 6b).
Energies 14 00398 g010
Table 1. Relative ratios of the dilution rates for the different CdTe powders and the milled module pieces compared to the relative surface to volume ratio from Equation (2). For pH4 the elution of Cd as well as for Te is in good agreement with Equation (2). For pH7 there is a noticeable and for pH10 a strong deviation from Equation (2), in particular if one compares the leached module pieces with the powders for pH10. For the powders, the elution is much more suppressed, probably via a chemical passivation of the surface of the powder particles.
FigureCd3,m/Cd250Cd250/Cd250Cd840/Cd250Cd3000/Cd250Te3,m/Te250Te250/Te250Te840/Te250Te3000/Te250
Equation (2)-510.5<<0.5510.5<< 0.5
pH43a5.410.40.03----
3b----510.50.03
pH74a-10.150.1----
4b-----10.150.1
pH105a≈ 5001≈ 14----
5b----≈ 10010.4≈ 1
Publisher’s Note: MDPI stays neutral with regard to jurisdictional claims in published maps and institutional affiliations.