Mooring Angle Study of a Horizontal Rotor Wave Energy Converter


Abstract
1. Introduction
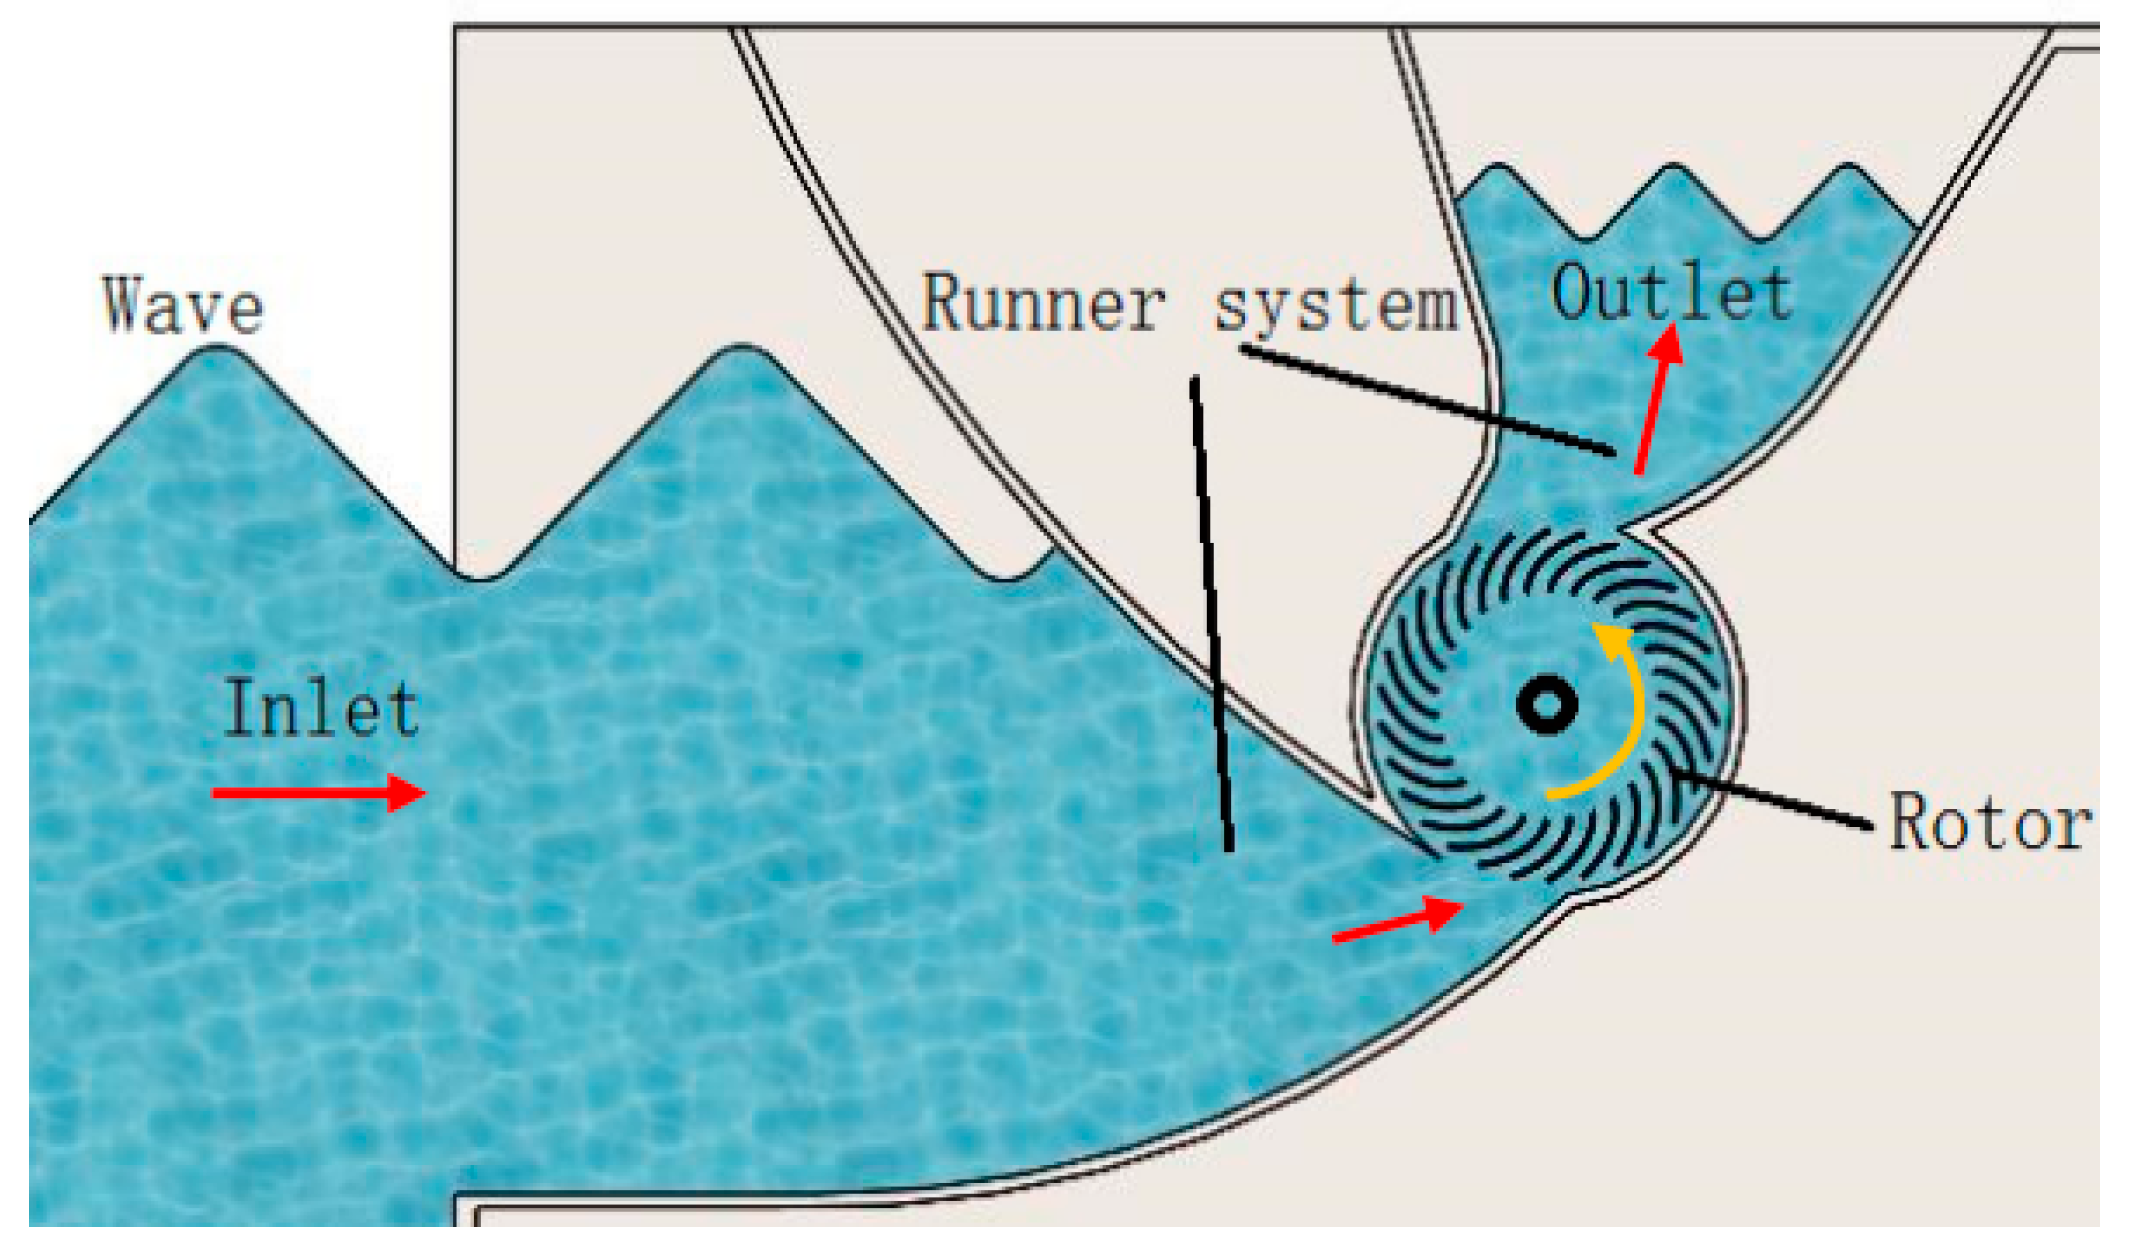
2. Principal Basis
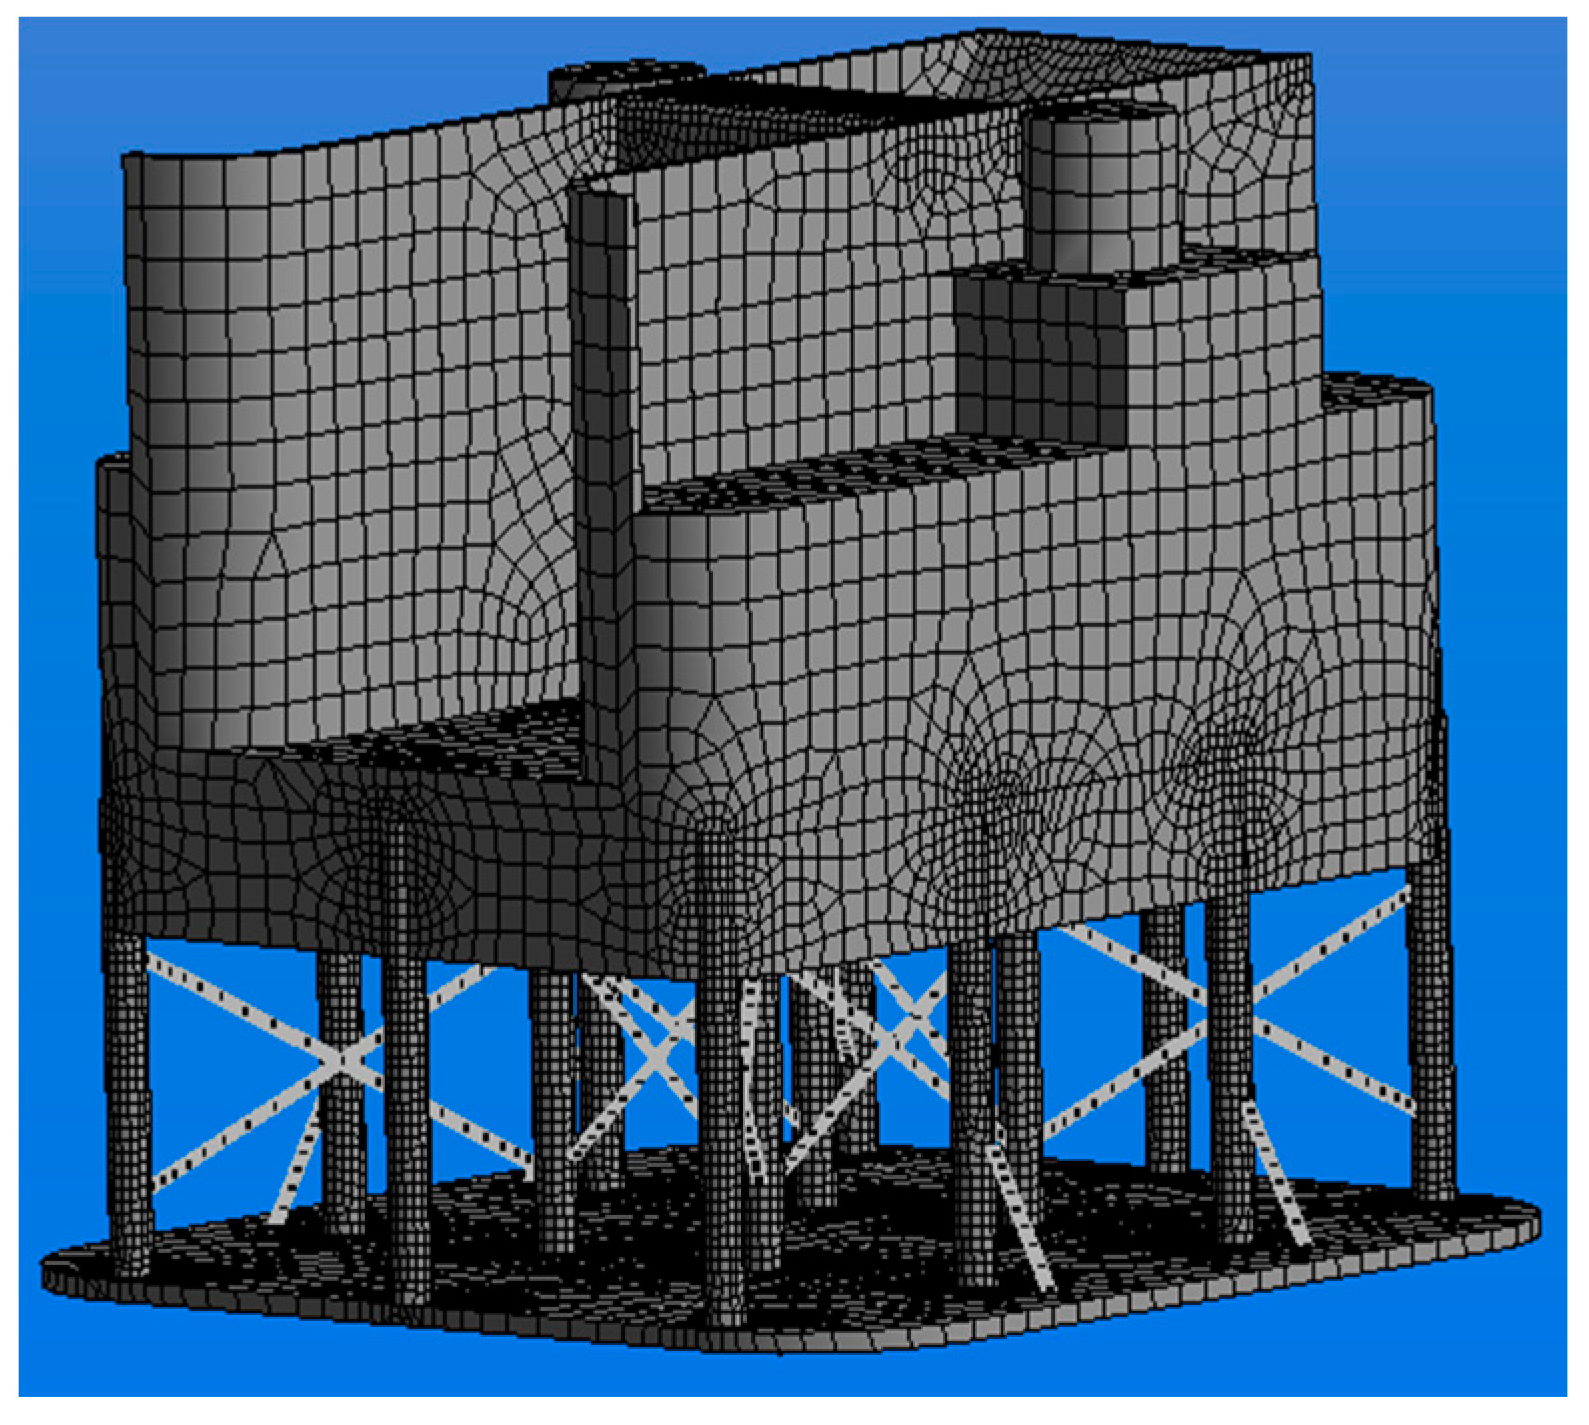
3. Analogue Simulation
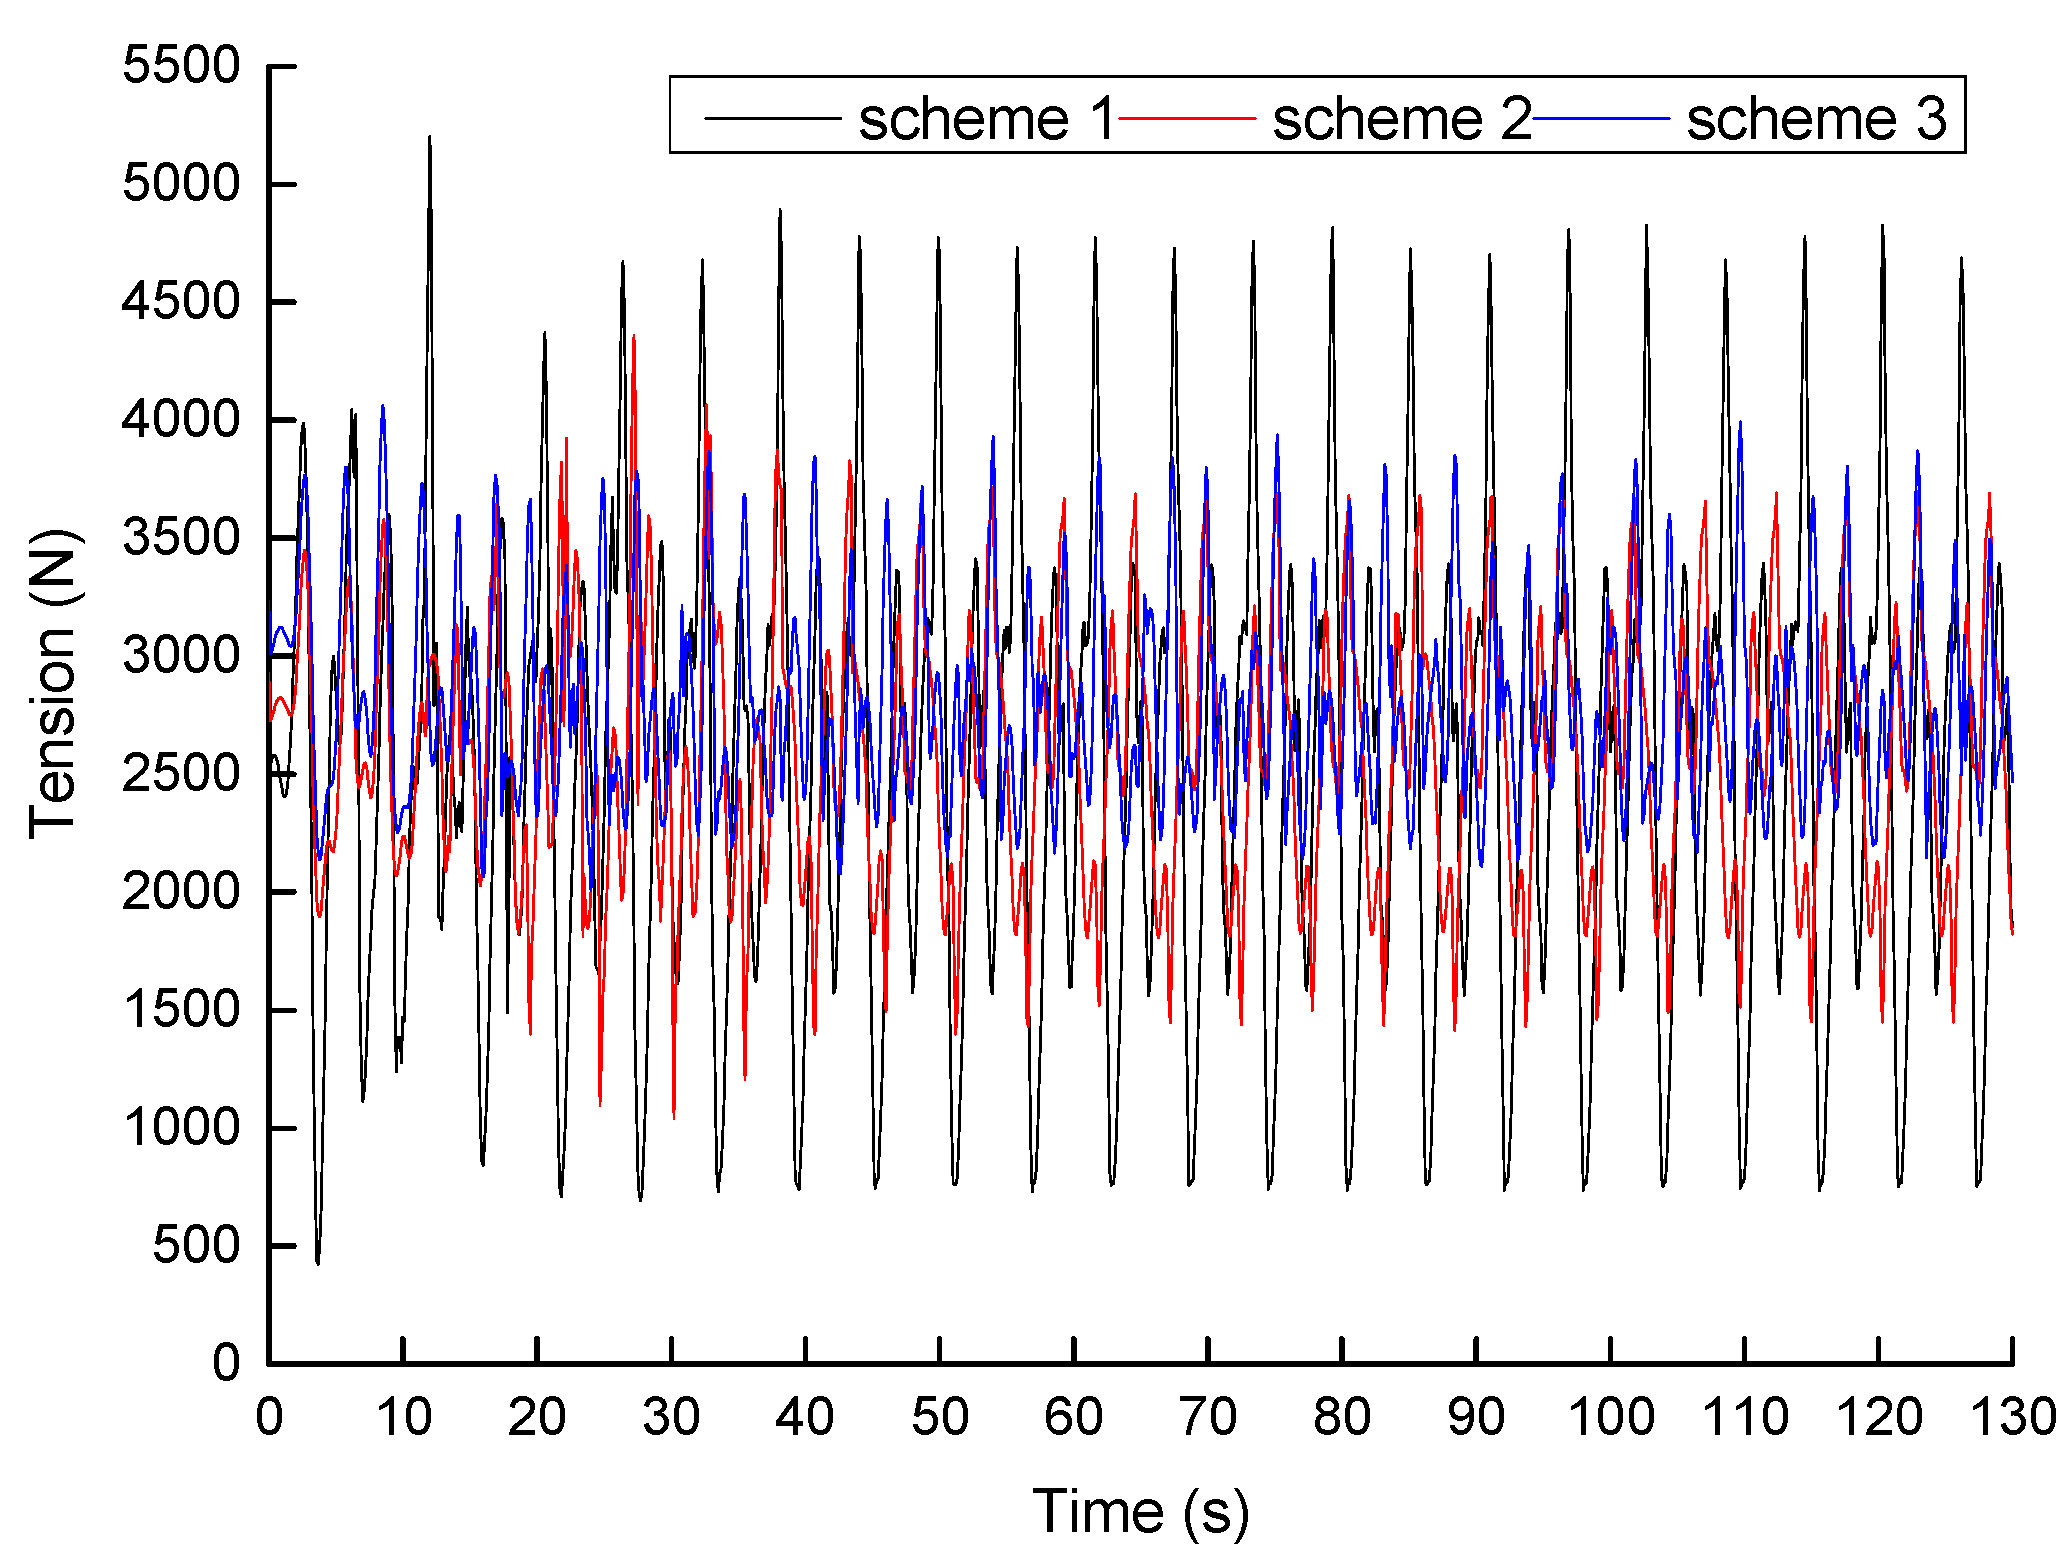
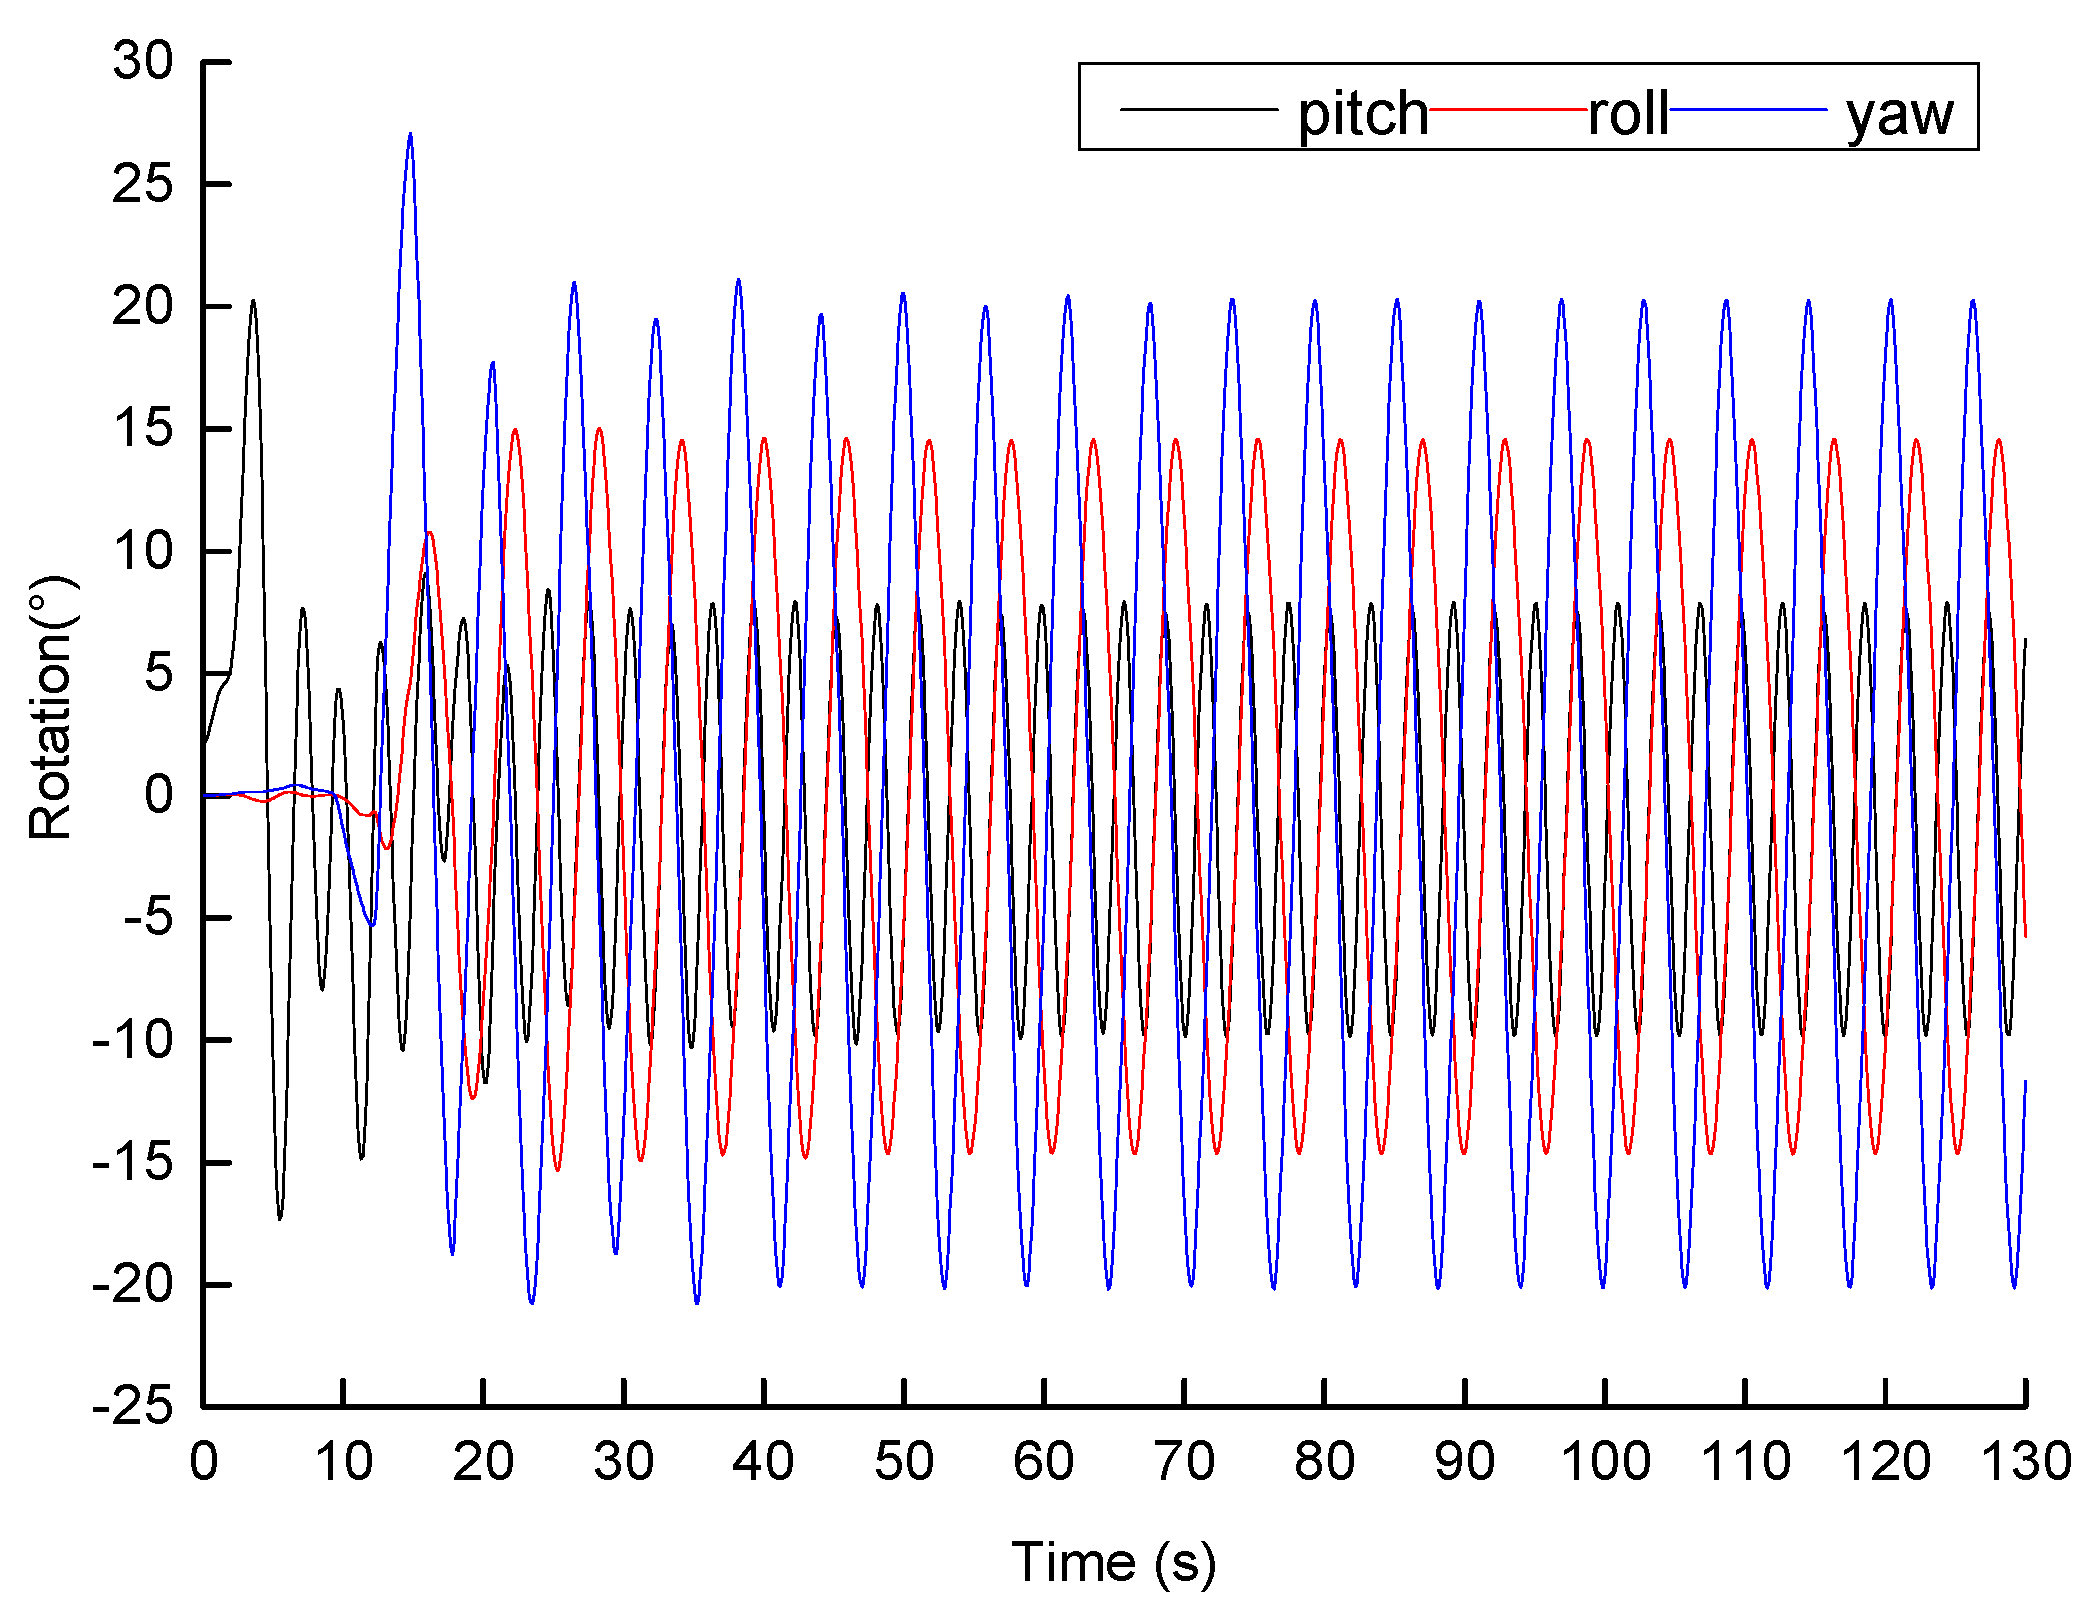
4. Experiment Validation
5. Conclusions
Author Contributions
Funding
Acknowledgments
Conflicts of Interest
References
- Østergaard, P.A.; Duic, N.; Noorollahi, Y.; Mikulčić, H.; Kalogirou, S. Sustainable Development Using Renewable Energy Technology. Renew. Energy 2020, 146, 2430–2437. [Google Scholar] [CrossRef]
- Segura, E.; Morales, R.; Somolinos, J. A strategic Analysis of Tidal Current Energy Conversion Systems in the European Union. Appl. Energy 2018, 212, 527–551. [Google Scholar] [CrossRef]
- Melikoglu, M. Current Status and Future of Ocean Energy Sources: A global Review. Ocean Eng. 2018, 148, 563–573. [Google Scholar] [CrossRef]
- Roy, A.; Auger, F.; Dupriez-Robin, F.; Bourguet, S.; Tran, Q.-T. Electrical Power Supply of Remote Maritime Areas: A Review of Hybrid Systems Based on Marine Renewable Energies. Energies 2018, 11, 1904. [Google Scholar] [CrossRef]
- Aderinto, T.; Li, H. Ocean Wave Energy Converters: Status and Challenges. Energies 2018, 11, 1250. [Google Scholar] [CrossRef]
- Mwasilu, F.; Jung, J. Potential for Power Generation from Ocean Wave Renewable Energy Source: A Comprehensive Review on State-of-the-Art Technology and Future Prospects. IET Renew. Power Gener. 2019, 13, 363–375. [Google Scholar] [CrossRef]
- Qiu, S.; Liu, K.; Wang, D.; Ye, J.; Liang, F. A Comprehensive Review of Ocean Wave Energy Research and Development in China. Renew. Sustain. Energy Rev. 2019, 113, 113–109271. [Google Scholar] [CrossRef]
- Hou, J.; Zhu, X.; Liu, P. Current Situation and Future Projection of Marine Renewable Energy in China. Int. J. Energy Res. 2019, 43, 662–680. [Google Scholar] [CrossRef]
- Chang, Y.-C.; Wang, N. Legal System for the Development of Marine Renewable Energy in China. Renew. Sustain. Energy Rev. 2017, 75, 192–196. [Google Scholar] [CrossRef]
- National Energy Administration. The 13th Five-Year Plan for Renewable Energy Development (Part 1). Sol Energy. 2017, 2, 5–11. [Google Scholar]
- Liu, Z.; Hyun, B.-S.; Hong, K. Numerical Study of air Chamber for Oscillating Water Column Wave Energy Convertor. China Ocean Eng. 2011, 25, 169–178. [Google Scholar] [CrossRef]
- Doyle, S.; Aggidis, G.A. Development of Multi-Oscillating Water Columns as Wave Energy Converters. Renew. Sustain. Energy Rev. 2019, 107, 75–86. [Google Scholar] [CrossRef]
- Martin, D.; Li, X.; Chen, C.-A.; Thiagarajan, K.; Ngo, K.; Parker, R.G.; Liu, M. Numerical Analysis and Wave Tank Validation on the Optimal Design of a Two-Body Wave Energy Converter. Renew. Energy 2020, 145, 632–641. [Google Scholar] [CrossRef]
- Martins, J.; Goulart, M.; Gomes, M.D.N.; Souza, J.A.; Rocha, L.; Isoldi, L.A.; Dos Santos, E.D. Geometric Evaluation of the Main Operational Principle of an Overtopping Wave Energy Converter by Means of Constructal Design. Renew. Energy 2018, 118, 727–741. [Google Scholar] [CrossRef]
- Phan, C.B. A Study on Design and Simulation of the Point Absorber Wave Energy Converter Using Mechanical PTO. In Proceedings of the 4th International Conference on Green Technology and Sustainable Development (GTSD), Ho Chi Minh City, Vietnam, 23–24 November 2018; pp. 122–125. [Google Scholar]
- Guo, X.; Wu, Y. Research on Power Bandwidth Design Method of Direct Drive Turbine Wave Energy Utilization Device. J. Hydro Eng. 2013, 32, 197–203. [Google Scholar]
- Nguyen, H.; Wang, C.; Tay, Z.; Luong, V. Wave Energy Converter and Large Floating Platform Integration: A review. Ocean Eng. 2020, 213, 107768. [Google Scholar] [CrossRef]
- Li, N.; Cheung, K.F.; Cross, P. Numerical Wave Modeling for Operational and Survival Analyses of Wave Energy Converters at the US Navy Wave Energy Test Site in Hawaii. Renew. Energy 2020, 161, 240–256. [Google Scholar] [CrossRef]
- Vieira, F.; Cavalcante, G.; Campos, E.; Taveira-Pinto, F. Wave Energy Flux Variability and Trend Along the United Arab Emirates Coastline Based on a 40-Year Hindcast. Renew. Energy 2020, 160, 1194–1205. [Google Scholar] [CrossRef]
- Mctiernan, K.L.; Sharman, K.T. Review of Hybrid Offshore Wind and Wave Energy Systems. J Phys Confser. 2020, 1452, 12016. [Google Scholar] [CrossRef]
- Kim, B.-H.; Wata, J.; Zullah, M.A.; Ahmed, M.R.; Lee, Y.-H. Numerical and Experimental Studies on the PTO System of a Novel Floating Wave Energy Converter. Renew. Energy 2015, 79, 111–121. [Google Scholar] [CrossRef]
- Ren, W. Dynamic Analysis of Flexible Direct-Drive Wave Power Turbines. Master’s Thesis, Shanghai Ocean University, Shanghai, China, 2016. [Google Scholar]
- Li, Z. Research on Braking Strategy and Realization Method of Tidal Current Energy Turbine. Master’s Thesis, Harbin Engineering University, Harbin, China, 2016. [Google Scholar]
- Jing, F. A New Type of Floating Tidal Current Energy Device Hydrodynamic Research. Ph.D. Thesis, Harbin Engineering University, Harbin, China, 2013. [Google Scholar]
- Wang, S.; Li, M.; Li, Z. Overview of International Tidal Current Energy Utilization Technology Development. Ship Eng. 2020, 42, 23–28. [Google Scholar]
- Wang, K.; Er, G.-K.; Iu, V.P. Nonlinear Random Vibrations of 3D Cable-Moored Floating Structures Under Seismic and Wave Excitations. J. Sound Vib. 2019, 452, 58–81. [Google Scholar] [CrossRef]
- Chen, F.; Duan, D.; Han, Q.; Yang, X.; Zhao, F. Study on Force and Wave Energy Conversion Efficiency of Buoys in Low Wave Energy Density Seas. Energy Convers. Manag. 2019, 182, 191–200. [Google Scholar] [CrossRef]
- Hou, H.-M.; Dong, G.-H.; Xu, T.-J.; Zhao, Y.-P. System Reliability Evaluation of Mooring System for Fish Cage Under Ultimate Limit State. Ocean Eng. 2019, 172, 422–433. [Google Scholar] [CrossRef]
- Barrera, C.; Losada, I.J.; Guanche, R.; Johanning, L. The Influence of Wave Parameter Definition Over Floating Wind Platform Mooring Systems Under Severe Sea States. Ocean Eng. 2019, 172, 105–126. [Google Scholar] [CrossRef]
- Pham, H.-D.; Schoefs, F.; Cartraud, P.; Soulard, T.; Pham, H.-H.; Berhault, C. Methodology for Modeling and Service Life Monitoring of Mooring Lines of Floating Wind Turbines. Ocean Eng. 2019, 193, 106603. [Google Scholar] [CrossRef]
- Shen, K.; Guo, Z.; Wang, L. Prediction of the Whole Mooring Chain Reaction to Cyclic Motion of a Fairlead. Bull. Int. Assoc. Eng. Geol. 2019, 78, 2197–2213. [Google Scholar] [CrossRef]
- Ghafari, H.; Dardel, M. Parametric Study of Catenary Mooring System on the Dynamic Response of the Semi-Submersible Platform. Ocean Eng. 2018, 153, 319–332. [Google Scholar] [CrossRef]
- Xue, X.; Chen, N.-Z.; Wu, Y.; Xiong, Y.; Guo, Y. Mooring System Fatigue Analysis for a Semi-Submersible. Ocean Eng. 2018, 156, 550–563. [Google Scholar] [CrossRef]
- Sun, Y.; Sun, Z.; Cao, W.; Xi, G. Numerical Study on Hydrodynamic Characteristics of Moored Offshore Floating Platform. J. Eng. Thermophys. 2018, 39, 307–313. [Google Scholar]
- Whang, J.; Jiao, E.; Zhang, B. Research on Anchoring Model Test of Offshore Steel Aquaculture Platform. Fish Modern. 2018, 45, 28–33. [Google Scholar]
- Johanning, L.; Smith, G.H.; Wolfram, J. Mooring Design Approach for Wave Energy Converters. Proc. Inst. Mech. Eng. Part M J. Eng. Marit. Environ. 2006, 220, 159–174. [Google Scholar] [CrossRef]
- Wei, S.; Wang, Y.; Gao, M. Design of Mooring System for Ultra-Shallow Water Multi-Body Wave Energy Power Generation Device. Ship Eng. 2017, 39, 70–76. [Google Scholar]
- Jiao, E.; Zhang, Y.; Wang, J. Experimental Study on the Mooring of the Pond of the Cage Culture Platform in the South China Sea. In Proceedings of the 2016 Annual Meeting of the Chinese Fisheries Society, Chengdu, China, 3-4 November 2016. [Google Scholar]
- Wang, Y.-H.; Wamg, L.; Wang, X.-F.; Xu, S.-W. Numerical Simulation Study on the Mooring System of the Extremely Shallow Semi-Submersible Platform in the South China Sea Islands. Ship Sci. Tech. 2017, 39, 68–73. [Google Scholar]
- Wang, S.; Liu, H.; Guo, G.; Tao, Q.; Huang, X.; Hu, Y. Design of Multi-Point Mooring System for Marine Aquaculture Platform Based on Dynamic Analysis Method. Trans. Chin. Soc. Agric. Eng. 2017, 33, 217–223. [Google Scholar]
- Wu, Z.; Ye, Z.; Cheng, X.; Gao, Y.; Li, C. Analysis of static and dynamic characteristics of tension leg platform for floating offshore wind turbine. J. Power Eng. 2016, 2, 151–156, 161. [Google Scholar]
- Shuo, H.; Yage, Y.; Sheng, S. Numerical Study on the Elastic Mooring System of Shallow-Water Floating Wave Energy Power Generation Devices. In Proceedings of the 27th National Hydrodynamics Symposium, Nanjing, China, 6-11 November 2015. [Google Scholar]
- Xiao, Z. Research on the Basic Hydrodynamic Characteristics of Offshore Wind Turbines. Master’s Thesis, Hunan University, Changsha, China, 2016. [Google Scholar]
- Ni, X.; Cheng, X.; Wu, B.; Wang, X. Coupled Analysis Between Mooring System and VLFS with an Effect of Elastic Deflection of Floater. Ocean Eng. 2018, 165, 319–327. [Google Scholar] [CrossRef]
- CellMed AG. GLP-1 CellBeads® for the Treatment of Stroke Patients With Space-Occupying Intracerebral Hemorrhage. NCT01298830. Available online: http://www.clinicaltrials.gov (accessed on 13 May 2016).
- Han, L.; Wang, J.; Gao, J. Analysis of Wave Energy Resources in the Sea Areas North of Chu Island, Shandong. J. Sol. Energ. 2020, 41, 165–171. [Google Scholar]
- Fan, T.; Ren, N.; Cheng, Y.; Chen, C.; Ou, J. Applicability Analysis of Truncated Mooring System Based on Static and Damping Equivalence. Ocean Eng. 2018, 147, 458–475. [Google Scholar] [CrossRef]
- Xu, S.; Ji, C.-Y. Dynamics of Large-Truncated Mooring Systems Coupled with a Catenary Moored Semi-Submersible. China Ocean Eng. 2014, 28, 149–162. [Google Scholar] [CrossRef]
- Zhu, G.; Wu, J. Calculation of Mooring Catenary Length Based on Parabola Method. China W. Transp. (Second Half) 2013, 13, 140–169. [Google Scholar]
- Yu, J. Determination of the Length of the Ship’s Chain at Anchor. Tianjin Navig. 1996, 2, 6–8. [Google Scholar]


| Device Parameters | Prototype Data | Unit |
|---|---|---|
| Total height of the device | 5.443 | m |
| Length of the main float | 6.000 | m |
| Width of the main float | 4.412 | m |
| Height of the main float | 2.948 | m |
| Damping disc length | 6.000 | m |
| Damping disc width | 6.000 | m |
| Damping plate height | 2.495 | m |
| Depth of the draft | 4.697 | m |
| Center of gravity height | 2.684 | m |
| Displacement | 30,900.000 | kg |
| Experiment Condition | Prototype Value | Model Value | ||
|---|---|---|---|---|
| Parameter | Wave Height H (m) | Cycle T (sec) | Wave Height H (m) | Cycle T (sec) |
| Case | 0.7 | 3.6 | 0.07 | 1.15 |
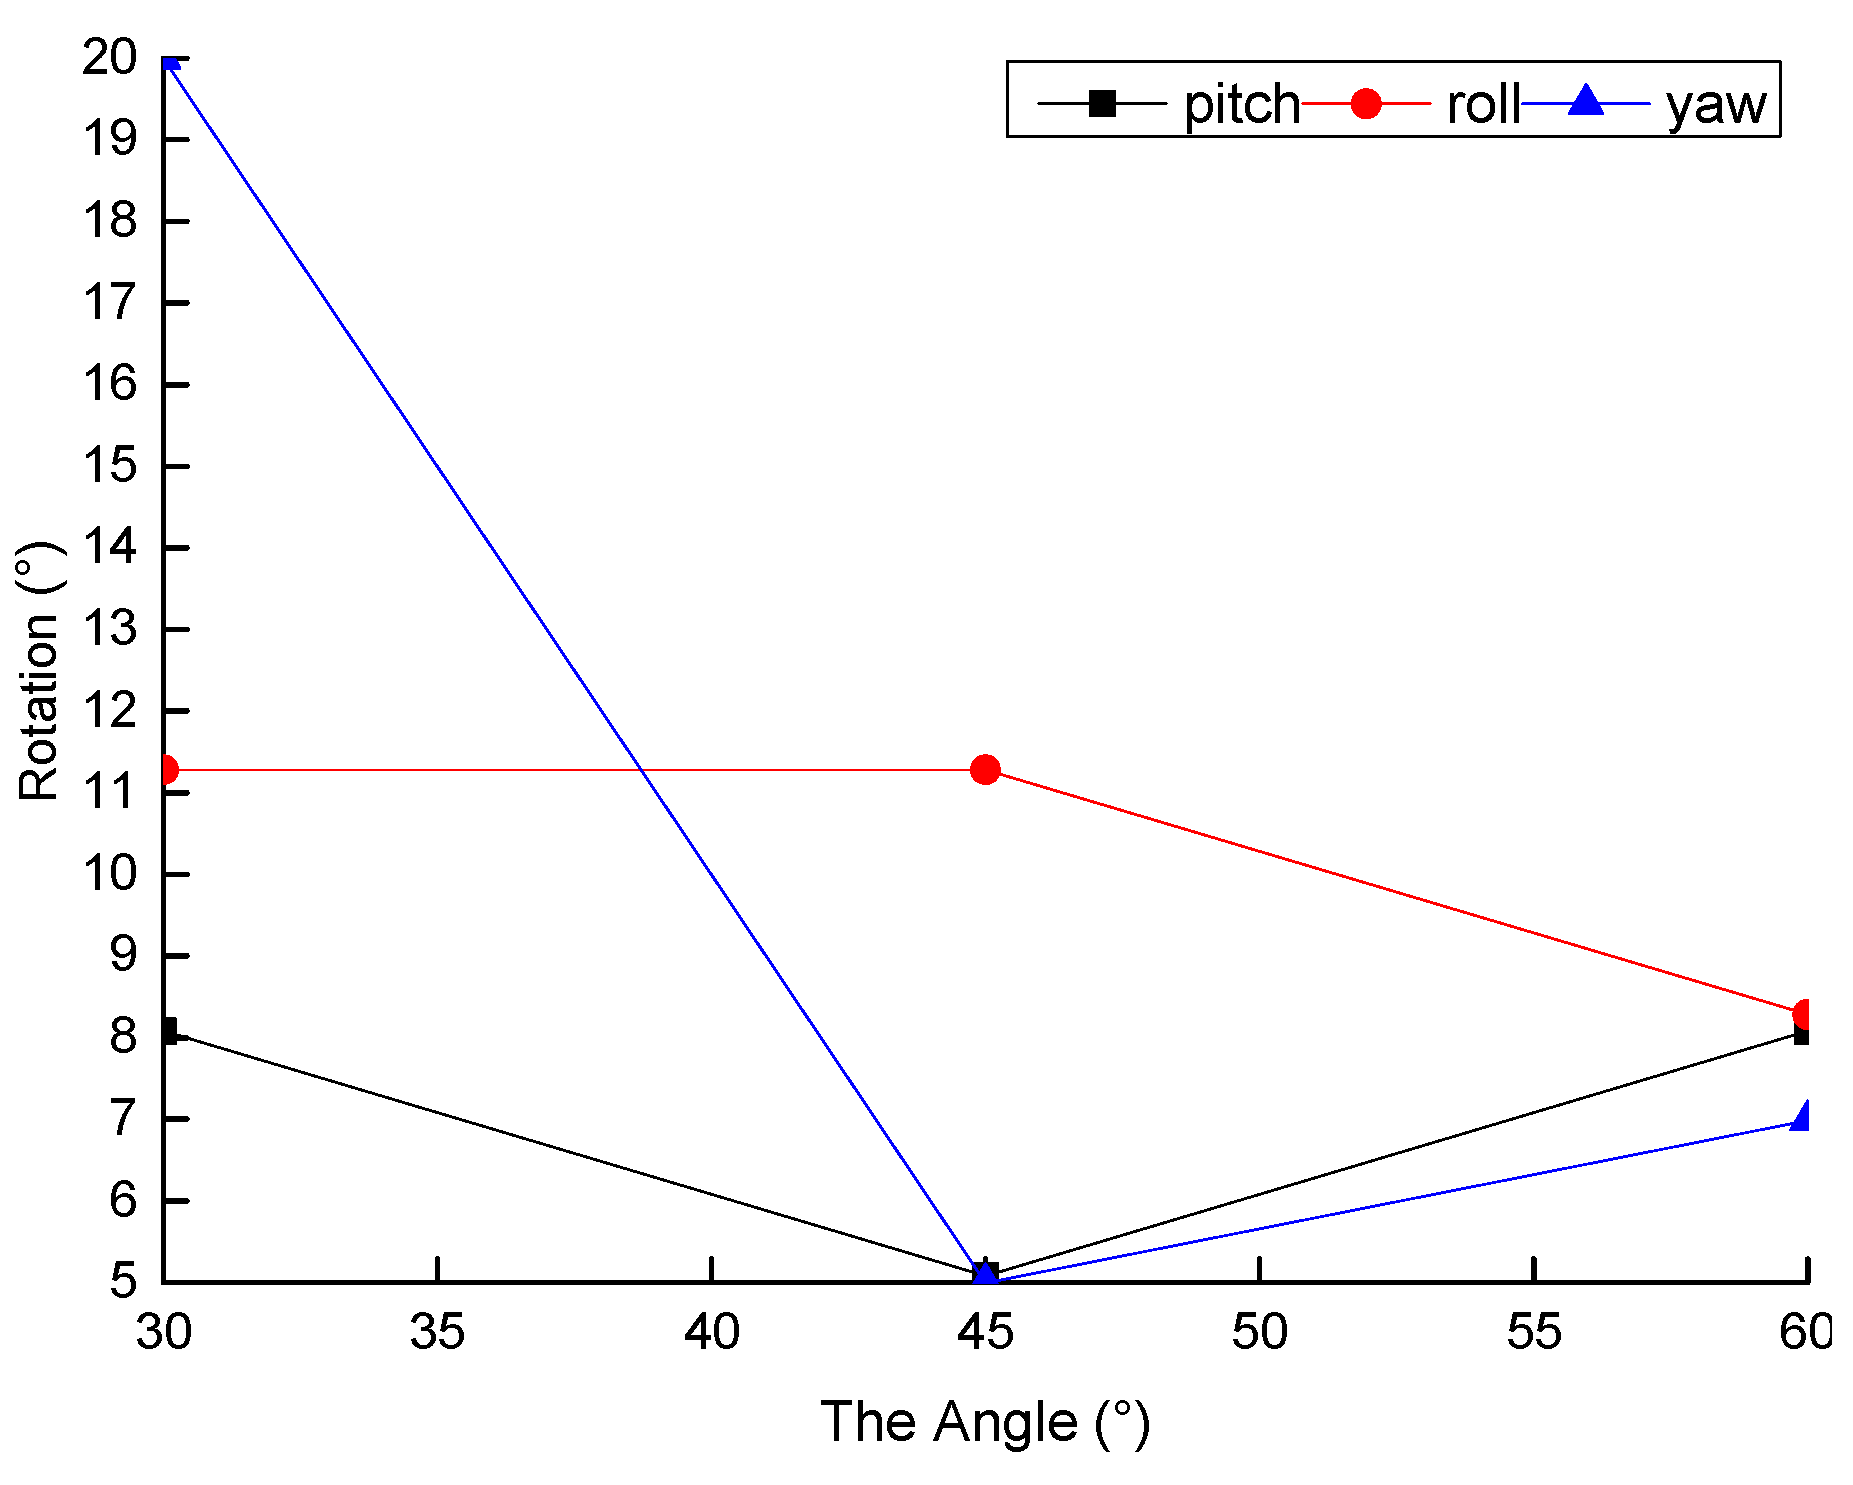
| Rotation Angle | Average Value (°) | ||
|---|---|---|---|
| Scheme 1 | Scheme 2 | Scheme 3 | |
| Pitch | 8.08 | 5.08 | 8.08 |
| Roll | 11.28 | 11.28 | 8.28 |
| Yaw | 19.99 | 4.99 | 6.99 |
Publisher’s Note: MDPI stays neutral with regard to jurisdictional claims in published maps and institutional affiliations. |
© 2021 by the authors. Licensee MDPI, Basel, Switzerland. This article is an open access article distributed under the terms and conditions of the Creative Commons Attribution (CC BY) license (http://creativecommons.org/licenses/by/4.0/).
Share and Cite
Meng, Z.; Liu, Y.; Qin, J.; Sun, S. Mooring Angle Study of a Horizontal Rotor Wave Energy Converter. Energies 2021, 14, 344. https://doi.org/10.3390/en14020344
Meng Z, Liu Y, Qin J, Sun S. Mooring Angle Study of a Horizontal Rotor Wave Energy Converter. Energies. 2021; 14(2):344. https://doi.org/10.3390/en14020344
Chicago/Turabian StyleMeng, Zhongliang, Yanjun Liu, Jian Qin, and Shumin Sun. 2021. "Mooring Angle Study of a Horizontal Rotor Wave Energy Converter" Energies 14, no. 2: 344. https://doi.org/10.3390/en14020344
APA StyleMeng, Z., Liu, Y., Qin, J., & Sun, S. (2021). Mooring Angle Study of a Horizontal Rotor Wave Energy Converter. Energies, 14(2), 344. https://doi.org/10.3390/en14020344