Article

The Effect of Salt on Stability of Aqueous Foams

1
Mewbourne School of Petroleum and Geological Engineering, University of Oklahoma, Norman, OK 73019, USA
2
Petroleum Engineering Department, Texas A&M University at Qatar, Doha 23874, Qatar
*
Author to whom correspondence should be addressed.
Energies 2021, 14(2), 279; https://doi.org/10.3390/en14020279
Submission received: 1 December 2020 / Revised: 28 December 2020 / Accepted: 30 December 2020 / Published: 6 January 2021
(This article belongs to the Special Issue Advances in Drilling Fluid Technology)

Abstract

:
The properties of foams are often affected by environmental variables such as salt contamination. The objective of this study is to investigate the impact of salt on the drainage behavior of aqueous foams. To accomplish this objective, drainage experiments were conducted on aqueous foams. Test variables were foam quality (40–65%), and salt content (0% to 18%), and type. To investigate drainage, the foam was generated in a flow loop and trapped in a vertical test section. Then, the pressure profile in the foam column was measured using ten pressure sensors. Foam drainage is determined as a function of time using measured pressure profiles. The results show that the drainage of NaCl-containing foams decreased with foam quality, whereas the CaCl2-containing foams did not exhibit a clear trend with foam quality. The effect of salt content on foam rheology was minimal.

1. Introduction

1.1. Overview of Foam

Foam is a dispersion of gas bubbles in a continuous liquid phase that exhibits structure. Due to its film structure, foam is a thermodynamically unstable fluid that undergoes processes such as gravitational drainage, coalescence, and Ostwald ripening [1,2,3,4]. Gravity drainage is the major cause of foam decay, which occurs due to the density difference between liquid and gas; the liquid flows downward because of the gravitational force. The coalescence of the foam bubbles occurs because of pressure differences between small and large bubbles when they come in contact. The coalescence of the gas bubbles causes destabilization of the foam as large gas bubbles are less stable as compared to small bubbles [5]. The Ostwald ripening (bubble coarsening) happens when small gas bubbles merge into larger ones, which are less stable due to thinner film [6].
The factors that affect foam stability include foam quality, surfactant concentration, pH, temperature, impurities, presence of polymers, foam generation method, surface tension, and base fluid type [4,7,8]. The quality of foam is the most critical factor in determining its stability. Depending on its quality, foams can be classified as wet or dry foam. Wet foams have high liquid content and weak structure. Dry foams exhibit a rigid liquid film structure, and they have better stability than wet foams [5,9]. The transition from wet to dry foam occurs at high (above 75%) foam qualities. Dry foams have a smaller drainage volume as compared to wet foams. This is due to the increased viscous resistance of the thin-film network in dry foams. The structure of foam varies with quality because the amount of the available liquid phase determines the liquid film structure and thickness [7,8,10]. The transition from wet to dry foam causes a structural change from spherical to polyhedral shape [11].
The three mechanisms responsible for foam generation are (i) particle absorption at gas–liquid interface, (ii) stratification of nonabsorbing particles, and (iii) variations in capillary pressure because of the presence of small and adsorbed particles. Surfactants are added to the base liquid to generate more stable foam by reducing interfacial tension and forming stable films. The surfactants adhere to the gas–liquid interface to form a more stable film. Dong et al. [12] observed that the particles of the surfactant adsorbed to the surface of bubbles, plateau border, and lamella between bubbles. As drainage starts, the particles at the plateau border form a dense film around the bubble surface to improve stability by reducing coalescence when bubbles meet. Particles lodged at the lamella form a consistent network structure and bubbles trapped in the array of particles improve the stability of foams.

1.2. Application of Foam in Drilling

Foam has been used extensively in the oil industry because of its unique properties, such as low density and high viscosity, that can be controlled by its quality and base liquid viscosity. These unique characteristics make it appropriate for various oil field applications, including drilling, completion, fracturing, and other operations. The distinct characteristics of foam that make it desirable as a drilling fluid are improved well stability, high lifting capacity, minimal risk of lost circulation, increased rate of penetration, friction reduction, reduction in shale swelling in water-sensitive formations, reduced risk of differential sticking, and better formation evaluation logs due to the elimination of filtrate penetration and the associated formation damage [11].
The hole cleaning capacity of foam depends on the annular velocity and its rheology, which is mainly influenced by its quality and the base fluid viscosity [13]. The non-Newtonian behavior of foam ensures optimum hole cleaning [14]. The stability and flow properties of foams are more complex than those observed in conventional drilling fluids. The stability of foam strongly affects its flow behavior and hole cleaning capacity. As a result, the performance of unstable foam could be significantly lower than that of conventional drilling fluid. Drilling foams often become unstable due to environmental factors. Drilling operation exposes foam to harsh downhole conditions such as high temperature, high pressure, and contamination, which affect foam drainage and decay. An increase in temperature reduces the base fluid viscosity and thins out the film between the foam bubbles, which destabilizes the foam. Contaminants such as rock cuttings and formation fluid containing oil and salt can influence the stability of foams used in drilling and completion operations [15].
Rock cuttings can be reactive or nonreactive. Reactive cuttings hydrate and influence the foamability of surfactant solutions. They also affect the base liquid viscosity of foams resulting in reduction or improvement in the drainage behavior of foams. In addition to their reactivity, the concentration of the rock cuttings influences the drainage characteristics of foams. The impact of oil contamination on foam stability can be substantial because of its influence on the foamability of the surfactant solution and the stability of the interface between the two phases. Not only does the concentration of crude oil in the foam affect its stability, but the oil composition also strongly influences the stability of the foam [15]. Often, oil contamination is limited to the reservoir sections of the wellbore. However, salt contamination is more frequent than that of oil due to the presence of various types of salts in formation fluids. The impact of salt contamination on foam stability is more complex due to the ionization of salt. The presence of monovalent and divalent ions influences the performance of the surfactant at stabilizing the interface created between gas and liquid phases. Studies in the areas of foam stability and contamination are limited. More investigations are needed to understand the individual and combined impact of various downhole contaminants that can affect the stability, and, subsequently, the performance of foams utilized in oil field operations.

1.3. Presence of Salt in Aqueous Foam

The salt in drilling foams can be in various forms such as NaCl, KCl, CaCl2, and MgCl2. Salts can be introduced into foams in many ways, including as additives to improve foam properties or by contamination from the formation being drilled. When salt is added to drilling foams, it increases the density and viscosity of the base liquid. The introduction of salt imparts shale inhibition properties in foams which reduce the dispersion and hydration of clays and shale. The increased concentration of salt in the base liquid reduces the absorption of salt from the surface of the formation when drilling in salt beds to avoid well instability and hole enlargement. Salt contamination is also common during underbalanced drilling with foam. The drilling process commonly introduces salt into the drilling foam while drilling through salty formations. The concentration and the type of salt in foam have different effects on the stability and flow behaviors of foams.

2. Literature Review

2.1. Drainage Mechanism

The forces such as gravity, surface tension, and viscous drag have a major role in foam drainage. Furthermore, the electrostatic double layer (EDL), hydration, and van der Waals forces control foam stability. Furthermore, drainages between the liquid films and the plateau border channels are important factors in the decay process of foam. The shape of the plateau border walls causes the liquid to drain out of the films due to the pressure difference between the films and plateau borders. The liquid drainage is continuous until the film gets thin and collapses [16]. The gravity drainage also causes the plateau border channels to drain out. The collapse of the liquid films induces uncontrolled growth of mechanical and thermal disturbances on the surface of the film [16]. If the force that offsets film thinning rises due to local thinning resulting from the disturbances, the wave (propagation of the disturbance) is controlled, and no film rupture happens. However, if the force decreases, film thinning is accelerated, and rupture occurs. However, the major reason for film rupture is the reduction in the thickness of the film and the required differential pressure for film rupturing.
Recent modeling studies [17,18] emphasized the importance of node-dominated flow in the drainage of aqueous foam. The node-dominated model [19] described in Equation (1) highlights the effect of fluid properties like base fluid density, viscosity, and surface tension on foam drainage rate, which is closely related to the local change in the liquid fraction with time ( ε t ) . This model could be explored to explain the effect of salt on foam drainage [19].
ε t = 1 μ [ ρ g · ( Κ ε ) z + σ δ e L z ( Κ ε 0.5 z )   ]
where μ and ρ are the viscosity and density of the liquid phase, respectively. g is the gravitational acceleration. Κ and σ represent permeability and interfacial tension, respectively. δ e is a dimensionless parameter, which is 0.171 for aqueous foams. L is the edge length, which is a function of bubble size. ε is the liquid volume fraction that is expressed as: ε = 1 − Γ , where Γ is the gas volume fraction or foam quality.

2.2. Effect of Surfactant and Salt on Foam Stability

The molecules of surfactant assemble to form aggregates of diverse microstructures and shapes depends on the composition of the base liquid, the type of surfactant, and temperature. The critical micelle concentration (CMC) is the minimum surfactant concentration for the formation of critical micelle with a spherical shape [12]. The interfacial behavior of ionic surfactants at the fluid–fluid interface is an important phenomenon in understanding colloidal occurrences such as surface tension, thin-film stability, and micellization [20]. The dissolution of ionic salts occurs when they dissolve in water and form ionic surface-active molecules [21]. The CMC shows the degree of the binding of the counter-ions to the micelle. The CMC of the surfactant reduces due to an increase in the binding of counter-ions to the surfactant. The strength of the counter-ion binding force increases with polarization and the valence of the counter-ions and decreases with the hydration radius.
Several studies [20,21,22] investigated the effect of the ions of inorganic salts on the surfactant adsorption on the gas–liquid interface using the surface tension of the liquid. The adsorption of ionic surfactant at the gas–liquid interface influences the coalescence of bubbles [23]. The presence of inorganic salt affects the adsorption of the ionic surfactant. The results from these studies have shown that the concentration of salt (C) required to inhibit coalescence varies in the sequence: C N a C l > C M g C l 2 > C A l C l 3 . Ghosh [24] studied the coalescence of the air bubbles by measuring the rest time (i.e., duration of existence) of bubbles, which are coalescing at a flat gas–liquid (air–water) interface. The work showed a rise in the rest time with surfactant concentration. The growth in the rest time is due to the development of surface potential because of the upsurge in the number of ionized head groups at the interface and the increase in the gas–liquid interface viscosity. In the presence of surfactant, certain salt ions increase the rest time of the air bubbles. In addition, the addition of NaCl enormously increases bubble rest time (stability) in the presence of surfactant [24]. The surface tension of base liquid does not vary with the NaCl concentration as the surfactant is fully adsorbed on the gas–liquid interface and no further adsorption is possible.
Various factors have been identified to cause an increase in foam stability in the presence of salt including, hydrophobic interaction [25], hydration effect [26], and double-layer repulsion [27]. The increase in the stability in the presence of NaCl is because of a reduction in surface diffusivity that is caused by the aggregation of the tails of surfactant molecules due to the reduction in the repulsion between the positively charged head groups of the molecules.
The stability of foam bubbles is dependent on the rate of coalescence of bubbles. The merging of two bubbles results in the formation of a large bubble with a thin liquid film. The continuous drainage of the film causes further thinning of the gas–liquid interface. The effect of disjoining pressure which is due to van der Waals force and the electrostatic double-layer becomes substantial [28]. The addition of NaCl in foaming solution caused a reduction in the surface tension and the electrostatic forces. In the absence of NaCl, bubbles rested on the surface of the solution for several hours without breaking. As the molarity of the NaCl was increased at low concentrations, the rest time of the solution decreased rapidly; this is attributed to the reduction in electrostatic repulsive force. As the concentration of the NaCl increased, the electrostatic repulsive forces became negligible. However, this minor variation caused a more prominent effect in reducing surface tension, which increased the coalescence time (i.e., rest time of the bubbles).
The addition of NaCl has a significant effect on the adsorption of the surfactant at the air–water interface [29]. The presence of surfactant significantly reduced the surface tension of a solution. Similar results were observed when NaCl was added to the surfactant solutions. The rest time of the bubbles increased with salt concentration. Ideally, the addition of salt to a surfactant solution reduces the electrostatic double-layer repulsion between the interfaces and diminishes the coalescence time (rest time) [28,30]. However, in the presence of salts, solvation forces provide strong stability to the bubble film. The strong resistance provided by the solvation forces significantly limits coalescence.
The valence of the salt has a varying effect on the stability of the surfactant solution. Liquid films formed in the presence of MgCl2 which is bivalent were more stable and lasted longer than films formed with a solution containing NaCl, which is monovalent. The reason for this behavior is that the Mg2+ ions interconnect the negatively charged head groups of surfactant molecules at the film surfaces, which increases surface viscosity and elasticity. This effect causes immobilization of surface film and opposition of liquid drainage out of the films [31]. The valence of the salt influences the surfactant adsorption to various extents because of their varied effect on the screening of electrostatic charge [23,32]. The air–water interface potential can be drastically impacted by the bonding of the counter-ions at the interface.
Inorganic salts can either be added or are naturally present in some foam applications. Salt alters the charge at the gas–liquid interface by influencing the adsorption of surfactant molecules [23,32]. The effect of salt on the surfactant is, however, not the same for all salt types. The rate of coalescence would be different based on the valence of the salt. The addition of salt causes the growth of small micellar aggregates of long-chain cationic surfactant. The growth (aggregation) is enormous and one dimensional forming a worm-like structure. The micelles are large and flexible with a large molecular weight. The worm-like micelles have viscoelastic behavior which is similar to those of polymeric solutions. They are also characterized by a high surface activity. The presence of salt strongly affects the foamability of surfactant solutions and the stability of the created foam.

2.3. Effect of Salt Concentration on Surface Properties

Various studies [20,23,29,31,33] have been carried out to understand the foamability of surfactant solutions in the presence of different counter-ions (Na+, Ca2+, Al3+). The addition of salt to a foaming solution increases the rate of surfactant adsorption at the air–liquid interface and reduces the surface tension. The adsorption is due to the electrostatic repulsion between the surfactant molecules [32]. The ion type also affects the level of reduction in surface tension; CaCl2 and AlCl3 have more surface tension reduction capability than NaCl. Behera et al. [32] used the zeta potential to approximate the surface potential. The addition of NaCl in small quantities augmented the zeta potential due to the increased absorption. The rupturing of foam film with the addition of salt is because of two opposing phenomena: the increase in surfactant adsorption at the gas–liquid interface, and the reduction in the electrostatic repulsion in the film.

2.4. Effect of Salt on CMC and Foamability

The addition of surfactant decreases the interfacial tension at the gas–liquid interface and promotes the generation of stable foam film and structure [34]. Hence, an increase in surfactant concentration improves foamability. However, the foamability is insensitive to surfactant concentration at high (above 0.01 wt. %) surfactant concentrations. Furthermore, in the presence of salt, foamability is sensitive to surfactant concentration. Nevertheless, it is insensitive to salinity (NaCl and CaCl2) when the surfactant concentration is above 0.025 wt. % [34]. At low surfactant concentration (less than 0.025 wt. %), foam stability is affected by salinity (Figure 1).
The addition of salt influences the aqueous surfactant solution by modifying the intramicellar and intermicellar interactions [35]. The addition of salt also affects the CMC and the phase behavior of foam. Above this concentration, micelles start to form. The CMC corresponds to the lowest value of the surface tension and a further increase in surfactant concentration does not further reduce surface tension. A recent study [36] showed that the addition of salt to ionic and nonionic surfactants reduces their CMC. The interface at the surface of a surfactant solution adsorbs the surfactant. This leads to a decrease in surface tension of the liquid until the equilibrium value is reached. The dynamic surface tension (DST), however, depends on the type of the surfactant and the nature of the fluid and the presence of other additives [37]. Salts are added in various applications and can affect the behavior of the surfactant by changing the CMC [38,39].

2.5. Fluid Rheology

The rheology of the base liquid used to generate the foam influences the stability of foams. The half-life of the foam varied by changing the rheological properties of the base liquid [17]. The apparent viscosity of the foam increases with foam quality and base liquid viscosity [7,10,40]. The addition of salt to the base liquid influences its viscosity and density, which influence the stability of the foam. Salt and surfactant concentrations strongly affect surface viscosity [3].

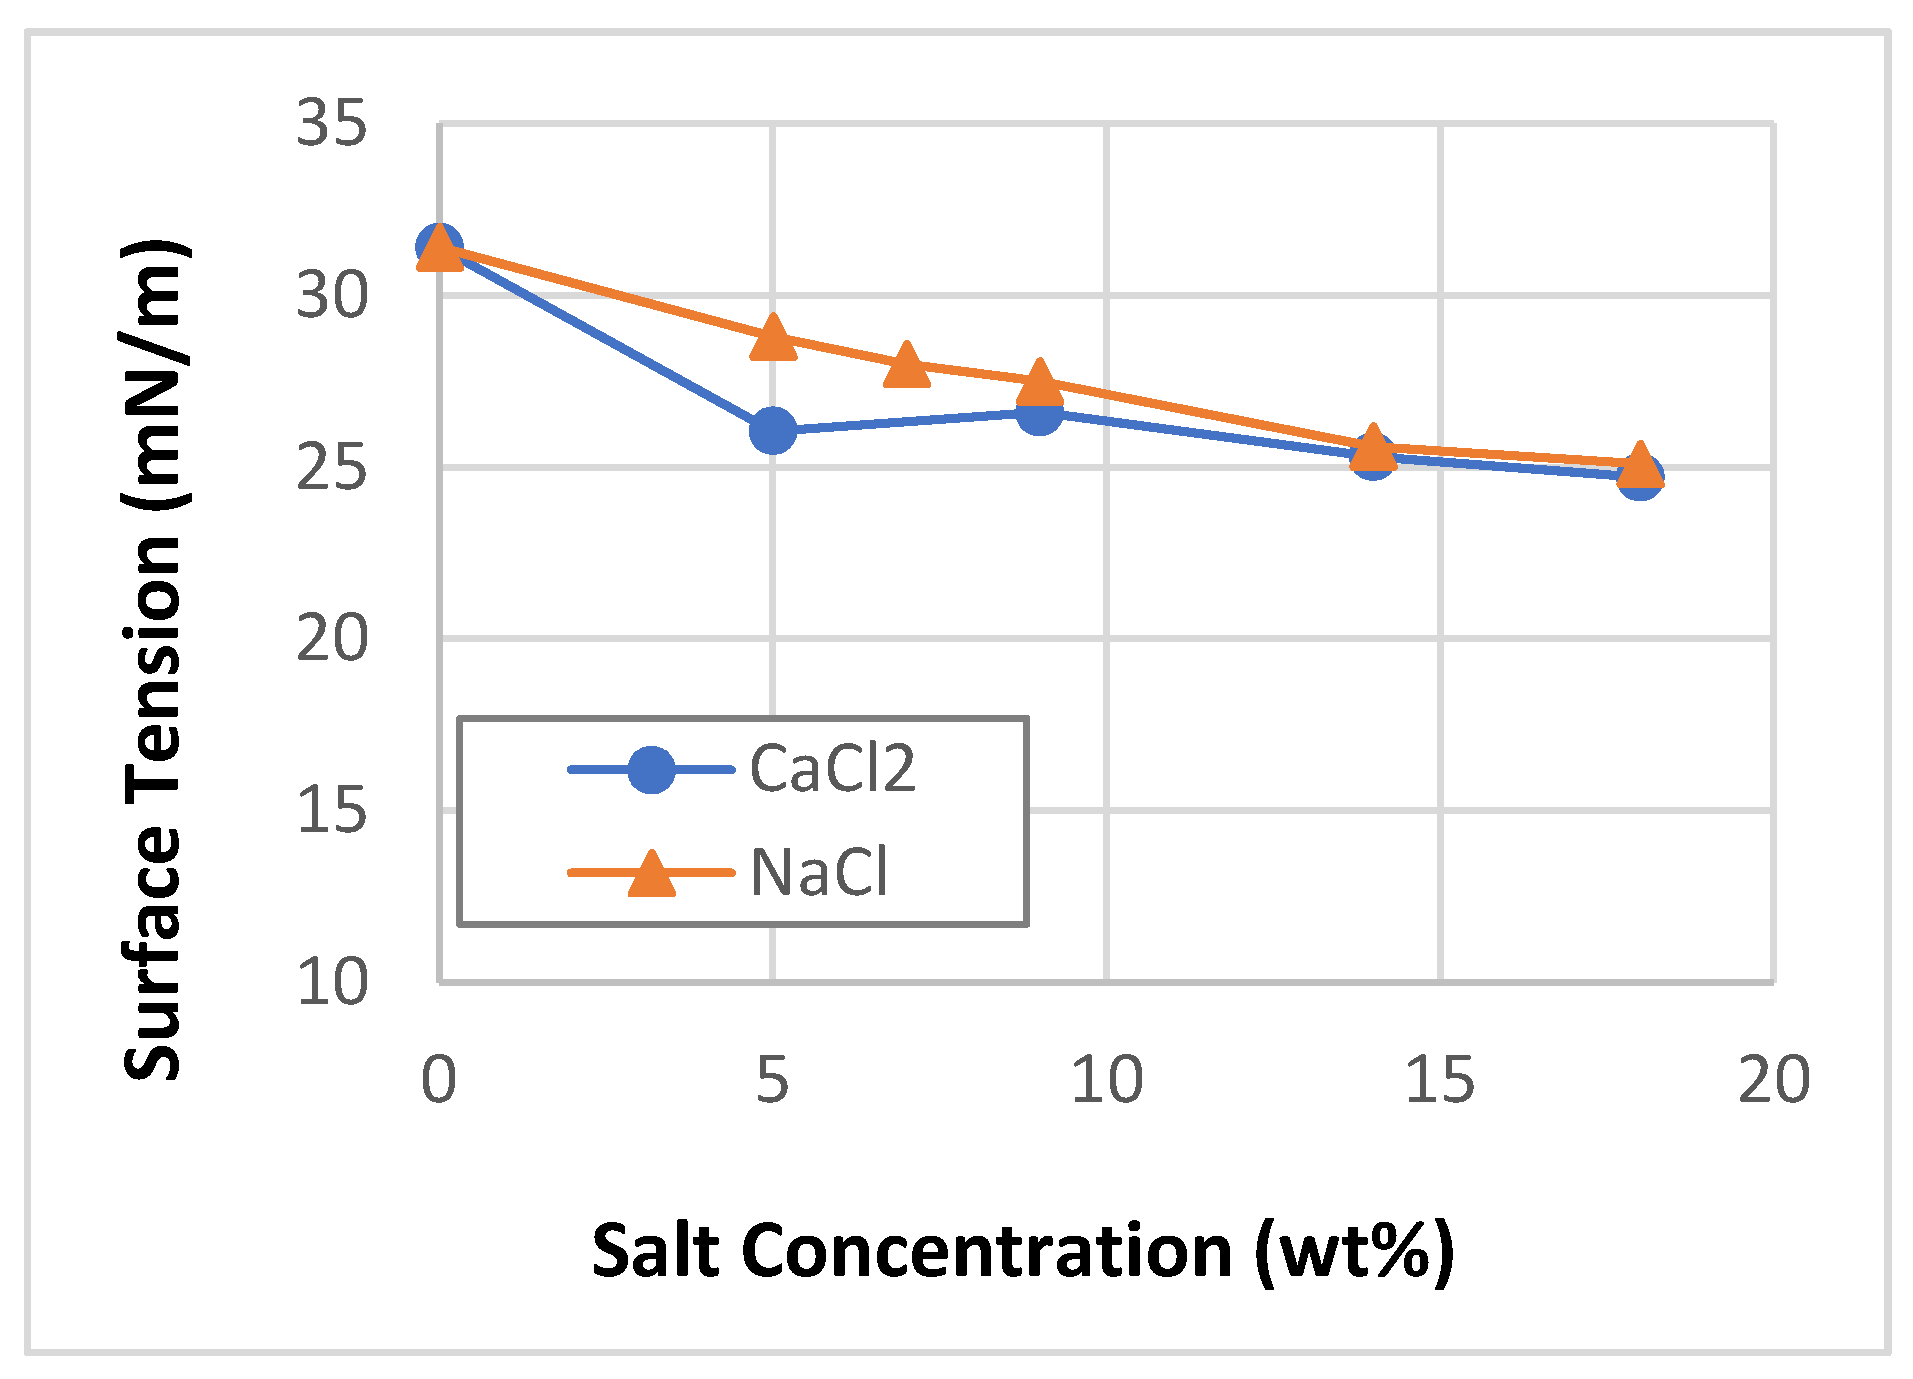
2.6. Surface Tension

A recent study [36] investigated the effect of salt on surface tension. The findings showed that the addition of NaCl salt decreased the surface tension of a surfactant solution. This indicates that the gas–liquid interface can further absorb more surfactant molecules. The surface tension continued to reduce with more addition of the NaCl salt, which infers more adsorption of the surfactant molecules. Salt increases the adsorption of surfactant at the gas–liquid interface. This effect is because of the drop in the electrostatic double-layer repulsion between the charged head groups of the molecules of surfactant [41]. The quantity of salt required to reduce the surface tension is dependent on the valence of the salt. The quantity increases in the order NaCl > CaCl2 > AlCl3 [41]. The higher valence salt has the greater its effect on the repulsive electrostatic double-layer force which causes more surfactant adsorption at the gas–liquid interface. This effect has been presented in the work performed by Varade and Ghosh [41] as a continuous decline in the surface tension of a surfactant solution and reduction in CMC as the concentration of the salt was increased.

3. Experimental Investigation

3.1. Scope of Experiment

Extensive drainage experiments were conducted to study the effects of salt type and concentration on the stability of aqueous foams. Two types of salts (Table 1) were considered varying their concentration (5% to 18% wt/wt of solvent). Three foam qualities (40%, 50%, and 60%) were considered. In addition to drainage measurements, foam rheology, and base liquid surface tension was measured. The rheology measurements were carried out at varying flow rates; 25%, 50%, 75%, 90%, 100% of pump capacity to determine the flow behavior of foam at different shear rates.

3.2. Test Materials

The materials used for this experiment were 99.9% nitrogen gas, tap water (Norman, Oklahoma), 2% (v/v) an anionic surfactant (Howco-Suds), NaCl salt, and CaCl2 salt.

3.3. Test Setup

The flow loop (Figure 2) utilized for this study consists of a liquid tank; nitrogen supply cylinder; foam generating section (FGS) that includes differential pressure transmitters ( Δ P2), static mixers, and needle valve; injection pump (Pump 1) and circulation pump (Pump 2); Coriolis flowmeter for measuring fluid density and mass flow rate, and pipe viscometer (6.22 mm pipe test section) to monitor foam generation and measure foam viscosity; stability cell (vertical test section) which is equipped with ten differential pressure transducers to measure pressure distribution; and pressure and temperature sensors. Furthermore, the flow loop has a pressure regulator and relief valves to control the nitrogen injection pressure and avoid overpressurization of the system, respectively. The liquid tank was used as a base liquid injection tank and fluid circulation vessel during flow loop flushing. The base liquid was injected into the system using the injection pump.

3.4. Equipment Used

To measure the surface tension of base liquids (i.e., surfactant solution with different concentrations and types of salt) a standard surface tension measuring device (Kruss DSA100 Drop Shape Analyzer) was used.

3.5. Test Procedure

During the test, the foam was prepared by mixing base liquid with nitrogen gas. The following experimental steps were implemented to measure the flow and drainage behavior of tested foams:
Step 1.
Preparation of Base Liquid: The base fluid was prepared by mixing 2 L of water, 40 mL surfactant, and the desired amount of salt. Fluid homogeneity was achieved by using a laboratory agitator.
Step 2.
Flow Loop Filling: The liquid tank was first filled with 1000 mL of the base liquid. The return (V1), injection valves (V2), and other valves (V3A, V3B, V4, and V12) were opened to allow base liquid injection and fill up the vertical test section. Other circulation valves (V8, V9, and V10) were opened to allow fluid circulation through the viscometer.
Step 3.
Fluid Circulation: The injection valve (V2) was closed, and the base liquid was circulated through the flow loop: vertical test section, pipe viscometer, and FGS. The needle valve of the FGS was fully opened.
Step 4.
Nitrogen Injection: While circulating the base liquid, nitrogen was injected into the flow loop by opening the nitrogen injection valve and monitoring the system pressure until it reached the desired pressure.
Step 5.
Foam Generation: The needle valve of the FGS was throttled to obtain a differential pressure of 0.15 MPa across the valve while circulating at the maximum flow rate (2 L/min).
Step 6.
Foam Quality Adjustment: First, the low-pressure side of the Δ P transmitters of the stability cell was filled with water by opening V5 and V7. After closing these valves (V5 and V7), the capillary tube pressure equalization valve (V6) was opened. The drain valve (V11) was then opened to drain some of the liquid/foam in the system. This was performed while maintaining the pressure at the desired level by injecting nitrogen while monitoring foam quality which was measured based on the hydrostatic pressure profile of the foam in the cell. The quality was monitored until the desired foam quality was attained.
Step 7.
Measuring Foam Rheology: After the desired foam quality was achieved, the flow rate was varied while measuring the pressure drop across the pipe viscometer. The foam was regenerated at the maximum rate before every viscosimetric flow measurement.
Step 8.
Measuring Drainage: The foam was first circulated at the maximum flow rate until it was fully generated and then the inlet and outlet valves (V3A and V3B) of the stability cell were closed to trap the foam in the cell. The pressure profile in the foam column was monitored using ten pressure differential pressure sensors.

4. Results and Discussion

4.1. Effect of Salt on Properties of Base Liquid

As discussed in Section 2, the presence of salt in surfactant solutions causes variations in surface tension and CMC. Regardless of the type of salt, the surface tension of the base liquid showed (Figure 3) a noticeable reduction with salt concentration. In addition to variation in surface tension, the viscosity and density of the base liquid are affected by the introduction of salt. The water density is expected to increase up to 16% by adding 18% NaCl or CaCl2 salt. Hence, a moderate increase in base liquid density is anticipated due to salt addition.
The effect of salt on the viscosity of the base liquid is shown in Figure 4. The CaCl2 salt has more effect on the viscosity than the NaCl salt. The increase in the viscosity of the base liquid is expected to be substantial for CaCl2 salt. Coalescence of the gas bubble occurs when the liquid film lining of each bubble is drained and the gas in the bubble merges to the next bubble. The increase in viscosity of the base liquid reduces the flow of liquid around the bubble and limits the rate of coalescence of bubbles. However, the viscous resistance is not the only limiting factor to be considered in the complex stability of foams. An earlier study [42] on KCL salt showed a reduction in the viscosity of water but also demonstrated a decrease in the coalescence at high salt concentrations.

4.2. Effect of Salt on Rheology of Foams

Foam rheology tests were performed to ensure proper foam generation for drainage experiments and study the effect of salt concentration on the flow behavior of aqueous foams. In Figure 5, rheology measurements of NaCl salt-containing foams. The data is presented in form of the wall shear stress versus nominal Newtonian shear rate (8U/D). All measurements were obtained under laminar flow conditions (Reynolds number less than 2100). As anticipated, the viscosity of the foams increased with their quality. Measurements obtained from low-quality foam (40%) form an approximately straight line on a logarithmic plot indicating a constant slope, which can be used to determine the power-law rheology model ( τ = k γ ˙ n ) parameter, n. The introduction of the salt did not have a significant effect on the viscosity of the foams.
The flow curves of CaCl2 salt-based foams are presented in Figure 6 in form of shear stress versus 8U/D. Laminar flow conditions were established when the measurements were collected. The impact of foam quality on the flow behavior of CaCl2 foams is more pronounced as compared to that of the NaCl foams. The effect of salt concentration on the foam flow behavior is minor even though the base fluid viscosity is expected to increase significantly (Figure 4). This indicates that there are factors other than foam quality and base liquid viscosity, which influence the rheology of salt-containing foams. The presence of salt in the foam system can affect the surface tension, CMC, and foamability of the base liquid.

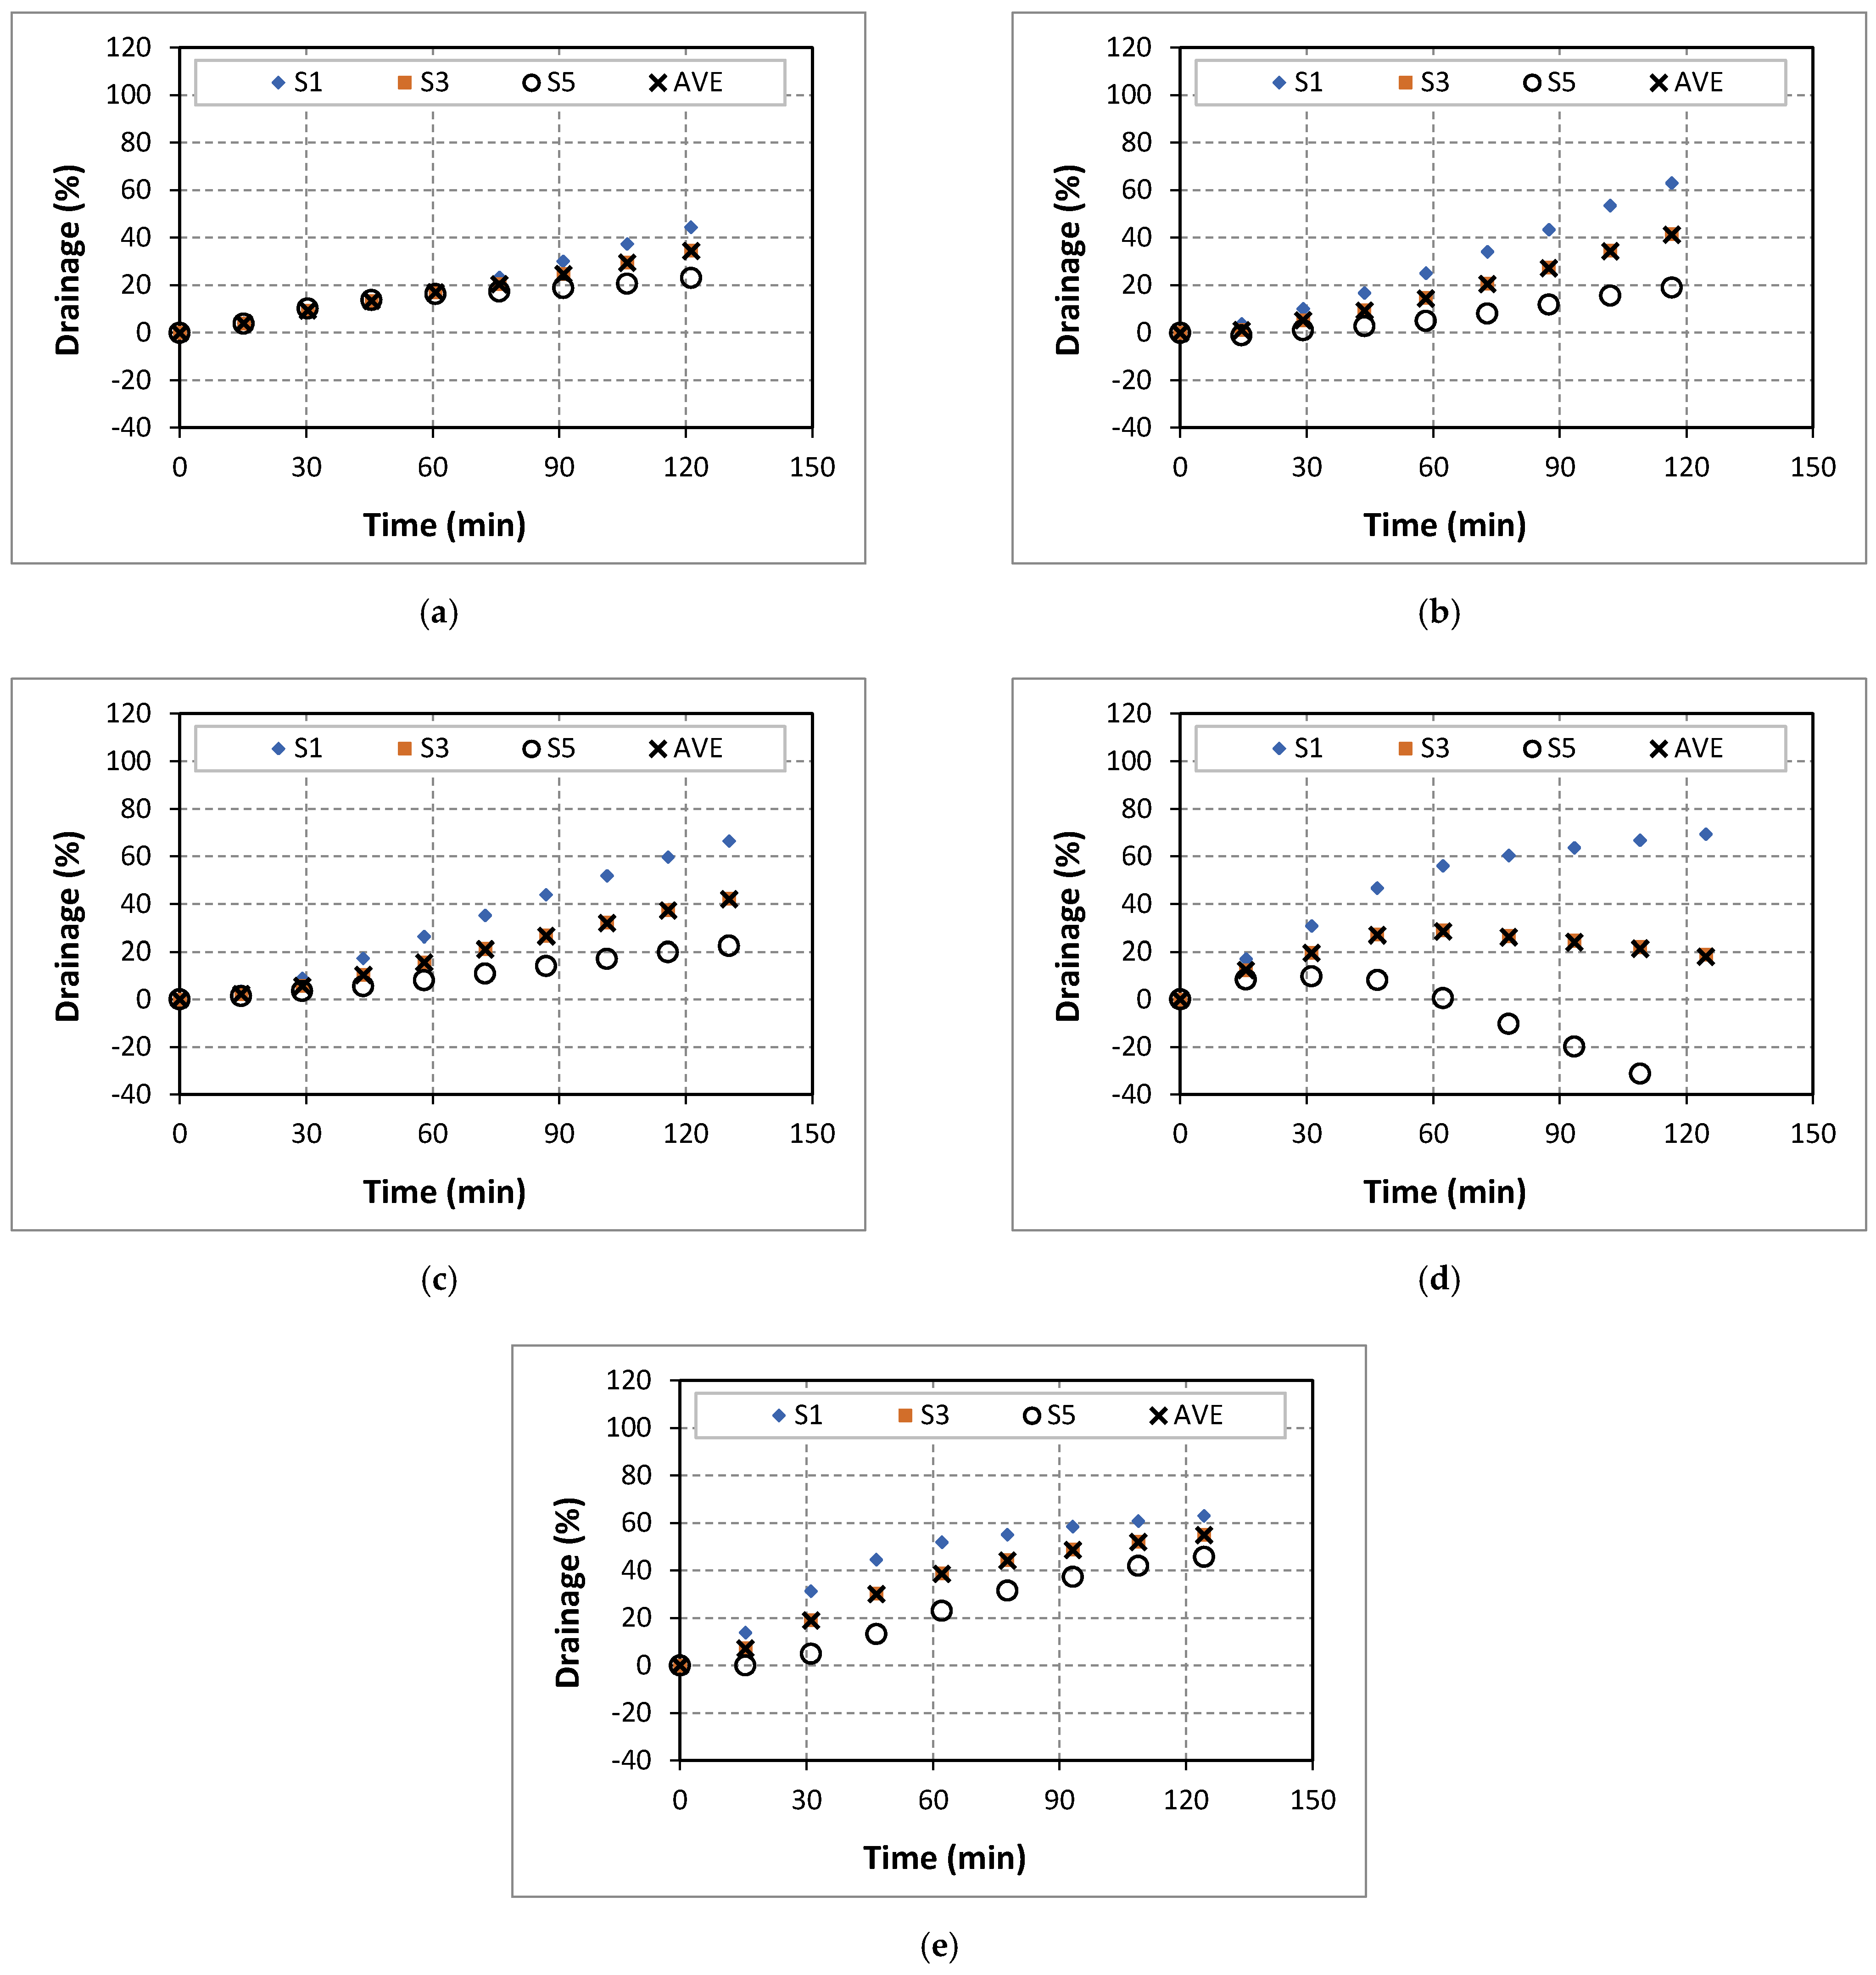
4.3. Effect of NaCl Concentration on Drainage

The drainage experiments were conducted with varying salinity, salt type, and foam quality. The test program involved pressure profile measurements of the foam column using differential pressure transducers installed on the stability cell. Measured pressure profiles are curve fitted using the 2nd degree polynomial function to compute foam drainage occurring in each segment (a section of stability cell between two consecutive pressure transducers) of the stability cell as a function of time (Figure 7). The cell has nine segments (S1 to S9) formed between ten differential pressure transducers. During the test, the top sections of the stability cell were losing their liquid phase while the bottom sections were accumulating liquid. The initial foam drainage was zero for all the segments. The drainage was measured for 2 h. The drainage process occurring in upper segments (Segments S1, S3, and S5) of the cell is indicated by the increasing trends of the drainage curves. The bottom three segments (Segments S7, S8, and S9) gained a significant amount of liquid during the experiments. As a result, the pressure profiles were linear in the bottom section while parabolic pressure profiles were observed in the upper segments as the foam degraded. Because of this, only the upper segments were considered in pressure profile analysis to evaluate drainage. The average drainage (AVE) was determined considering the upper five segments (S1 to S5).
The drainage behavior of 40% quality baseline foam (aqueous foam without salt) is presented in Figure 7a. At the end of the experiment, the average drainage was 60%. The drainage was observed to increase steadily during the test. At low salt concentrations (0 and 5%), drainage increased with NaCl addition in all the upper segments (Figure 7b). The final average drainage (AVE at 120 min) increased (from 60% to 80%) with the addition of NaCl salt. The addition of salt could affect the drainage behavior of aqueous foams through three factors: the maximum disjoining force in the foam, surface viscosity, and surface tension. When NaCl concentration was further increased to 7%, the drainage slightly reduced (Figure 7c). At a high salt concentration of 9%, the drainage observed was further reduced (Figure 7d) with salt concentration. This observed effect could be due to the increase in the adsorption of surfactant molecules that stabilizes the foam by limiting bubble coalescence. Increasing the concentration of the NaCl to 14% further reduced foam stability as indicated by the increase in drainage. The balance between the impacts of increased surfactant adsorption and that of the reduced repulsive forces dictates the drainage behavior of this system (Figure 7e). These results agree with the findings of Giribabu et al. [23]. An additional increase in salt content reduced the drainage.
A similar foam drainage trend with NaCl concentration was observed when high quality (50% and 60%) foams were tested (Figure A1 and Figure A2). The negative values for drainage shown in Appendix A indicate the net gain of the liquid phase in a given segment of the test cell. The increase in salt content promotes the adsorption of surfactant molecules at the gas–liquid interface and subsequently reduced the bubble coalescence and drainage. Several studies [20,21,22,23] demonstrated the impact of the ions of inorganic salts on the surfactant adsorption on the gas–liquid interface and the associated inhibition coalescence due to the ions. As shown in Figure 8, the average drainage gradually decreased with NaCl concentration. This observation is consistent with published results [34].

4.4. Effect of CaCl2 Concentration on Drainage

Drainage experiments were performed varying the concentration of CaCl2 to examine the effect of divalent salt on the stability of foams. The drainage behavior of 40% quality foams containing CaCl2 salt is shown in Figure 9. The final average drainage in the absence of salt was 60%. As the salt concentration was increased to 5%, no significant change in the drainage was observed. A further increase in the salt concentration to 9% showed a slight decrease (~15%) in drainage. The addition of CaCl2 stabilized the foam and reduced drainage. Increasing the concentration of the salt to 14% and 18% exacerbated the drainage. This could be attributed to the reduction in the electrostatic double layer, which is expected to be the dominant mechanism. The drainage behavior of 50% and 60% quality foams containing CaCl2 salt are presented in Appendix A.
Figure 10a presents the final average drainage as a function of CaCl2 content in the base liquid. When the foam qualities were 40 and 50 percent, the drainage curves displayed a decreasing trend with the salt content at low CaCl2 concentrations (less than 9%). However, the trend reversed when at high CaCl2 concentrations (more than 9%). Further increase in the CaCl2 concentration to 14% caused the drainage to increase. The increase in drainage could be explained by considering the adsorption of surfactant molecules and repulsion between bubbles. The increase in the salt concentration could inhibit the adsorption of surfactant molecules and reduce repulsion between the bubble and bulk gas–liquid interface. According to Behera et al. [32], a significant increase in drainage can occur due to the bindings of cation which speed up the coalescence by reducing the repulsion between the two approaching surfaces. The drainage curve of high-quality foam (60%) exhibited a different trend (Figure 10b). At low (less than 5%) and high (greater than 14%) salt concentrations, drainage increased with CaCl2 content. In the intermediate concentrations (between 5% and 14%), the drainage decreased with CaCl2 content.

5. Conclusions

An experimental investigation on the drainage behavior of aqueous foams was conducted varying foam quality and salt content in the base liquid. Foam drainage was measured using a vertical test section equipped with sensors to determine the pressure profile. The following conclusions can be made based on the results of this investigation:
  • The addition of salts (NaCl and CaCl2) to the base liquid has a minor effect on the rheological properties of aqueous foams.
  • Like aqueous and polymer foams, the viscosity of salt-containing foams increased with foam quality.
  • The trend of foam drainage with salt concentration is mixed (i.e., the trend depends on the type of salt and concentration range) for both types of salts (NaCl and CaCl2) used in this investigation.
  • The drainage of NaCl-containing foams reduced with foam quality while that of CaCl2-containing foams did not exhibit a consistent trend.

Author Contributions

O.O. performed experiments, conducted data analysis, and prepared the original draft of the article. R.A. developed the research methodology, designed the test setup, developed the test procedure, and reviewed and edited the article. M.A. participated in the project management and reviewed the article. All authors have read and agreed to the published version of the manuscript.

Funding

The research was funded by The Qatar National Research Fund grant number [NPRP 10-0115-170165].

Acknowledgments

This publication was made possible by an NPRP award [NPRP 10-0115-170165] from the Qatar National Research Fund (a member of The Qatar Foundation). We would like to express our gratitude and appreciation to Texas A&M University at Qatar and the University of Oklahoma for supporting the project. We would also like to thank Jeff McCaskill for providing technical support to conduct the experiments.

Conflicts of Interest

The authors declare no conflict of interest.

Appendix A. Drainage Curves of High-Quality Foams

Figure A1. Drainage of 50% quality aqueous foam at different NaCl concentrations: (a) 0% wt., (b) 5% wt., (c) 7% wt., (d) 9% wt., (e) 14% wt., and (f) 18% wt.
Energies 14 00279 g0a1
Figure A2. Drainage of 60% quality aqueous foam at different NaCl concentrations: (a) 0% wt., (b) 5% wt., (c) 7% wt., (d) 9% wt., (e) 14% wt., and (f) 18% wt.
Energies 14 00279 g0a2
Figure A3. Drainage of 50% quality aqueous foam at different CaCl2 concentrations: (a) 0% wt., (b) 5% wt., (c) 7% wt., (d) 9% wt., (e) 14% wt.
Energies 14 00279 g0a3
Figure A4. Drainage of 60% quality aqueous foam at different CaCl2 concentrations: (a) 0% wt., (b) 5% wt., (c) 7% wt., (d) 9% wt., (e) 14% wt.
Energies 14 00279 g0a4

References

  1. Sinha, V.; Ahmed, R.; Akhtar, T.; Shah, S.; Amani, M. Rheology and hydraulics of polymer-based foams at elevated temperatures. J. Pet. Sci. Eng. 2019, 180, 330–346. [Google Scholar] [CrossRef]
  2. Akhtar, T.F.; Ahmed, R.; Elgaddafi, R.; Shah, S.; Amani, M. Rheological behavior of aqueous foams at high pressure. J. Pet. Sci. Eng. 2018, 162, 214–224. [Google Scholar] [CrossRef]
  3. Bhakta, A.; Ruckenstein, E. Drainage and Coalescence in Standing Foams. J. Colloid Interface Sci. 1997, 191, 184–201. [Google Scholar] [CrossRef] [PubMed]
  4. Gallego-Juárez, J.; Rodriguez, G.; Riera, E.; Cardoni, A. Ultrasonic Dfoaming and Debubbling in Food Processing and Other Applications; Woodhead Publishing: Cambridge, UK, 2015; pp. 793–814. [Google Scholar]
  5. Govindu, A.; Ahmed, R.; Shah, S.; Amani, M. Stability of foams in pipe and annulus. J. Pet. Sci. Eng. 2019, 180, 594–604. [Google Scholar] [CrossRef]
  6. Eren, T. Foam Characterization: Bubble Size and Texture Effects. Master’s Thesis, Middle East Technical University, Ankara, Turkey, 2004. [Google Scholar]
  7. Sherif, T.; Ahmed, R.; Shah, S.; Amani, M. Rheological correlations for oil-based drilling foams. J. Nat. Gas Sci. Eng. 2016, 35, 1249–1260. [Google Scholar] [CrossRef]
  8. Sherif, T.; Ahmed, R.; Shah, S.; Amani, M. Rheology of Oil-Based Drilling Foams. In Proceedings of the 2016 AADE Fluids Technical Conference and Exhibition, Huston, TX, USA, 12–13 April 2016. [Google Scholar]
  9. Okpobiri, G.A.; Ikoku, C.U. Volumetric Requirements for Foam and Mist Drilling Operations. SPE Drill. Eng. 1986, 1, 71–88. [Google Scholar] [CrossRef]
  10. Ahmed, R.; Kuru, E.; Saasen, A. Critical review of drilling foam rheology. Annu. Trans. Nordic Rheol. Soc. 2003, 11, 63–72. [Google Scholar]
  11. Rehm, B.; Haghshenas, A.; Paknejad, A.; Al-Yami, A.; Hughes, J.; Schubert, J. (Eds.) Foam Drilling. In Underbalanced Drilling: Limits and Extremes; Gulf Publishing Company: Huston, TX, USA, 2012. [Google Scholar]
  12. Dong, B.; Zhang, J.; Zheng, L.; Wang, S.; Liu, G.; Inoue, T. Salt-induced viscoelastic wormlike micelles formed in surface active ionic liquid aqueous solution. J. Colloid Interface Sci. 2008, 319, 338–343. [Google Scholar] [CrossRef] [PubMed]
  13. Li, Y.; Kuru, E. Optimization of hole cleaning in vertical wells using foam. In Proceedings of the SPE International Thermal Operations and Heavy Oil Symposium and Western Regional Meeting, Bakersfield, CA, USA, 16–18 March 2004. [Google Scholar]
  14. Martins, A.L.; Lourenço, A.M.F.; De Sá, C.H.M. Foam Properties Requirements for Proper Hole Cleaning While Drilling Horizontal Wells in Underbalanced Conditions. In Proceedings of the SPE Asia Pacific Oil and Gas Conference and Exhibition, Brisbane, Australia, 16–18 October 2000. [Google Scholar]
  15. Rojas, Y.; Kakadjian, S.; Aponte, A.; Márquez, R.; Sánchez, G. Stability and Rheological Behavior of Aqueous Foams for Underbalanced Drilling. In Proceedings of the SPE International Symposium on Oilfield Chemistry, Houston, TX, USA, 13–16 February 2001. [Google Scholar]
  16. Ruckenstein, E.; Bhakta, A. Effect of Surfactant and Salt Concentrations on the Drainage and Collapse of Foams Involving Ionic Surfactants. Langmuir 1996, 12, 4134–4144. [Google Scholar] [CrossRef]
  17. Ibizugbe, N.O. Drainage Behaivor of Oil-Based Drilling Foam under Ambient Condition. Master’s Thesis, University of Oklahoma, Norman, OK, USA, 2012. [Google Scholar]
  18. Govindu, A. Drainage Behavior of Aqueous, Polymeric, and Oil-Based Nitrogen Foams: Theoretical and Experimental Investigation. Ph.D. Thesis, University of Oklahoma, Norman, OK, USA, 2019. [Google Scholar]
  19. Koehler, S.A.; Hilgenfeldt, S.; Stone, H.A. Liquid Flow through Aqueous Foams: The Node-Dominated Foam Drainage Equation. Phys. Rev. Lett. 1999, 82, 4232. [Google Scholar] [CrossRef] [Green Version]
  20. Warszyński, P.; Lunkenheimer, A.K.; Czichocki, G. Effect of Counterions on the Adsorption of Ionic Surfactants at Fluid−Fluid Interfaces. Langmuir 2002, 18, 2506–2514. [Google Scholar] [CrossRef]
  21. Oh, S.G.; Shah, D.O. Effect of counterions on the interfacial tension and emulsion droplet size in the oil/water/dodecyl sulfate system. J. Phys. Chem. 1993, 97, 284–286. [Google Scholar] [CrossRef]
  22. Bott, R.; Wolff, T. Micellization of cetyltrimethylammonium bromide in the presence of 9-anthryl alkanols. Colloid Polym. Sci. 1997, 275, 850–859. [Google Scholar] [CrossRef]
  23. Giribabu, K.; Reddy, M.L.N.; Ghosh, P. Coalescence of air bubbles in surfactant solutions: Role of salts containing mono-, di-, and trivalent ions. Chem. Eng. Commun. 2007, 195, 336–351. [Google Scholar] [CrossRef]
  24. Ghosh, P. Coalescence of Air Bubbles at Air–Water Interface. Chem. Eng. Res. Des. 2004, 82, 849–854. [Google Scholar] [CrossRef]
  25. Craig, V.S.J.; Ninham, B.W.; Pashley, R.M. The effect of electrolytes on bubble coalescence in water. J. Phys. Chem. 1993, 97, 10192–10197. [Google Scholar]
  26. Israelachvili, J.N. Intermolecular and Surface Forces; Academic Press: London, UK, 1997; pp. 276, 281. [Google Scholar]
  27. Marčelja, S. Selective coalescence of bubbles in simple electrolytes. J. Phys. Chem. B 2006, 110, 13062–13067. [Google Scholar] [CrossRef]
  28. Li, D.; Slattery, J.C. Experimental support for analyses of coalescence. AIChE J. 1988, 34, 862–864. [Google Scholar] [CrossRef]
  29. Kumar, M.; Ghosh, P. Coalescence of Air Bubbles in Aqueous Solutions of Ionic Surfactants in Presence of Inorganic Salt. Chem. Eng. Res. Des. 2006, 84, 703–710. [Google Scholar] [CrossRef]
  30. Lu, J.; Corvalan, C.M. Coalescence of viscous drops with surfactants. Chem. Eng. Sci. 2012, 78, 9–13. [Google Scholar] [CrossRef]
  31. Angarska, J.; Tachev, K.; Ivanov, I.; Mehreteab, A.; Brose, G. Effect of Magnesium Ions on the Properties of Foam Films Stabilized with Sodium Dodecyl Sulfate. J. Colloid Interface Sci. 1997, 195, 316–328. [Google Scholar] [CrossRef] [PubMed]
  32. Behera, M.R.; Varade, S.R.; Ghosh, P.; Paul, P.; Negi, A.S. Foaming in Micellar Solutions: Effects of Surfactant, Salt, and Oil Concentrations. Ind. Eng. Chem. Res. 2014, 53, 18497–18507. [Google Scholar] [CrossRef]
  33. Kralchevsky, P.A.; Danov, K.D.; Broze, A.G.; Mehreteab, A. Thermodynamics of Ionic Surfactant Adsorption with Account for the Counterion Binding: Effect of Salts of Various Valency. Langmuir 1999, 15, 2351–2365. [Google Scholar] [CrossRef]
  34. Liu, Y.; Grigg, R.B.; Bai, B. Salinity, pH, and surfactant concentration effects on CO2-foam. In Proceedings of the SPE International Symposium on Oilfield Chemistry, The Woodlands, TX, USA, 2–4 February 2005. [Google Scholar]
  35. Carale, T.R.; Pham, Q.T.; Blankschtein, D. Salt effects on intramicellar interactions and micellization of nonionic surfactants in aqueous solutions. Langmuir 1994, 10, 109–121. [Google Scholar] [CrossRef]
  36. Varade, S.R.; Ghosh, P. Foaming in aqueous solutions of zwitterionic surfactant: Effects of oil and salts. J. Dispers. Sci. Technol. 2017, 38, 1770–1784. [Google Scholar] [CrossRef]
  37. Qazi, M.J.; Schlegel, S.J.; Backus, E.H.G.; Bonn, M.; Bonn, D.; Shahidzadeh, N. Dynamic Surface Tension of Surfactants in the Presence of High Salt Concentrations. Langmuir 2020, 36, 7956–7964. [Google Scholar] [CrossRef]
  38. Li, F.; Li, G.-Z.; Wang, H.-Q.; Xue, Q.-J. Studies on cetyltrimethylammonium bromide (CTAB) micellar solution and CTAB reversed microemulsion by ESR. Colloids Surf. A Physicochem. Eng. Asp. 1997, 127, 89–96. [Google Scholar] [CrossRef]
  39. Beyer, K.; Leine, D.; Blume, A. The demicellization of alkyltrimethylammonium bromides in 0.1M sodium chloride solution studied by isothermal titration calorimetry. Colloids Surf. B Biointerfaces 2006, 49, 31–39. [Google Scholar] [CrossRef] [PubMed]
  40. Chen, Z.; Ahmed, R.M.; Miska, S.Z.; Takach, N.E.; Yu, M.; Pickell, M.B. Rheology Characterization of Polymer Drilling Foams using a Novel Apparatus. Annu. Trans. Nordic Rheol. Soc. 2005, 13, 111–120. [Google Scholar]
  41. Iyota, H.; Krastev, R. Miscibility of sodium chloride and sodium dodecyl sulfate in the adsorbed film and aggregate. Colloid Polym. Sci. 2009, 287, 425–433. [Google Scholar] [CrossRef] [Green Version]
  42. Lessard, R.R.; Zieminski, S.A. Bubble Coalescence and Gas Transfer in Aqueous Electrolytic Solutions. Ind. Eng. Chem. Fundam. 1971, 10, 260–269. [Google Scholar] [CrossRef]
Figure 1. Foamability of 0.005 Wt% surfactant solution vs. salinity: (a) NaCl and (b) CaCl2 (data from Liu et al., 2005).
Energies 14 00279 g001
Figure 2. Experimental setup.
Energies 14 00279 g002
Figure 3. Surface tension of base liquid vs. salt concentration.
Energies 14 00279 g003
Figure 4. Viscosity of water vs. salt concentration.
Energies 14 00279 g004
Figure 5. Shear stress vs. nominal Newtonian shear rate for: (a) 5%, (b) 9%, (c) 14%, and (d) 18% NaCl foams.
Energies 14 00279 g005aEnergies 14 00279 g005b
Figure 6. Shear stress vs. nominal Newtonian shear rate for: (a) 5%, (b) 9%, (c) 14%, and (d) 18% CaCl2 foams.
Energies 14 00279 g006aEnergies 14 00279 g006b
Figure 7. Drainage of 40% quality aqueous foam at different NaCl concentrations: (a) 0% wt., (b) 5% wt., (c) 7% wt., (d) 9% wt., (e) 14% wt., and (f) 18% wt.
Energies 14 00279 g007aEnergies 14 00279 g007b
Figure 8. Final average drainage (AVE) vs. NaCl content for different quality foams.
Energies 14 00279 g008
Figure 9. Drainage of 40% quality aqueous foam at different CaCl2 concentrations: (a) 0% wt., (b) 5% wt., (c) 7% wt., (d) 9% wt., (e) 14% wt.
Energies 14 00279 g009aEnergies 14 00279 g009b
Figure 10. Final average drainage (AVE) vs. CaCl2 content for different foams: (a) 40% and 50%, and (b) 60%.
Energies 14 00279 g010
Table 1. Test matrix.
QualityNaClCaCl2
40%, 50%, 60%5%5%
40%, 50%, 60%7%-
40%, 50%, 60%9%9%
40%, 50%, 60%14%14%
40%, 50%, 60%18%18%
Publisher’s Note: MDPI stays neutral with regard to jurisdictional claims in published maps and institutional affiliations.

