Abstract
Geothermal energy has been recognized as an important clean renewable energy. Accurate assessment of geothermal resources is an essential foundation for their development and utilization. The North Jiangsu Basin (NJB), located in the Lower Yangtze Craton, is shaped like a wedge block of an ancient plate boundary and large-scale carbonate thermal reservoirs are developed in the deep NJB. Moreover, the NJB exhibits a high heat flow background because of its extensive extension since the Late Mesozoic. In this study, we used the Monte Carlo method to evaluate the geothermal resources of the main reservoir shallower than 10 km in the NJB. Compared with the volumetric method, the Monte Carlo method takes into account the variation mode and uncertainties of the input parameters. The simulation results show that the geothermal resources of the sandstone thermal reservoir in the shallow NJB are very rich, with capacities of (6.6–12) × 1020 J (mean 8.6 × 10²⁰ J), (5.1–16) × 1020 J (mean 9.1 × 10²⁰ J), and (3.2–11) × 1020 J (mean 6.6 × 10²⁰ J) for the Yancheng, Sanduo and Dai’nan sandstone reservoir, respectively. In addition, the capacity of the geothermal resource of the carbonate thermal reservoir in the deep NJB is far greater than the former, reaching (9.9–15) × 1021 J (mean 12 × 1021 J). The results indicate capacities of a range value of (1.2–1.7) × 1021 J (mean 1.4 × 10²² J) for the whole NJB (<10 km).
1. Introduction
In the past two centuries, the extensive use of non-renewable energy (e.g., nuclear energy, coal, and so on) in the world has caused many environmental disasters [1,2,3]. Among them, the consumption of fossil fuels has led to a sharp increase in the concentration of greenhouse gases in the atmosphere, which has led to an increase in global warming. Therefore, green and renewable energy has been highly regarded by more and more countries. Among those types of energies, geothermal energy is now receiving wide attention because of its unique characteristics: wide distribution, resource-richeness, safety and stability, cleanliness and low-carbon nature.
In the four decades since China’s reform and opening up, rapid economic growth and the use of fossil fuels have made China the world’s largest carbon emitter (more than 100 million tons of CO2 per year). The direct use of geothermal energy has increased rapidly with the increasing demand for energy efficiency in buildings and the reduction of CO2 emissions, and has maintained its position as the world’s number one in recent years [1,2,3]. The North Jiangsu Basin is located in Jiangsu Province, the most developed province in (Eastern) China, and is a typical ‘hot in summer and cold in winter’ region. Existing detailed geological data, abundant geothermal resources [4], and an important economic basis are an important basis for the efficient utilization of geothermal resources in the North Jiangsu Basin and, at the same time, provide an important possible model for the future use of geothermal resources in the Yangtze River Delta.
The assessment of geothermal resources is the estimation of the amount of geothermal energy which might be extracted from the inner Earth and economically used in the future. A regional resource assessment can, on the one hand, provide a framework for the government or industry with a long-term energy strategy and policy, and on the other hand, help us to ensure rational planning and exploitation of geothermal resources. A geothermal resources assessment has been carried out using the volumetric method in the NJB [5,6,7] and the Jiangsu Province [8,9,10,11]. However, there are currently three main problems: (1) the low amount of geological and geothermal data constrains the accurate geothermal resources assessment; (2) carbonate thermal reservoirs are currently the most important and favorable reservoirs for geothermal resources, yet they have not attracted enough attention from researchers; (3) the volumetric method does not take into account the uncertainty of parameters involved, but rather assigns a specific value to the thermal storage geometry/physical property parameters.
This paper updates and summarizes high-quality temperature profiles measured in geothermal wells, oil wells, and national hydrological observation wells representative of the major structural units in the NJB. We established the whole density and porosity column of the strata (or rocks) in different geologic ages in the NJB. Specific heats of representative rocks from different thermal reservoirs were also determined. Based on these parameters, we evaluated the uncertainties in parameters such as reservoir area and temperature through Monte Carlo simulations and finally calculated the geothermal resource potential of the NJB (less than 10 km). We focused our study on considering parameter uncertainties (Monte Carlo method) and the evaluation of geothermal resources in deep carbonate thermal reservoirs. This research can provide reliable primary data for further study of the geothermal resource planning and development, long-term energy strategy policy, environmental protection, etc.
2. Geologic Setting
The NJB, situated in the northeastern Lower Yangtze Craton, is a Mesozoic-Cenozoic sedimentary basin. The basin is bounded by the Su’nan and the Sulu uplifts to the south and north, respectively, and bounded to the west by the Tancheng-Lujiang Fault Zone, with an area of approximately 35,000 km2. Controlled by NE-NNE faults, the NJB can be divided into the Jianhu uplift, the northern Yanfu depression, and the southern Dongtai depression, and the two depressions contain 22 highs and sags (Figure 1).
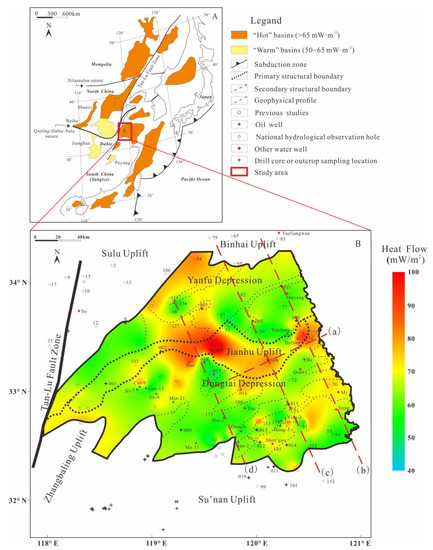
Figure 1.
Geothermal background in the North Jiangsu Basin. (A): Schematic geological map of East Asia (modified after Grimmer, et al. [12]). (B): Schematic geological structural map of the North Jiangsu Basin (modified after Wang, et al. [4]).
2.1. Tectonic Evolution and Stratigraphy
The basement of the NJB mainly consists of three parts, namely metamorphic rocks in the Proterozoic, the Yangtze marine clastic and carbonates in the Paleozoic-Mesozoic, and volcanic rocks forming in the Middle Triassic to Early Cretaceous (Qiu et al., 2006). Carbonate rocks in the NJB are mainly found in the Upper Ordovician-Ordovician (Huangxu Formation, Dengying Formation, Hetang Formation, Mufushan Formation, Paotaishan Formation, Guanyinshan Formation, Lunshan Formation, Honghuayuan Formation, Dawan Formation, and Tangtou Formation), Carboniferous (Jinling Formation, Laohudong Formation, Huanglong Formation, and Chuanshan Formation) and Permian (Qixia Formation, Gufeng Formation, Longtan Formation, and Dalong Formation) strata. Extensive drilling and geophysical data show that the sedimentary thickness since Paleozoic exceeds 11,000 m, with Cenozoic strata over 7000 m thick (Figure 2).
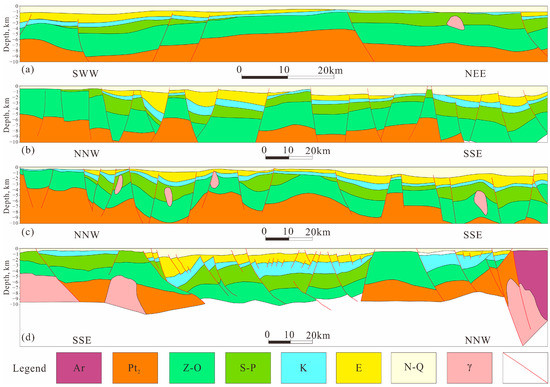
Figure 2.
Geological interpretation sections in the North Jiangsu Basin ((a,c) are modified from Wang, et al. [4] (b) is revised from oil company reports, (d) is modified from Chen [13], Qiao, et al. [14]). The four sections are shown in Figure 1B. Ar, Archean; Pt2, Mesoproterozoic; Z-O, Ediacaran to Ordovician; S-P, Silurian to Permian; K, Cretaceous; E, Paleogene; N-Q, Neogene to Quaternary; γ, Magmatic rock.
In the Triassic period, the NJB was uplifted due to the collision between North China Craton and Yangtze Craton, and the possible southward squeeze of the Siberian plate [15,16,17]. The Lower Yangtze craton thus entered the terrestrial sedimentary environment. Since then, the NJB has been primarily characterized by three tectonic evolution episodes: (1) Yizheng movement with fluvial facies and lacustrine facies, resulting in the Cretaceous Taizhou Formation and the Paleocene Fu’ning Formation; (2) Wubao movement with lake delta fluvial-lacustrine facies, forming the Eocene Dai’nan Formation and Sanduo Formation; and (3) Sanduo movement with the Neocene-Quaternary fluvial facies [18,19,20,21].
2.2. Geothermal Background
Thermal history research in the Lower Yangtze Craton suggests that the last tectono-thermal event in the NJB probably occurred in the early Palaeogene and that back-arc extension caused by the subduction of the Izanagi plate is likely to be the main reason. The thermal history inversions from the Yancan-1 and An-1 wells show that the peak heat flow value could be around 85 mW·m−2, after which it gradually decreased and stabilized [22]. The present-day high mantle heat flow (35–43 mW·m−2) indicates that the higher geothermal background in the NJB is probably mainly influenced by mantle activity [23].
A heat flow map is an important representation of the geothermal background of a structural unit and is an important basis for regional geothermal resources assessment. Based on previous work [4], we updated and produced an up-to-date heat flow map of the NJB: a total of 78 high-quality heat flow values from within the basin and 165 published heat flow data from around the basin were used (Figure 1). The distribution density of heat flow sites and the quality of heat flow data in the NJB are extremely high, both nationally and globally. The measured minimum and maximum heat flow values in the NJB are 46 mW·m−2 (Yandong-3) and 110 mW·m−2 (site 004), respectively, with an average value of 67 mW·m−2, which is higher than the mean heat flow in Continental China and line with the average global continental value [24,25]. As shown in Figure 1, the middle and eastern Jianhu Uplift, the northern Jinhu sag, and the eastern Dongtai sag in the NJB are relatively high heat flow regions (>70 mW·m−2). The Jianhu Uplift and Huai’an high have the highest geothermal heat flow, with an average geothermal value of over 72 mW·m−2, followed by the Sujiazui high and Xiaohai high, with average geothermal values of 71 mW·m−2. In general, heat flow values in the Jianghu uplift are higher than those in the depressions, and the heat flow in some highs of the depressions is also higher, with some even exceeding that in the Jianhu Uplift.
2.3. Types of Geothermal Reservoir
Thermal reservoirs in the NJB contains two primary types: Cenozoic sandstone thermal reservoirs, and Ediacaran-Paleozoic carbonate thermal reservoirs. Cenozoic thermal reservoirs can be divided vertically by lithology, porosity, temperature, etc., into the Palaeogene Dai’nan Formation (E2d), the Sanduo Formation (E3s), and the Neogene Yancheng Formation (Ny). The Dai’nan reservoir with its depth varying from 270 to 2800 m is deeper than the Sanduo reservoir (65–1900 m) and Yancheng reservoir (45–1700 m) and therefore has a higher temperature. The large porosity (>20%) of the Cenozoic sandstone thermal reservoirs results in good water-rich conditions and is an important basis for the efficient use of geothermal resources. The distribution of the Cenozoic sandstone thermal reservoirs in the NJB is shown in Figure 3.
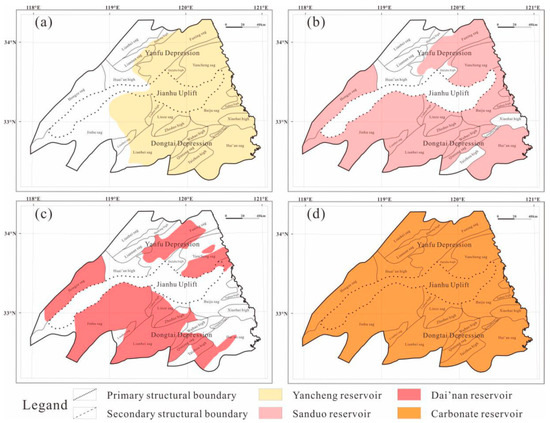
Figure 3.
Distribution of Cenozoic sandstone thermal reservoirs and carbonate thermal reservoirs in the North Jiangsu Basin. (a) Yancheng reservoir; (b) Sanduo reservoir; (c) Dai’nan reservoir; (d) Carbonate reservoir.
Numerous geophysical profiles and sedimentological evidence show that the NJB has a large-scale carbonate thermal reservoir at depth, characterized by a wide range and large scale [4,13,14,26,27,28]. Carbonate rocks in the NJB are much thicker and hotter than the Cenozoic sandstone thermal reservoirs, suggesting a very rich geothermal resource potential. The carbonate reservoirs in the NJB act as medium-high temperature reservoirs and provide optimum conditions for geothermal resource development. Due to the development of possible karst fissures inside the thermal reservoirs, which provide good access for groundwater activity, the heat energy from the deep can be rapidly transferred in a convective manner to the bottom of the sedimentary cover, giving the thermal reservoirs a high temperature. In addition, the unique water-rich nature and permeability of the carbonate karst zone contribute to the efficient extraction and recharge of groundwater. Although there is some variation in the stratigraphic thickness of the Ediacaran-Ordovician rocks, carbonate rocks develop at depth throughout the North Jiangsu Basin, as shown in Figure 3. Considering the accuracy of the profiles and the difficulty of extracting geothermal resources, we only evaluated carbonate thermal reserves above 10 km.
3. Methodology
3.1. Assessment Method
There are several methods (e.g., surface heat flux method, heat storage modeling, statistical analysis, analogy method) available for geothermal resources assessment, the most widely used being the volumetric method proposed by Muffler and Cataldi [29]. The volumetric method calculates the total geothermal energy in the fluids in the rock masses and pores of a study area, i.e., the geothermal energy accumulation. We use the volumetric method in combination with the Monte Carlo method to minimize parameter uncertainty. If the porosity of the reservoir and the thermophysical properties of the water and rock are known, then the total geothermal resources can be calculated by the following three equations (Equations (1)–(3)).
where QTotal, QW, and QR represent the total geothermal energy and that stored in pore water and rock, J; A (m2) and D (m) are the area and thickness of the thermal reservoirs; ρR and ρW denote the density of the geothermal reservoir and geothermal water, kg·m−3; cR and cW are the specific heat of the geothermal reservoir rock and geothermal water, J·kg−1·°C−1; φ is rock porosity, %; T and T0 represent the average temperature of geothermal reservoir and surface, °C.
QTotal = QR + QW
QR = A D (1 − φ) ρR cR (T − T0)
QW = A D φ ρW cW (T − T0)
3.2. Monte Carlo Simulation
The Monte Carlo simulation is a numerical simulation method in which probabilistic phenomena are studied as objects. It is a calculation method for inferring unknown quantities of characteristics by taking statistical values from sample surveys. The main steps involved in carrying out a geothermal resource evaluation using the Monte Carlo method are: (1) Defining the input parameter set; (2) Setting different distribution models for the input parameters; (3) Defining the relationship between input and output parameters according to the mathematical model; (4) Defining the output parameters; (5) Setting the number of iterations; (6) Simulating and analyzing the results of the calculations and provide a probability distribution function for each result.
In the Monte Carlo simulation process, different distribution models can be selected for the input parameters, e.g., uniform, pert, triangular, and lognormal distributions, with each model having its unique frequency distribution. Taking into account the range and pattern of variation of the different parameters, we give different distribution models for the input parameters. The distribution of the measured porosity in the formations suggests that the triangular distribution may be more consistent with the actual porosity pattern; two-dimensional profile and deep borehole data constrain the variation of the thermal reservoir thickness as the triangular distribution; the overall linear increasing of the temperature in thermal reservoirs indicates that a triangular distribution of reservoir temperature should be chosen; pert distribution models were chosen by the specific heat and rock density based on the skewness of distribution characteristics and continuity of parameter variation. Taking the Jinhu sag as an example, the following models are chosen for the input parameters (Figure 4): the annual average temperature (T0) and water density (ρW) are given a constant uniform model; the geothermal reservoir area (A) is set to a range of uniform distribution model; the variation of geothermal reservoir temperature (T), porosity (φ) and thickness (D) are given a triangular distribution model; for the specific heat of the geothermal reservoir rock (cR) and water (cW), and the rock density (ρR), the pert distribution model is chosen. Taking into account the accuracy of the simulation results, the number of iterations in this study was set to be 10,000.
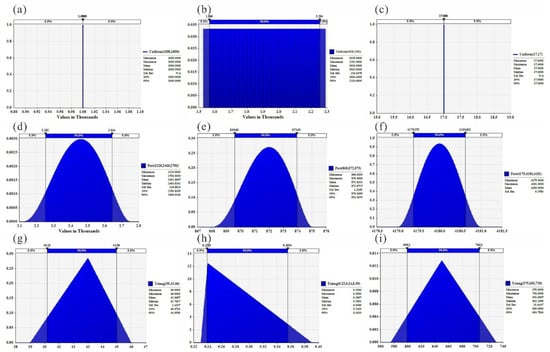
Figure 4.
Distribution models of input parameters in the Jinhu sag ((a) water density; (b) the geothermal reservoir area; (c) the annual average temperature; (d) the geothermal reservoir rock density; (e) the specific heat of rocks; (f) the specific heat of water; (g) geothermal reservoir temperature; (h) the geothermal reservoir rock porosity; (i) the thickness of the geothermal reservoir)).
4. Database
4.1. Temperature Logs
The determination of parameter ranges and distribution models is key for the assessment of geothermal resources. Temperature is one of the most important parameters for geothermal resources assessment and steady-state temperature measurement in boreholes is the most direct and effective way to obtain the true temperature in deeper formations. From 2018 to 2019, temperature profiles of 99 boreholes were acquired [4]. The temperature and depth data of the boreholes was measured using a consecutive logging system of a 5000 m long cable and a Platinum thermal resistance sensor. This field work is the first systematic steady-state temperature measurements in the whole NJB, with the same instruments and researchers. To date, we have obtained high-quality temperature logs from a total of 110 boreholes (Figure 1) and selected 28 representative temperature logs of each sub-structural unit in the NJB for display, as shown in Figure 5.
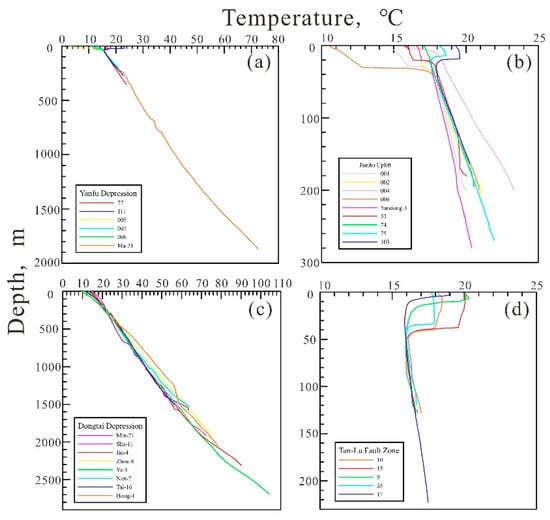
Figure 5.
The representative temperature-depth profiles for each sub-structural unit in the North Jiangsu Basi (a) Yanfu Depression; (b) Jianhu Uplift; (c) Dongtai Depression; (d) Tan-Lu Fault Zone. (modified from Wang, et al. [4].
The water level of each borehole (generally less than 40 m) can be determined according to the temperature logs (Figure 5). The temperature increases (nearly) linearly with depth more than 50 m, showing a conductive type [30,31]. Based on the depth and temperature data, the temperature gradients (the portion above (including) the Yancheng Formation) of each sub-structural unit in the NJB were calculated. Regionally, the middle-eastern Jianhu Uplift and the eastern Dongtai Depression is a zone of the high temperature gradient, with the average temperature gradient value higher than 35 °C·km−1. Vertically, the temperature gradient in the NJB increases with depth, and the temperature gradients of Ny and E2s-E2d are generally lower than that of E1f-K2t. Formations of the Neogene and above are characterized by a low temperature gradient, generally between 15–30 °C·km−1, which may be the result of heat redistribution and groundwater activity in the shallow. The high sand content in the Ny, E2s, and E2d formations, resulting in high thermal conductivity and low temperature gradients; whereas, the Palaeocene and Cretaceous formations have a relatively high mud content and thus a high temperature gradient of 30–40 °C·km−1.
4.2. Thermal Conductivity
Thermalphysical properties, particularly thermal conductivity measurement, are fundamental to the study of regional deep geothermal field. We carried out thermal conductivity test on 264 samples (Table 1; sample locations, see Figure 1). Moreover, we collected the thermal conductivity data tested by Wang and Shi, and Wang et al. [32,33] (Table 1). According to the data above, we established the thermal conductivity column of different formations (Erathem) in the NJB (Table 1).

Table 1.
Thermal conductivity of the formations in the North Jiangsu Basin.
The results show that the average thermal conductivity of the strata in the region fluctuates considerably, with the smallest value being the clay and sand of the Quaternary with a thermal conductivity of 0.6 W·m−1·K−1 and the largest value being the Silurian S2m1 with a thermal conductivity of 8.0 W·m−1·K−1. In general, the thermal conductivity shows a gradual decrease with the strata from old to new. The thermal conductivity of the Palaeozoic strata is generally high, greater than 3.0 W·m−1·K−1; the Mesozoic strata have the second highest thermal conductivity, mostly 2.0–3.0 W·m−1·K−1; and the Cenozoic strata have the lowest thermal conductivity, between 1.5 and 2.5 W·m−1·K−1. The stratigraphic thermal conductivity of the NJB can be roughly divided into two parts, namely the shallow low thermal conductivity section and the deep high thermal conductivity section. The shallow Cretaceous-Quaternary thermal conductivity is low (<2.7 W·m−1·K−1), especially the Late Paleozoic-Quaternary thermal conductivity is mostly less than 2.0 W·m−1·K−1, which can provide a good cover for heat preservation. The thermal conductivity of the deeper Ediacaran-Jurassic is relatively high, generally greater than 3.0 W·m−1·K−1, especially the thermal conductivity of the Silurian-Devonian and Ediacaran-Cambrian can be more than 4.0 W·m−1·K−1, and the thermal conductivity of the Dengying Formation can be more than 6.0 W·m−1·K−1, all of which can be used as good thermal storage layers.
4.3. Input Parameters
The temperature range of the geothermal reservoirs is an important parameter for geothermal resource assessment. In combination with the geophysical profiles, we used Equation (4) to calculate the temperature range corresponding to each thermal reservoir at depth (z), based on the average heat flow (Qs) in the various sub-structural units in the NJB. The temperature at a given depth for heat flow in each sub-structural unit in the NJB with a constant surface heat flow Qs, surface temperature T0, thermal conductivity λ, and radiogenic heat production A is defined as
where λ (W·m−1·K−1) and A (μW·m−3) represent the measured thermal conductivity and heat production of the rock, respectively.
T(z) = T0 + z Qs/λ − z2 A/(2λ)
The main parameters, such as porosity and heat production, are measured data, and detailed explanations are given in Wang, et al. [4]. In addition, we carried out measurements for specific heat, porosity, and density for the main lithologies of each geothermal reservoirs, other parameters were mainly set regarding the literature: the annual average temperature of each sub-structural units [34] and water density (1000 kg·m−3) were taken as constant values; the specific heat of the water in the geothermal reservoir varied with temperature [35]; the variation in thickness and area of the geothermal reservoir was mainly based on actual geophysical profiles and sedimentological evidence [4,13,14,28,36]. The parameters for the Yancheng Formation, the Sanduo Formation, the Dai’nai Formation, and the carbonate thermal reservoirs are reported in Table 2, Table 3, Table 4 and Table 5, respectively (the most likely values are shown in parentheses).
Table 2.
Parameters for the Yancheng Formation thermal reservoir.
Table 3.
Parameters for the Sanduo Formation thermal reservoir.
Table 4.
Parameters for the Dai’nan Formation thermal reservoir.
Table 5.
Parameters for the carbonate thermal reservoir.
5. Results
5.1. Simulation of the Cenozoic Sandstone Thermal Reservoirs
According to the parameters in Table 2, we used the Monte Carlo method to calculate the geothermal resource base for the thermal reservoir of the Neogene Yancheng Formation in the NJB. Figure 6a indicates the geothermal resource base in which the value varies from 6.6 × 10²⁰ J to 1.2 × 10²¹ J (mean value (8.6 ± 0.6) × 1020 J), with the highest probability being 0.86 × 10²¹ J (probability > 8 %) and a 90 % probability of a range of (0.76–0.96) × 1021 J. It shows a geothermal resource potential of 3.5 × 10¹⁶ J·km−2 by dividing the average value by the Yancheng thermal reservoir area.
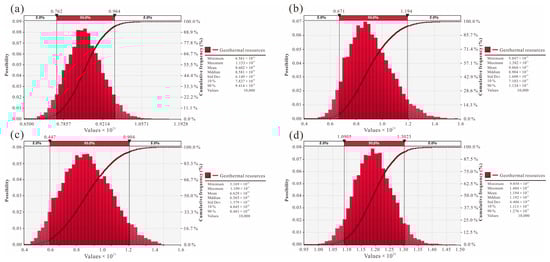
Figure 6.
Simulation results for the primary thermal reservoirs in the North Jiangsu Basin ((a) Yancheng thermal reservoir; (b) Sanduo thermal reservoir; (c) Dai’nan thermal reservoir; (d) carbonate thermal reservoir).
Figure 6b shows the potential of the geothermal resource in which the value changes from 5.0 × 10²⁰ J to 1.6 × 10²¹ J with a mean value of (9.1 ± 0.2) × 1020 J), with nearly 7% probability of the most likely value of 0.86 × 10²¹ J, and a probability of < 5% that the geothermal resources > 1.2 × 10²¹ J or < 0.67 × 10²¹ J. Dividing by area, it indicates a geothermal potential of 4.5 × 10¹⁶ J·km−2.
Figure 6c presents a geothermal resource potential for the Dai’nan thermal reservoir of 3.2 × 10²⁰ J to 1.1 × 10²¹ J with a mean value of (6.6 ± 0.1) × 1020 J), with a 90 % probability that the energy potential is (0.45–0.90) × 1021 J. Considering the geothermal resource potential per unit of thermal storage area, it indicates a potential of 6.7 × 10¹⁶ J·km−2.
5.2. Simulation of the Carbonate Thermal Reservoirs
Figure 6d indicates that the geothermal resource potential for the carbonate thermal reservoir sums to 9.9 × 10²¹ J to 1.5 × 10²² J with a mean value of (1.2 ± 0.1) × 1022 J). From Figure 6d, we can get that the geothermal potential is above 1.3 × 10²² J or below 1.1 × 10²² J in which the probability is less than 5 %, and the most likely value of the whole is 1.2 × 10²² J (nearly 8%). The geothermal resource potential per unit of the thermal storage area is 3.7 × 10¹⁷ J·km−2, which is much larger than that of the Cenozoic sandstone thermal reservoirs. The geothermal resource base of the carbonate thermal reservoir in the NJB is extremely large, indicating a great potential for geothermal resources.
5.3. Monte Carlo Simulation Results for the Total Geothermal Resources in the North Jiangsu Basin
The total geothermal resource base of the Cenozoic sandstone and carbonate thermal reservoirs were estimated through running the Monte Carlo simulation for iterations, with the results being shown in Figure 7. It indicates the geothermal resource base in which the value ranges from 1.2 × 10²² J to 1.7 × 10²² J (mean value (1.4 ± 0.1) × 1022 J), with the highest probability being 1.4–1.5 × 10²² J (probability nearly 7%), and a 90 % probability of a range of (1.3–1.6) × 1022 J. The Yancheng, Sanduo, Dai’nan, and carbonate thermal reservoirs account for about 6%, 6%, 5%, and 83% of the total geothermal resource base, respectively.
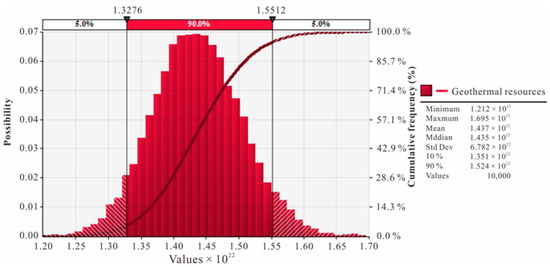
Figure 7.
Geothermal resource potential simulation results for the sum of the four thermal reservoirs.
6. Conclusions
This study used the Monte Carlo method to perform the detailed assessment of geothermal resources in the North Jiangsu Basin. Geothermal resources within the Cenozoic sandstone and carbonate (<10 km) thermal reservoirs total (1.2–1.7) × 1022 J, with a mean value of (1.4 ± 0.1) × 1022 J and a most likely value of 1.4 × 10²² J, which is equivalent to 4.9 × 10¹³ tons of standard coal heat content. Moreover, the most promising carbonate thermal reservoir owns an average geothermal resource potential of (1.2 ± 0.1) × 1022 J, about five times that of the Cenozoic thermal reservoirs. The abundant geothermal energy of the North Jiangsu Basin may alleviate energy shortages to a certain extent and promote exemplary geothermal heating in the ‘hot in summer and cold in winter’ region of the Yangtze River Delta.
Author Contributions
Conceptualization, Y.W. (Yibo Wang) and Y.B.; methodology, Z.W.; software, J.H.; validation, J.H. and S.H.; formal analysis, Y.W. (Yibo Wang) and Y.W. (Yaqi Wang); investigation, Y.W. (Yibo Wang), Z.W., D.H. and Y.B.; data curation, L.W. and Z.W.; writing—original draft preparation, Y.W. (Yibo Wang); writing—review and editing, Y.B.; visualization, Z.W.; supervision, S.H.; project administration, S.H.; funding acquisition, L.W. All authors have read and agreed to the published version of the manuscript.
Funding
This research was accomplished under the support of the Jiangsu Fund Project (Special Study on the Investigation of Geothermal Field and Crustal Thermal Structure in the North Jiangsu Basin, JITC-1902AW2919; JITC-1802AW2292).
Institutional Review Board Statement
Not applicable.
Informed Consent Statement
Not applicable.
Data Availability Statement
The data presented in this study are available on request from the corresponding author. The data are not publicly available due to [Privacy].
Acknowledgments
We thank the Geological Survey of Jiangsu Province very much, who provided enormous amount of help on the borehole selection and sample collection that are significant for our temperature logging work and geothermal resources assessment.
Conflicts of Interest
The authors declare no conflict of interest.
References
- Lund, J.W.; Boyd, T.L. Direct Utilization of Geothermal Energy 2015 Worldwide Review. Geothermics 2016, 60, 66–93. [Google Scholar] [CrossRef]
- Lund, J.W.; Freestod, D.H.; Boyd, T.L. Direct Utilization of Geothermal Energy. Geothermics 2011, 40, 159–180. [Google Scholar] [CrossRef]
- Lund, J.W.; Toth, A.N. Direct utilization of geothermal energy 2020 worldwide review. Geothermics 2021, 90, 101915. [Google Scholar] [CrossRef]
- Wang, Y.; Hu, D.; Wang, L.; Guan, J.; Bai, Y.; Wang, Z.; Jiang, G.; Hu, J.; Tang, B.; Zhu, C.; et al. The present-day geothermal regime of the North Jiangsu Basin, East China. Geothermics 2020, 88, 101829. [Google Scholar] [CrossRef]
- Min, W.; Yu, Y.; Lu, Y.; Gu, X. Assessment and zoning of geothermal resources in the northern Jiangsu Basin. Shanghai Land Resour. 2015, 36, 90–94. [Google Scholar]
- Wang, S.; Hu, J.; Yan, J.; Li, F.; Chen, N.; Tang, Q.; Guo, B.; Zhan, L. Assessment of Geothermal Resources in Petroliferous Basins in China. Math. Geol. 2019, 51, 271–293. [Google Scholar] [CrossRef]
- Zhang, W.; Wang, G.; Liu, F.; Xing, L.; Li, M. Characteristics of geothermal resources in sedimentary basins. Geol. China 2019, 46, 255–268. [Google Scholar]
- Wang, Y.; Liu, Y.; Dou, J.; Li, M.; Zeng, M. Geothermal energy in China: Status, challenges, and policy recommendations. Util. Policy 2020, 64, 101020. [Google Scholar] [CrossRef]
- Hou, J.; Cao, M.; Liu, P. Development and utilization of geothermal energy in China: Current practices and future strategies. Renew. Energy 2018, 125, 401–412. [Google Scholar] [CrossRef]
- Xu, L.; Wang, L.; Yang, Q. An Estimation of Hot-Dry-Rock (HDR) Resources in Jiangsu Province. Geol. J. China Univ. 2014, 20, 464–469. [Google Scholar]
- Zhu, J.; Hu, K.; Lu, X.; Huang, X.; Liu, K.; Wu, X. A review of geothermal energy resources, development, and applications in China: Current status and prospects. Energy 2015, 93, 466–483. [Google Scholar] [CrossRef]
- Grimmer, J.C.; Jonckheere, R.; Enkelmann, E.; Ratschbacher, L.; Hacker, B.R.; Blythe, A.E.; Wagner, G.A.; Wu, Q.; Liu, S.; Dong, S. Cretaceous−Cenozoic history of the southern Tan-Lu fault zone: Apatite fission-track and structural constraints from the Dabie Shan (eastern China). Tectonophysics 2002, 359, 225–253. [Google Scholar] [CrossRef]
- Chen, A. Tectonic features of the Subei Basin and the forming mechanism of its dustpan-shaped fault depression. Oil Gas Geol. 2010, 31, 140–150. [Google Scholar]
- Qiao, X.; Li, G.; Ming, L.; Wang, Z. CO2 storage capacity assessment of deep saline aquifers in the Subei Basin, East China. Int. J. Greenh. Gas Control 2012, 11, 52–63. [Google Scholar] [CrossRef]
- Guo, X.; Encarnacion, J.; Xu, X.; Deino, A.; Li, Z.; Tian, X. Collision and rotation of the South China block and their role in the formation and exhumation of ultrahigh pressure rocks in the Dabie Shan orogen. Terra Nova 2012, 24, 339–350. [Google Scholar] [CrossRef]
- Yin, A.; Nie, S. An indentation model for the North and South China collision and the development of the Tan-Lu and Honam Fault Systems, eastern Asia. Tectonics 1993, 12, 801–813. [Google Scholar] [CrossRef]
- Zhang, R.Y.; Liou, J.G.; Ernst, W.G. The Dabie–Sulu continental collision zone: A comprehensive review. Gondwana Res. 2009, 16, 1–26. [Google Scholar] [CrossRef]
- Chen, A. Dynamic mechanism of formation of dustpan subsidence, Northern Jiangsu. Geol. J. China Univ. 2001, 07, 408–418. [Google Scholar]
- Lu, Y.; Xu, Y.; Liu, M.; Yan, M.; Xu, S.; Lu, W. Tectonic features and evolution of the north margin of Northern Jiangsu Basin revealed by seismic reflection profile. J. Geol. 2017, 41, 624–630. [Google Scholar]
- Qian, J. Oil and gas fields formation and distribution of Subei Basin-research compared to Bohai Bay Basin. Acta Pet. Sin. 2001, 22, 12–16. [Google Scholar]
- Qiu, H.; Xu, Z.; Qiao, D. Progress in the study of the tectonic evolution of the Subei basin, Jiangsu, China. Geol. Bull. China 2006, Z2, 1117–1120. [Google Scholar]
- Zeng, P. The Application of the Thermometric Indicators to the Study of Thermal Evolution in the Lower-Yangtze Region; China University of Geosciences: Beijing, China, 2005. [Google Scholar]
- Wang, Y. Differences of Thermal Regime of the Cratons in Eastern China and Discussion of Its Deep Dynamic Mechanism; University of Chinese Academy of Sciences: Beijing, China, 2020. [Google Scholar]
- Jiang, G.; Hu, S.; Shi, Y.; Zhang, C.; Wang, Z.; Hu, D. Terrestrial heat flow of continental China: Updated dataset and tectonic implications. Tectonophysics 2019, 753, 36–48. [Google Scholar] [CrossRef]
- Lucazeau, F. Analysis and Mapping of an Updated Terrestrial Heat Flow Data Set. Geochem. Geophys. Geosyst. 2019, 20, 1–24. [Google Scholar] [CrossRef]
- Zeng, P. Comprehensive Interpretation of Large Section of G78 Area and Structural Features of Subei Basin. J. Oil Gas Technol. 2007, 29, 82–86. [Google Scholar]
- Fang, C.; Huang, Z.; Teng, L.; Xu, F.; Zhou, D.; Yin, Q.; Shao, W.S. Lithofacies palaeogeography of the Late Ordovician Kaitian Stage-the early Silurian Rhuddanian Stage in Lower Yangtze region and its petroleum geological significance. Geol. China 2020, 47, 144–160. [Google Scholar]
- Zhao, T. Structural Characteristics of Marine Mesozoic and Paleozoic and Prediction of Distribution of Their Main Assemblage in the Northern Jiangsu Area. Master’s Thesis, China University of Petroleum, Qingdao, China, 2017. [Google Scholar]
- Muffler, P.; Cataldi, R. Methods for regional assessment of geothermal resources. Geothermics 1977, 7, 53–89. [Google Scholar] [CrossRef]
- Hu, S.; He, L.; Wang, J. Heat flow in the continental area of China: A new data set. Earth Planet. Sci. Lett. 2000, 179, 407–419. [Google Scholar] [CrossRef]
- Pasquale, V.; Verdoya, M.; Chiozzi, P. Geothermics: Heat Flow in the Lithosphere; Springer: Berlin/Heidelberg, Germany, 2014; pp. 15–49. [Google Scholar]
- Wang, L.; Li, C.; Shi, Y.; Wang, Y. Distribution of geotemperature and terrestrial heat flow density in lower Yangtze area. Chin. J. Geophys. 1995, 38, 469–476. [Google Scholar]
- Wang, L.; Shi, Y. Geothermal Study on the Oil and Gas Basin; Nanjing University Press: Nanjing, China, 1989. [Google Scholar]
- Liu, J.Y.; Zhuang, D.F.; Luo, D.; Xiao, X. Land-cover classification of China: Integrated analysis of AVHRR imagery and geophysical data. Int. J. Remote Sens. 2003, 24, 2485–2500. [Google Scholar] [CrossRef]
- Engineering ToolBox. Water-Specific Heat. 2004. Available online: https://www.engineeringtoolbox.com/specific-heat-capacity-water-d_660.html (accessed on 30 December 2004).
- Yang, L. The Structural Evolution in the Cenozoic of Subei Basin and Its Relationship with Oil and Gas. Master’s Thesis, Yangtze University, Wuhan, China, 2015. [Google Scholar]


Publisher’s Note: MDPI stays neutral with regard to jurisdictional claims in published maps and institutional affiliations. |
© 2021 by the authors. Licensee MDPI, Basel, Switzerland. This article is an open access article distributed under the terms and conditions of the Creative Commons Attribution (CC BY) license (http://creativecommons.org/licenses/by/4.0/).