Article

Influence of Replacement of Sodium Lamps in Park Luminaires with LED Sources of Different Closest Color Temperature on the Effect of Light Pollution and Energy Efficiency

by
Przemyslaw Tabaka
Institute of Electrical Power Engineering, Lodz University of Technology, 90-537 Lodz, Poland
Energies 2021, 14(19), 6383; https://doi.org/10.3390/en14196383
Submission received: 31 August 2021 / Revised: 24 September 2021 / Accepted: 1 October 2021 / Published: 6 October 2021
(This article belongs to the Section B: Energy and Environment)

Abstract

:
According to the European Union (EU) regulations, EU members are obligated, among others, to improve the energy efficiency in the outdoor lighting sector. One of the ways to consider this fact is to install LED sources in luminaires. Due to the reasonable lighting requirements for the lighting of squares and parks, the cheapest way to modernize lighting is to replace conventional discharge lamps with LED sources in park luminaires. Using nine typical park luminaires, the influence of replacing classic sodium lamps with LED sources on the effect of light pollution and energy efficiency was analyzed. Using data, such as a photometric solid and a relative spectral distribution, simulation calculations were carried out in DIALux software and our own calculation tool to consider this issue. The studies considered 156 LED sources of different spectral distributions and a wide range of color temperatures from 1000 K to 9753 K as well as different color rendering index (CRI) values. The conducted studies showed that the replacement of sodium lamps with LED sources is not necessarily associated with an increased negative impact on the effect of light pollution. It was also found also that the CRI value has an influence on the degree of light pollution.

1. Introduction

It is believed that criminal behavior is usually associated with darkness. Poor visibility increases the sense of threat [1]. It can therefore be concluded that public lighting affects the comfort and sense of security of residents. The authors of several works [2,3,4] have drawn attention to this aspect, demonstrating that outdoor night lighting increases the social perception of safety. Night lightning is an indispensable element not only of road equipment but also of sidewalks, paths, and squares in residential areas. The results of the experiment published in [5] clearly show that lighting has a significant impact on the detection of obstacles by pedestrians. Artificial outdoor lighting prolongs the activity of men after dark. For this reason, lighting of green areas is becoming increasingly more popular. However, the use of artificial lighting is related to, among others, energy consumption. For example, according to [6], energy consumption in public lighting accounts for 2.3% of global electricity consumption. This is why all solutions minimizing the consumption of electricity are welcome, because, as described in [7,8,9], energy savings in street lighting can be significant and may even exceed 50%. The increasing demand for energy is one of the key problems of the modern world. As reported in [10], the global use of artificial lighting at night has steadily increased over the past few centuries and continues to grow. Hence, one of the priority actions of European Union (EU) authorities is to reduce the consumption of electricity, including for lighting purposes. The effect of this is the process of withdrawing energy-consuming light sources [11] and replacing them with modern, energy-saving light sources built on semiconductor elements. The requirements concerning energy efficiency force the use of light sources that are characterized by high luminous efficiency [12]. Currently, most energy-saving light sources are light-emitting diode (LED) lamps [13]. As reported in [14,15,16,17], the luminous efficiency of LED sources is greater than that of high-pressure sodium (HPS) lamps. An additional argument in favor of LED sources is their longer durability compared to discharge lamps [6]. The use of LED sources is intended to reduce not only electricity bills [18], but also reduce greenhouse gas emissions to the atmosphere [11]. It is also worth noting that LEDs do not contain mercury [19], unlike high-pressure sodium lamps [20]. Hence, LED lamps are commonly perceived as being more environmentally friendly. In addition, in the case of LED sources, due to the twilight nature of vision, the actual lighting effect assessed by observers will be greater than the calculated effect. This fact is particularly important in the case of outdoor lighting [21,22,23].
However, the significant problem connected with the use of outdoor lighting is the problem of light pollution (LP). The number of works devoted to this issue is large, which clearly indicates its importance [24,25,26,27,28,29].
In the literature, one can find proposals concerning the installation of external lighting that take into account the light pollution issue [30,31,32]. Despite this, the issue of LP in public discussion is treated marginally.
One of the most popular luminaires used to illuminate green areas, sidewalks, residential roads, and private areas is an opal sphere-type luminaire [33]. It should be noted without a doubt that such a solution is outdated, but luminaires with such configurations are still being produced. Moreover, opal sphere-type luminaires are produced with LED sources [34,35,36]. In addition, many companies produce LED lamps [37,38,39] that are intended to replace classic discharge lamps used in outdoor luminaires. Due to the high popularity of LED sources and costs (the cost of replacing the discharge lamp is much lower than the replacement of the entire luminaire), city authorities often decide to modernize lighting solely by replacing only the light source.
Obviously, in the lighting of green areas, other luminaires than the above-mentioned opal sphere-type luminaires are applied. For this reason, in this work, the author considered other luminaires cooperating with lamps with different spectral characteristics. However, it is important to point out that this paper does not attempt to recommend modernizing external lighting by replacing the light source, but due to the fact that such practices are often used in Poland, the aim of this work is to show the real problems and needs in terms of the light pollution effect.
It is predicted that the use of LED technology will adversely affect both the brightness and color of the night sky, as pointed out by the authors of [40]. The reason for this is the higher content of blue radiation in the radiation spectrum of LED lamps than in the case of HPS. Most of the LED sources currently used in outdoor lighting contain a large amount of blue light [41]. On this occasion, it is worth emphasizing that shorter waves are more dispersed in the atmosphere, which explains the origin of the blue sky [42,43]. Despite the huge electricity savings [44], the use of LED lighting can increase the LP effect [41,45,46]. In another work [47], an increase in the balm of the night sky was noticed as a result of the modernization (from HPS to LED) of road lighting in Krakow, Poland. Similar conclusions were found in [41]. As a result of modernization of the lightning in Madrid, Spain, large changes in the brightness and color of the night sky were observed. This change was caused by modernization of the street lighting, as a result of which a significant numberof HPS lamps were replaced with LED sources. An increase in the brightness of the night sky due to the application of LED technology was also noticed in Germany [48]. Blue light was noticed to have a negative effect on plants. For example, in the works [49,50], it was noted that blue light (the share of which is greater in the case of LED sources) accelerates spring bud break. In another work, the authors stated that replacing low-pressure sodium (LPS) lamps with LED may have a significant impact on decreasing the activity of bats [51]. However, the problems of the largest nature are raised by astronomers. The glow of the night sky adversely affects astronomical research [45,52]. The authors of [53] concluded that as much as 88% of Europe’s land has a night sky that astronomers consider as polluted.
The replacement of sodium lamps in outdoor lighting installations with LED sources on a mass scale is a source of hope for significant savings in electricity, but also a source of numerous concerns. Therefore, there is a need to analyze the consequences of replacing old lighting technology with modern LED sources. The issue of the influence of the luminaire type on the effect of light pollution has been discussed in earlier works in which the author was involved. In the work [54], relative changes in the lighting intensity were calculated on a computational grid located above a park alley. The replacement of classic HPS lamps with lamps, such as a super HPS with a high color rendering index (CRI) value, a high-pressure metal halide lamp, two LED sources with different light colors (warm and cold), and an equal energy source, was considered. In the studies presented, the spectral distributions of the unshielded light sources (without any luminaire) were taken into account, and the theoretical (common for all light sources) photometric form of a sphere was adopted. When assessing the impact on the increase of the brightness of the night sky, it was assumed that the observer is a human whose eye is adapted to photopic (daytime) vision. Identical light sources in the analysis of the impact on the glare of the sky were taken into account in [55]. The difference was that the park alley was replaced with a square base, and the photometric shape of the opal sphere-type luminaire was analyzed. In [56], while considering the impact on the glare of the night sky, several luminaires were considered, the photometric solids of which were generated on the basis of mathematical relationships. Spectral characteristics have been omitted in such studies. In turn, a greater number of light sources (20 pcs) were included in [33], where analysis of the LP effect concerned the actual shapes of photometric solids and spectral distributions as well as the scotopic (night) nature of human vision.
Due to the rapid development of LED technology, we decided to consider a larger number of LED sources and park luminaires than ever done before in order to show comprehensively the problem of the influence of replacing sodium lamps with LED sources in park luminaires on the effect of light pollution and energy efficiency. The author decided to use actual data, from laboratory measurements, to carry out complex calculations, which then were used for analyzing the mentioned influence from different points of view. Based on the obtained data, such as a photometric solid and a relative spectral distribution, simulation calculations were carried out in the DIALux software as well as in our own calculation tool to consider this issue. The considerations took into account 156 LED sources of different spectral distributions and of a wide range of color temperatures from 1000 K to 9753 K as well as different color rendering index (CRI) values. All these features were analyzed to show how they impact on the increase in the brightness of the night sky, both individually and jointly.
The article is organized as follows: Section 2 defines the subject and scope of the research. The research methodology is also illustrated. Section 3 presents the results of laboratory measurements that serve as input data for the numerical calculations. Section 3 is a kind of case study, because the possibility of cooperation of typical park luminaires with two types of light sources: sodium lamps and LED sources, is considered. Section 4 contains observations (conclusions) resulting from the conducted laboratory measurements and numerical calculations.

2. Scope and Methodology of the Studies

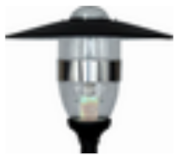
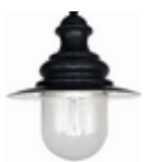
The studies included 9 typical luminaires, which are mainly used to illuminate green areas (parks, squares). A characteristic feature of these luminaires is the ability to easily replace the light source mounted in them. Among the tested luminaires, four with a spherical lampshade and five stylized ones were analyzed. These luminaires usually work HPS lamps, although recently, LED lamps have been installed in them too, which, according to the manufacturers, are intended to replace classic lamps to save on investment funds. In order to analyze the impact of modernization of outdoor lighting, i.e., replacing the light source in the luminaire, laboratory measurements were carried out. The cooperation of each luminaire with three different sodium lamps: one low-pressure sodium (LPS) lamp and two high-pressure sodium lamps (with the ellipsoidal bulb HPS 1 and HPS 2), as well as with an LED source was considered. Photos of the luminaires considered and the light sources analyzed are presented in Figure 1.
The basic data concerning the light sources are displayed in Table 1. This table includes the rated power consumed by the light source (PLS), type of cap, nominal luminous flux of the uncovered light source (ΦLS), correlated color temperature (CCT), color rendering index (CRI), luminous efficiacy (ηLS), and mercury content (Hg).
The sodium lamps (like all discharge lamps) cannot be directly connected to the mains. They require the use of an appropriate power supply system (ballast) [57]. This means that the total power consumed by the entire system (lamp plus power supply) will be greater than that given in Table 1. The exception is the LED source, which is equipped with an appropriate power supply (integrated with the lamp) by the manufacturer, so it does not require the installation of additional elements in the lamp circuit. Thus, the actual luminous efficacy of the sodium lamps (LPS, HPS 1, HPS 2) will be lower. It is also worth noting that the total power consumed by the luminaire also depends on the type of ballast used. All the luminaires considered within the studies were equipped with a magnetic ballast, which was used to power the HPS 1 and HPS 2 lamps. In the case of the LED source, the power supply system (ballast) was disconnected. In the case of the LPS lamp, an electronic ballast dedicated by the manufacturer was used.
For each light source, the light distribution measurements were obtained based on the well-known goniophotometric method [58]. The measurements were carried out in the C-γ system, which is the most popular form of space orientation around the luminaire [59]. In this system, half-planes are marked by a capital letter “C” together with a number denoting the dihedral angle between the half-plane considered to be the origin and the current half-plane.
Due to the fact that the photometric body of the luminaire is a result of processing the photometric body of the installed light source, for each of the luminaires shown in Figure 1, measurements were carried out of the individual light sources (LPS, HPS 1, HPS 2, and LED) were installed in the luminaires. In total, 4 photometric solids were obtained for the uncovered light sources and te 36 photometric solids were obtained for the 9 luminaires cooperating with 4 lamps. Using the data from the measurements, photometric files were generated in the EULUMDAT format, commonly accepted in Europe [60], which is the format commonly accepted by most of the calculation programs. In the next step, the data were used to carry out the calculations in the DIALux 4.13 computer program supporting the lighting design process. The photometric files of the 9 luminaires equipped with LPS, HPS 1, HPS 2, and LED lamps were implemented in the DIALux computer program. Then, a model of a virtual substrate was created, which was shaped into a square. In the center of this square, a lantern was placed with a height of 4 m. In order to calculate the luminous flux emitted by the individual luminaire towards the ground and towards the sky, two calculation grids were prepared. The first calculation grid was placed directly on the ground while the second was parallel to the ground at a height of 14 m. The choice of 14 m was dictated by the recommendations of the literature [61], where it was suggested that the calculation grid should be located 10 m above the luminaire. Due to the different designs of the luminaires (which affect the different light distributions) and to take into account the entire luminous flux hitting the surfaces of both grids, dimensions of the grids of 250 × 250 m were adopted. The applied dimensions of the calculation grids allowed the obtained values of illuminance at their edges to equal zero, which clearly indicates that further increasing the mesh size is unjustified.
Since the spectral distribution of the radiation emitted by the lamps plays a key role in influencing the light pollution as well as in the effectiveness of light impressions caused by radiation, spectral characteristics were recorded for each of the four lamps. In order to extend the scope of the research, the considerations additionally take into account the spectral characteristics of the 155 LED sources with a wide range of correlated color temperatures (from 1000 K to over 9000 K). The data were obtained from an online database [62] and from our own laboratory tests carried out over several years. All the measurements were carried out at a supply voltage equal to 230 V rms (root mean square). To eliminate the influence of the changes in the voltage supplied, an ESN 2000 voltage stabilizer was used, which ensured a constant rms value of the output voltage with an accuracy of 0.2%. Registration of selected quantities with regard to the light sources and the luminaires was done after one hour from the moment of the voltage being supplied. According to the information provided in [63], this time is sufficient to conclude that the individual parameters of the lamps are stabilized. The integrating sphere was used to determine the spectral characteristics while the electrical parameters were recorded with the use of an Norma 4000 power analyzer produced by FLUKE.
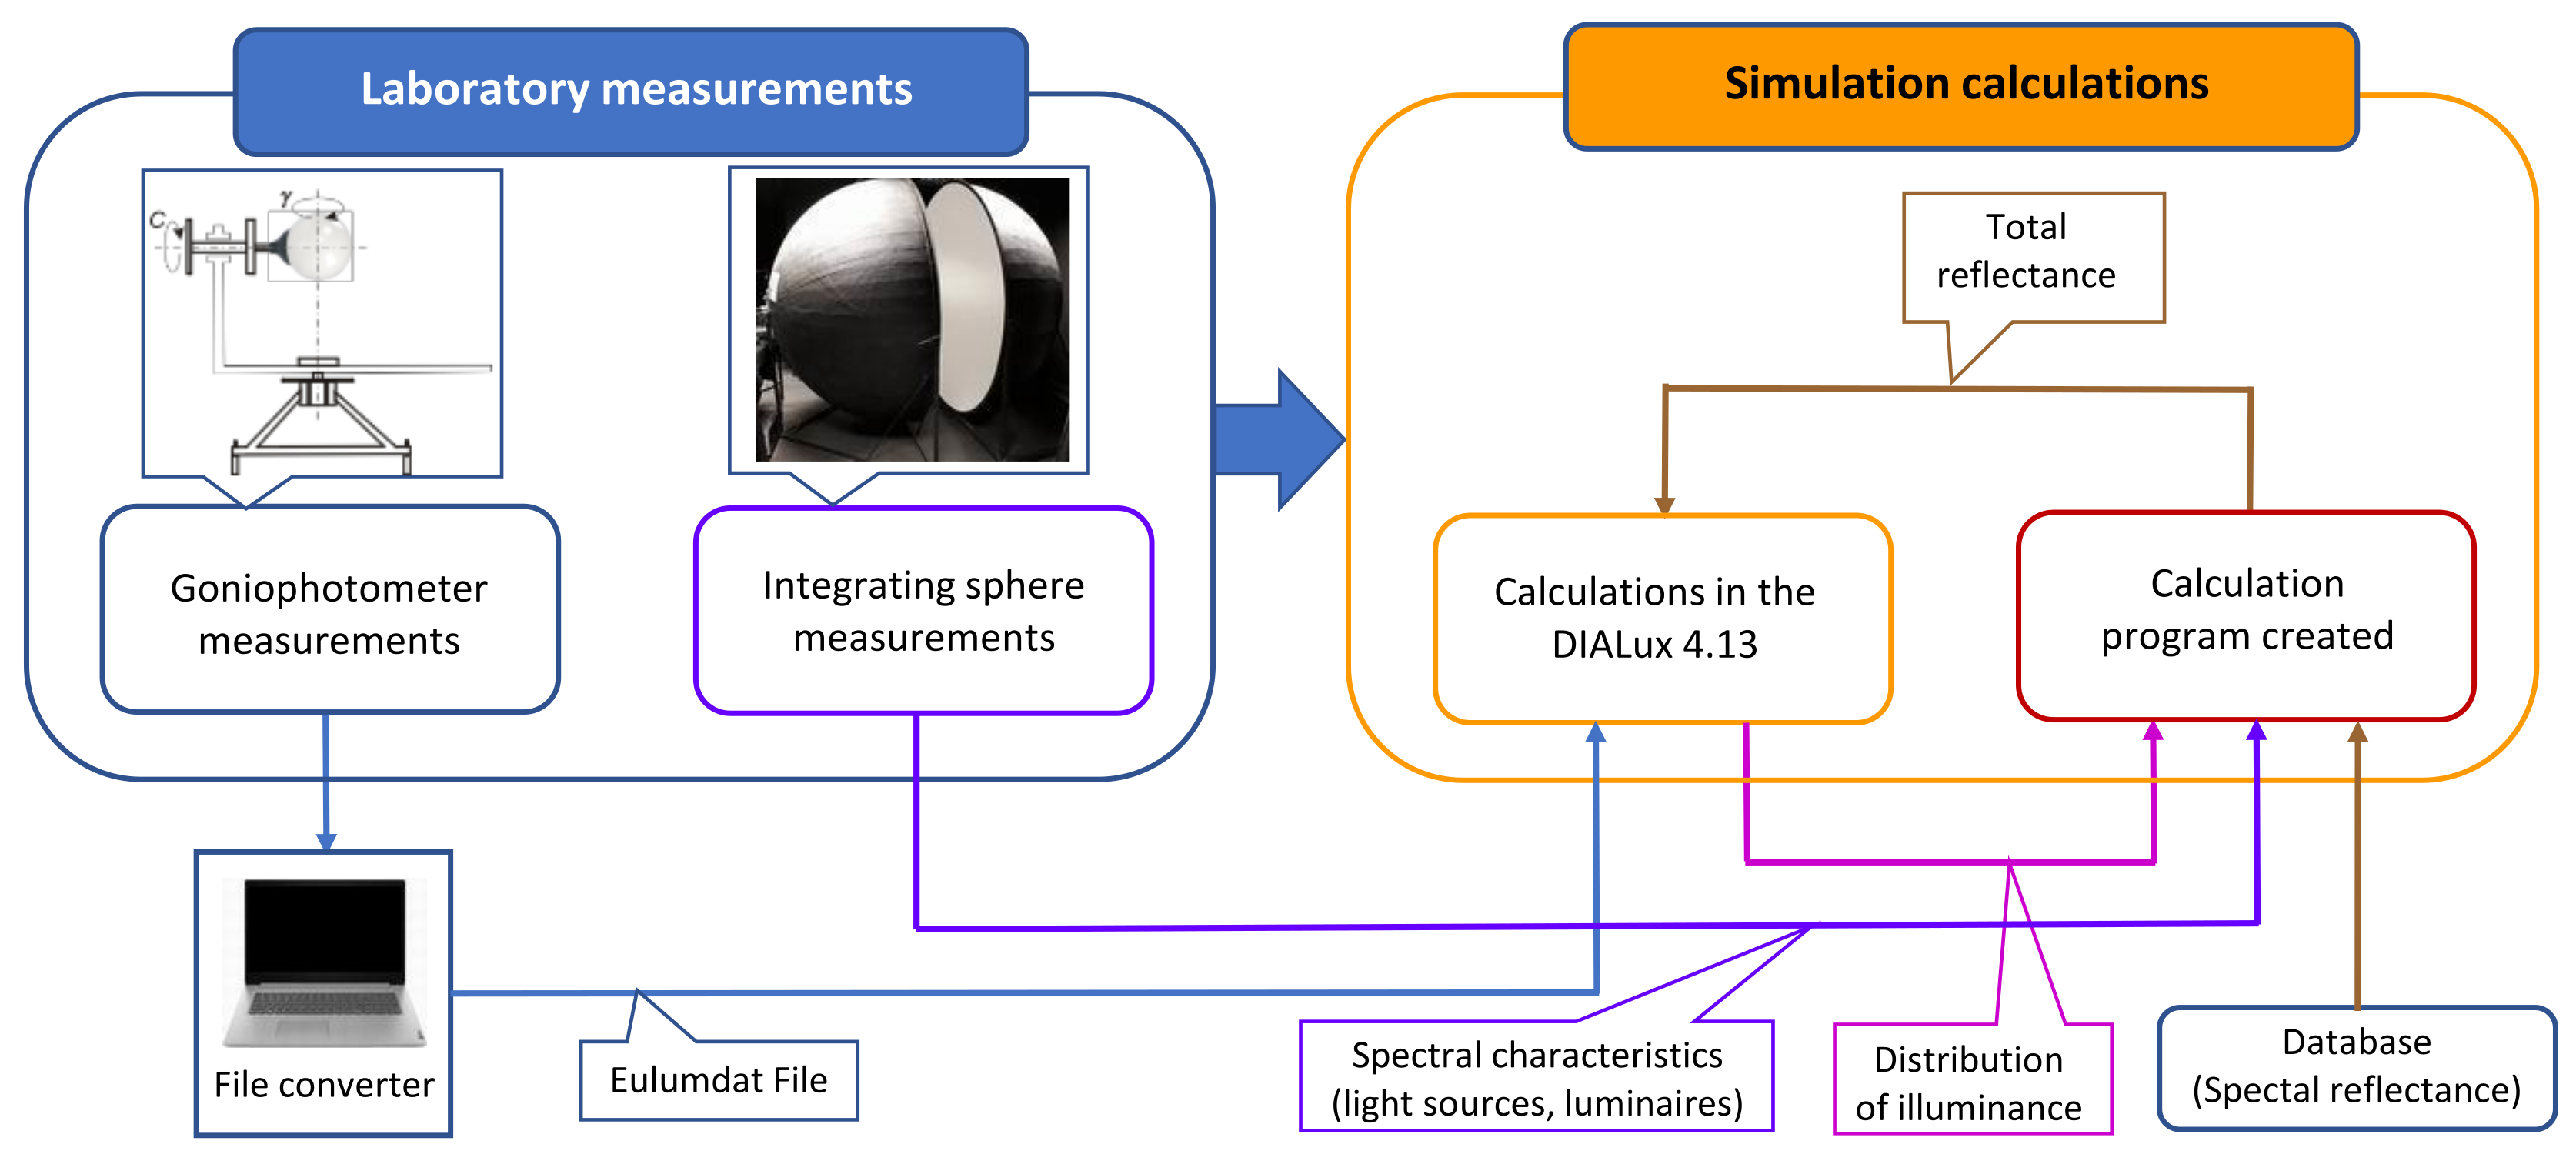
In order to consider a greater number of LED sources, the spectral curves of the luminaires were determined for each of the 9 luminaires. The measurements in this field were performed by placing the individual luminaires in an integrating sphere. The spectral characteristics were measured using an OcanOptics HR4000 spectrometer. Having the measured spectral distribution in relation to the uncovered light source and the spectral distribution obtained after placing the light source in a given luminaire, it was possible to determine to what extent the individual luminaires affected the change in the spectral distribution of the luminous flux of the light source. With such data, any number of LED sources with any spectral characteristics can be considered. Using the author’s approach, it was assumed that the structure of the 155 LED sources is exactly like the structure shown in Figure 1. In other words, it was assumed that the method of light distribution by all LED sources is identical (LEDs differ only in their spectral characteristics). The methodology of conducting the research is presented graphically in Figure 2. It consists of two essential elements (steps). The first step was to collect the input data. For this purpose, there was a need to carry out the laboratory measurements using a goniophotoemeter and an integrating sphere. Based on the data from photometric measurements, photometric files were generated for individual light sources and luminaires, which were then implemented in the DIALux program. Simultaneously, the spectral characteristics of the light sources and the luminaires were determined. As part of the second step, computer calculations were carried out using DIALux and our own, specially prepared, computer program. The algorithm of the procedure for the calculations performed outside the DIALux program is graphically illustrated later in the paper.
All the luminaires as well as the light sources used in the studies were new. Hence, the considerations ignore the fact that both the parameters of the light sources [64,65] and the luminaires change over time as a result of operation [66]. The considerations also did not take into account the influence of the ambient temperature on the parameters of the lamps, which was noted in [67]. All measurements were carried out in the laboratory at a temperature equal to 25 ± 1 °C.
The simulations using more than 150 spectral characteristics of LED sources are hypothetical, but the data used for the calculations are real. The computer simulations may allow, among others, how the replacement of sodium lamps with LED sources in typical park luminaires affects the phenomenon of light pollution to be determined.

3. Results of the Laboratory Measurements and Calculations

3.1. Uncovered Light Sources

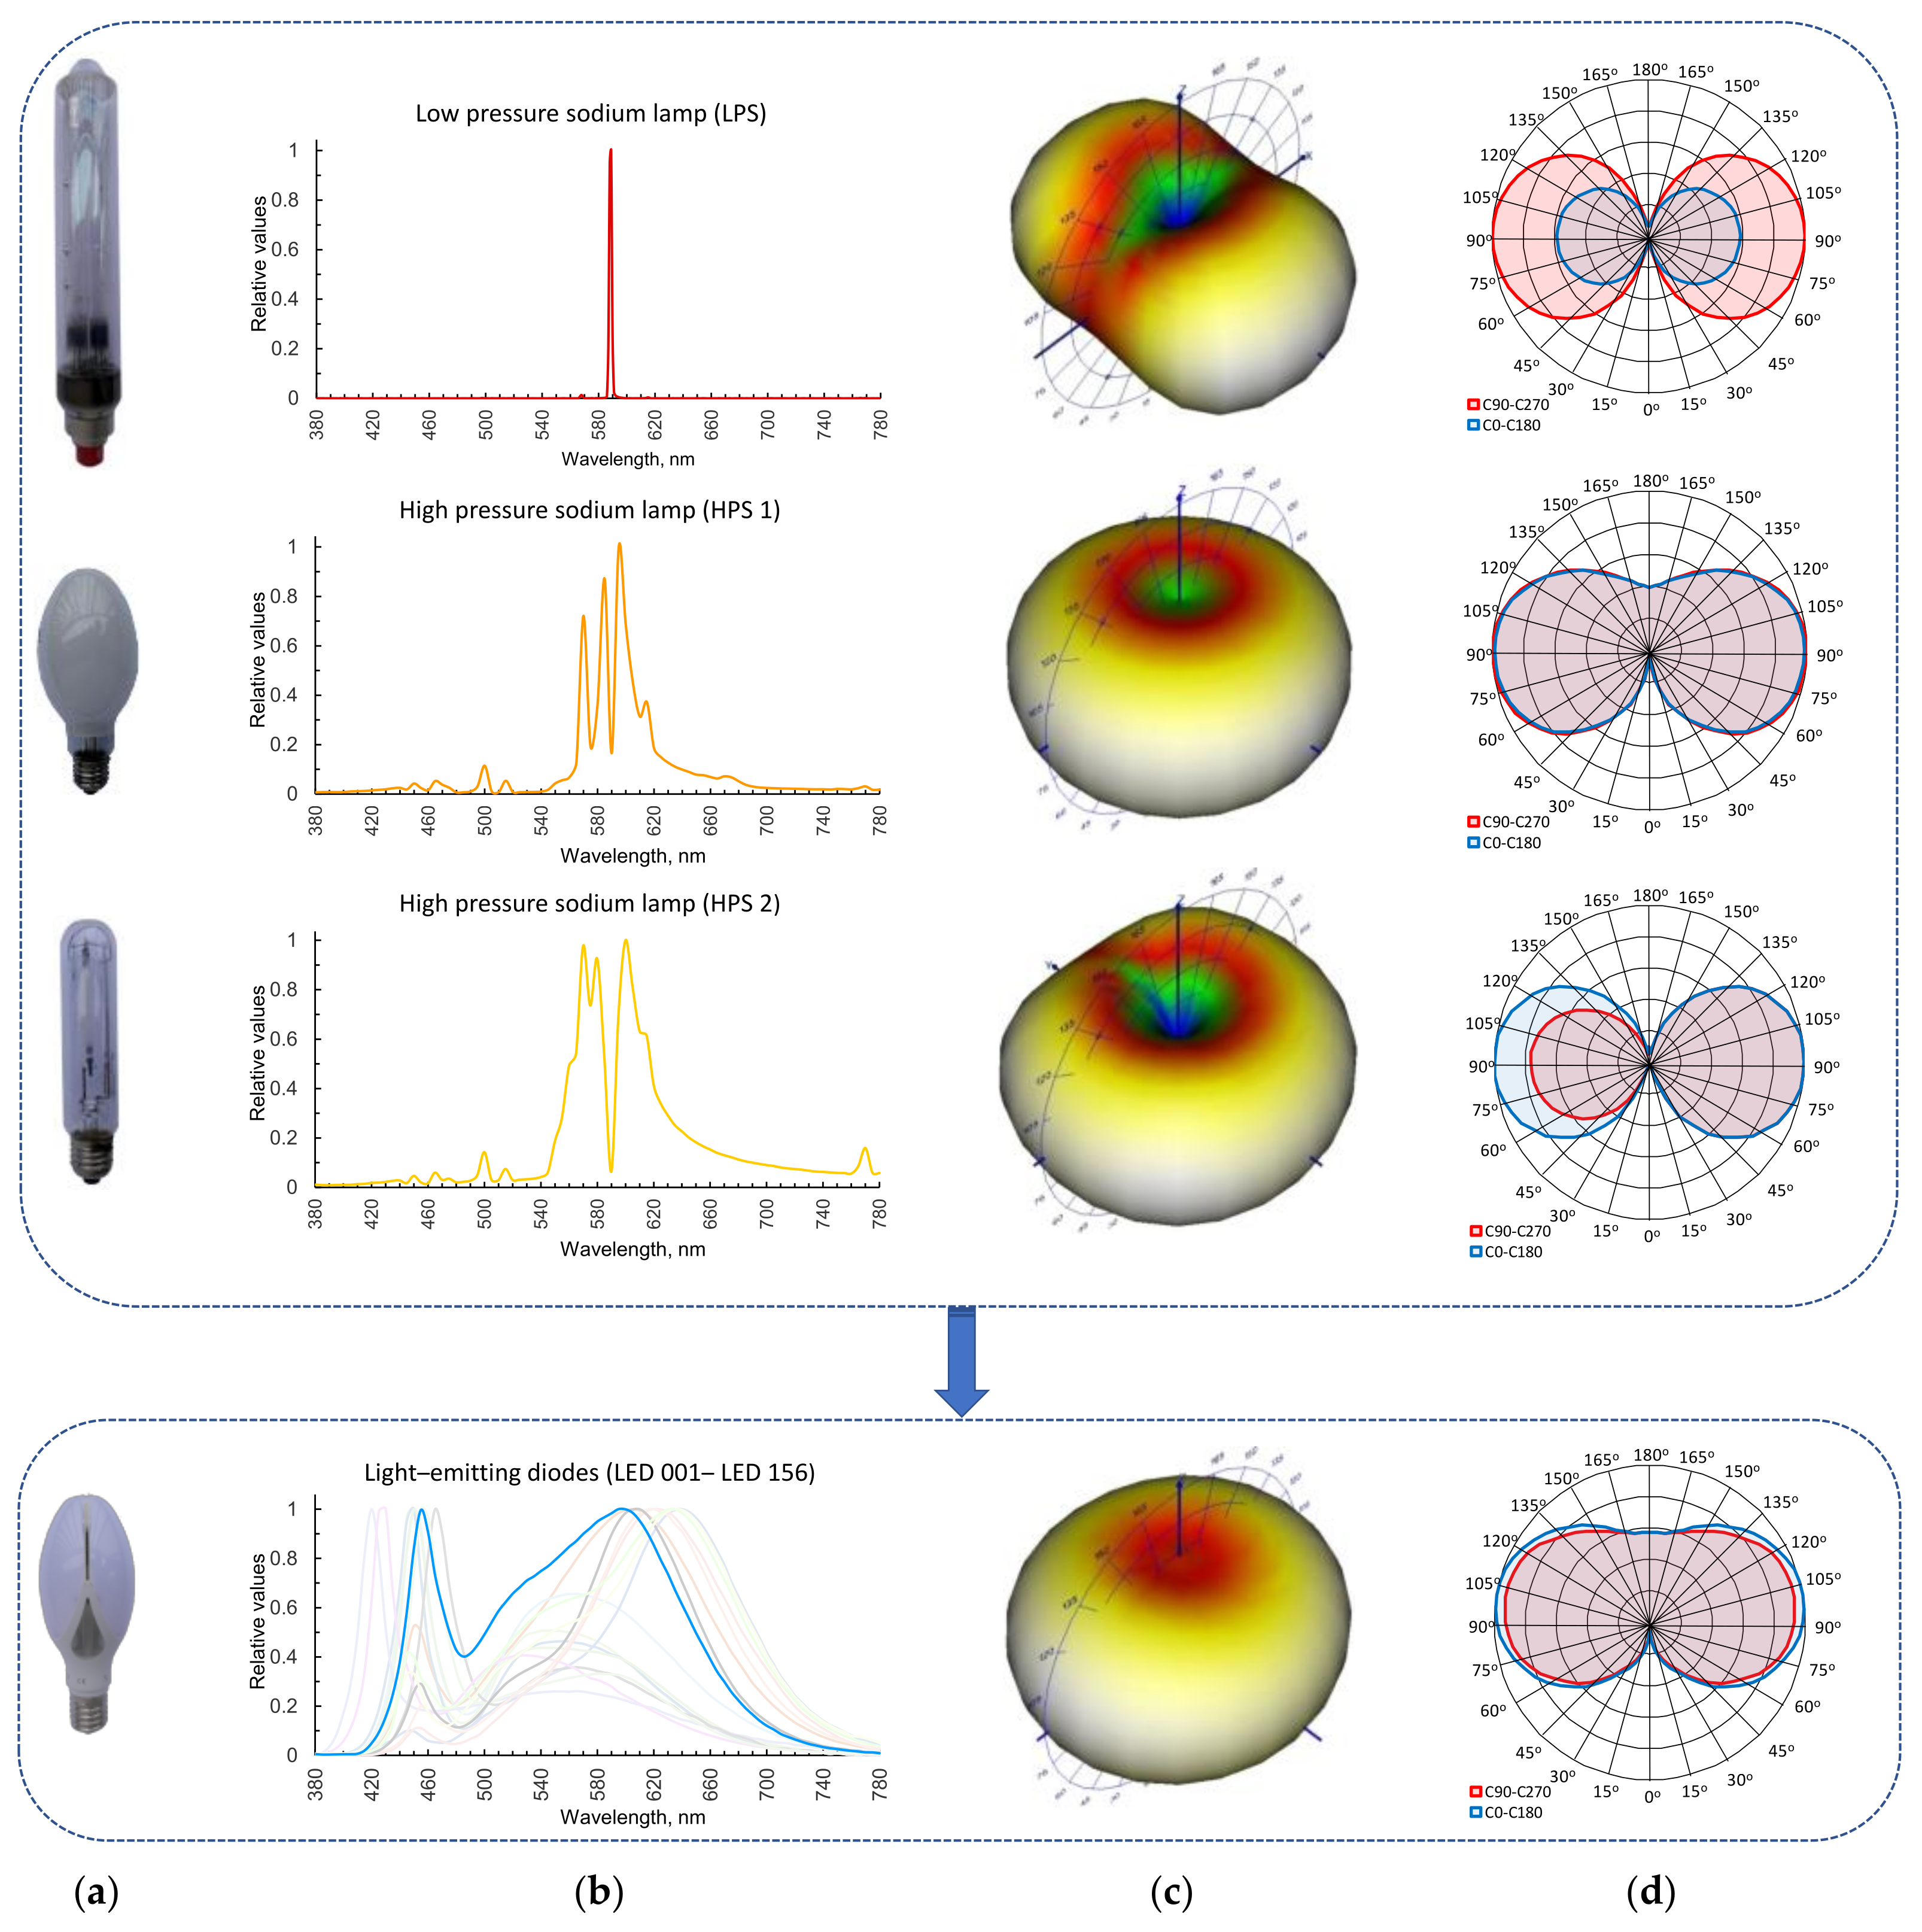
For individual light sources (from Figure 1), the active power (PLSM) consumed by the lamp cooperating with the necessary power supply system, the spectral characteristics on the basis of which CCT and CRI were calculated, and the photometric body on the basis of which the total luminous flux emitted by the light source was calculated were recorded. The results of the laboratory measurements are presented graphically in Figure 3 and in Table 2. When certain wavelengths are missing in the radiation spectrum (or their occurrence is limited), the consequence of this state may be an unnatural appearance of illuminated objects. For example, this was observed for the LPS, HPS 1, and HPS 2 lamps. In the case of monochromatic radiation (LPS lamp), the CRI is not specified. However, if determination of the CRI value was attempted, it would be less than zero. As the literature reports [68,69,70,71,72], negative CRI values are not easy to interpret; however, it is commonly known that the lower the color rendering value, the worse the color rendering of the illuminated objects.
In order to distinguish the values from those given in Table 1, the index “M” (from the word “measurement”) was added to the individual symbols in Table 2.
To extend the scope of the research, further considerations included 155 actual spectral characteristics of LED sources with different CCT values (Figure 4). The spectral characteristics of the LED sources were arranged using the CCT value (from the lowest to the highest) as a criterion.
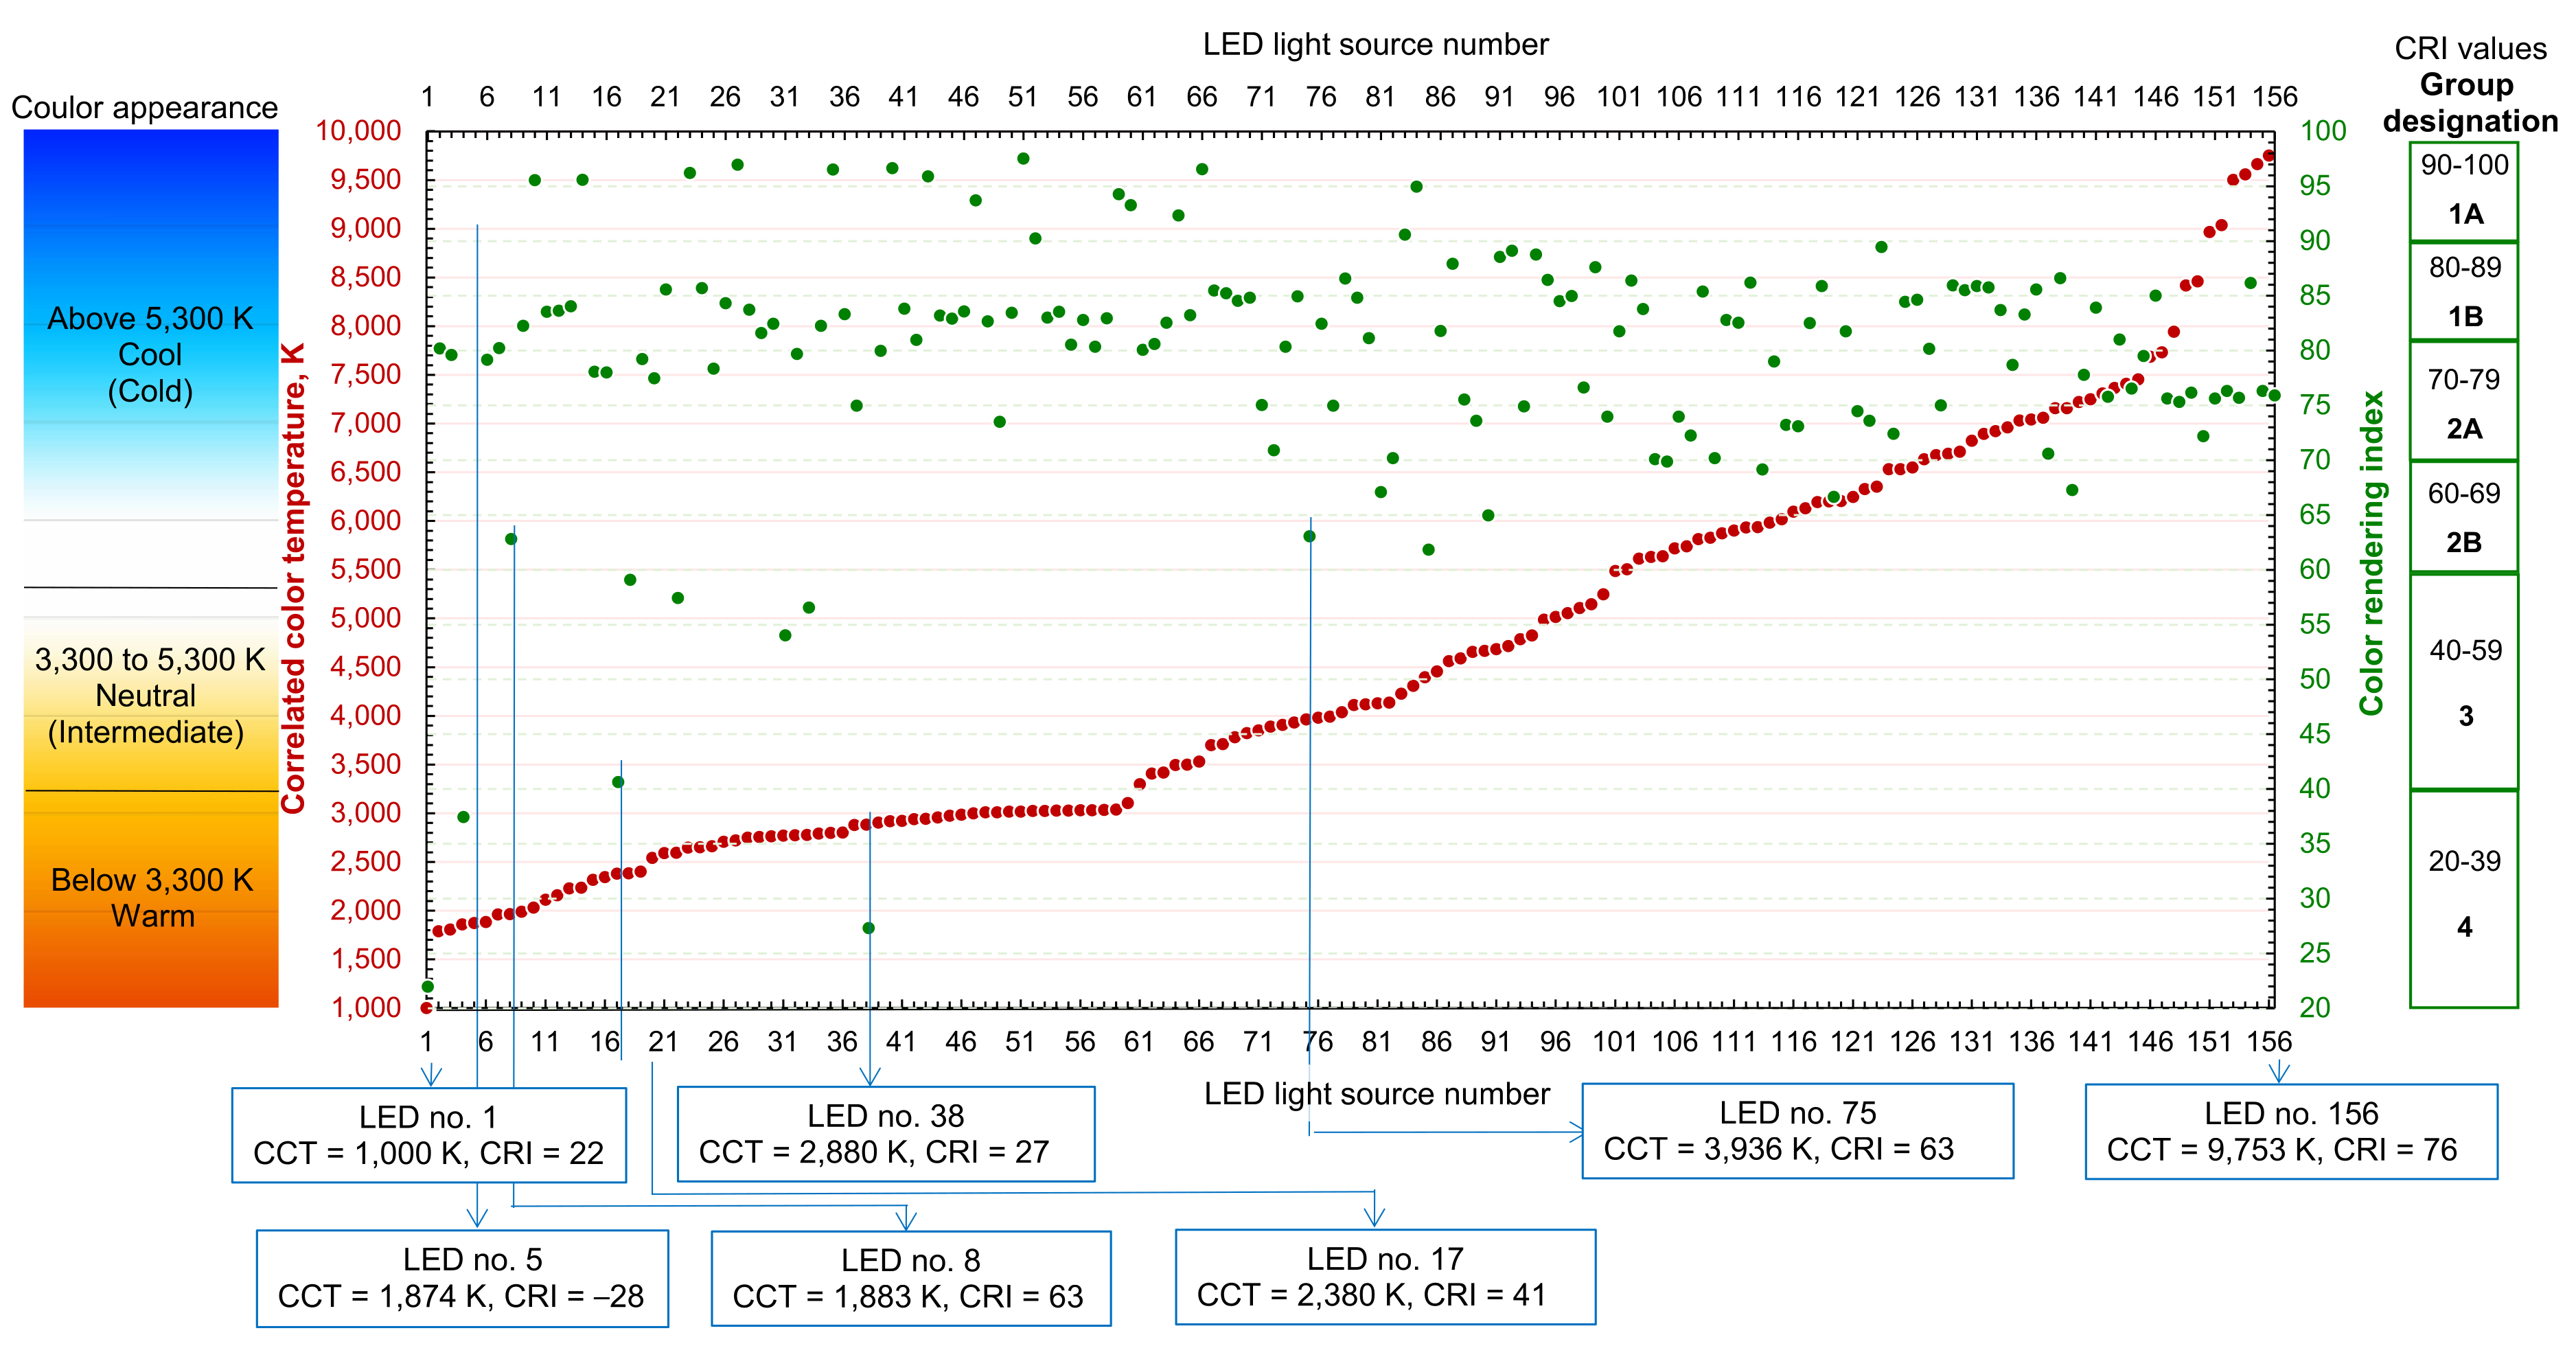
Due to the large amount of data, in relation to LED sources, parameters, such as CCT and CRI, are presented graphically in Figure 5 based on the data from Figure 4. To illustrate the perception of light with different color temperatures, next to the vertical axis with CCT values, an illustrative color scale was placed. The terminology adopted in this figure is in accordance with the standards [73,74,75]. Since CCT does not provide information on the appearance of illuminated objects, the CRI parameter must be used to characterize the color properties of the light source. From the viewpoint of the CRI values, light sources are divided into four groups. The first two are additionally distinguished into “A” and “B”. It is recognized that when the light sources belong to group “1A”, they have very good color rendering properties. Low color rendering is considered when the light sources are classified into group no. 4. The color rendering index-based groups (along with the given ranges of values) are presented in Figure 5. In the case of lighting of green areas, the requirements for color rendering have not been clearly established. Therefore, HPS-type light sources have often been used in outdoor lighting because their color rendering index is slightly above 20. In the case of green areas, it is recommended that the CRI should not be lower than 60 [33].
For all LED sources (with the exception of LED no. 5), CRI values above 20 were obtained. In order to obtain a high readability of the chart, the author decided to use CRI scale values ranging from 20 to 100. It is worth emphasizing that CCT and CRI are independent quantities. For example, one can show lamps with identical CRI values but with different CCT values (e.g., LED no. 8 and LED no. 75). In other words, an increase or decrease in the value of CCT does not have to be the same as an increase or decrease in CRI (Figure 5).
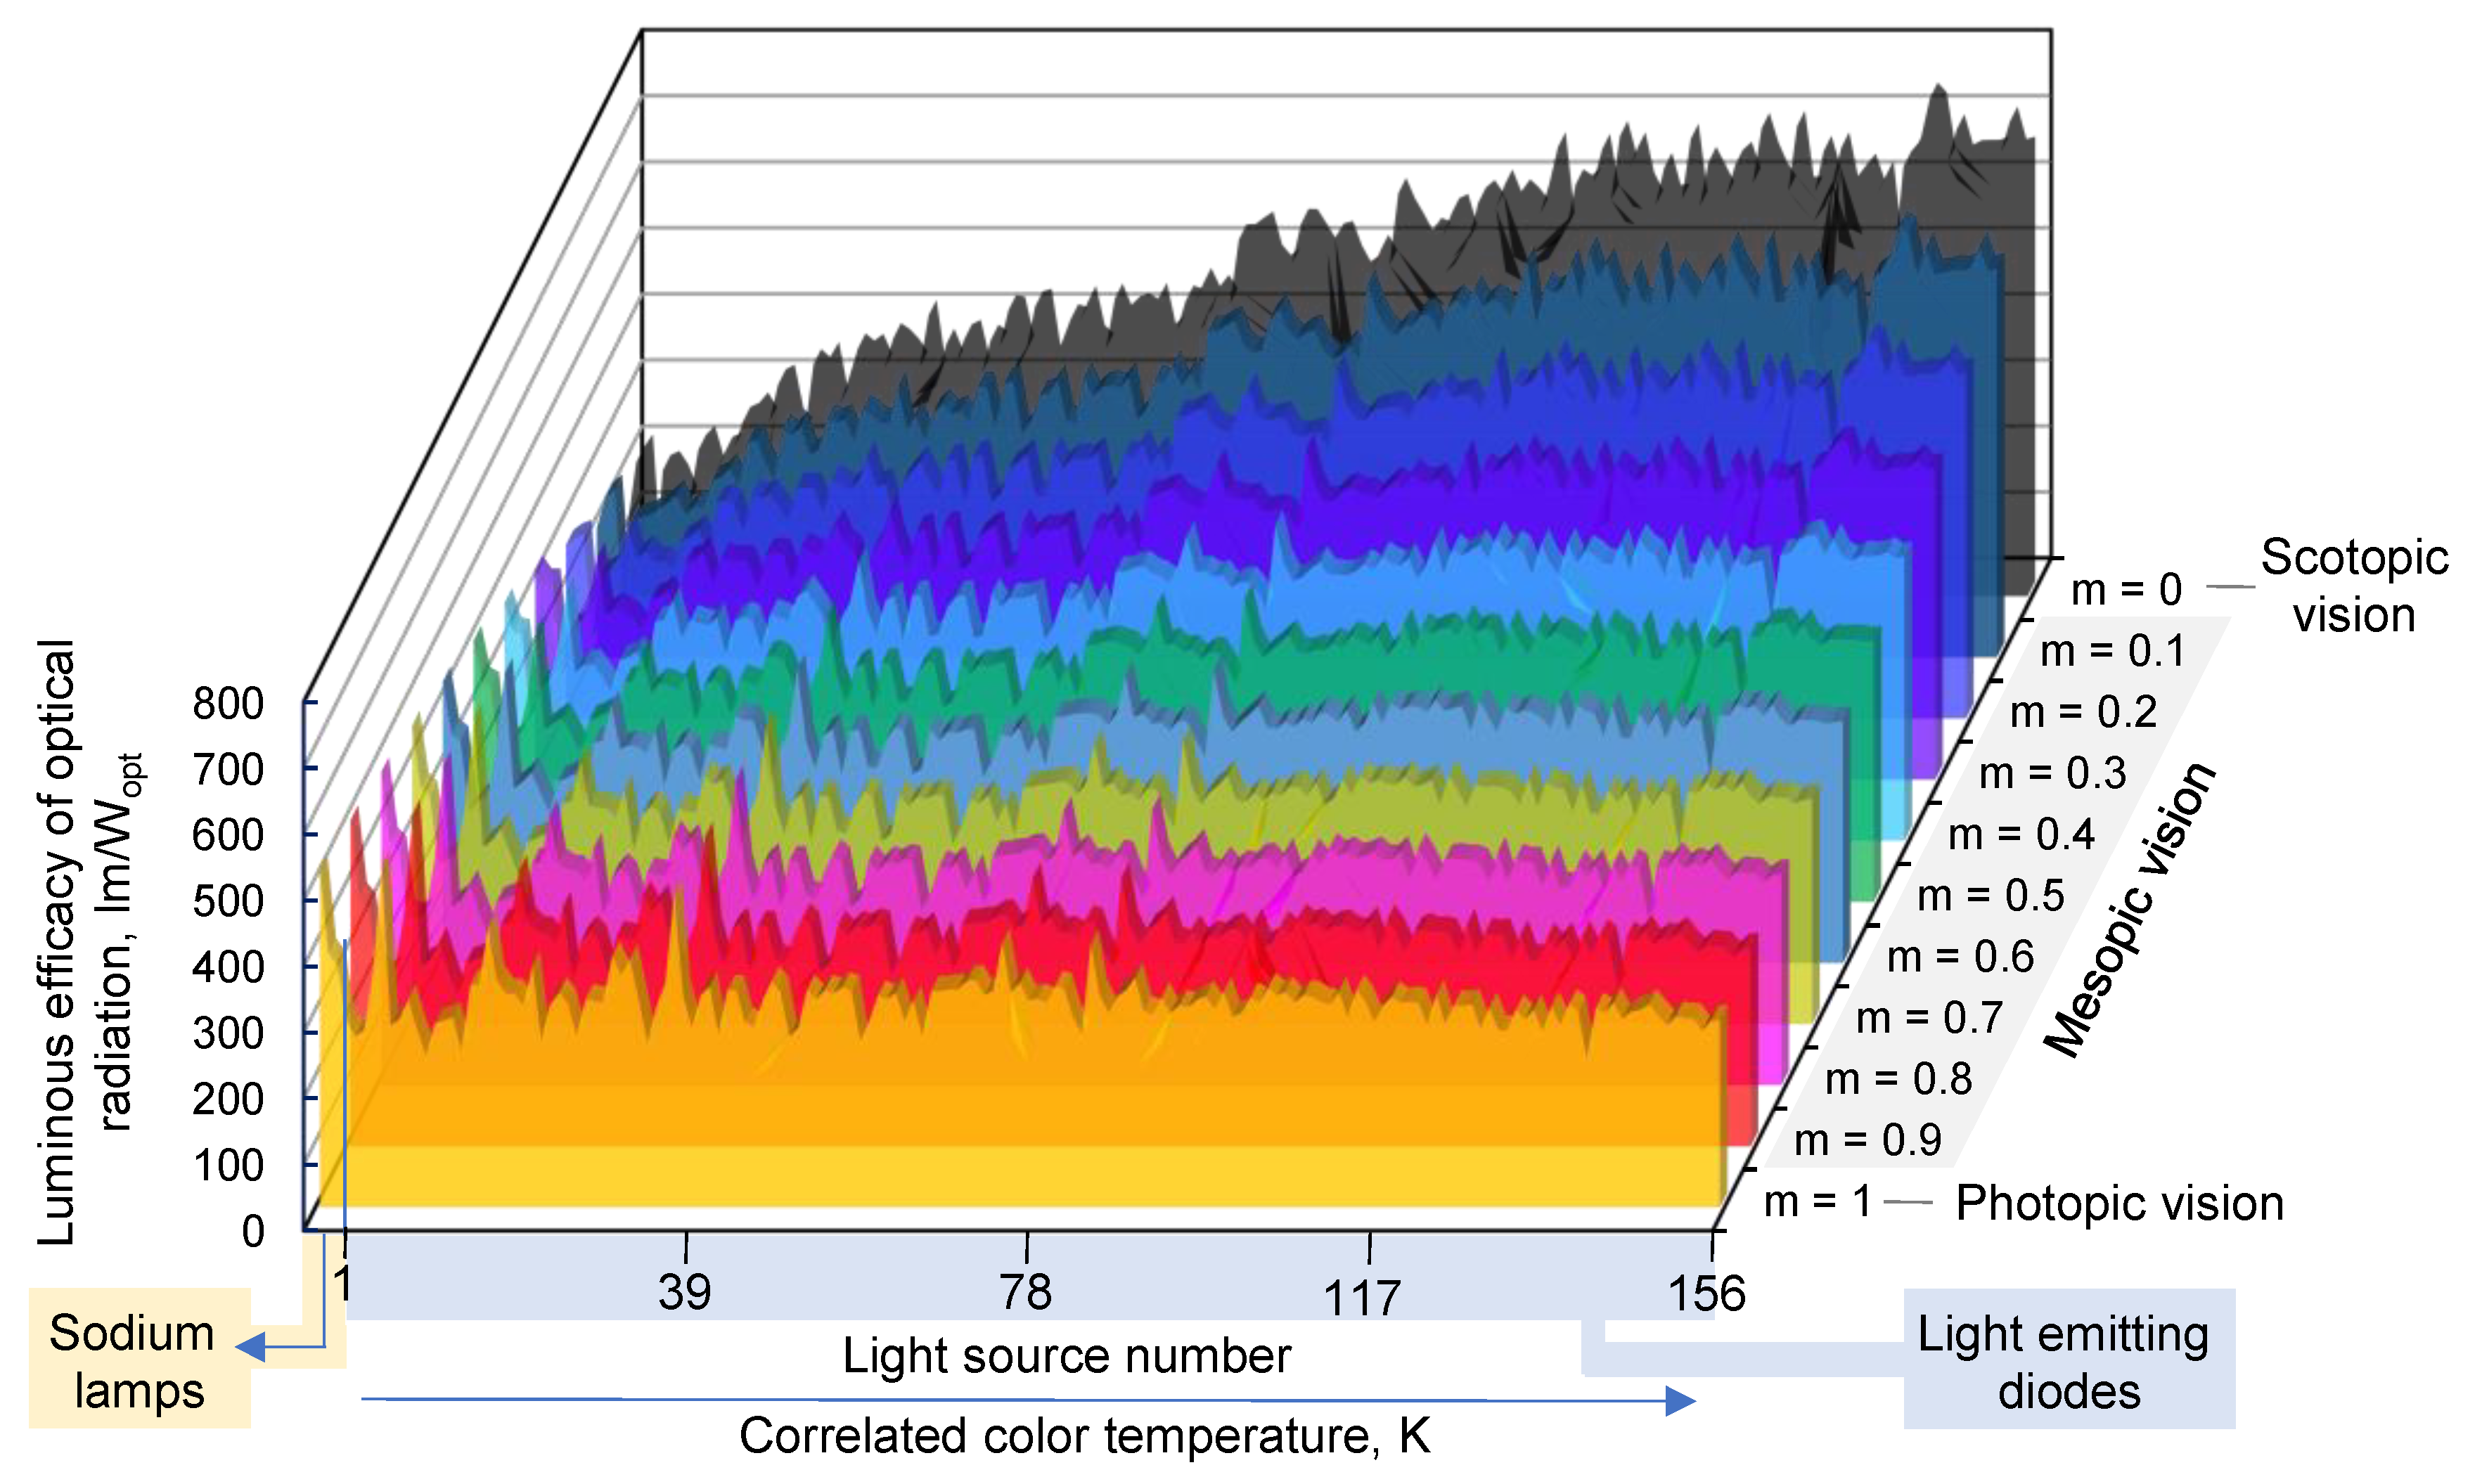
Having obtained the spectral characteristics of sodium lamps and 156 LED sources (Figure 4), the luminous efficacy of optical radiation was calculated for different states of adaptation of the human eye [76].
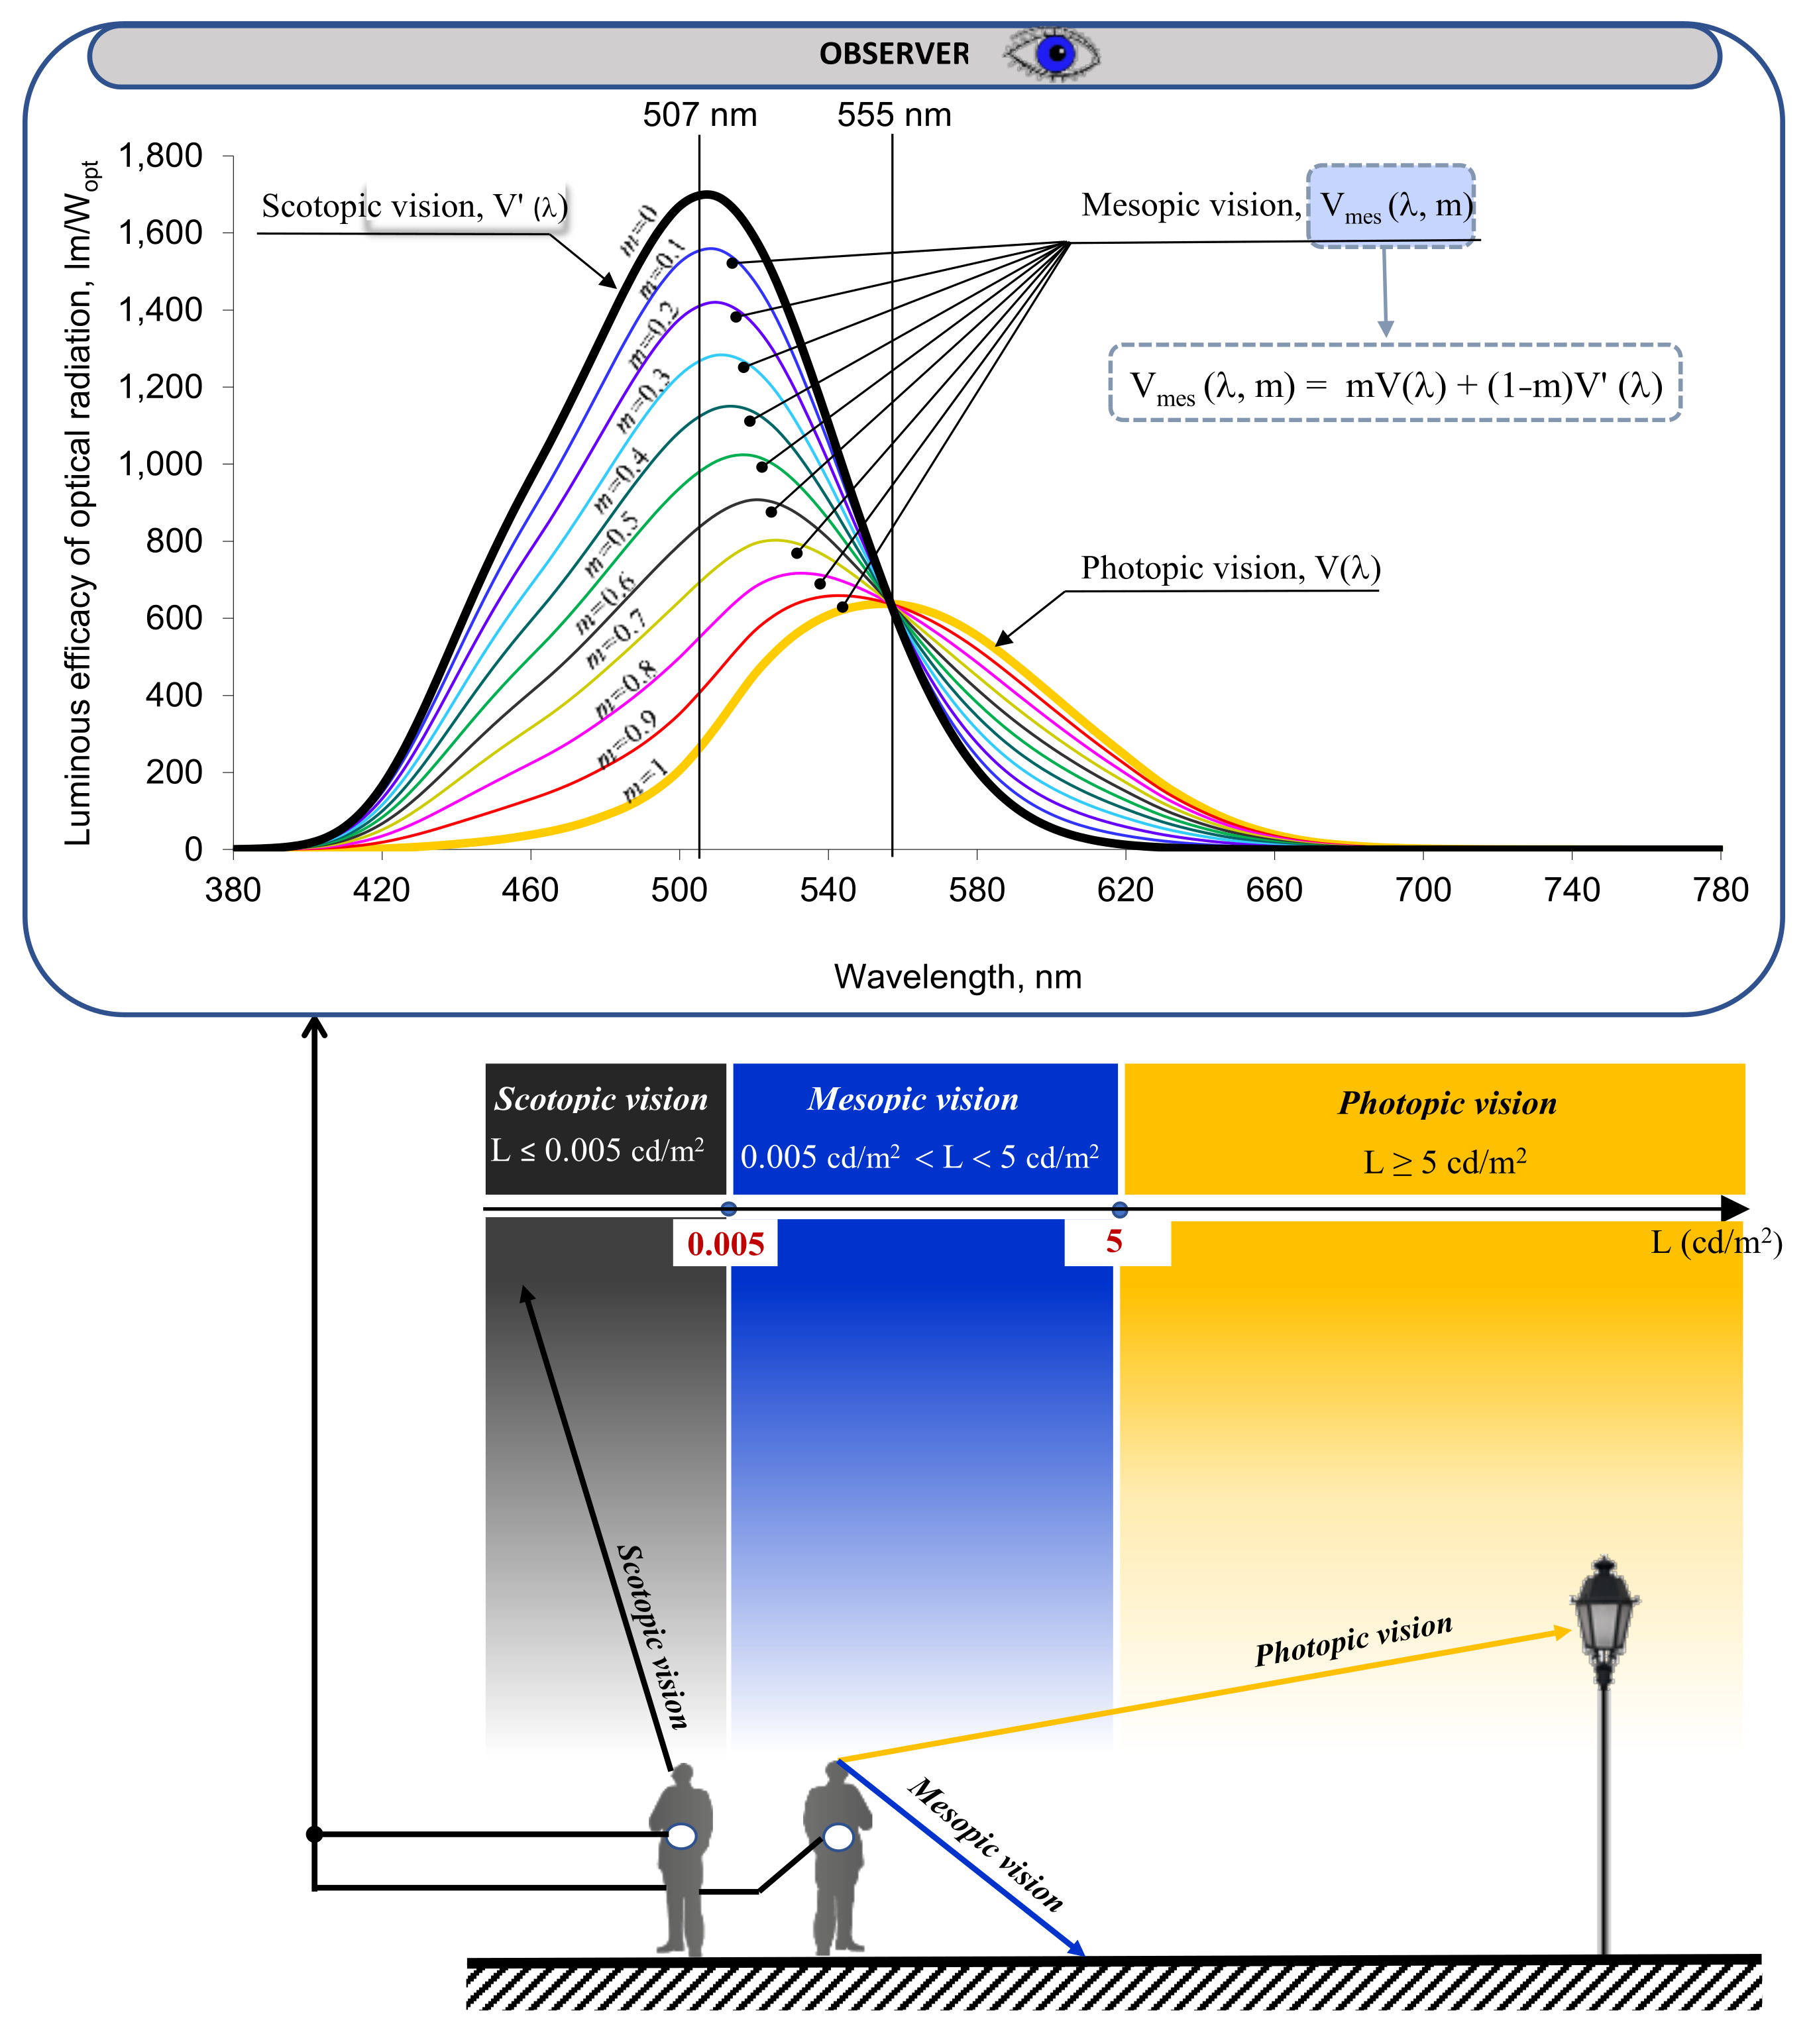
The human vision system acts in a wide range of environmental luminance. For example, the surface of a given luminaire is characterized by significant luminance vales, while very low luminance levels are assumed by the night sky. As reported in the literature [77], in the period of time when the ground is not covered with snow, the luminance of the night sky does not exceed 0.005 cd/m2. In turn, in large housing estates (for example, in the Kraków agglomeration, Poland), the brightness of the sky is 18.4 mag/arcsec2, which corresponds to a value of 0.0047 cd/m2. However, in the residential estates located outside the city center, this value reaches 19.1 mag/arcsec2, which corresponds to 0.0025 cd/m2 [78]. Other luminance levels occur in the case of the observed substrate being illuminated by lanterns. As reported in [79,80], when road lighting is considered, the luminance is usually in the range from 0.5 to 2 cd/m2. It is of significant practical importance because the spectral sensitivity of the eye changes with the change of luminance, which is graphically illustrated in Figure 6. According to the CIE recommendations [81], it is assumed that the scotopic state of vision occurs at a luminance ≤ 0.005 cd/m2, while photopic vision occurs at a luminance value ≥ 5 cd/m2. Photopic and scotopic vision extends the range of mesopic vision, which was studied, for example, in [5,80,82,83,84,85]. The general conclusion from these works is that additional savings can be achieved when te LED sources are used to illuminate parks in terms of the mesopic effect.
Admittedly, according to the CIE recommendations contained in [86], when designing the lighting of sidewalks, paths etc., the key parameter is the illuminance. It is worth noting, however, that a man (observer) looking at the surface of the aisle cannot see the light intensity but the luminance.
Having obtained the luminous efficacy curves of monochromatic radiation (Figure 6), the luminous efficacy of optical radiation (LER) was calculated for three sodium lamps (LPS, HPS 1, and HPS 2) and 156 LEDs (159 light sources in total). The results of the calculations are presented in Figure 7. Analyzing the data from this figure, it can be concluded that the LER values depend not only on the conditions of the adaptation of the organ of vision, but also on the CCT. Under daytime (photopic) vision conditions, when the V(λ) curve applies, a decrease in the LER value with an increase in CCT may be noticed. The opposite is true for scotopic vision.
When a weak stimulus reaches the retina of the eye, which is characterized by greater sensitivity in the shorter wavelength region, an increase in the CCT value of the light source will enhance the lighting effect. Analysis of the human eye sensitivity curves for different luminance values (which correspond to the “m” parameter) clearly shows that when assessing the influence of the light source on the sky glow, the type of selected eye sensitivity curve is important. Hence, if the limit levels of the night sky do not exceed 0.005 cd/m2, it seems reasonable to use the V’(λ) curve.

3.2. Results for Park Luminaires Cooperating with Different Light Sources

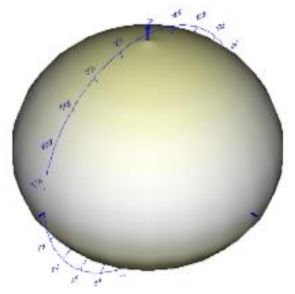
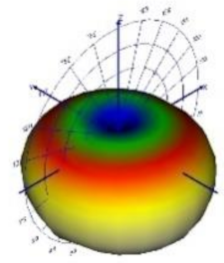
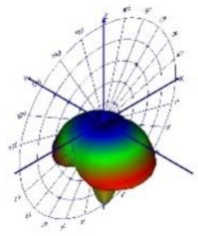
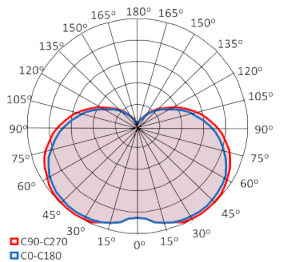
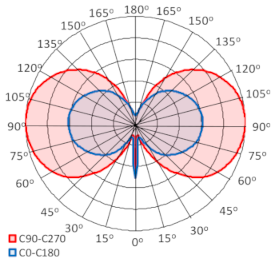
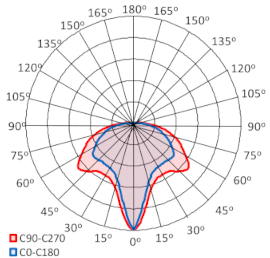
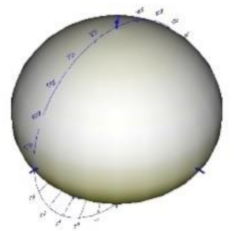
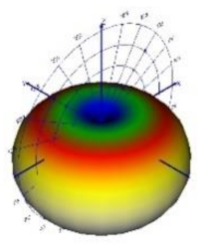
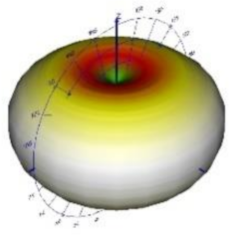
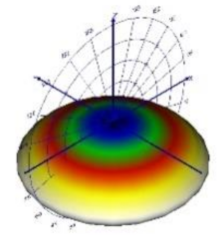
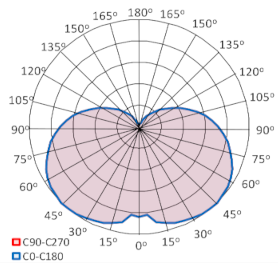
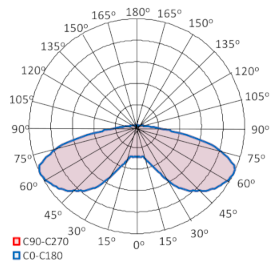
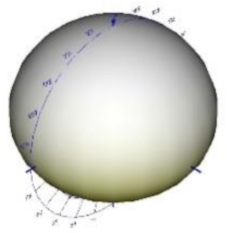
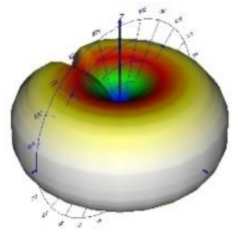
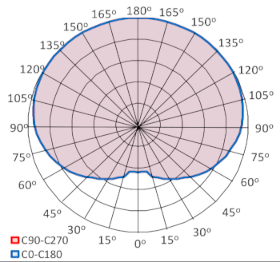
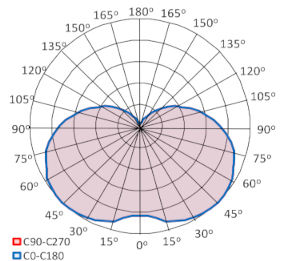
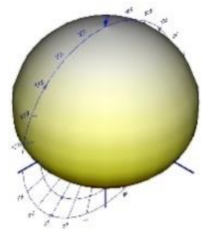
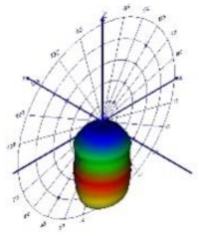
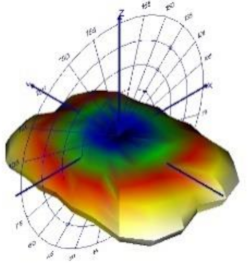
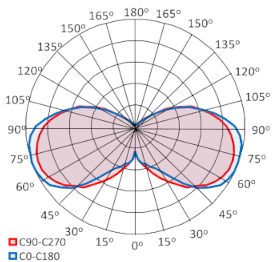
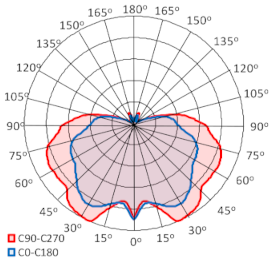
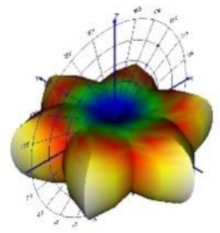
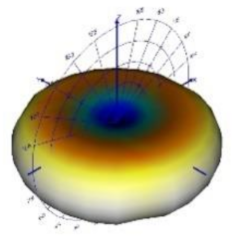
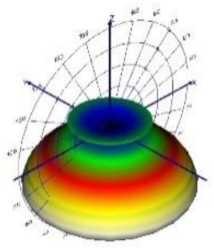
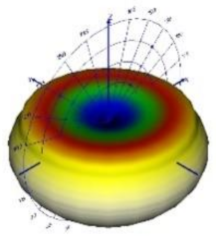
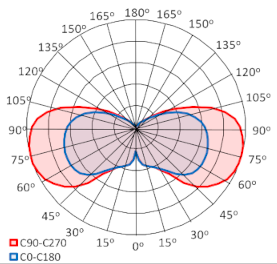
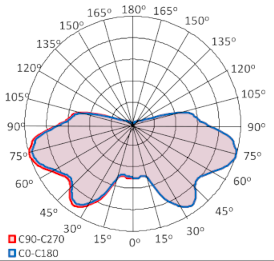
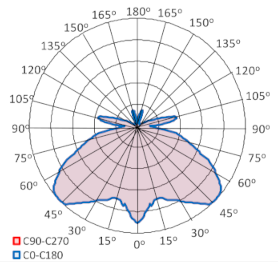
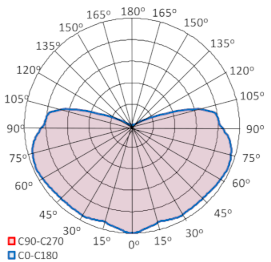
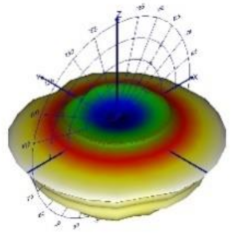
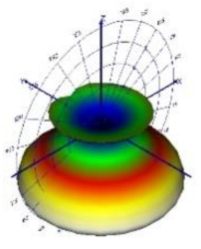
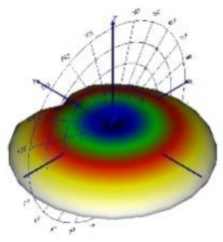
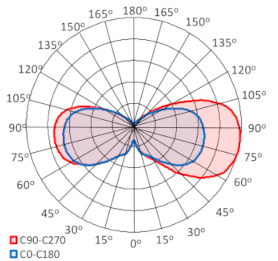
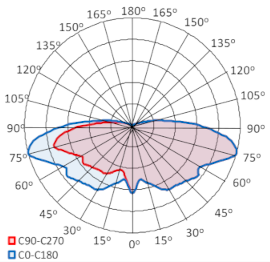
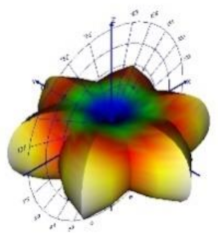
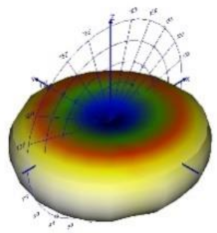
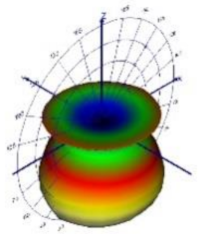
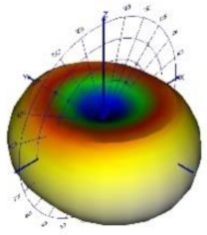
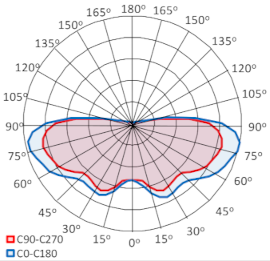
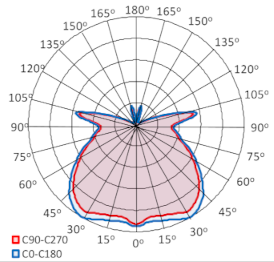
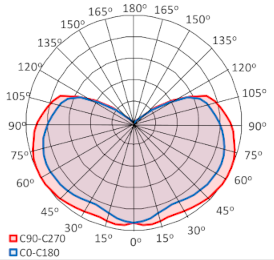
The basic method of presenting the light distribution by a given luminaire is a photometric solid [59,87]. Photometric solids, which are the result of laboratory measurements for 9 luminaires that cooperate with the light sources tested, are presented in a graphical form in Table 3 and Table 4. In order to improve the readability of the data obtained, they are presented as relative values with the maximum value taken as a reference. In addition to the three-dimensional view of the photometric solid, the luminous curves on the polar diagram are quoted. They are the traces of the intersection of the photometric solid along the two mutually perpendicular planes C0–C180 and C90–C270. Such an additional form of presenting the light distribution method, according to the author, will enable better visualization of the shape of the photometric solid.
Analyzing the data in Table 3 and Table 4, it can be concluded that the photometric solid of park luminaires can take various shapes. In the case of some luminaires, the type of light source installed in the luminaire is significantly influenced by the type of light distribution. For example, in the case of a luminaire with a transparent spherical cover and half-covered with silver paint (luminaire no. 4), the photometric solids take the shapes ranging from focused (for LPS and LEDs) to obtuse (for HPS 1 and HPS 2). The smallest influence of the light source on the shape of the photometric solid was observed in the case of luminaires no. 1 and 2.
Based on the measured photometric solids of park luminaires (Table 3 and Table 4), cooperating with individual light sources, the downward flux fraction (DFF), upper flux fraction (UFF) also known as the upward light ratio (ULR), upward light output ratio (ULOR), downward light output ratio (DLOR), light output ratio (LOR), and luminous flux absorbed by the luminaire (trapped Light) were calculated. The data in this field are summarized in Table 5.
By analyzing the data summarized in Table 5, it may be concluded that the type of light source installed in the luminaire somehow affects the UFF value. The largest differences in the UFF values (almost 19%) were recorded in the case of luminaire no. 9. When the LPS light source was installed in this luminaire, UFF as the largest (30.4%) while for the HPS 2 light source, UFF was the smallest (11.8%). In turn, the smallest difference in the values of UFF were observed in the case of luminaire no. 4 and it was 0.6%. In terms of the LOR value, which depends on the type of light source installed in the luminaire, the results presented in Table 5 confirm that this value is not constant. The largest differences in LOR values were obtained for luminaire no. 6 (ΔLOR = 8.6%), while the smallest in the case of luminaire no. 9 (ΔLOR = 2.2%).
In order to reduce the light pollution effect, the CIE (International Lighting Commission), in its technical reports [88,89,90], has provided recommendations regarding the emission of luminous flux into the upper half-space. They depend on environmental zones. The limit values (recommended solely by the CIE) of the luminous flux sent into the upper half-space are shown in Table 6. Initially (in 2003), these values were higher and, for example, for the E4 zone, the maximum value was 25%. In 2019, the second edition of the CIE Technical Report 150 was released, in which the UFF (ULR) values were lowered.
When assuming that the park luminaires are located in zone E4, then, according to the data summarized in Table 6, the value of the UFF index (ULR), according to the previous recommendations, should not exceed 25%. This requirement (regardless of the type of light source installed in the luminaire) is met by the luminaires 4, 6, 7, and 8 (Table 5). In the case of the luminaire no. 9, the value of the UFF (ULR) index will not exceed 25% when HPS 1 and HPS 2 lamps are installed in the luminaire. Taking into account the current CIE recommendations, the UFF (ULR) value in environmental zone E4 should not exceed 15%. Meeting this requirement will be possible in the case of luminaire no. 4 (regardless of the light source installed) and luminaire no. 7 equipped with an NLS or LED lamp. In the case of luminaire no. 9, the value of UFF (ULR) will not be exceeded with only HPS 2 installed.
It is worth noting that the values of the ULR indicator were calculated on the basis of the photometric solid of the luminaire (Table 3 and Table 4). Therefore, the fact that part of the luminous flux reflected from the ground will be directed into the upper half-space was not taken into account. Thus, in practice, the value of the luminous flux sent into the upper half-space will differ from the UFF value calculated on the basis of the photometric solid (Table 5). The situation is similar in the case of the DFF index. In real conditions, only some of the luminous flux emitted by the luminaire in the lower half-space will hit the substrate. In the case of some luminaires, part of the luminous flux will be projected sideways.
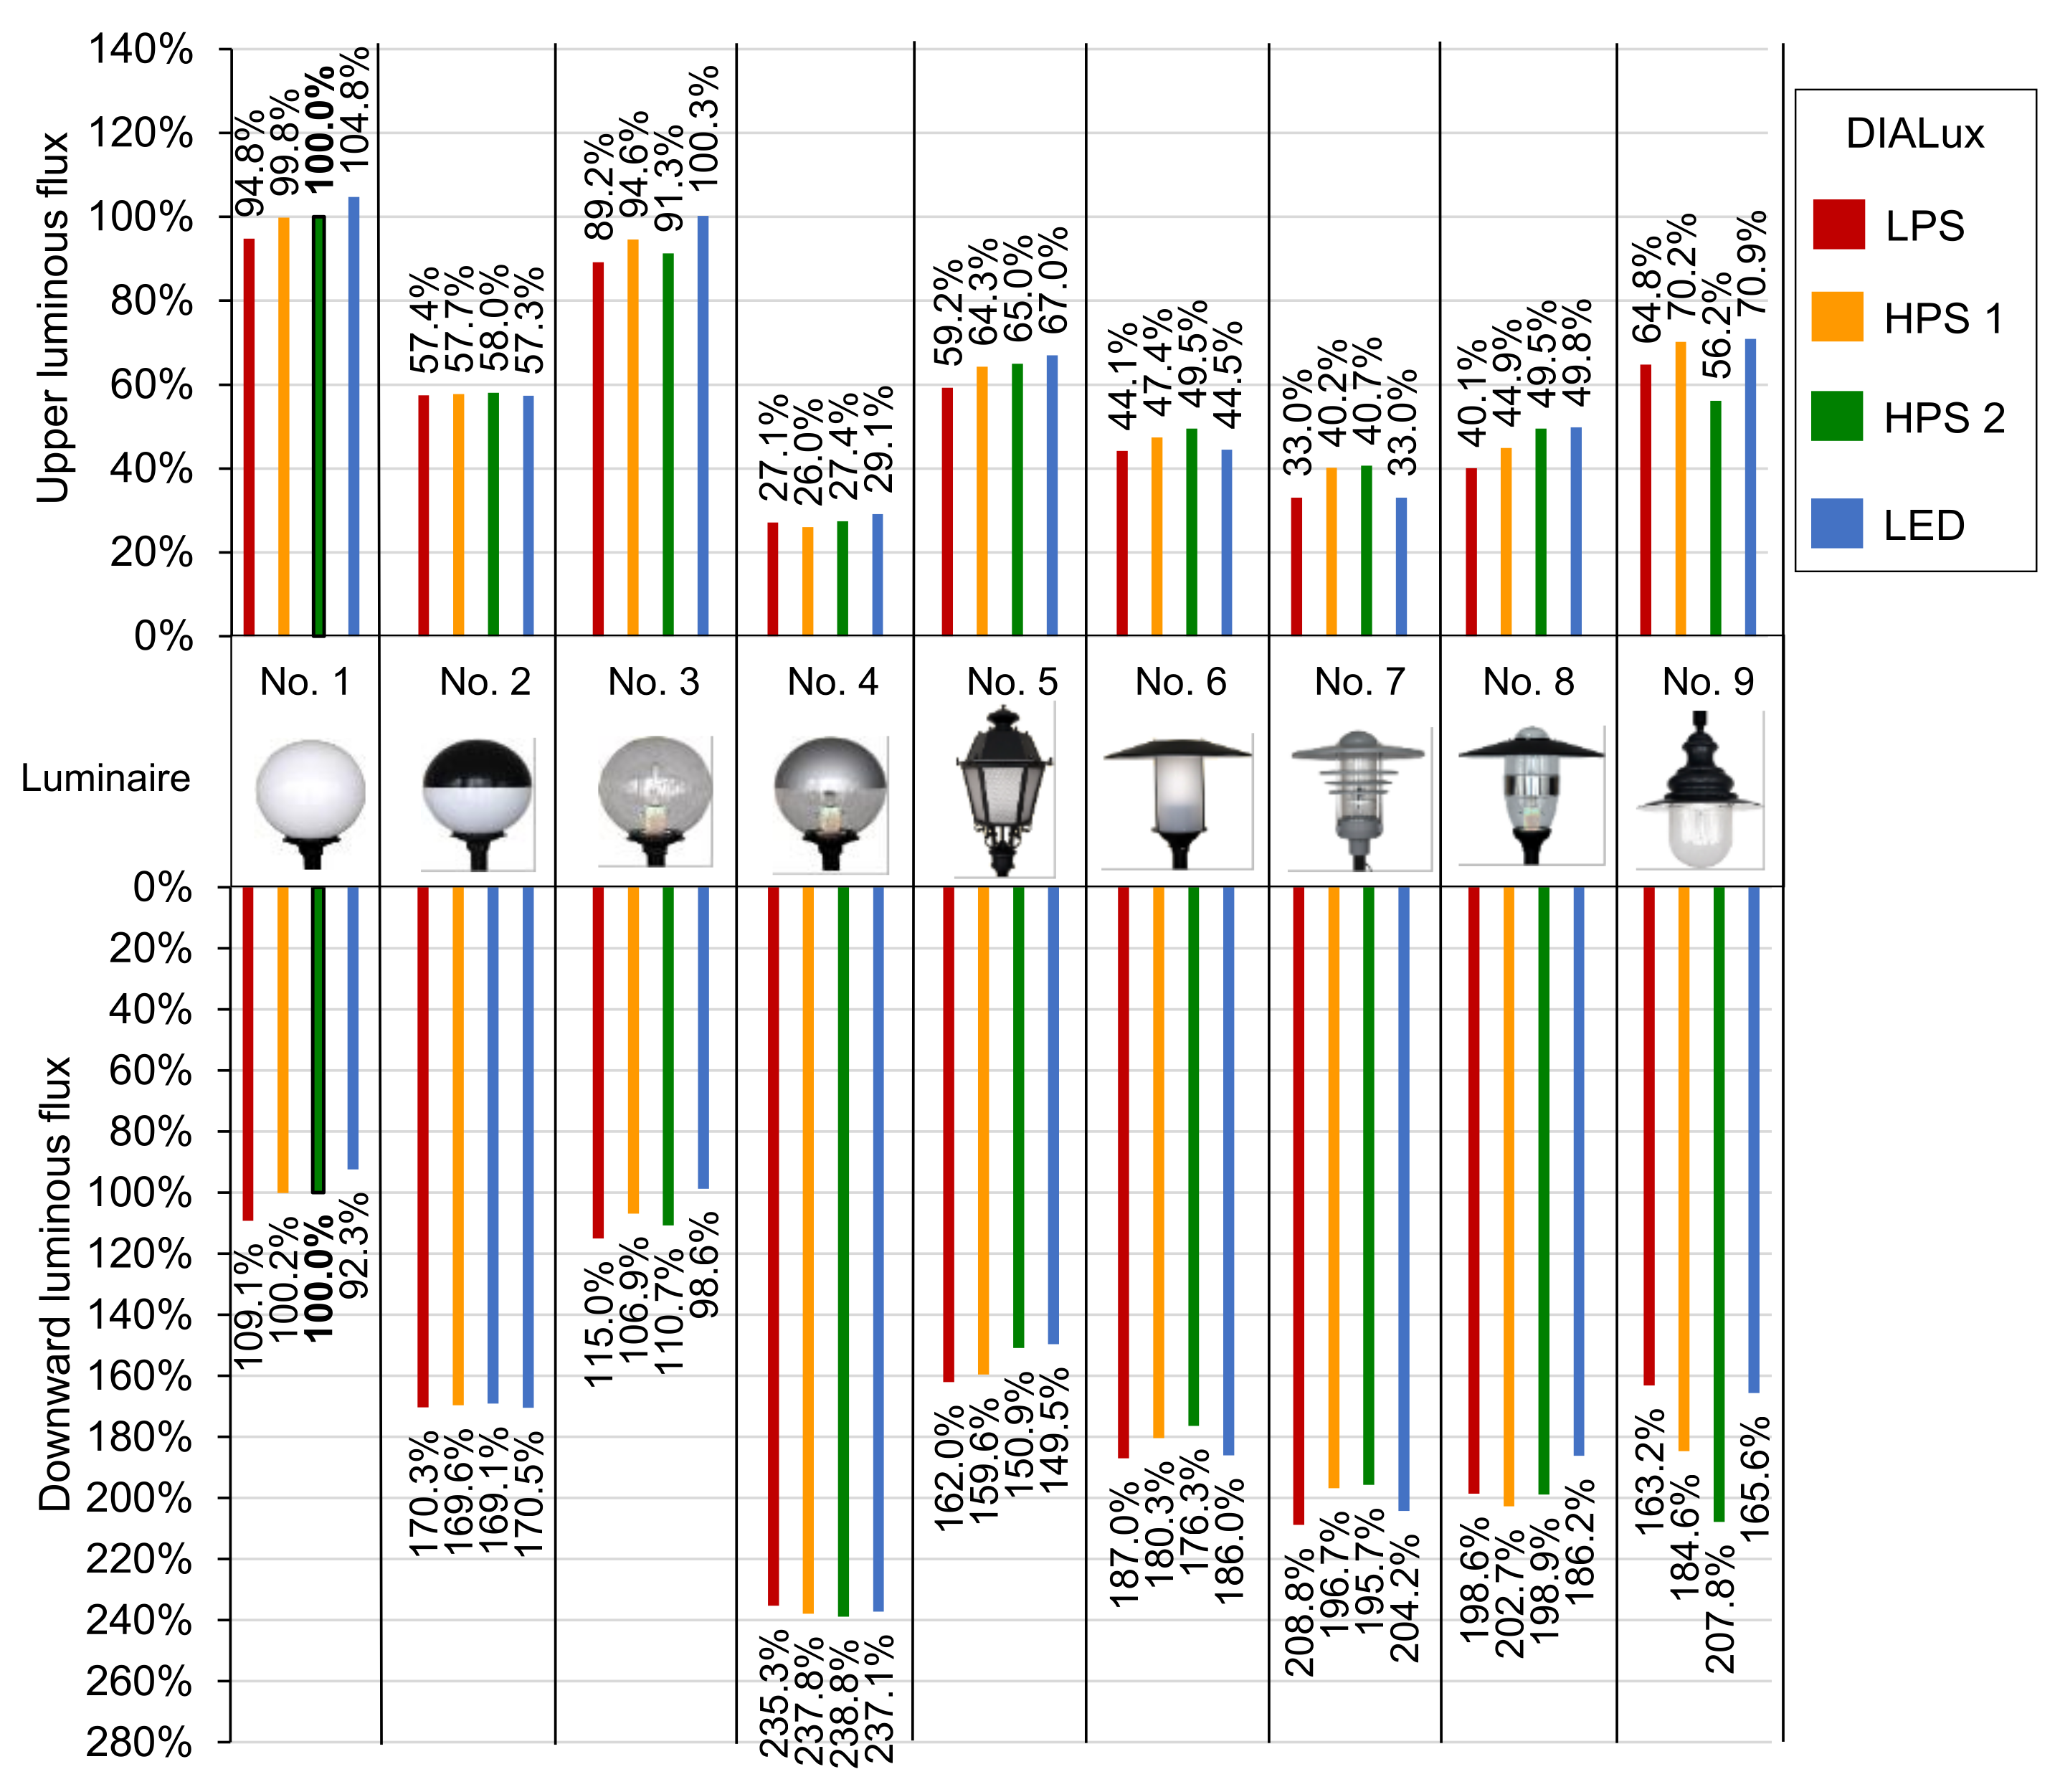
Using the DIALux software, the luminous flux sent in the direction of both the lower and the upper calculation grid was calculated for individual luminaires. The results of the calculations obtained from the DIALux program were compared with the values calculated on the basis of the photometric solid (Figure 8). Additionally, Figure 8 shows the differences (in percent) between the luminous flux calculated on the basis of a photometric solid and the luminous flux calculated in DIALux. Analyzing the values presented in Figure 8, it can be noticed that the greatest differences in the values of the luminous flux emitted into the upper half-space (ΔΦ) were obtained in the case of luminaire no. 4. The value of the luminous flux that will be emitted towards the sky is close to 80% greater than the photometric solid-based computation.
When emitting luminous flux into the lower half-space, the differences between the calculations obtained in DIALux and those carried out on the basis of the photometric solids of the luminaires do not exceed a few percent. The biggest difference (8.1%) was recorded in the case of an opal sphere-type luminaire (luminaire no. 1) cooperating with an LED source. A negative value of ΔΦ means that the value of the luminous flux that hits the substrate is smaller than that calculated on the basis of the photometric solid.
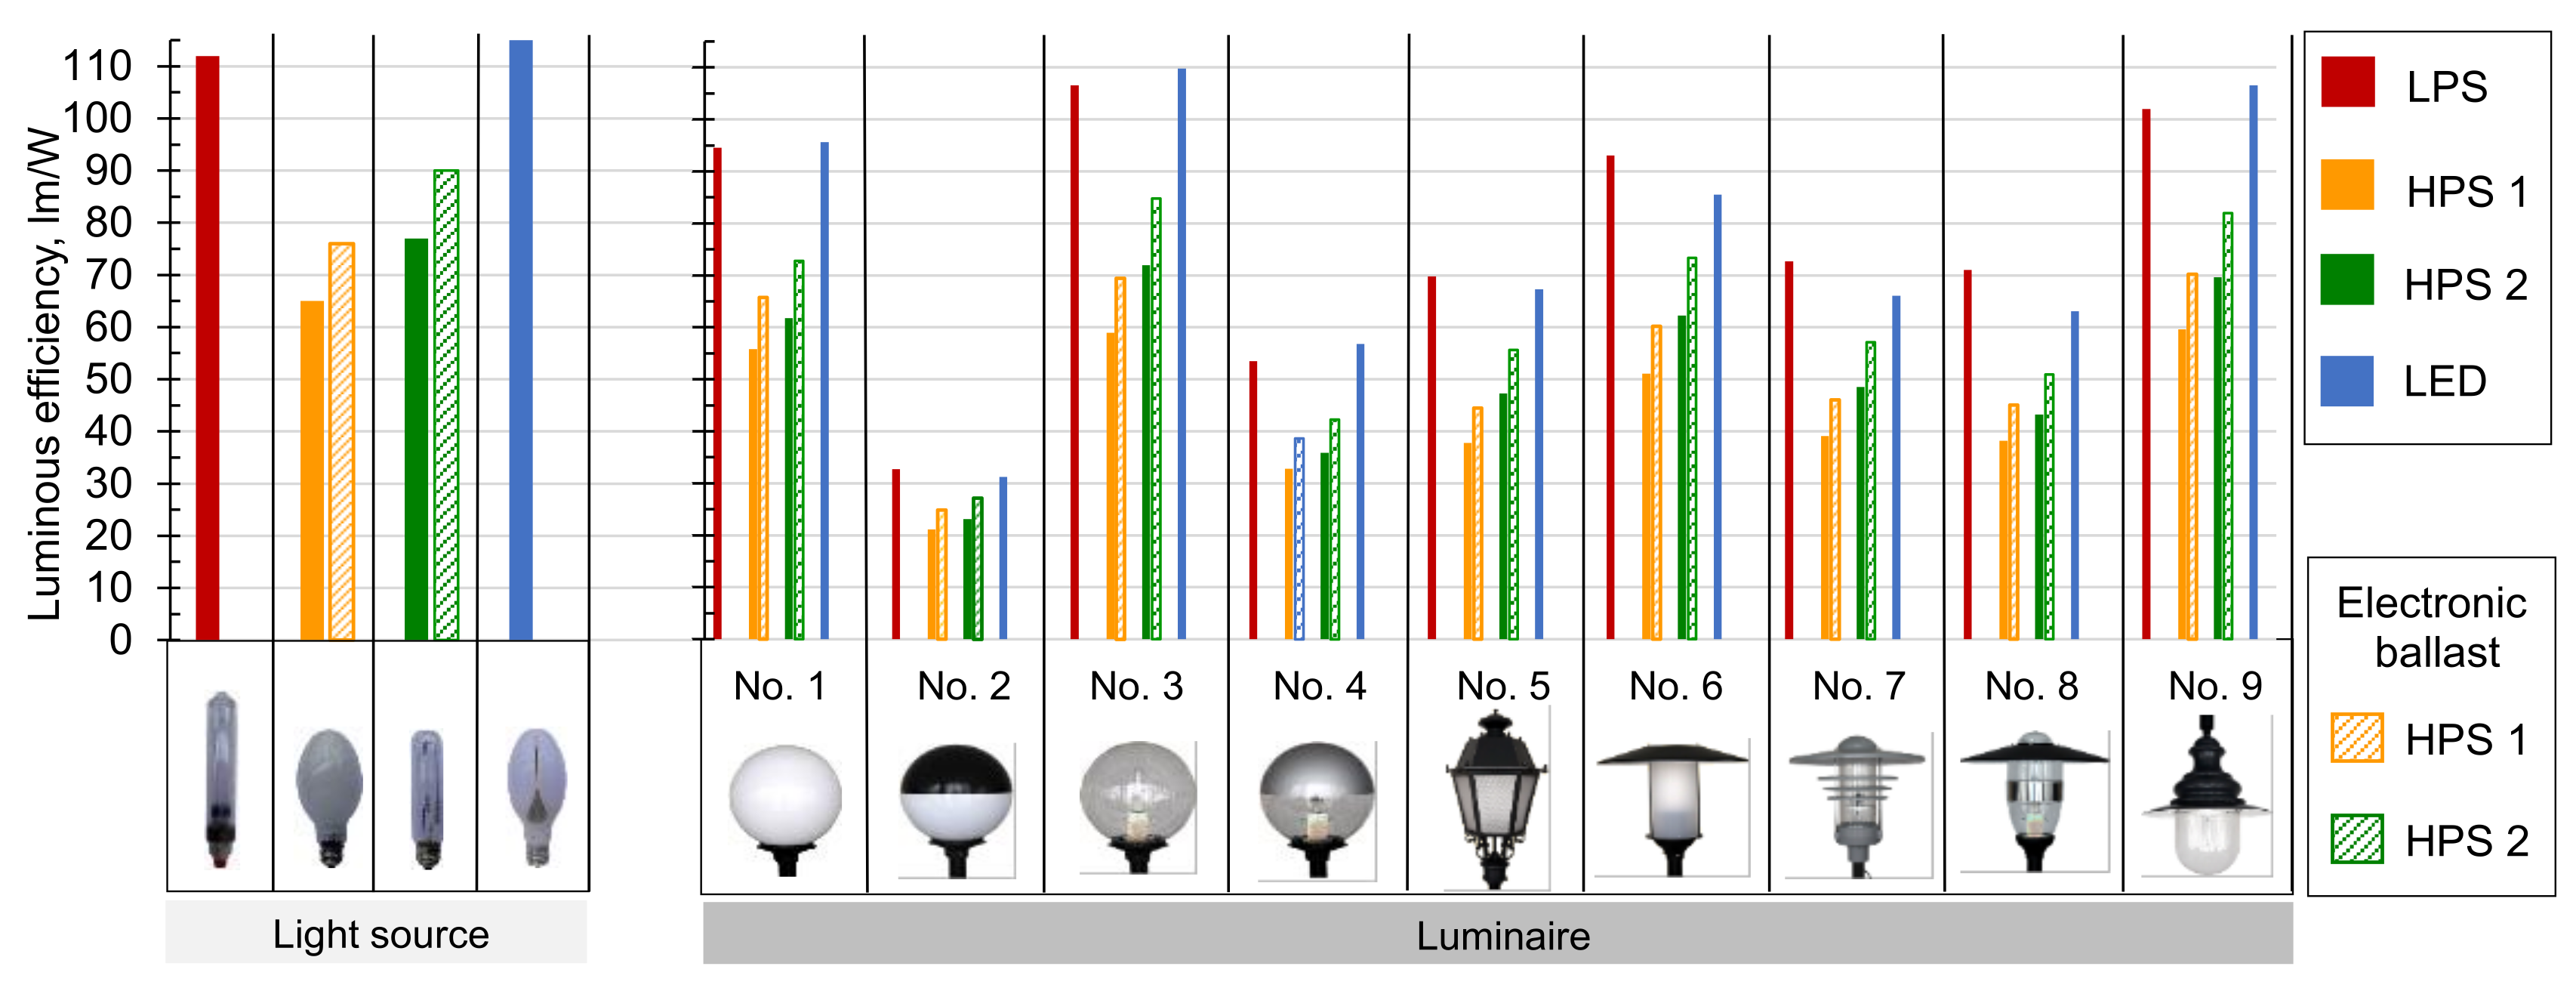
From the point of view of light pollution, the most advantageous solution seems to be luminaire no. 4 equipped with LPS, HPS 1, and LED lamps and a luminaire equipped with an HPS 2 lamp. Second place in terms of the impact on light pollution is occupied by luminaire no. 2. When selecting a luminaire, one should also take into account the efficiency of converting the supplied electric energy into luminous flux. Due to the optical phenomena occurring in the luminaire (internal reflection, external reflection, absorption of the luminous flux), the luminous flux leaving the luminaire will be lower than that of the light source itself. Figure 9 shows the calculated values of the luminous efficacy of uncovered light sources and the luminaires cooperating with sodium lamps and LED lamps. Due to the fact that the value of the power consumed by the luminaire is influenced by the type of ballast used, in the case of HPS 1 and HPS 2 lamps, the possibility of hypothetical cooperation with an electronic ballast was considered. When calculating the hypothetical luminous efficiency of high-pressure sodium lamps, it was assumed (according to the manufacturer’s data) that these lamps, together with the ballast, would consume a 74 W of power, while the value of the resulting luminous flux is given in Table 1. The assumptions made result from the fact that that no electronic ballast was available for high-pressure sodium lamps (thus, it was not possible to carry out measurements).
The least optimistic results were obtained for luminaire no. 2. The highest energy efficiency values were recorded for the luminaire with a transparent lampshade (luminaire no. 3). However, taking into account the data presented in Figure 8 (significant emission of the luminous flux into the upper half-space), a more advantageous solution is to use, for example, luminaire no. 6. In other words, when selecting the type of luminaire and the type of light source, the values of the luminous fluxes should be compared with the luminous efficiency values (data from Figure 8 and Figure 9). For conventional luminaires, a low UFF (ULR) value does not necessarily equate to high luminous efficacy as a measure of energy efficiency. Such a situation occurs in the case of luminaire no. 4, the luminous efficacy of which is 57 lm/W with an installed LED source and 53 lm/W with an installed LPS source.
Equipping luminaires working with high-pressure sodium lamps (HPS 1, HPS 2) with electronic ballasts does not allow for an increase of the luminous efficacy to an extent to be able to state that such a solution can compete with LPS and LED lamps.
The results of the calculations carried out to present time have not taken into account the spectral characteristics that play an important role in the context of light pollution. In order to analyze the influence of the spectral characteristics of the light sources installed in the luminaires, the spectral characteristics were determined for each of the nine luminaires considered (Figure 10). The data in Figure 10 clearly show that as a result of optical phenomena occurring in the luminaires, the spectral characteristics of the luminous flux leaving the luminaire differ from the spectral characteristics of the uncovered light source. All the actual materials used to form the optical elements of the luminaires are characterized by non-linear transmission characteristic of individual wavelengths. In the case of reflective materials, not all wavelengths will be reflected identically. The situation is similar in the case of light-transmitting surfaces (shades of luminaires). In the case of the analyzed luminaires and in the range of short-wave radiation (below 410 nm), a reduction in radiation was observed. This is particularly important in the case of LED sources, for which the maximum radiation is below 410 nm. Such a situation will occur, for example, in the case of an LED source with a value of CCT equal to 7250 K (LED no. 141), for which the maximum radiation spectrum concerns a wavelength of 420 nm.
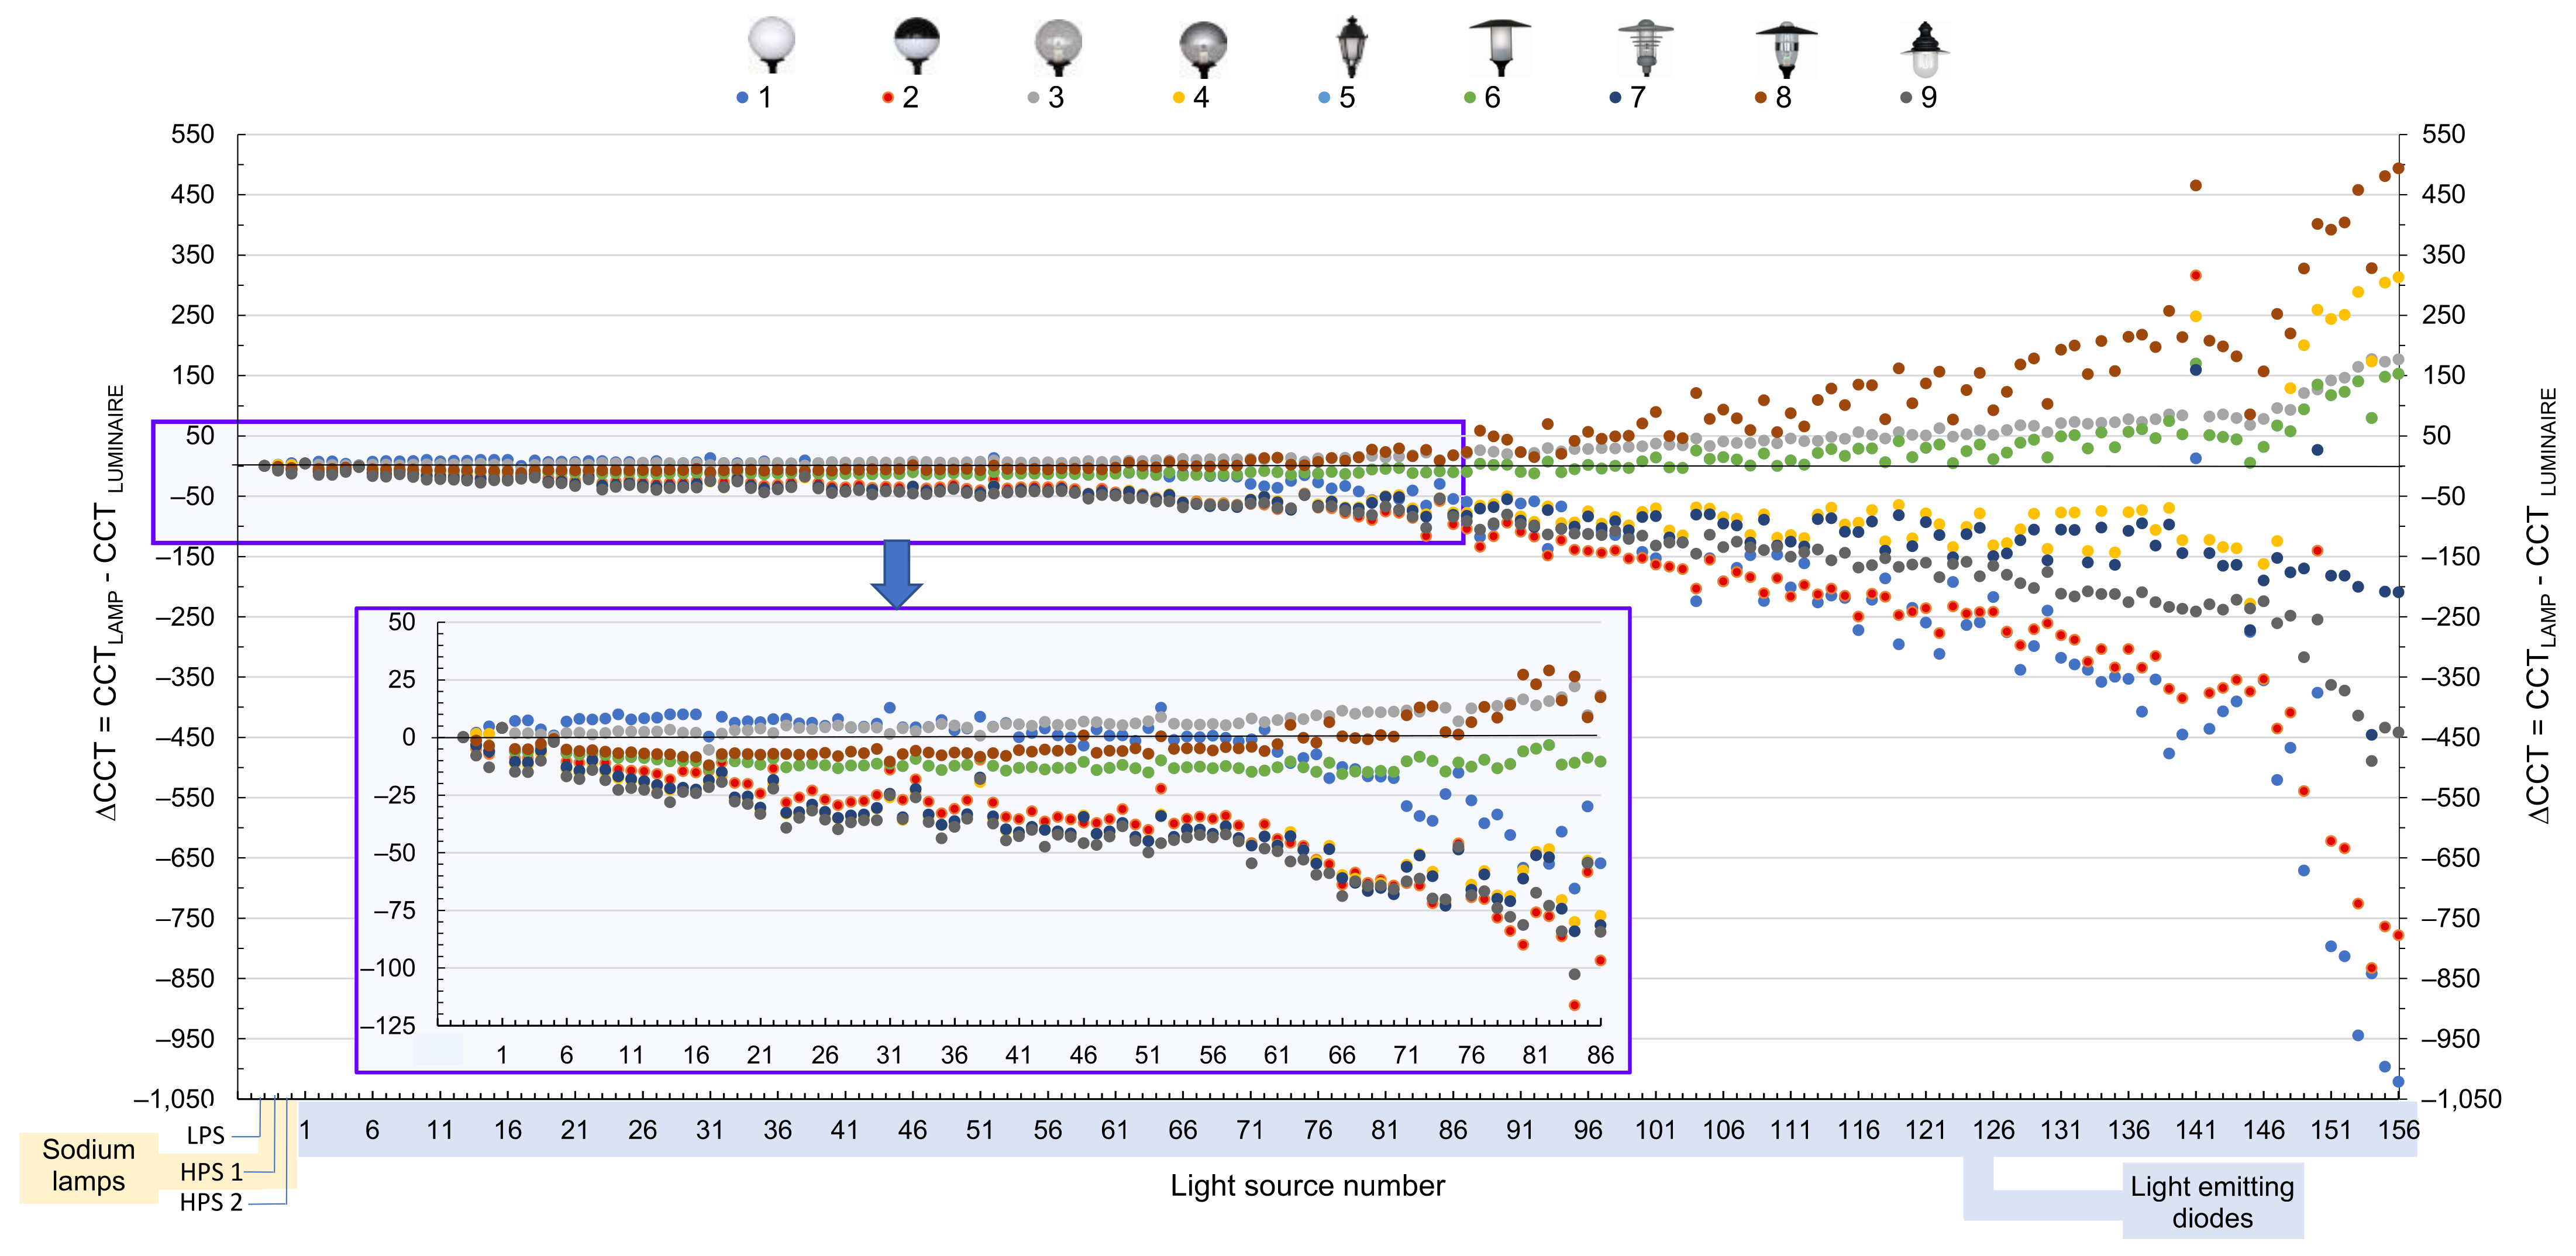
As a result of processing by the luminaire of the spectral characteristics of the light source, the colorimetric characteristics of the radiation exiting the luminaire change. One should also expect changes in the CRI and CCT values. With “new” spectral distributions of light, changed by the luminaire, for each of the nine luminaires cooperating with sodium lamps and LED lamps, the CRI and CCT values were calculated. Regarding CRI, in 208 cases out of 1431 (9 luminaires and 159 light sources), changes in CRI by a value of ±1 were observed. In other cases, the CRI value did not change. Due to such insignificant changes in the CRI values, the author mooted the presentation of the data in this field. The structure is different in the case of CCT values. As CCT of the light source increased, greater differences were observed between CCT for the uncovered light source and the CCT value of the radiation exiting the luminaire. The calculated values of ΔCCT are graphically illustrated in Figure 11. Negative ΔCCT values should be interpreted as follows: the color of the light emitted by the luminaire will be cooler (CCT will increase). On the other hand, the opposite structure will occur in the case of positive values of ΔCCT, where the CCT will decrease (the color of the light will be warmer). Among the nine luminaires considered within the studies, the colorimetric features change at least in the case of luminaire no. 3 and no. 6. The biggest differences are noticed in the case of the opal sphere-type luminaire (luminaire no. 1).
For all sodium lamps and LED sources with numbers from 1 to 83 (CCT value for LED no. 83 is 4227 K), regardless of the type of luminaires used in the tests, the difference between the CCT values for the uncovered light source and that obtained for the luminaire does not exceed 100 K. It is important to note that when installing a light source in the luminaire with the CCT value specified by the manufacturer, we do not know how the lamp radiation will be converted by the luminaire. On the basis of the conducted studies, in the author’s opinion, when installing lamps in park luminaires with CCT values that do not exceed 4000 K, the CCT value of radiation leaving the luminaire should not differ by more than 100 K.
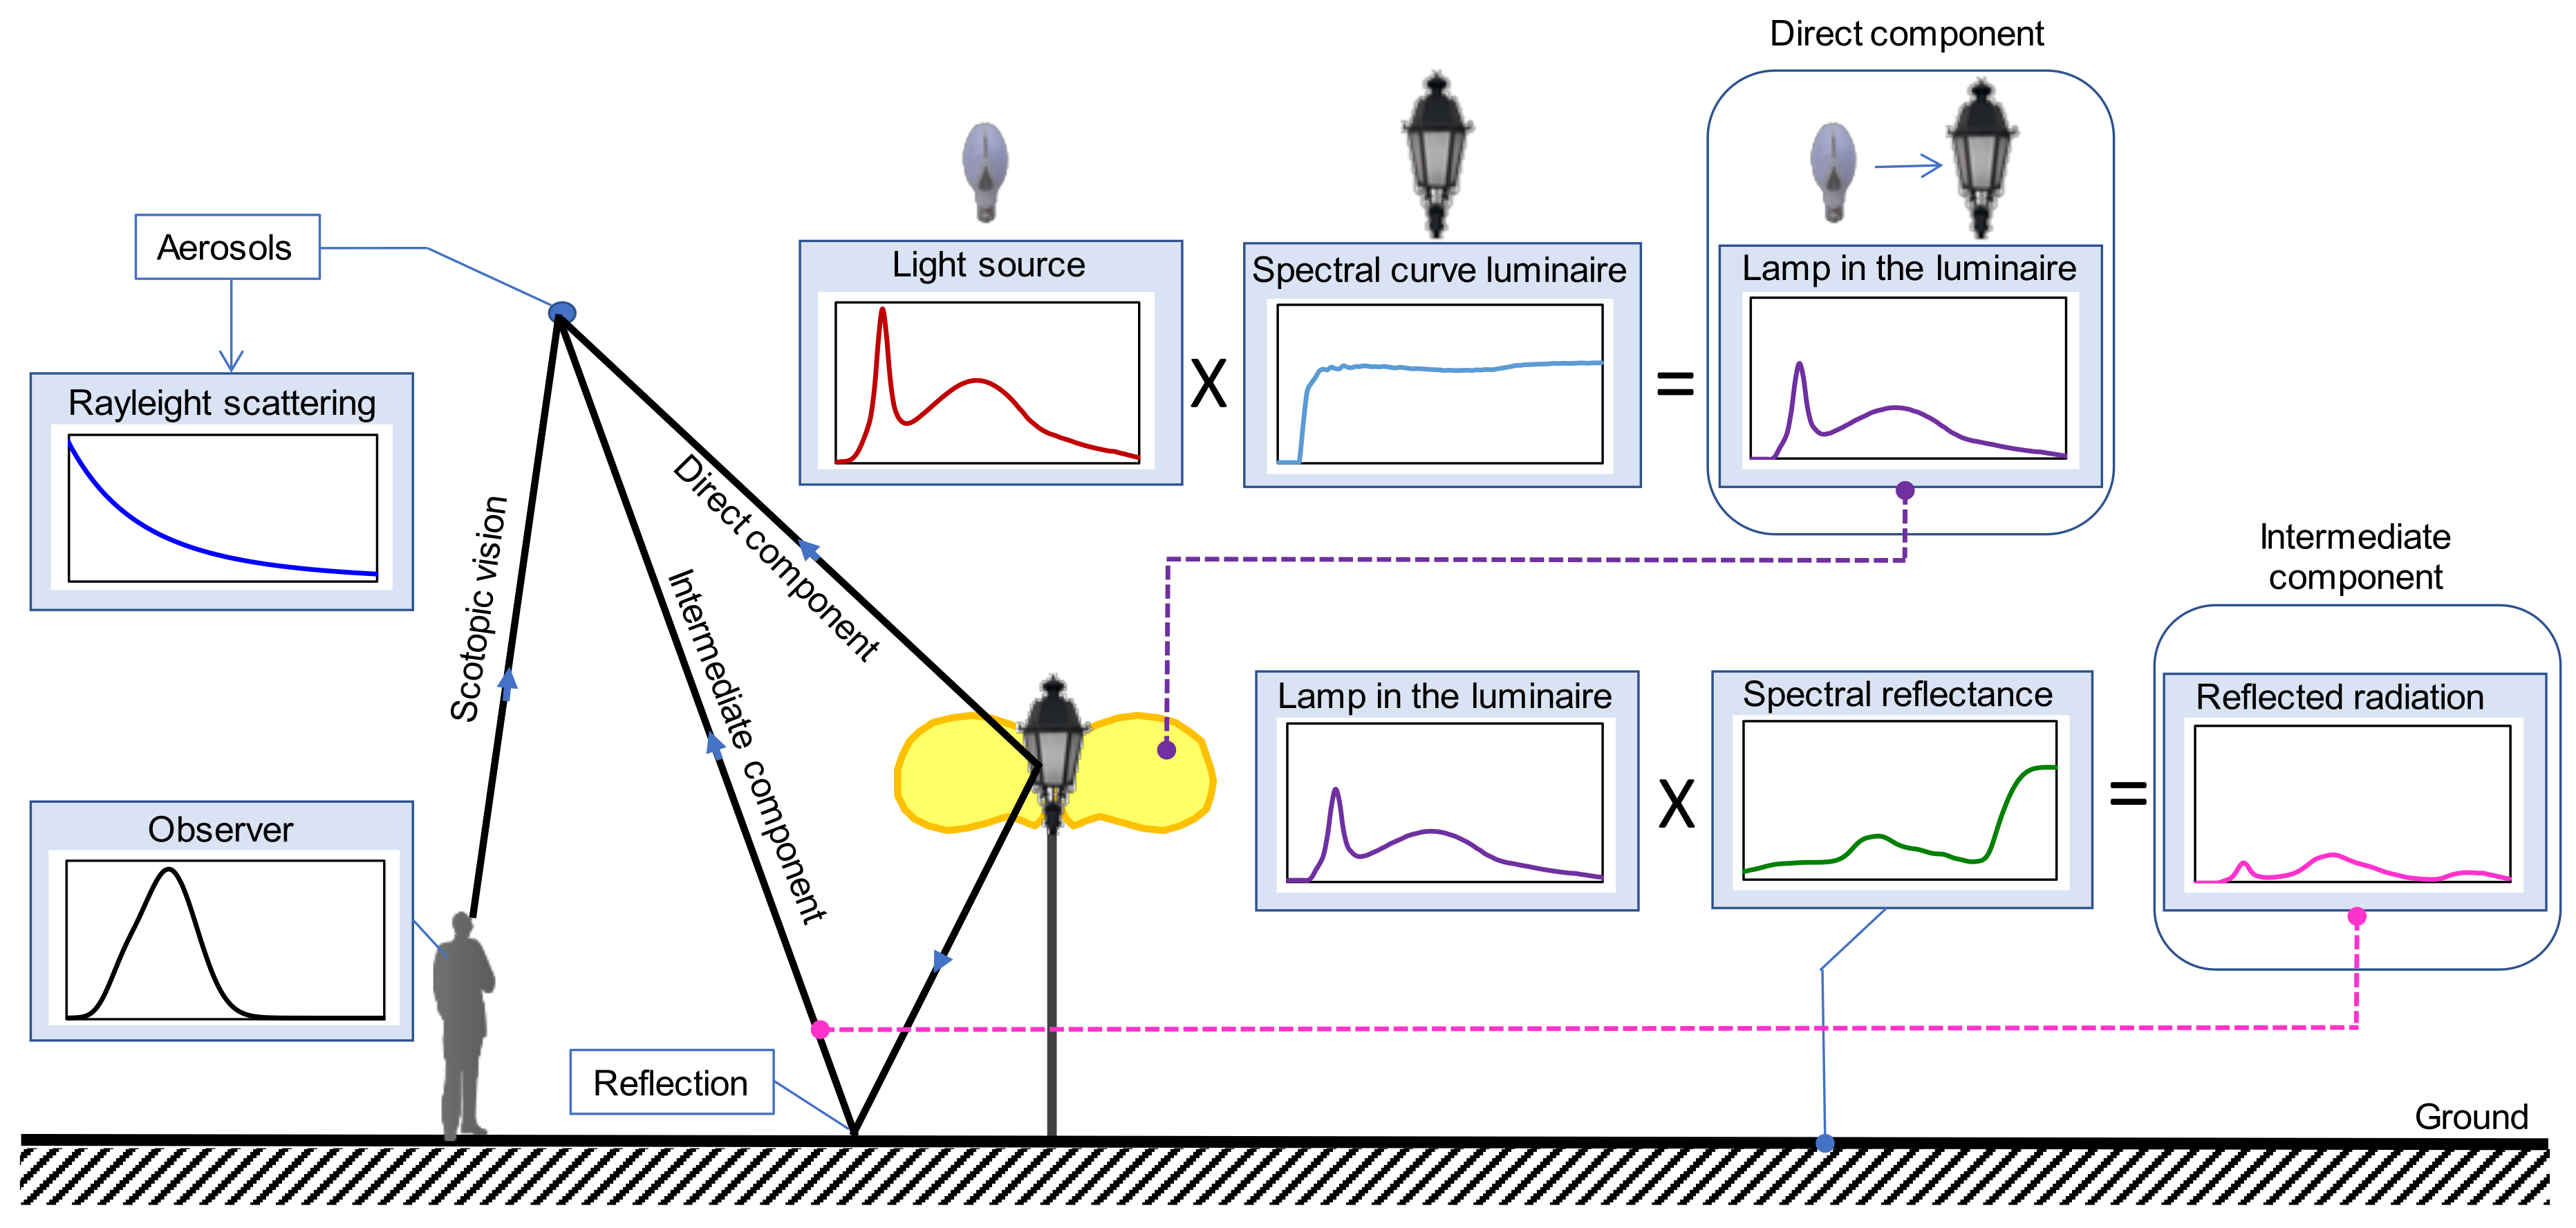
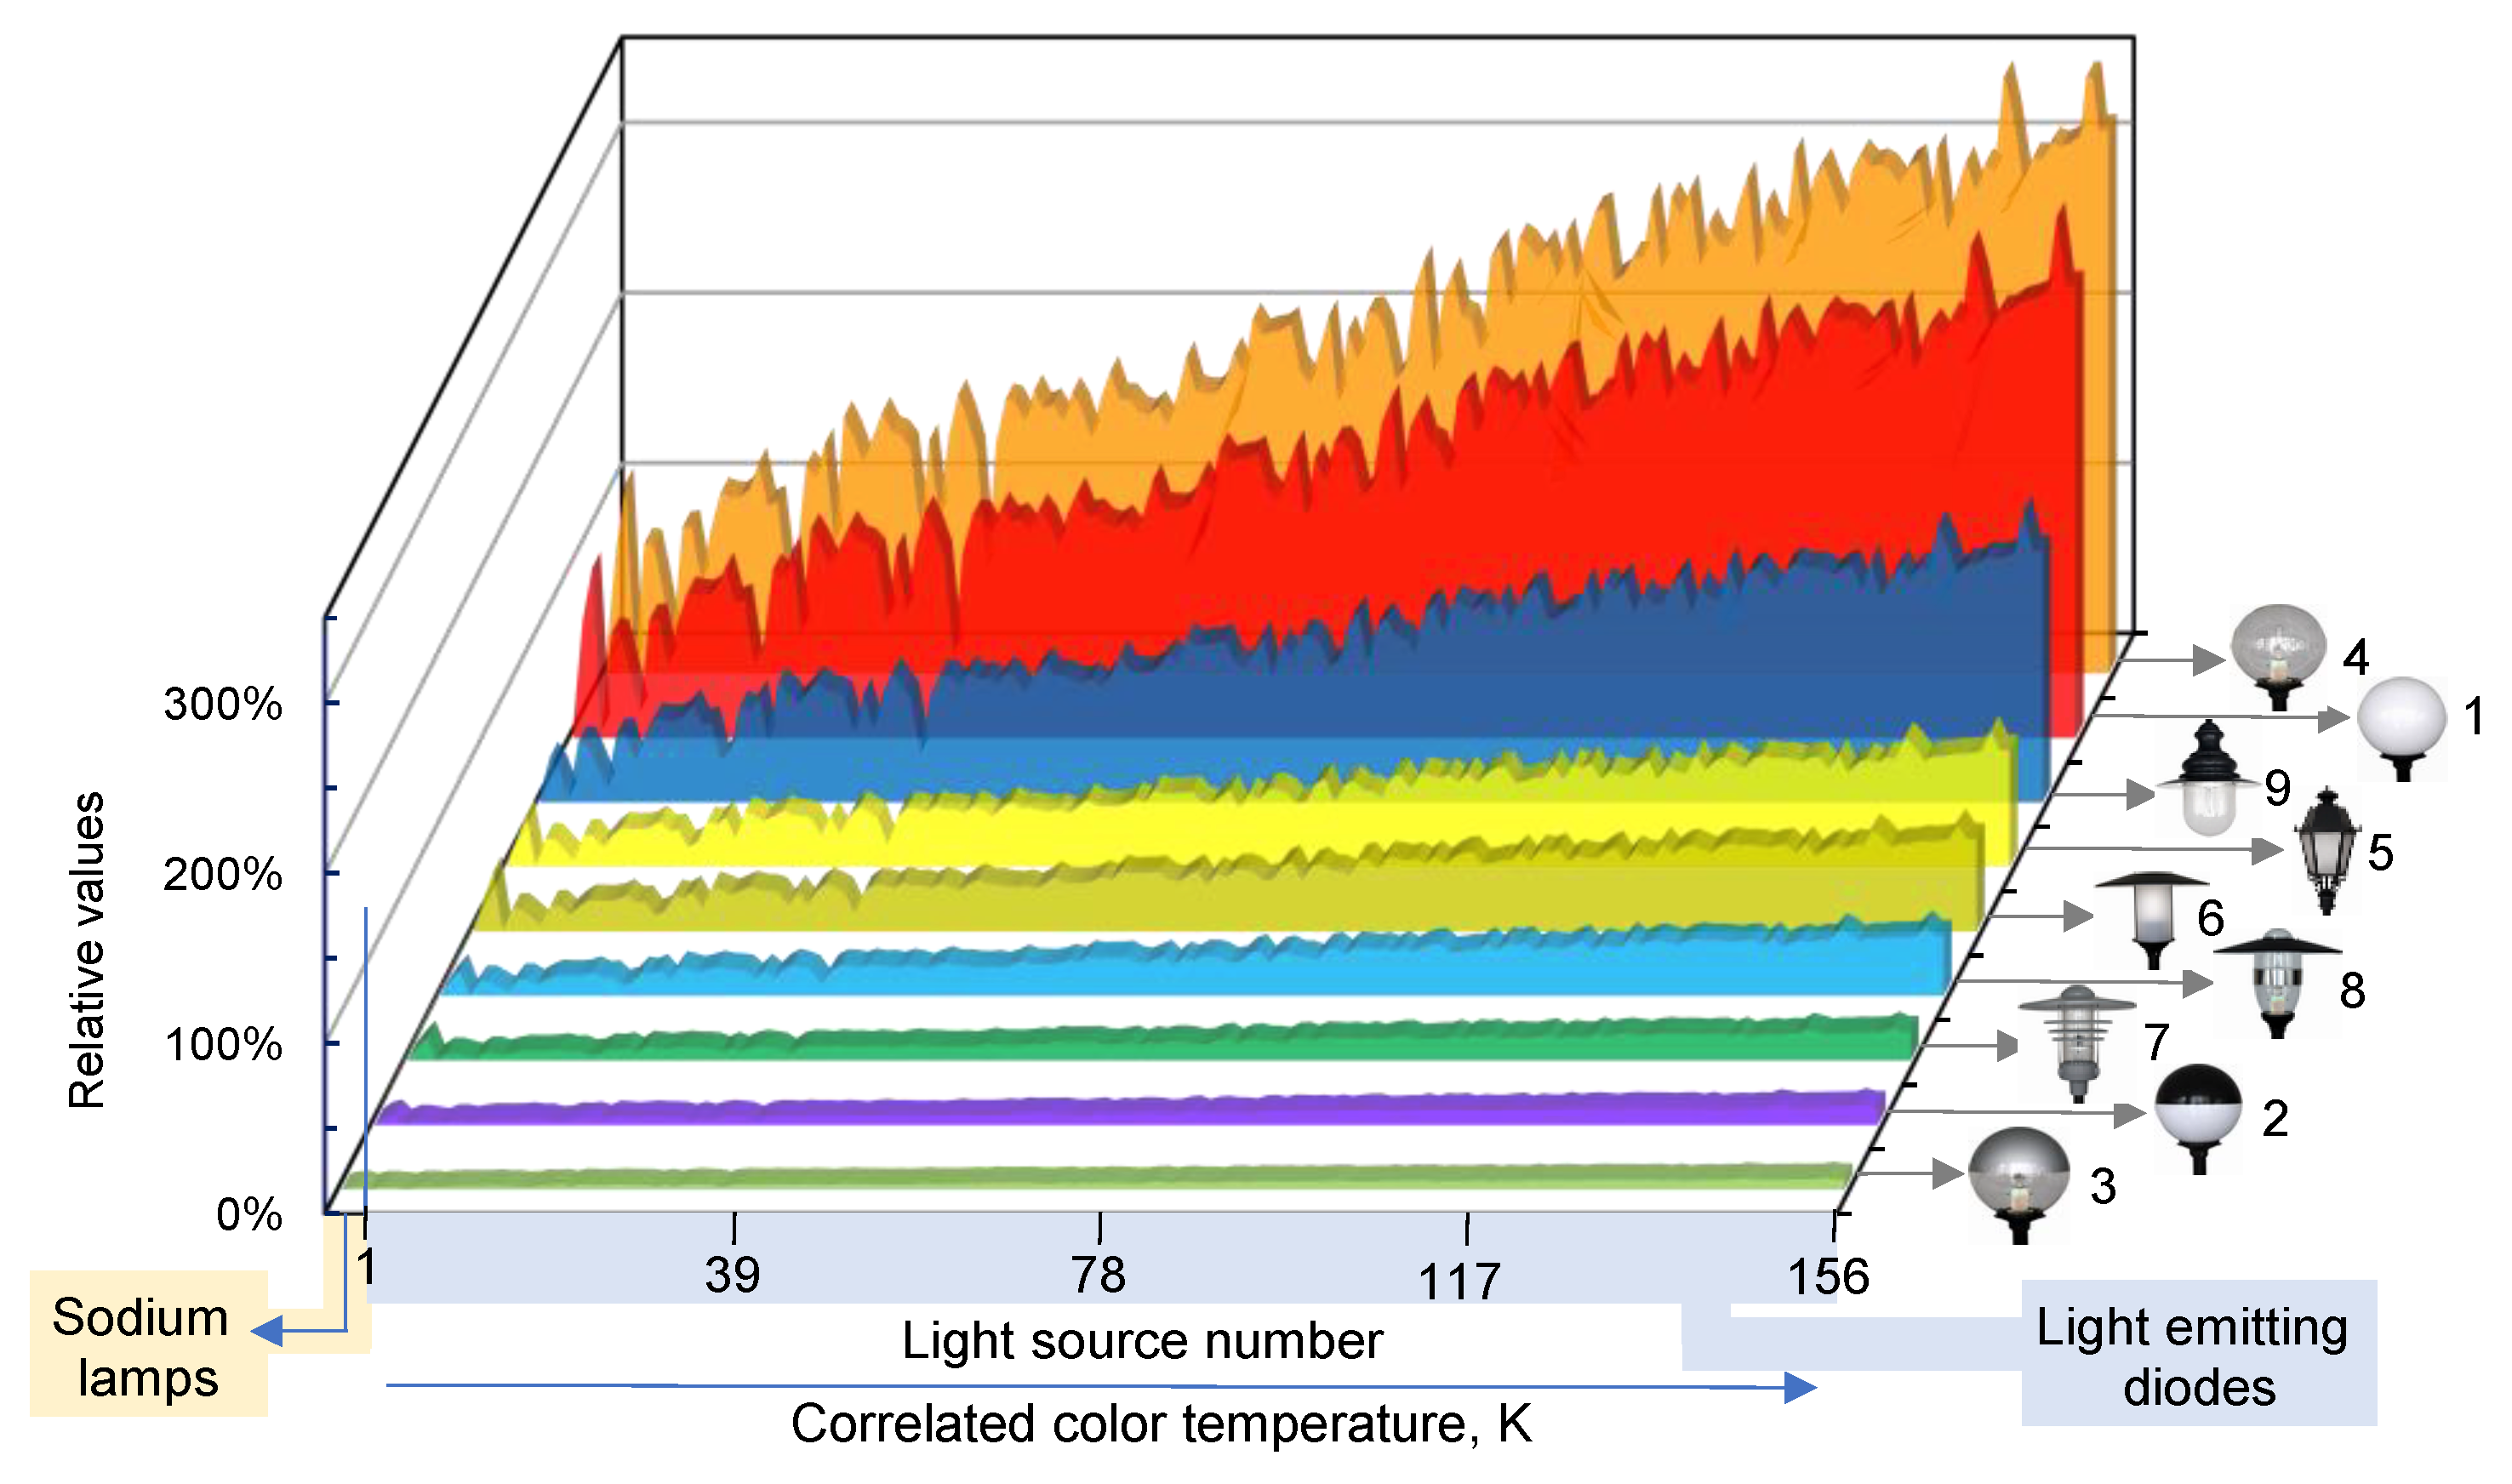
Having calculated the luminous flux values (in DIALux) and spectral characteristics of 9 luminaires cooperating with 159 light sources, the relative effect on the brightening of the night sky was calculated. The luminaire with the opal sphere-type lampshade cooperating with the HPS 2 lamp was adopted as a reference This was done because the opal sphere-type luminaires with an installed HPS 2 lamp are the most popular solution in the lighting the green areas. The calculations assumed that the ground on which the luminaires are installed is covered with grass. The spectral reflectance coefficient of the grass was taken from the Jet Propulsion Laboratory (JPL) spectral library, which is available on the National Aeronautics and Space Administration (NASA) website [91]. An illustrative presentation of the factors that were taken into account during the calculations is presented in Figure 12. It was assumed that the radiation emitted towards the sky is scattered according to the Rayleigh theory, which states that light scattering is inversely proportional to the fourth power of the wavelength [43]. This means that shorter wavelengths are more dispersed. Due to the low luminance levels of the night sky (below 0.005 cd/m2), it was assumed in the considerations that the observer is a man whose eye is adapted to scotopic vision. The radiation that hits the upper half-space is the sum of two components: the radiation directly emitted by the luminaire (the so-called direct component) and the radiation reflected from the ground (the so-called indirect component).
For such assumptions, calculations were made in the area of the potential impact on the LP, the main effect of which is an increase in the brightness of the night sky (sky glow). The results of the calculations are presented in Figure 13.
In order to ensure the readability of the graph, the data were compiled by ranking the luminaires, for which the relative values of the effect on the brightening of the night sky were obtained from smallest to largest. The highest values of the influence on the glare of the sky were obtained in the case of the luminaire equipped with a transparent spherical lampshade (luminaire no. 4).
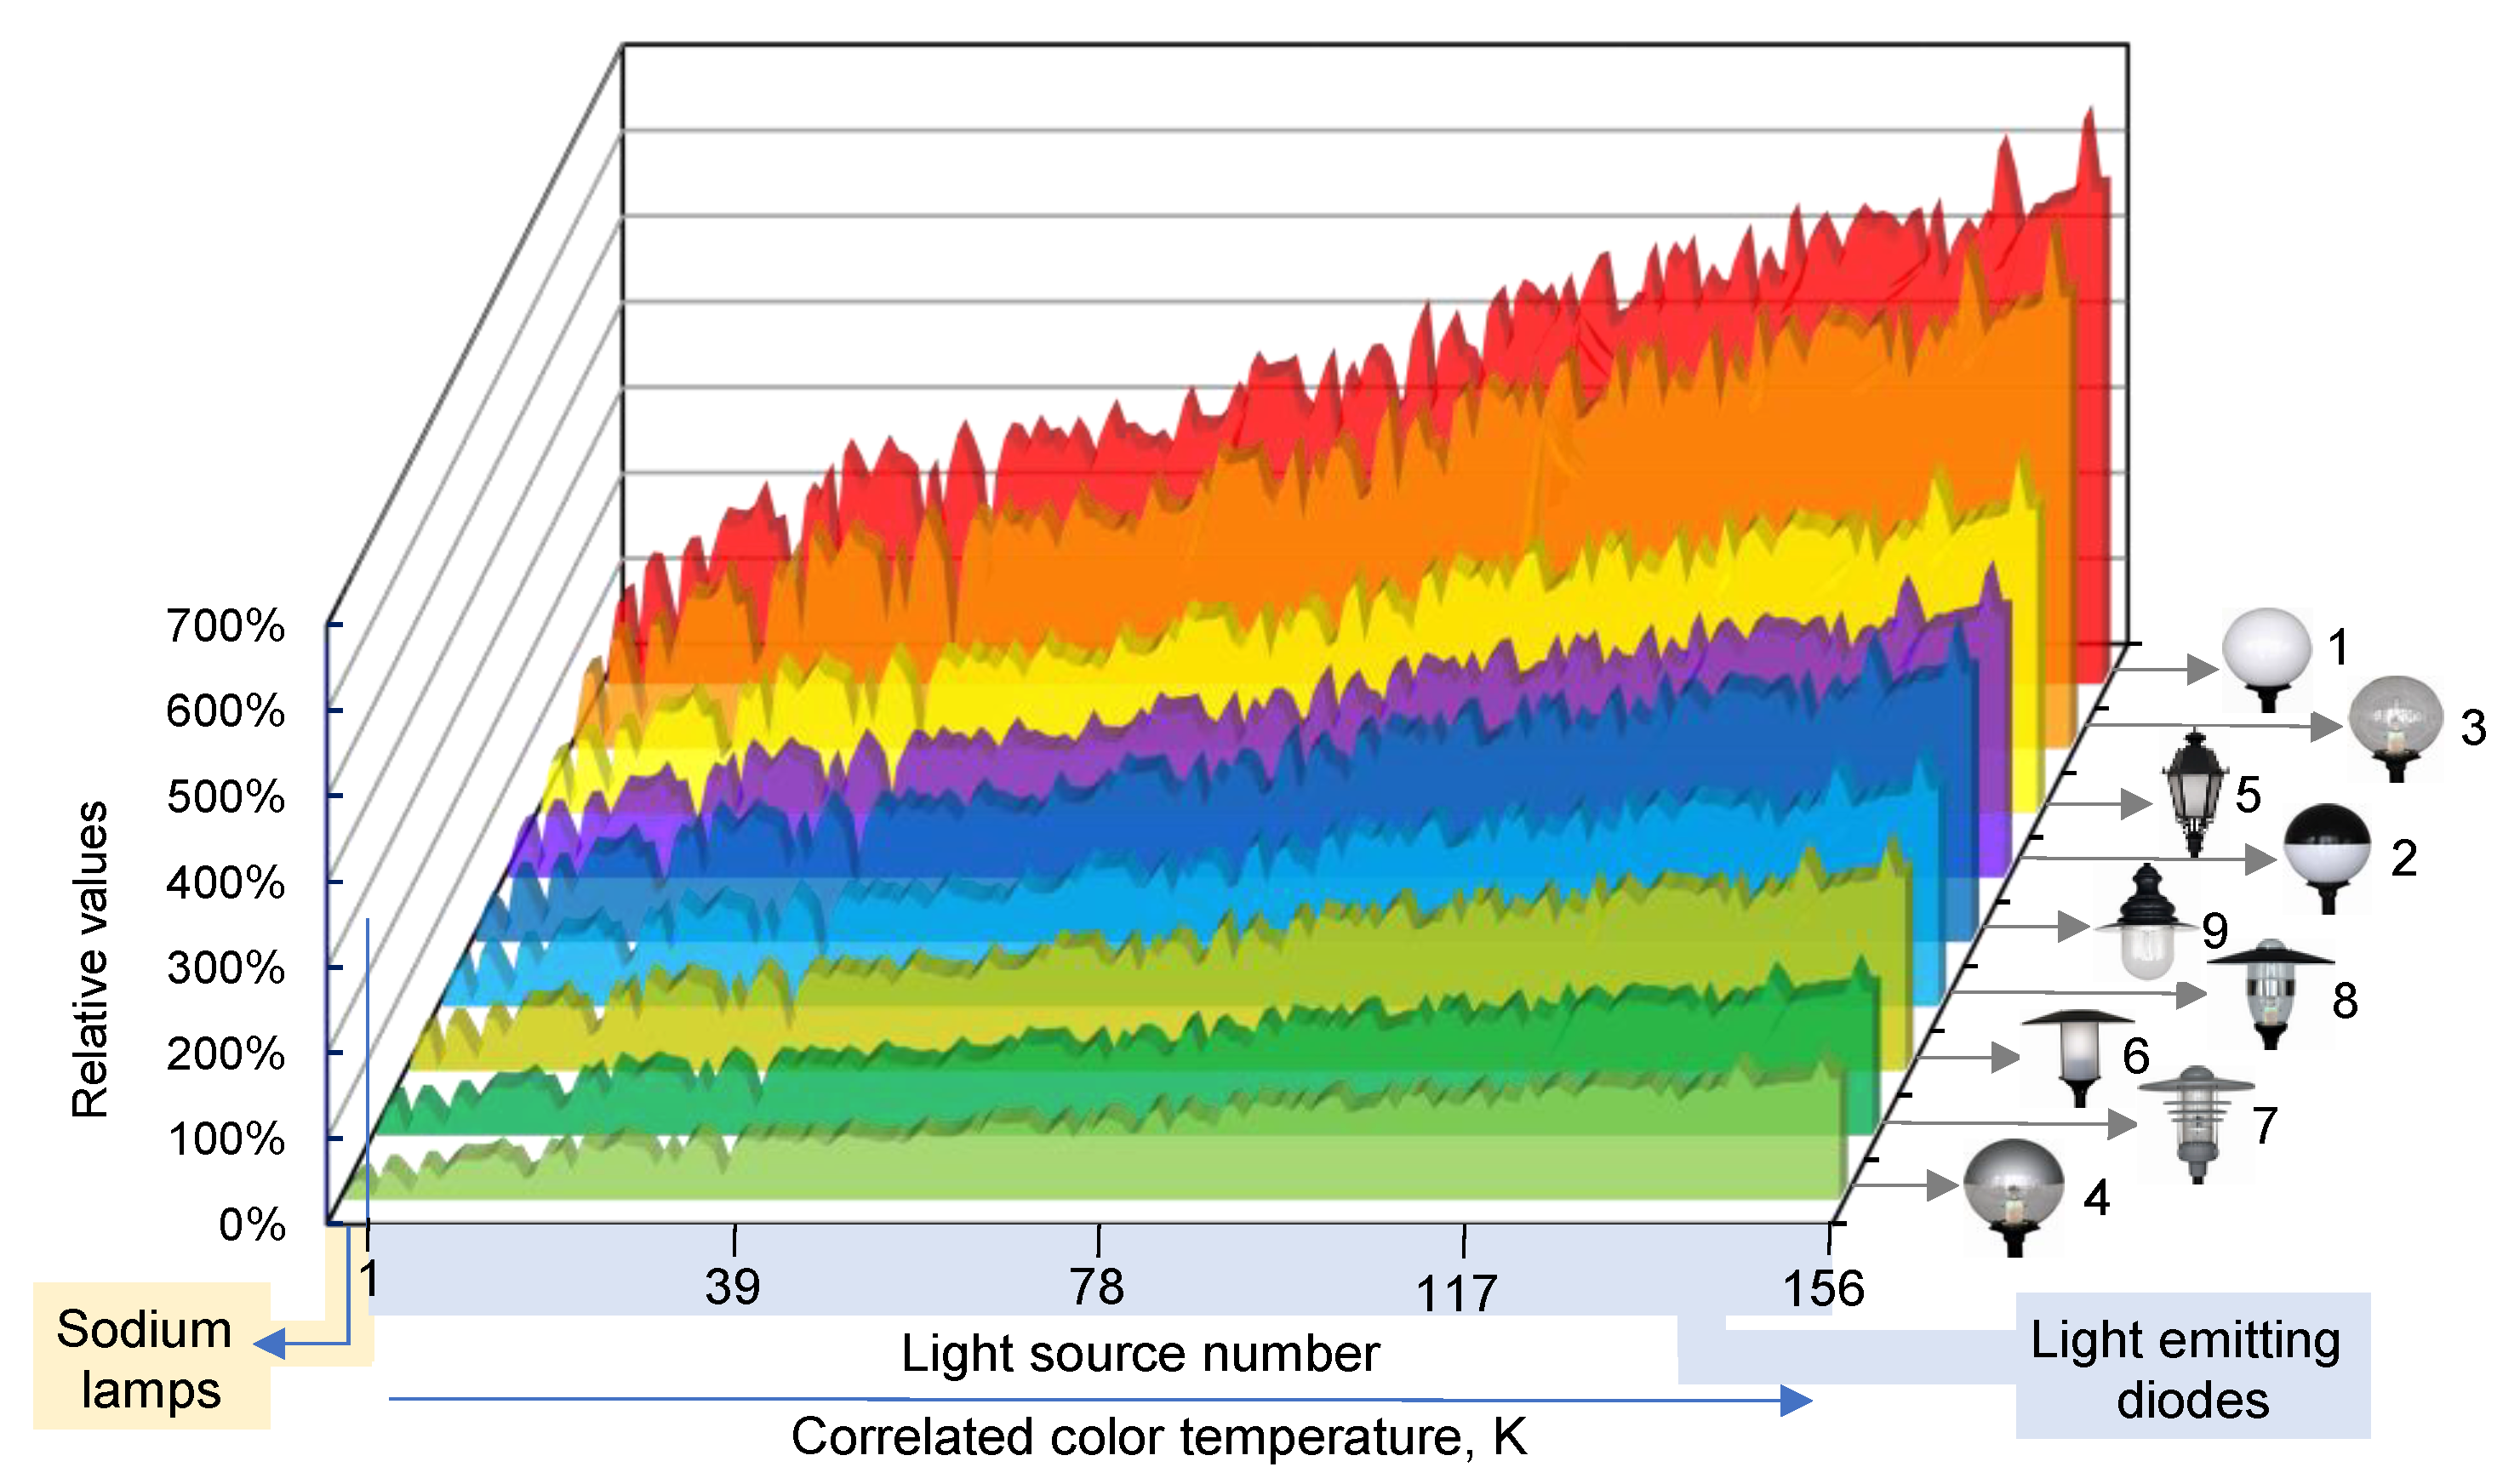
The data presented in Figure 13 refer to different values of the luminous flux emitted by the individual luminaires. It is understandable that the lower the value of the total luminous flux emitted by the luminaire, the lower its impact on light pollution. This fact makes it difficult to assess the influence of the photometric solid of the luminaire and the spectral distribution of the radiation on the light pollution. Hence, further in the discussion, it was decided to standardize the luminous flux for all nine luminaires. In other words, it was assumed that the value of the total luminous flux for each of the nine luminaires, regardless of the light source installed inside it, is identical. This assumption means that the capacity of the photometric solids changes (Table 3 and Table 4), while their shapes remain unchanged. Due to the change of the luminous flux of the luminaire, it was necessary to carry out the calculations again in the DIALux. The results of the calculations are presented in Figure 14. The obtained values of the luminous flux emitted in the upper and lower half-space, respectively, were related to the opal sphere-type luminaire (luminaire no. 1) cooperating with the HPS 2 lamp. From the point of view of LP, luminaire no. 4 seems to be the best solution (the amount of light emitted to the upper half-space of the luminous flux is the smallest).
The relative influence on the brightening of the night sky, taking into account the spectral characteristics, is shown in Figure 15. Similarly, the results of the calculations for individual luminaires were ranked using the obtained relative values from smallest to largest as a criterion. Analyzing the data from Figure 15, one can see a correlation with the results of the calculations presented in Figure 14. The highest values were obtained for luminaire no. 1, while the smallest for luminaire no. 4.
When analyzing the data from Figure 15, certain regularity can be noticed. As the CCT of the light source installed in the luminaire increases, the effect on LP increases. However, these changes are not linear. Local highs and lows can be seen. For example, if luminaire no. 1 is superimposed on another graph, with CRI values on the graph illustrating the relative changes in the impact on LP with the change of CCT, it is seen that the CRI value also affects LP (see Figure 15). By using light sources with lower CRI values, the impact on LP can be minimized. A good example illustrating this situation is the LED sources marked as 99 and 139. Despite the significant difference in the CCT values (over 2000 K), the difference in the impact on the LP is only 8%. The CRI of the radiation emitted by the opal sphere-type luminaire with the installed LED source marked as 99 is 88, while with the LED marked as 139, the CRI is 20 lower and is equal to 68. The relative values of the influence on the light pollution determined in the calculation process also indicate that the increase in the CCT of radiation emitted by the luminaire does not have to be associated with an increase in the impact on LP. An example confirming this situation is, e.g., LED sources 18 and 38. Despite the differences in CCT values, in both cases, the impact on LP is 122.3%. The reason for this is the lower CRI value for an LED source with a higher CCT (LED no. 38). The data in Figure 15 also show that in the case of some LED sources, the effect on LP may be lower than with the popular HPS lamp installed in the luminaire. This is the case with LED sources 4, 5, and 8. However, in the case of LED no. 1 (with parameters: CCT = 1000 K and CRI = 22), the influence on LP is smaller than in the case of LPS. An interesting proposition of the LED source is a lamp marked as 17. The effect on LP is practically the same as with the HPS 2 lamp, while the CRI value is slightly higher. In the case of the HPS 2 lamp, the CRI value is 34, while for LED no. 17, the CRI value is 41.
The data presented in Figure 16 refer to the popular opal sphere-type luminaire. A similar analysis can be made for the remaining eight luminaires considered. Due to the large amount of data, the publication of subsequent graphic visualizations of the calculation results for individual luminaires was abandoned. According to the author, from the point of view of the potential impact on LP, an important issue is the information on the numbers of light sources at which the impact on LP will not be greater than in the case of the opal sphere-type luminaire with the installed high-pressure sodium lamp HPS 2.
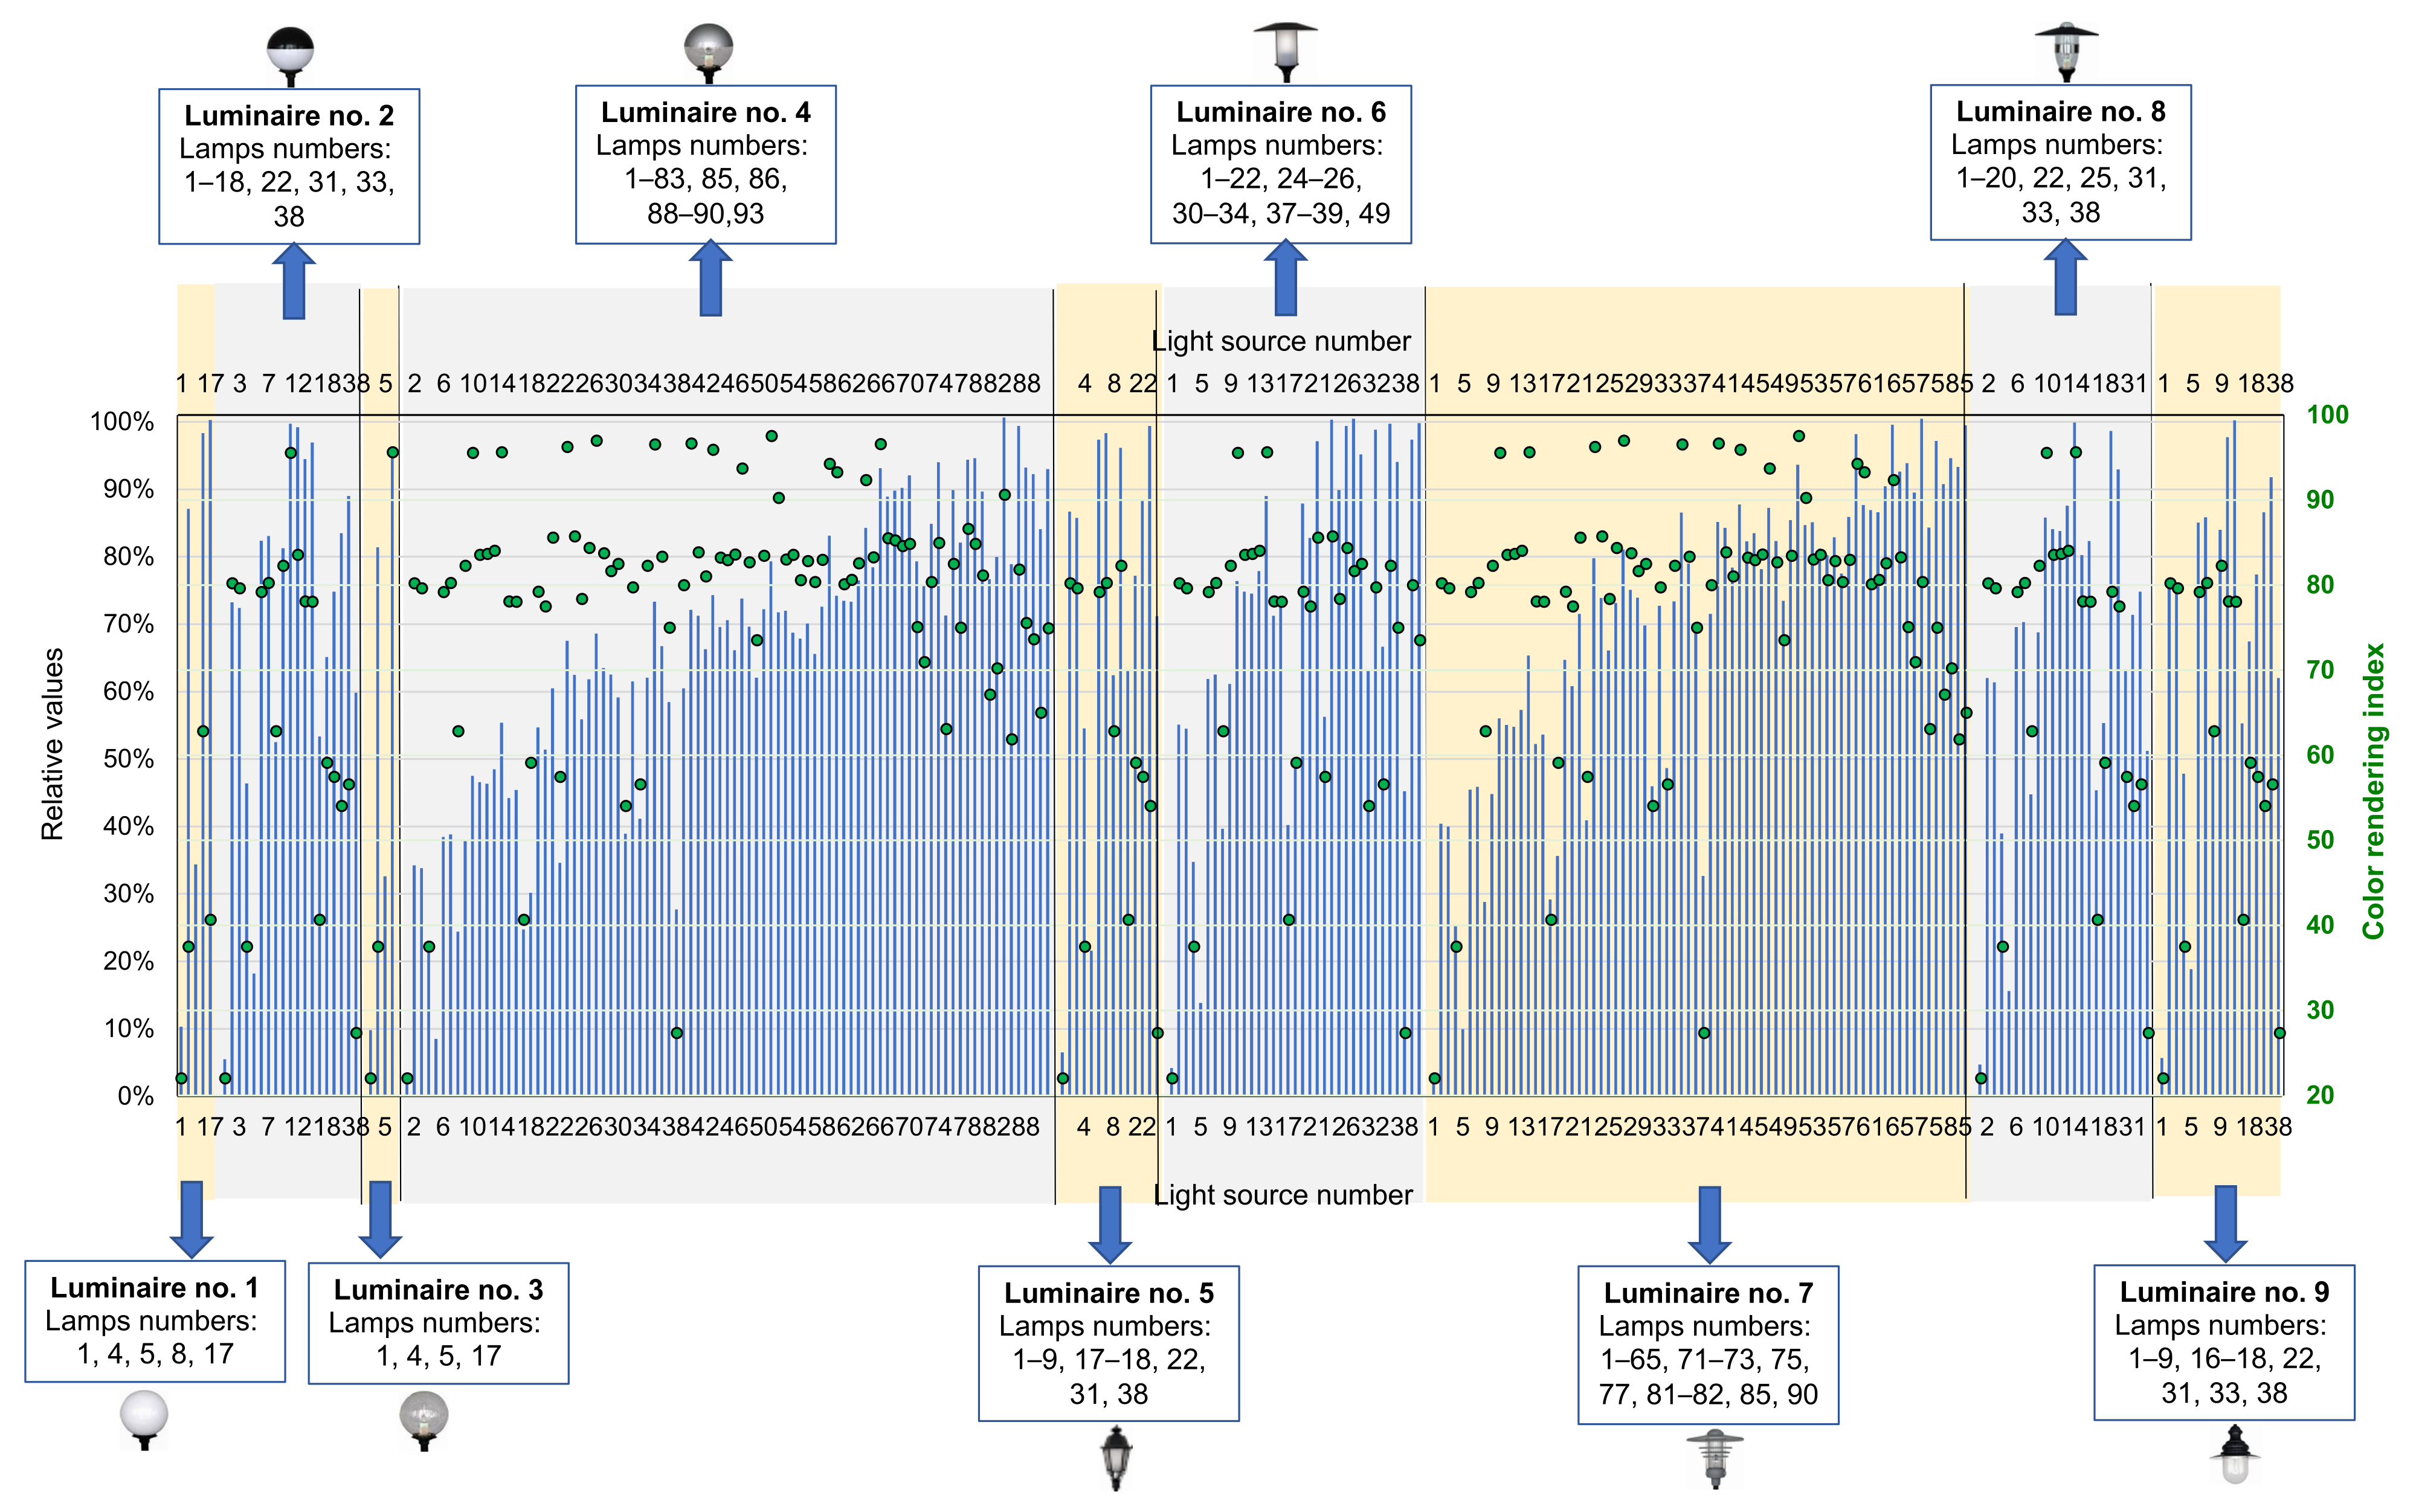
Figure 17 shows the calculated relative values of the influence on LP for all nine luminaires. The considerations include those LED lamps for which the LP value does not exceed 100.6%. The assumption of the value of 100.6% is a result of the fact that for luminaires 1, 4, 6, 7, and 9, the obtained LP values slightly exceed 100%. The horizontal axes of the graph show the numbers of LED sources, which were ranked according to the CCT value (from the lowest to the highest). Due to the large number of light sources analyzed, not all the lamps fit on the horizontal axes; therefore, the numbers of lamps cooperating with a specific luminaire are specified in additional explanations above and below the graph. In Figure 17, the vertical axis on the left (identical to Figure 16) represents the relative values of LP, while the vertical axis on the right represents the CRI values.
Analyzing the data obtained, a certain correlation can be seen between the LP values and the CRI values. By using light sources with lower CRI values, it is possible to reduce the impact on LP. In turn, when installing in the luminaire the LED source marked as 1 (CCT = 1000 K, CRI = 22) instead of the HPS 2 lamp, the obtained value of the influence on LP will be nearly 10 times lower.
In the case of the opal sphere-type luminaire only in the case of four LED lamps (among the 156 LED lamps considered in the studies), the effect on LP will be lower than with the HPS 2 lamp installed. After replacing the sodium lamp with LED no. 17 (CCT = 2380 K, CRI = 41), the impact on LP will be 100.3%.
In the case of luminaire no. 2 (covered by a half with black coating), the lower influence on LP may be reached in the case of 19 LED sources.
The least optimistic results were obtained in the case of the luminaire with a transparent spherical cover (luminaire no. 3). Only in four LED sources was a limitation of LP observed.
The advantages were noticed for luminaire no. 4. For as many as 88 LED sources, a lower impact than in the case of the HPS 2 lamp was achieved when installing them in the opal sphere-type luminaire. Only in the case of LED no. 83 did the LP value slightly exceed 100% (LP = 100.6%). It is also worth noting that in the case of luminaire no. 4, installing an LED source with CCT above 4000 K will not increase LP above 100.6%. For example, in the case of LED no. 93 (CCT = 4786 K, CRI = 75), the impact on LP will be 93.0%.
In the case of luminaire no. 5, only 14 LED sources allowed a lower influence on LP to be obtained. On this occasion, it is also worth noting that the CCT value of the LED sources installed in luminaire no. 5 should be lower than 3000 K. With a very high CRI value for outdoor lighting (CRI ≥ 80), the CCT value should not exceed 2000 K, which was, however, obtained in the case of LED no. 9 (CCT = 1988 K, CRI = 82). However, by installing a light source with a lower CRI value, it is possible to increase the CCT above 2000 K. This was shown in the case of LED no. 38 (CCT = 2884 K, CRI = 27).
In luminaire no. 6, LP values below 100.6% were obtained for 35 LED sources; however, in the case of luminaire no. 7, the number of sources with such results was 74. In the case of the last two luminaires (no. 8 and no. 9), this took place for 38 LED sources. The data presented in Figure 17 clearly indicate that using the CCT value as a criterion for selecting light sources in order to limit the impact on sky glow is insufficient. In order to draw attention to this problem, an additional set of data is quoted in Table 7.
This table shows a number of LED sources for individual luminaires (along with the parameters of CCT and CRI), for which the LP influence is similar and is equal to 141% ± 1%. The adopted value of 141% results from the calculations obtained for the LED source with the highest color temperature, installed in luminaire no. 4 (this luminaire emits in a lower range the luminous flux in the upper half-space). From the data presented, one can notice a huge dispersion of the CCT values of lamps from 1988 K in the case of luminaire no. 3 to 9753 K in the case of luminaire no. 4.
In order to emphasize the relationship between the effect on LP and the CRI value, several pairs of LED sources were taken into account, for which the differences between the correlated color temperature are insignificant (not exceeding 20 K), while the difference in CRI exceeds 10. Obviously, the ideal case would be the situation in which one could compare lamps with different CRI values but with the same CCT value. Unfortunately, among the 156 LED sources included in the considerations, such a situation did not occur.
For the nine luminaires analyzed, the difference in the effect on light pollution (ΔLP) was calculated. The LP values obtained for luminaires with light sources with a higher CRI value were subtracted from the LP values obtained with lamps with lower CRI values. The results of the calculations are presented in Figure 18. Additionally, the same figure shows the UFF values (calculated in Table 5).
The curve “(1)” in Figure 18 represents the values of ΔLP for the LEDs marked as 18 and 17. They are characterized by parameters, such as CCT = 2384 K, CRI = 59 (light source no. 18), and CCT = 2380 K CRI = 41 (light source no. 17). When light source no. 18 (with a higher CRI) is replaced by light source no. 17 (with a lower CRI), the effect on LP is less than a few percent to slightly above 20% (depending on the luminaire). Exemplary for luminaire no. 1, the effect on LP will be lower by 22.0%, while in the case of luminaire no. 4, it is only 5.4%.
When the differences in CRI values are greater, then the effect on LP can be minimized more. This is the case of LED sources 39 and 38 (curve “(3)”) in Figure 18. The parameters of the light sources are as follows: CCT = 2904 K, CRI = 80 (light source no. 39) and CCT = 2884 K, and CRI = 27 (light source no. 38). In such a case, using LED source no. 38 in the opal sphere-type luminaire (luminaire no. 1), the effect on LP can be reduced by as much as 129.8%, while in the case of luminaire no. 4, by 32.8%. On this occasion, it should also be noted that the scale of limiting the effect on LP (apart from the CRI value) is also significantly influenced by the amount of light emitted by the luminaire into the upper half-space (represented by the UFF index).
The possibility of limiting the effect on LP can also be seen in the case of light sources with higher CCT. An example of this is the curve “(4)” in Figure 18. In this case, LED sources no. 138 (CCT = 7159 K, CRI = 87) and 139 (CCT = 7160 K, CRI = 67) were taken into account.

4. Conclusions

The following conclusions are formed on the basis of the measurements and calculations performed:
  • The continuous development of LED technology means that in the near future, LEDs will become the basic light source used in outdoor lighting. Within the current state of the art, the luminous efficacy of LED sources is higher than that of discharge lamps, which was confirmed by the results presented in this paper. Hence, it should be expected that sodium lamps, popular in outdoor lighting, will be completely withdrawn from use. Currently, we can observe the construction of LED sources that are adapted for installation in existing luminaires, originally intended to work with discharge lamps. The answer to the question of whether this solution is optimal is not easily identified. According to the author, better results can be obtained by using luminaires made with LED technology. However, a solution often used in practice, based on replacing the light source in the luminaire, allows minimization of the costs associated with the replacement of the luminaire itself. The performed calculations were an attempt to simulate real scenarios taking into account Rayleigh scattering. Due to the multifaceted nature of the issue, it cannot be considered as being finished.
  • When carrying out modernization of external lighting, which is based on replacing only the light source, one should take into account that the light distribution method is also changed. A consequence of this may be an increase or decrease in the individual parameters of the luminaire (Table 5). From the point of view of the influence on LP, an important parameter is UFF. For example, replacing the popular HPS 2 sodium lamp with an LED source in luminaire no. 7 will reduce the UFF parameter value by 3.8%. However, the same treatment for luminaire 9 will cause an increase of UFF by 18%. The replacement of the light source may also result in no change of the UFF value, as exemplified by luminaire no. 5.
  • Replacing classical sodium lamps with LED sources in outdoor lighting, with a wide range of LED technologies, does not have to lead to an increase in the glow of the night sky. Moreover, the obtained results of the calculations indicate the possibility of limiting the influence on sky glow. An example of such a solution is LED no. 1 (CCT = 1000 K, CRI = 22), which can successfully replace LPS. In the case of high-pressure sodium lamps, LED no. 4 (CRI = 37) is an alternative. The given examples show that limiting the impact on LP does not have to cause a decrease of CRI. The CRI values of the LED sources are higher or comparable to CRI of the distinctive sodium lamps.
  • When assessing the effect of the light source on LP, operating solely with the CCT parameter is insufficient. The photometric solid of the luminaire plays an important role. A similar effect on LP can be obtained by installing light sources with significantly different CCT values (over 7700 K) in different luminaires. An example illustrating extreme situations is the luminaires with a spherical lampshade (luminaires no. 3 and 4). The impact on LP will be similar if luminaire no. 3 cooperates with LED no. 9 (CCT = 1988 K), and luminaire no. 4 with LED no. 156 (CCT = 9753 K). Based on the obtained results, a general statement can be made that the more luminous flux a park luminaire sends to the lower half-space, the higher the CCT value of the lamp. Obviously, the reflective properties of the substrate are also important.
  • When installing a light source in a luminaire, the CRI and CCT values are known (measured or declared by the manufacturer). It is worth emphasizing that due to the change in the spectral distribution of the optical elements installed in the luminaire, these parameters may differ. Based on the measurements and calculations carried out in relation to nine park luminaires in this study, for LED sources with a CCT value that does not exceed 4000 K, the difference between CCT of the lamp radiation and CCT of the luminaire radiation will not exceed 100 K. When installing lamps with higher CCT values (above 4000 K), one must take into account larger differences in the color of light. In an extreme case (for LED source no. 156 installed in luminaire no. 1), this difference may even exceed 1000 K. Changes in the CRI value of the lamp by the optical elements of the luminaire do not exceed +/−1, which allows the conclusion that they can be ignored in practical considerations.
  • The obtained results of the calculations also allowed us to see a certain relationship between the CRI value and the influence on LP. By using light sources with similar CCT values and lower CRI values, the impact on LP can be reduced. The lower the CRI value of the light source installed in the luminaire, the more the effect on the LP can be reduced. The greatest results in the reduction of the impact on LP with the use of light sources with low CRI values were obtained in the case of luminaires for which UFF has the highest values.
  • In the case of lighting of green areas, the use of light sources with low CRI values will result in loss of their natural appearance. Therefore, light sources with higher CRI values are preferred. In such a case, a compromise between the aesthetic values and the influence on LP seems to be necessary. The use of light sources with low CRI values may be of key importance in the case of luminaires located, e.g., near an astronomical observatory.

Funding

This research received no external funding.

Institutional Review Board Statement

Not applicable.

Informed Consent Statement

Not applicable.

Data Availability Statement

The data presented in this study are available on request from the corresponding author. The data are not publicly available due to the policy of research projects.

Conflicts of Interest

The author declares no conflict of interest.

References

  1. Gaston, K.J.; Gaston, S.; Bennie, J.; Hopkins, J. Benefits and costs of artificial nighttime lighting of the environment. Environ. Rev. 2015, 23, 14–23. [Google Scholar] [CrossRef] [Green Version]
  2. Boyce, P.R.; Eklund, N.H.; Hamilton, B.J.; Bruno, L.D. Perceptions of safety at night in different lighting conditions. Light. Res. Technol. 2000, 32, 79–91. [Google Scholar] [CrossRef]
  3. Haans, A.; De Kort, Y.A.W. Light distribution in dynamic street lighting: Two experimental studies on its effects on perceived safety, prospect, concealment, and escape. J. Environ. Psychol. 2012, 32, 342–352. [Google Scholar] [CrossRef]
  4. Lorenc, T.; Petticrew, M.; Whitehead, M.; Neary, D.; Clayton, S.; Wright, K.; Thomson, H.; Cummins, S.; Sowden, A.; Renton, A. Fear of crime and the environment: Systematic review of UK qualitative evidence. BMC Public Health 2013, 13, 496. [Google Scholar] [CrossRef] [Green Version]
  5. Uttley, J.; Cheal, C.; Fotios, S. Effect of illuminance and spectrum on peripheral obstacle detection by pedestrians. Light. Res. Technol. 2016, 49, 211–227. [Google Scholar] [CrossRef] [Green Version]
  6. Lobão, J.; Devezas, T.; Catalão, J. Energy efficiency of lighting installations: Software application and experimental validation. Energy Rep. 2015, 1, 110–115. [Google Scholar] [CrossRef] [Green Version]
  7. Carli, R.; Dotoli, M. A Dynamic programming approach for the decentralized control of energy retrofit in large-scale street lighting systems. IEEE Trans. Autom. Sci. Eng. 2020, 17, 1140–1157. [Google Scholar] [CrossRef]
  8. Carli, R.; Dotoli, M.; Pellegrino, R. A decision-making tool for energy efficiency optimization of street lighting. Comput. Oper. Res. 2018, 96, 223–235. [Google Scholar] [CrossRef]
  9. Beccali, M.; Bonomolo, M.; Lo Brano, V.; Ciulla, G.; Di Dio, V.; Massaro, F.; Favuzza, S. Energy saving and user satisfaction for a new advanced public lighting system. Energy Convers. Manag. 2019, 195, 943–957. [Google Scholar] [CrossRef]
  10. Kyba, C.C.M.; Kuester, T.; De Miguel, A.S.; Baugh, K.; Jechow, A.; Hölker, F.; Bennie, J.; Elvidge, C.D.; Gaston, K.J.; Guanter, L. Artificially lit surface of Earth at night increasing in radiance and extent. Sci. Adv. 2017, 3, e1701528. [Google Scholar] [CrossRef] [Green Version]
  11. Commission Regulation (EC) No 245/2009 of 18 March 2009 Implementing Directive 2005/32/EC of the European Parliament and of the Council with Regard to Ecodesign Requirements for Fluorescent Lamps without Integrated ballast, for High Intensity Discharge Lamps, and for Ballasts and Luminaires able to Operate such Lamps, and Repealing Directive 2000/55/EC of the European Parliament and of the Council; European Union: Bruxelles, Belgium, 2009.
  12. Pimputkar, S.; Speck, J.S.; Denbaars, S.; Nakamura, S. Prospects for LED lighting. Nat. Photonics 2009, 3, 180–182. [Google Scholar] [CrossRef]
  13. Baran, K.; Różowicz, A.; Wachta, H.; Różowicz, S. Modeling of selected lighting parameters of LED panel. Energies 2020, 13, 3583. [Google Scholar] [CrossRef]
  14. Djuretic, A.; Kostic, M. Actual energy savings when replacing high-pressure sodium with LED luminaires in street lighting. Energy 2018, 157, 367–378. [Google Scholar] [CrossRef]
  15. Jiang, Y.; Li, S.; Guan, B.; Zhao, G.; Boruff, D.; Garg, L.; Patel, P. Field evaluation of selected light sources for roadway lighting. J. Traffic Transp. Eng. 2018, 5, 372–385. [Google Scholar] [CrossRef]
  16. Yadlapalli, R.T.; Narasipuram, R.P.; Kotapati, A. An overview of energy efficient solid state LED driver topologies. Int. J. Energy Res. 2020, 44, 612–630. [Google Scholar] [CrossRef]
  17. De Almeida, A.; Santos, B.; Paolo, B.; Quicheron, M. Solid state lighting review—Potential and challenges in Europe. Renew. Sustain. Energy Rev. 2014, 34, 30–48. [Google Scholar] [CrossRef]
  18. Molina-Moreno, V.; Utrilla, P.N.-C.; Cortés-García, F.J.; Peña-García, A. The use of led technology and biomass to power public lighting in a local context: The Case of Baeza (Spain). Energies 2018, 11, 1783. [Google Scholar] [CrossRef] [Green Version]
  19. Li, Z.; Jia, P.; Zhao, F.; Kang, Y. The development path of the lighting industry in mainland China: Execution of energy conservation and management on mercury emission. Int. J. Environ. Res. Public Health 2018, 15, 2883. [Google Scholar] [CrossRef] [PubMed] [Green Version]
  20. Rodriges, C.R.B.S.; Almeida, P.S.; Soares, G.M.; Jorge, J.M.; Pinto, D.P.; Braga, H.A.C. An experimental comparison between different technologies arising for public lighting: LED luminaires replacing high pressure sodium lamps. In Proceedings of the 20th IEEE International Symposium on Industrial Electronics (ISIE), Gdansk, Poland, 27–30 June 2011; pp. 141–146. [Google Scholar]
  21. Galvez, E.N.-D.; Gago-Calderon, A.; Garcia-Ceballos, L.; Contreras-Lopez, M.; Andres-Diaz, J. Adjustment of lighting parameters from photopic to mesopic values in outdoor lighting installations strategy and associated evaluation of variation in energy needs. Sustainability 2020, 13, 4089. [Google Scholar] [CrossRef]
  22. Czaja, M.; Kołton, A.; Muras, P. The complex issue of urban trees—Stress factor accumulation and ecological service possibilities. Forests 2020, 11, 932. [Google Scholar] [CrossRef]
  23. Jin, P.; Wang, Y.-F.; Zhou, Q.-F.; Rooymans, J.; Yu, C.-Y. Luminous efficacy of white LED in the mesopic vision state. Optoelectron. Lett. 2009, 5, 265–267. [Google Scholar] [CrossRef]
  24. Falchi, F.; Furgoni, R.; Gallaway, T.; Rybnikova, N.; Portnov, B.; Baugh, K.; Cinzano, P.; Elvidge, C. Light pollution in USA and Europe: The good, the bad and the ugly. J. Environ. Manag. 2019, 248, 109227. [Google Scholar] [CrossRef]
  25. Stone, T. Light pollution: A case study in framing an environmental problem. Ethic-Policy Environ. 2017, 20, 279–293. [Google Scholar] [CrossRef] [Green Version]
  26. Peregrym, M.; Vasyliuk, O.; Kónya, E.P. Artificial Light at night as a new threat for nature conservation in Ukraine. Vestn. Zool. 2019, 53, 459–470. [Google Scholar] [CrossRef] [Green Version]
  27. Schulte-Römer, N.; Dannemann, E.; Meier, J. Light Pollution–A Global Discussion. Available online: http://www.lightpollutiondiscussion.net/ (accessed on 21 June 2021).
  28. Ściężor, T. (Ed.) Ecological and Astronomical Aspects of Light Pollution; Cracow University of Technology: Kraków, Poland, 2021. [Google Scholar]
  29. Schulte-Römer, N.; Meier, J.; Dannemann, E.; Söding, M. Lighting professionals versus light pollution experts? Investigating views on an emerging environmental concern. Sustainability 2019, 11, 1696. [Google Scholar] [CrossRef] [Green Version]
  30. Pracki, P.; Skarżyński, K. A multi-criteria assessment procedure for outdoor lighting at the design stage. Sustainability 2020, 12, 1330. [Google Scholar] [CrossRef] [Green Version]
  31. Żagan, W.; Skarżyński, K. The “layered method”–A third method of floodlighting. Light. Res. Technol. 2020, 52, 641–653. [Google Scholar] [CrossRef]
  32. Peña-García, A.; Sędziwy, A. Optimizing lighting of rural roads and protected areas with white light: A compromise among light pollution, energy savings, and visibility. LEUKOS 2020, 16, 147–156. [Google Scholar] [CrossRef]
  33. Tabaka, P.; Rozga, P. Influence of a light source installed in a luminaire of opal sphere type on the effect of light pollution. Energies 2020, 13, 306. [Google Scholar] [CrossRef] [Green Version]
  34. Czech Manufacturer of Luminaire. Luminaire: PARK LED. Available online: https://www.modus.cz/vysledky-vyhledavani/?search=PARK+LED (accessed on 21 June 2021).
  35. Northcliffe. Manufacturer of Luminaire. Sphere LED. Available online: https://northcliffe.org/en/525-sphere-led (accessed on 21 June 2021).
  36. Gemma Lighting. UK Manufactured Exterior LED Lighting Solutions. Albion 30W-LED Globe Light. Available online: https://www.gemmalighting.com/products/led-amenity-lighting/500mm-Globe-LED-Light-Opal-76mm-Albion-30W/ (accessed on 21 June 2021).
  37. Lumax. Product Catalog 2019/2020. Available online: http://lumax.pl/katalogi/Katalog---Lumax---2019-2020(1).pdf (accessed on 21 June 2021).
  38. Philips Lighting products. TrueForce Core LED Lamps for Public Lighting (Urban Space/Public Road-HPL/SON). Available online: https://www.lighting.philips.ch/fr/prof/lampes-et-tubes-led/remplacement-des-lampes-a-decharge/lampes-led-trueforce-core-pour-eclairage-public-espace-urbain-voie-publique-hpl-son/929001925302_EU/product (accessed on 21 June 2021).
  39. Helios Bulb Factory. Intensive LED Lamp with Increased Power. Available online: http://www.helios.katowice.pl/pl/produkt/536-lampa-led-o-podwyzszonej-mocy-intensive (accessed on 21 June 2021).
  40. Robles, J.; Zamorano, J.; Pascual, S.; de Miguel, A.S.; Gallego, J.; Gaston, K. Evolution of brightness and color of the night sky in Madrid. Remote Sens. 2021, 13, 1511. [Google Scholar] [CrossRef]
  41. Kyba, C.C.M. Is light pollution getting better or worse? Nat. Astron. 2018, 2, 267–269. [Google Scholar] [CrossRef]
  42. Strutt, J.W. On the transmission of light through an atmosphere containing many small particles in suspension, and on the origin of the blue of the sky. Philos. Mag. 1899, 47, 375–384. [Google Scholar]
  43. Sakurada, Y.; Nakamura, T. Demonstration of the light scattering phenomenon in the atmosphere. In Proceedings of the Seventh International Conference on Education and Training in Optics and Photonics, Singapore, 26–30 November 2001; Volume 4588, pp. 490–498. [Google Scholar]
  44. Jägerbrand, A.K. New Framework of Sustainable Indicators for Outdoor LED (Light Emitting Diodes) Lighting and SSL (Solid State Lighting). Sustainabilty 2015, 7, 1028–1063. [Google Scholar] [CrossRef] [Green Version]
  45. Falchi, F.; Cinzano, P.; Elvidge, C.D.; Keith, D.M.; Haim, A. Limiting the impact of light pollution on human health, environment and stellar visibility. J. Environ. Manag. 2011, 92, 2714–2722. [Google Scholar] [CrossRef]
  46. Schulte-Römer, N.; Meier, J.; Söding, M.; Dannemann, E. The LED paradox: How light pollution challenges experts to reconsider sustainable lighting. Sustainability 2019, 11, 6160. [Google Scholar] [CrossRef] [Green Version]
  47. Ściężor, T. Effect of street lighting on the urban and rural night-time radiance and the brightness of the night sky. Remote Sens. 2021, 13, 1654. [Google Scholar] [CrossRef]
  48. Kyba, C.C.M.; Kuester, T.; Kuechly, H. Changes in outdoor lighting in Germany from 2012–2016. Int. J. Sustain. Light. 2017, 19, 112. [Google Scholar] [CrossRef]
  49. Brelsford, C.; Robson, T.M. Blue light advances bud burst in branches of three deciduous tree species under short-day conditions. Trees 2018, 32, 1157–1164. [Google Scholar] [CrossRef]
  50. Brelsford, C.; Nybakken, L.; Kotilainen, T.; Robson, T.M. The influence of spectral composition on spring and autumn phenology in trees. Tree Physiol. 2019, 39, 925–950. [Google Scholar] [CrossRef]
  51. Kerbiriou, C.; Barré, K.; Mariton, L.; Pauwels, J.; Zissis, G.; Robert, A.; Le Viol, I. Switching LPS to LED streetlight May dra-matically reduce activity and foraging of bat. Diversity 2020, 12, 165. [Google Scholar] [CrossRef]
  52. Luginbuhl, C.B.; Boley, P.; Davis, D.R. The impact of light source spectral power distribution on sky glow. J. Quant. Spectrosc. Radiat. Transf. 2014, 139, 21–26. [Google Scholar] [CrossRef] [Green Version]
  53. Falchi, F.; Cinzano, P.; Duriscoe, D.; Kyba, C.C.; Elvidge, C.D.; Baugh, K.; Portnov, B.A.; Rybnikova, N.A.; Furgoni, R. The new world atlas of artificial night sky brightness. Sci. Adv. 2016, 2, e1600377. [Google Scholar] [CrossRef] [PubMed] [Green Version]
  54. Tabaka, P.; Fryc, I. Landscape lighting as a source of light pollution—The effect of the seasons on this phenomenon. In Proceedings of the IEEE Lighting Conference of the Visegrad Countries (Lumen V4), Karpacz, Poland, 13–16 September 2016. [Google Scholar]
  55. Fryc, I.; Bisegna, F.; Tabaka, P. Lighting of recreation grounds as a source of sky glow—The influence of luminaire type on this phenomenon. In Proceedings of the Environment and Electrical Engineering and 2017 IEEE Industrial and Commercial Power Systems Europe (EEEIC/I&CPS Europe), Milan, Italy, 6–9 June 2017; pp. 1–4. [Google Scholar]
  56. Tabaka, P.; Fryc, I. The impact of ground reflectance on relative values of light pollution created by outdoor lamp. Pol. J. Sustain. Dev. 2017, 27, 137–144. (In Polish) [Google Scholar] [CrossRef]
  57. Gutierrez-Escolar, A.; Castillo-Martinez, A.; Gomez-Pulido, J.M.; Gutierrez-Martinez, J.-M.; Stapic, Z.; Medina-Merodio, J.-A.A. Study to improve the quality of street lighting in Spain. Energies 2016, 8, 976–994. [Google Scholar] [CrossRef] [Green Version]
  58. Technical Raport CIE 70:1987: The Measurement of Absolute Luminous Intensity Distributions, Photocopy ed.; CIE: Vienna, Austria, 2008.
  59. Light and Lighting—Measurement and Presentation of Photometric Data of Lamps and Luminaires—Part 1: Measurement and File Format; CEN—EN 13032-1; CEN: Brussel, Belgium, 2004.
  60. Sammarco, J.J. A luminaire comparison method. In Proceedings of the 2020 IEEE Industry Applications Society Annual Meeting, Detroit, MI, USA, 10–16 October 2020; pp. 1–6. [Google Scholar]
  61. Brons, J.; Bullough, J.D.; Rea, M. Outdoor site-lighting performance: A comprehensive and quantitative framework for assessing light pollution. Light. Res. Technol. 2008, 40, 201–204. [Google Scholar] [CrossRef]
  62. LSPDD: Lamp Spectral Power Distribution Database. Available online: http://ww.lspdd.com/app/fr/lamps?lampcat=LED (accessed on 30 April 2021).
  63. Tabaka, P.; Rozga, P. Assessment of methods of marking LED sources with the power of equivalent light bulb. Bull. Pol. Acad. Sci. Tech. Sci. 2017, 65, 883–890. [Google Scholar] [CrossRef] [Green Version]
  64. Tabaka, P.; Rozga, P. Analysis of selected parameters of compact fluorescent lamps during their long-term operation. Metrol. Meas. Syst. 2020, 27, 554–557. [Google Scholar]
  65. Zalesińska, M.; Zabłocka, J.; Pawlak, A. Evaluation of the durability of selected LED lamps. Sci. J. Marit. Univ. Szczecin. 2020, 61, 23–28. [Google Scholar]
  66. Coureaux, I.M.; Manzano, E. The energy impact of luminaire depreciation on urban lighting. Energy Sustain. Dev. 2013, 17, 357–362. [Google Scholar] [CrossRef]
  67. Tabaka, P.; Rozga, P. The light color quality of LEDs operating at winter temperatures. Photonics Lett. Pol. 2019, 11, 112–114. [Google Scholar] [CrossRef]
  68. Kowalska, J. Ambiguity and limitations in determining the quality of the color rendering of light sources by index Ra (CIE CRI). Prz. Elektrotechniczny 2017, 5, 74–78. [Google Scholar]
  69. Kowalska, J. Analysis of parameters describing the quality of the color rendering of light sources according to the IES TM-30-15 and the CIE 013.3-1995. Prz. Elektrotechniczny 2017, 6, 50–54. [Google Scholar]
  70. CIE Division 2. Colorimetry—Part 2: Standard Illuminants for Colorimetry; Technical Report for Commission Internationale de l’Éclairage (CIE): Vienna, Austria, 2006. [Google Scholar]
  71. Acosta, I.; León, J.; Bustamante, P. Daylight spectrum index: A new metric to assess the affinity of light sources with day-lighting. Energies 2018, 11, 2545. [Google Scholar] [CrossRef] [Green Version]
  72. Royer, M.P. Comparing measures of average color fidelity. LEUKOS 2018, 14, 69–85. [Google Scholar] [CrossRef]
  73. European Standard EN 12464-1:2002 Light and Lighting—Lighting of Work Places—Part 1: Indoor Work Places; European Committee for Standardization: Brussel, Belgium, 2002.
  74. European Standard EN 12464-1:2011 Light and Lighting—Lighting of Work Places—Part 1: Indoor Work Places; European Committee for Standardization: Brussel, Belgium, 2011.
  75. European Standard EN 12464-2:2014 Light and Lighting—Lighting of Work Places—Part 2: Outdoor Work Places; European Committee for Standardization: Brussel, Belgium, 2014.
  76. Erdem, T.; Demir, H.V. Color science of nanocrystal quantum dots for lighting and displays. Nanophotonics 2013, 2, 57–81. [Google Scholar] [CrossRef] [Green Version]
  77. Ściężor, T.; Kubala, M.; Kaszowski, W. Light pollution of the mountain areas in Poland. Arch. Environ. Prot. 2012, 38, 59–69. [Google Scholar]
  78. Kubala, M.; Sciezor, T.; Dworak, T.Z.; Kaszowski, W. Artificial sky glow in Cracow agglomeration. Pol. J. Environ. Stud. 2009, 18, 194–199. [Google Scholar]
  79. Casagrande, C.; Nogueira, F.; Salmento, M.; Braga, H. Efficiency in street lighting projects by employing LED luminaires and mesopic photometry. IEEE Lat. Am. Trans. 2019, 17, 921–929. [Google Scholar] [CrossRef]
  80. Li, M.; Wu, P.; Ding, J.; Yao, Q.; Ju, J. The circadian effect versus mesopic vision effect in road lighting applications. Appl. Sci. 2020, 10, 6975. [Google Scholar] [CrossRef]
  81. Technical Raport CIE 191: Recommended System for Mesopic Photometry Based on Visual Performance; CIE: Vienna, Austria, 2010.
  82. Zan, L.; Lin, D.; Zhong, P.; He, G. Optimal spectra of white LED integrated with quantum dots for mesopic vision. Opt. Express 2016, 24, 7643–7653. [Google Scholar] [CrossRef] [PubMed]
  83. Xiao, L.; Zhang, C.; Zhong, P.; He, G. Spectral optimization of phosphor-coated white LED for road lighting based on the mesopic limited luminous efficacy and IES color fidelity index. Appl. Opt. 2018, 57, 931–936. [Google Scholar] [CrossRef] [PubMed]
  84. Gibbons, R.; Terry, T.; Bhagavathula, R.; Meyer, J.; Lewis, A. Applicability of mesopic factors to the driving task. Light. Res. Technol. 2015, 48, 70–82. [Google Scholar] [CrossRef]
  85. Fotios, S.; Gibbons, R. Road lighting research for drivers and pedestrians: The basis of luminance and illuminance recommen-dations. Light. Res. Technol. 2018, 50, 154–186. [Google Scholar] [CrossRef]
  86. Technical Raport CIE 115:2010: Lighting of Roads for Motor and Pedestrian Traffic; CIE: Vienna, Austria, 2010.
  87. Light and Lighting—Measurement and Presentation of Photometric Data of Lamps and Luminaires—Part 2: Presentation of Data for Indoor and Outdoor Work Places; CEN-EN 13032-2; CEN: Brussel, Belgium, 2017.
  88. Technical Raport CIE 126:1997: Guidelines for Minimizing Sky Glow; CIE: Vienna, Austria, 1997.
  89. Technical Raport CIE 150:2003: Guide on the Limitation of the Effects of Obtrusive Light from Outdoor Lighting Installations; CIE: Vienna, Austria, 2003.
  90. Technical Raport CIE 150:2019: Guide on the Limitation of the Effects of Obtrusive Light, 2nd ed.; CIE: Vienna, Austria, 2019.
  91. National Aeronautics and Space Administration (NASA). Jet Propulsion Laboratory. Spectral Library. Available online: https://speclib.jpl.nasa.gov/library (accessed on 20 February 2021).
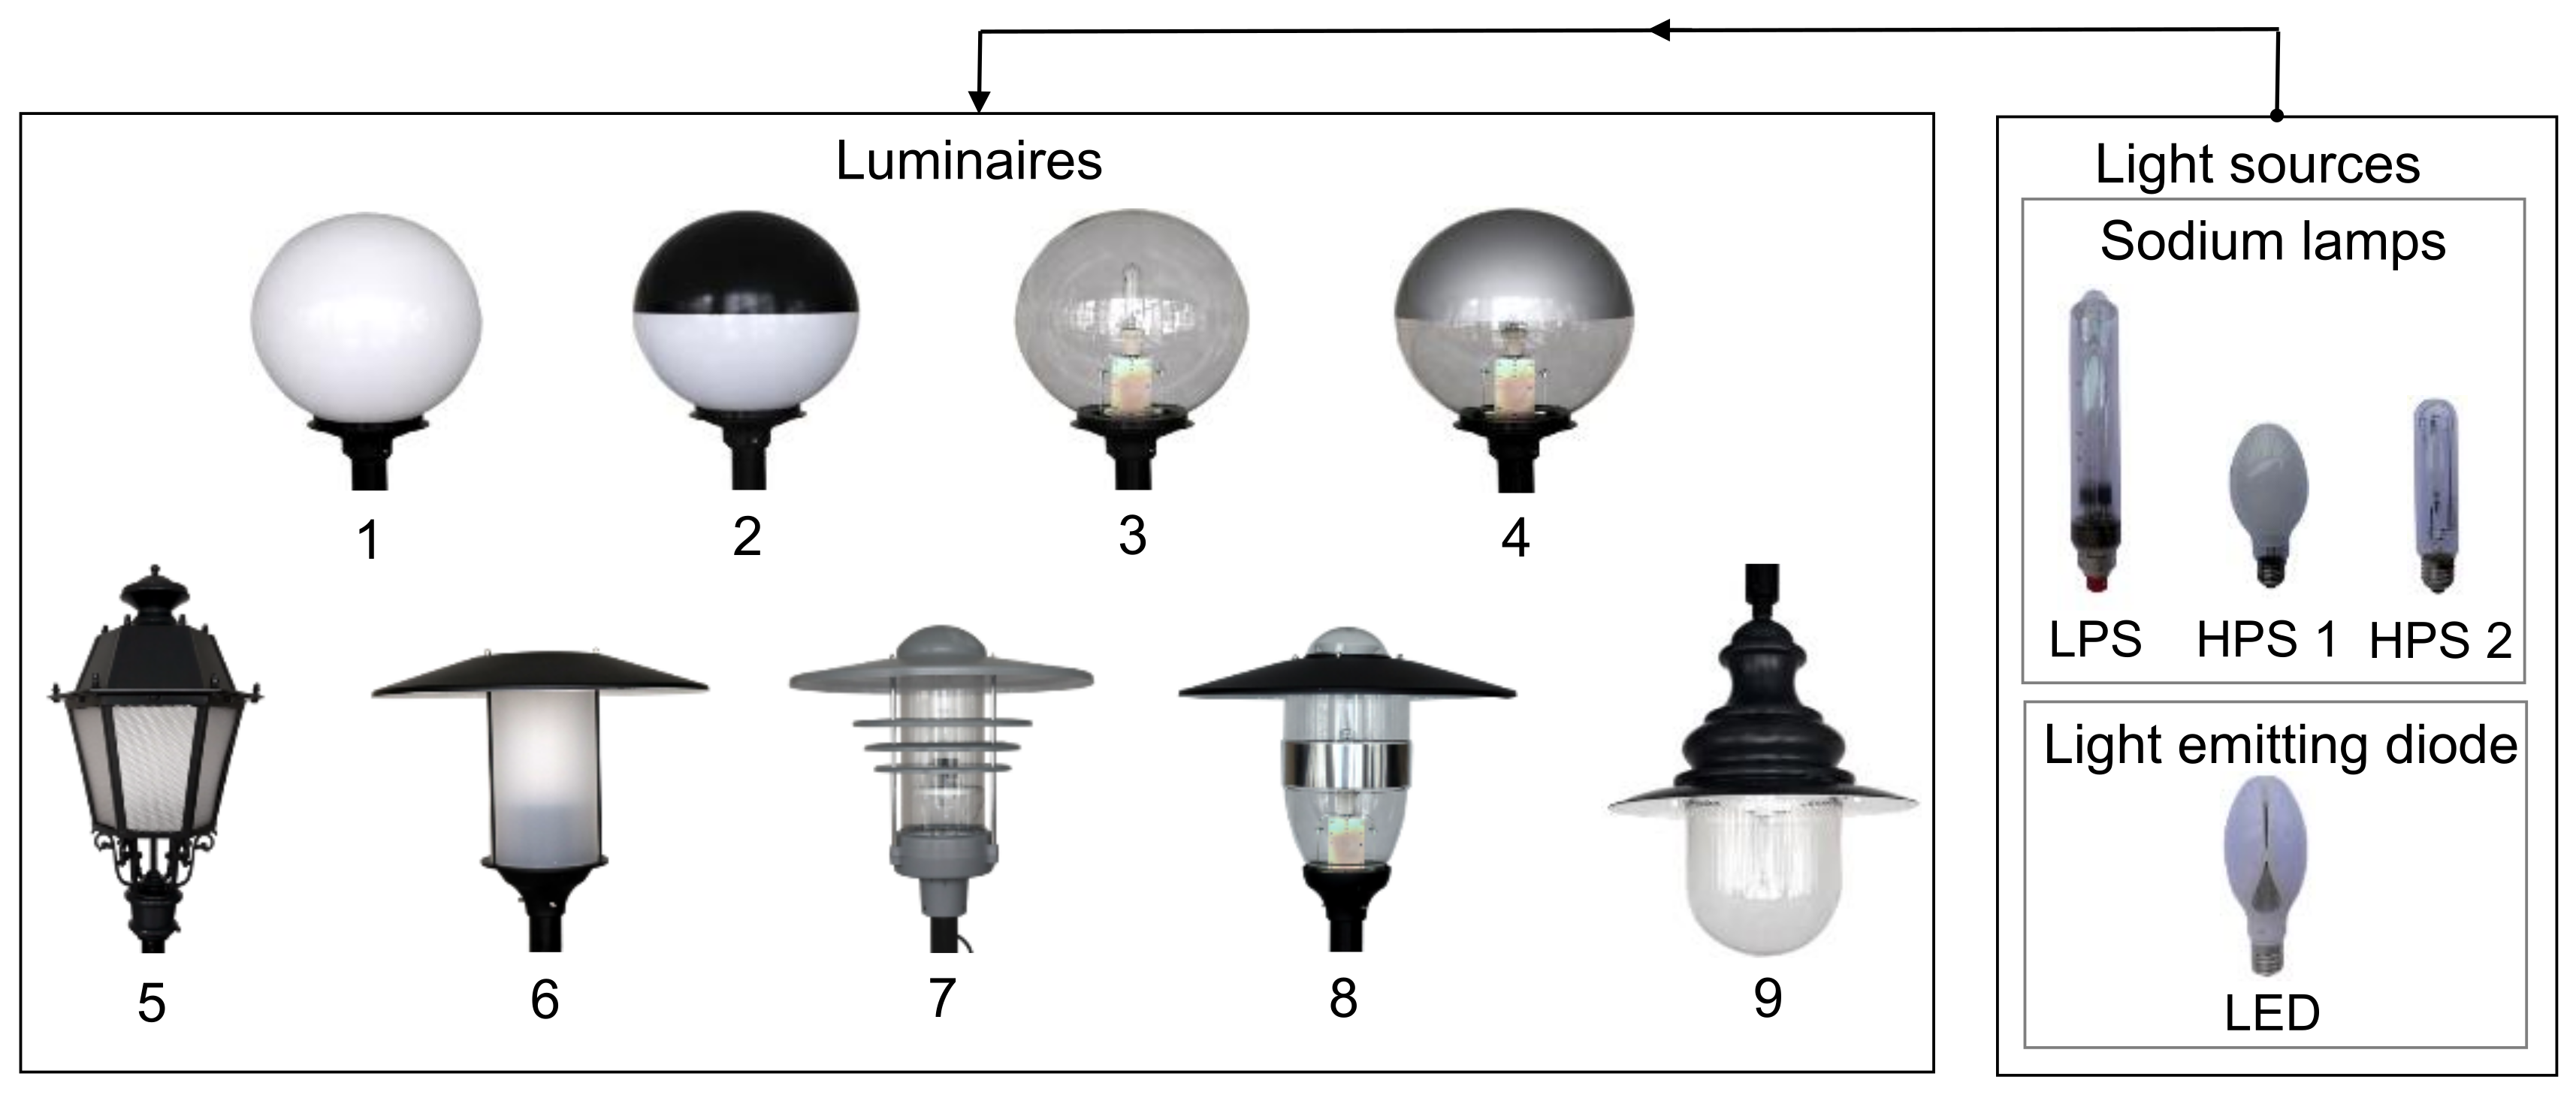
Figure 1. The photos of the luminaires considered together with the light sources analyzed.
Energies 14 06383 g001
Figure 2. Schematic representation of the research methodology.
Energies 14 06383 g002
Figure 3. The analyzed light sources installed in the tested luminaires: (a) photo of the light sources; (b) relative spectral distributions; (c) photometric solids; (d) light curves.
Energies 14 06383 g003
Figure 4. Relative spectra characteristics of LED sources with different closest color temperatures.
Energies 14 06383 g004
Figure 5. Graphical presentation of CCT and CRI for the 156 LED sources tested.
Energies 14 06383 g005
Figure 6. Curves of the luminous efficacy of monochromatic radiation as a function of the wavelength for photopic V(λ), mesopic Vmes(λ), and scotopic V’(λ) vision, along with an illustrative scheme of the conditions under which adaptation of the organ of vision to particular types of vision occurs.
Energies 14 06383 g006
Figure 7. Calculated values of the luminous efficacy of optical radiation (LER) for 3 sodium lamps and 156 LED sources with different values of the correlated color temperature for photopic vision, mesopic vision, and scotopic vision.
Energies 14 06383 g007
Figure 8. Calculated values of the luminous flux emitted into the upper and lower half-space by the luminaires cooperating with the various light sources analyzed.
Energies 14 06383 g008
Figure 9. Calculated values of the luminous efficacy related to the light sources and luminaires.
Energies 14 06383 g009
Figure 10. Spectral curves of the luminaires determined on the basis of measurements.
Energies 14 06383 g010
Figure 11. Graphical illustration of the CCT changes of the light sources by the luminaires.
Energies 14 06383 g011
Figure 12. Illustrative presentation of the factors affecting the calculations.
Energies 14 06383 g012
Figure 13. Relative influence on the effect of light pollution by the luminaires with different luminous flux.
Energies 14 06383 g013
Figure 14. Calculated relative values of luminous flux emitted in the lower and upper half-space by luminaires with identical luminous flux values cooperating with different light sources.
Energies 14 06383 g014
Figure 15. Relative influence on the effect of light pollution by luminaires with identical values of luminous flux and light sources that differ from each other by CCT value.
Energies 14 06383 g015
Figure 16. Graphical illustration of the impact on LP replacement of sodium lamps by LED sources with different CCT values, where the values of CCT and CRI shown in brackets concern the radiation emitted by the luminaire.
Energies 14 06383 g016
Figure 17. Set of LED sources for which the values of LP do not exceed 100.6%.
Energies 14 06383 g017
Figure 18. Graphical representation of the UFF factor of nine luminaires and the possibility of reducing the LP effect using the LED sources with similar CCT and different CRI values.
Energies 14 06383 g018
Table 1. Basic technical data of the light sources analyzed.
Light SourceSymbolPLS [W]Lamp Base [-]ΦLS [lm]CCT [K]CRI [-]ηLS [lm/W]Hg [mg]
low pressure sodium lampLPS35BY22d45501800-1300.0
high pressure sodium lamp with a matt ellipsoidal bulbHPS 170E2756001900≥208016.3
high pressure sodium lamp with a tubular bulbHPS 270E2766002000≥209412.2
light emitting diodeLED40E4045004100≥801130.0
Table 2. Selected parameters of the light sources tested.
Light Source SymbolPLSM [W]ΦLSM [lm]CCTM [K]CRIM [-]ηLSM [lm/W]
LPS3741341717−46112
HPS 186555418642065
HPS 286659121503477
LED394468411185115
Table 3. Graphical representation of the method of light distribution by the luminaires from 1 to 4.
Luminaire/
Light Source
No. 1
Energies 14 06383 i001
No. 2
Energies 14 06383 i002
No. 3
Energies 14 06383 i003
No. 4
Energies 14 06383 i004
LPS
Energies 14 06383 i005
Energies 14 06383 i006Energies 14 06383 i007Energies 14 06383 i008Energies 14 06383 i009
Energies 14 06383 i010Energies 14 06383 i011Energies 14 06383 i012Energies 14 06383 i013
HPS 1
Energies 14 06383 i014
Energies 14 06383 i015Energies 14 06383 i016Energies 14 06383 i017Energies 14 06383 i018
Energies 14 06383 i019Energies 14 06383 i020Energies 14 06383 i021Energies 14 06383 i022
HPS 2
Energies 14 06383 i023
Energies 14 06383 i024Energies 14 06383 i025Energies 14 06383 i026Energies 14 06383 i027
Energies 14 06383 i028Energies 14 06383 i029Energies 14 06383 i030Energies 14 06383 i031
LED
Energies 14 06383 i032
Energies 14 06383 i033Energies 14 06383 i034Energies 14 06383 i035Energies 14 06383 i036
Energies 14 06383 i037Energies 14 06383 i038Energies 14 06383 i039Energies 14 06383 i040
Table 4. Graphical representation of the method of light distribution by luminaires 5 to 9.
Luminaire/
Light Source
No. 5
Energies 14 06383 i041
No. 6
Energies 14 06383 i042
No. 7
Energies 14 06383 i043
No. 8
Energies 14 06383 i044
No. 9
Energies 14 06383 i045
LPS
Energies 14 06383 i046
Energies 14 06383 i047Energies 14 06383 i048Energies 14 06383 i049Energies 14 06383 i050Energies 14 06383 i051
Energies 14 06383 i052Energies 14 06383 i053Energies 14 06383 i054Energies 14 06383 i055Energies 14 06383 i056
HPS 1
Energies 14 06383 i057
Energies 14 06383 i058Energies 14 06383 i059Energies 14 06383 i060Energies 14 06383 i061Energies 14 06383 i062
Energies 14 06383 i063Energies 14 06383 i064Energies 14 06383 i065Energies 14 06383 i066Energies 14 06383 i067
HPS 2
Energies 14 06383 i068
Energies 14 06383 i069Energies 14 06383 i070Energies 14 06383 i071Energies 14 06383 i072Energies 14 06383 i073
Energies 14 06383 i074Energies 14 06383 i075Energies 14 06383 i076Energies 14 06383 i077Energies 14 06383 i078
LED
Energies 14 06383 i079
Energies 14 06383 i080Energies 14 06383 i081Energies 14 06383 i082Energies 14 06383 i083Energies 14 06383 i084
Energies 14 06383 i085Energies 14 06383 i086Energies 14 06383 i087Energies 14 06383 i088Energies 14 06383 i089
Table 5. Parameters of the luminaires considered to cooperate with the sodium lamp and LED calculated on the basis of the measured photometric solids.
LuminaireLight SourceDFF
%
UFF (ULR)
%
ULOR
%
DLOR
%
LOR
%
Trapped Light
%
No. 1
Energies 14 06383 i090
LPS47.053.044.939.884.715.3
HPS 143.656.448.737.786.413.6
HPS 243.656.445.535.180.619.4
LED40.459.649.733.783.416.6
No. 2
Energies 14 06383 i091
LPS72.827.28.021.329.370.7
HPS 171.528.59.323.432.767.3
HPS 271.628.48.521.630.169.9
LED72.627.47.619.627.272.8
No. 3
Energies 14 06383 i092
LPS49.450.648.347.195.44.6
HPS 146.753.348.642.691.28.8
HPS 248.451.648.545.594.06.0
LED43.156.954.541.395.84.2
No. 4
Energies 14 06383 i093
LPS96.83.21.546.347.852.2
HPS 197.03.01.549.350.849.2
HPS 297.22.81.345.546.853.2
LED96.63.41.747.949.650.4
No. 5
Energies 14 06383 i094
LPS69.330.719.243.362.537.5
HPS 168.831.218.240.258.441.6
HPS 264.036.022.239.561.738.3
LED64.036.021.137.658.741.3
No. 6
Energies 14 06383 i095
LPS79.420.617.266.183.316.7
HPS 177.023.018.260.979.120.9
HPS 275.424.620.061.381.318.7
LED78.621.416.058.774.725.3
No. 7
Energies 14 06383 i096
LPS87.912.17.957.265.134.9
HPS 183.216.810.652.763.336.7
HPS 282.817.210.952.463.336.7
LED86.613.47.749.957.642.4
No. 8
Energies 14 06383 i097
LPS83.816.210.353.363.636.4
HPS 183.216.89.949.259.140.9
HPS 281.818.210.346.156.443.6
LED78.022.012.143.055.144.9
No. 9
Energies 14 06383 i098
LPS69.630.427.863.691.48.6
HPS 178.421.619.972.392.27.8
HPS 288.211.810.780.190.89.2
LED70.229.827.765.393.07.0
Table 6. Recommendations of CIE concerning the limit values of the luminous flux emitted into the upper half-space.
Environmental ZonesSurroundingLighting EnvironmentUFF (ULR) %
20032019
E1NaturalDark00
E2RuralLow district brightness52.5
E3SuburbanMedium district brightness155
E4UrbanHigh district brightness2515
Table 7. The LED sources together with the CCT and CRI values, for which the LP values are similar and equal to 141%.
LuminaireNo. 1
Energies 14 06383 i099
No. 2
Energies 14 06383 i100
No. 3
Energies 14 06383 i101
No. 4
Energies 14 06383 i102
No. 5
Energies 14 06383 i103
No. 6
Energies 14 06383 i104
No. 7
Energies 14 06383 i105
No. 8
Energies 14 06383 i106
No. 9
Energies 14 06383 i107
LED no.2257915625671116528
CCTlamp2596 K3031 K1988 K9753 K2660 K3700 K5903 K3500 K2748 K
CCTluminaire2587 K3065 K1986 K9440 K2690 K3715 K6029 K3494 K2785 K
CRIlamp578082767885838384
CRIluminaire588182757985838384
Publisher’s Note: MDPI stays neutral with regard to jurisdictional claims in published maps and institutional affiliations.