
A Fully Featured Thermal Energy Harvesting Tracker for Wildlife


Laboratory for the Design of Microsystems, Department of Microsystems Engineering—IMTEK, University of Freiburg, 79106 Freiburg im Breisgau, Germany
*
Authors to whom correspondence should be addressed.
Energies 2021, 14(19), 6363; https://doi.org/10.3390/en14196363
Submission received: 26 August 2021
/
Revised: 23 September 2021
/
Accepted: 25 September 2021
/
Published: 5 October 2021
(This article belongs to the Special Issue Advanced Energy Harvesting Technologies)
Abstract
:In this paper, we describe a novel animal-tracking-system, solely powered by thermal energy harvesting. The tracker achieves an outstanding 100 of electrical power harvested over an area of only 2 times , using the temperature difference between the animal’s fur and the environment, with a total weight of 286 . The steps to enhance the power income are presented and validated in a field-test, using a system that fulfills common tracking-tasks, including GPS with a fix every 1.1 to 1.5 , activity and temperature measurements, all data wirelessly transmitted via LoRaWAN at a period of 14 . Furthermore, we describe our ultra low power design that achieves an overall sleep power consumption of only 8 and is able to work down to temperature differences of applied to the TEGs.
Keywords:
TEG; thermoelectricity; thermal energy harvesting; tracker; wildlife; animal; ultra low power1. Introduction
Wildlife populations are under increasing pressure. Climate change, habitat loss and invasive species are only some examples of numerous threats to resident and migratory wildlife throughout the world. Additionally, in some cases, wildlife populations can negatively impact economy and agriculture. The result is a human–wildlife conflict that has negative consequences for both worlds [1]. In order to reestablish balance and harmonize the opposite requirements between human society and the need to preserve biodiversity, effective wildlife management solutions must be developed. Such development requires a deep understanding of wildlife behavior, possible through high-tech tracking devices able to gather valuable data from animals in their natural environment, in the best case in a non-disturbing and interaction-free manner. Recorded positions and activity levels of wildlife can be used to derive migratory paths, reactions induced by stress and the impact of human-made habitat modifications or losses. Given the long duration of those processes, a continuous and long-time monitoring is a mandatory requirement.
Despite recent advances in the development of tracking devices, most of them are still powered from batteries. Depending on the number and frequency of tasks required, the limited energy of batteries may shorten the possible monitoring time. An increase of power capacities and run-times with this technology typically comes with an increased battery size, hence an increased size and weight, which may have a negative influence on the animals to be monitored. A weight below 5% of the body weight is, e.g., considered acceptable as a general rule of thumb for a collar applied to a mammal, but even then, an impact on the animal can not be excluded [2]. Moreover, the limited energy available requires a severe restriction of features of the tracking devices. To prolong the device lifetime, in fact, a compromise must be found between reducing the set of features or carefully budgeting the energy by reducing the frequency of actions. An exchange of batteries may circumvent these problems; however, this is not a practicable solution. The animal should be approached and recaptured causing stress and undesired impact on its behavior.
Energy harvesting (EH) techniques, i.e., the gathering energy from the direct environment of the animal, may be an alternative solution to power an animal tracker. Several possibilities exists—one may use kinetic energy such as the movement of animals or vibrations via piezoelectric, triboelectric or electromagnetic harvesters [3]. In [4], a tracker is presented that uses electromagnetism to harvest energy from an elephant’s motions. Other sources of energy can be the body of the animal itself, either by using electrochemical energy via biofuels or thermal energy in form of its body heat [5]. Other studies use environmental available energy drawn from radio frequency [6], which is typically radiated by another devices or the radiation of the sun.
With regard to commercially available systems, solar energy harvesting is one of the most used concepts to power wildlife-tracking devices. The LifeTag™ (Cellular Tracking Technologies) is an example of a small tracker running exclusively by harvesting solar power. The system periodically transmits a beacon signal that may be intercepted to get the animal location [7]; however, it does not have any additional function. Another solar-powered but feature-rich tracker, equipped with temperature sensors and global positioning system (GPS), is presented in [8]. A similar device in [9] uses solar cells as an additional energy source to prolong its battery lifetime. Although solar power represents a good alternative or assistance to battery power for wildlife-tracking-applications, it has a significant drawback: The energy income is unsteady and unpredictable. First, energy can only be harvested for approximately a half of a day during sunlight, given that the tracked animal is not living north or south of the respective polar circles. Second, the incoming amount of energy is highly dependent on environmental factors such as cloud cover, shadowing, seasons, or even the current angle of the solar cell to the sun [10]. If a continuous operation is desired, a secondary energy storage is needed in any case that can compensate the lack or reduction of energy income for at least a couple of days.
In comparison with solar energy harvesting, several advantages are obtained by using thermal energy harvesting. In an application at warm-blooded animals, the temperature gradient between animal and environment can be used to harvest electrical energy. The use of thermoelectric generators (TEGs) as a power source makes the system very robust and durable, as no moving or fragile parts are required for its operation. Harvesting from the near-constant body temperature of warm-blooded animals promises a more predictable energy income that might not be as dependent on environmental factors, except the ambient temperature, when compared to the usage of solar cells. Despite the opportunities that such a system could provide in tracking applications, there is few literature about thermal harvesting at animals. We have shown already in [11,12,13] that a temperature difference at a reasonably sized TEG between 2.5 to 3.5 can be used to supply a simple collar tracker, regularly transmitting a beacon signal for localization. In this paper, we will present our more thoroughly designed feature-rich tracking device optimized for an application at mammals. The developed tracking collar is able to record position, temperature, animal activity and transmit these data wirelessly over long distances. Its performance has been analyzed in a long running experiment. The developed system is used in this case as a measurement device to characterize the whole scenario and its boundary conditions. Valuable data about the energy income, occurring temperatures, and other performance parameters are gathered and analyzed. The paper is organized as follows: In Section 2, our design focus is explained, followed by a description of the collar’s design and its field test. A detailed description of the system design and its effects on the overall performance is discussed in Section 3. The structure of our field test and its results are then presented in Section 4 and finally addressed in Section 5.
2. Aims and Scope
Our proposed tracking device and experimental setup follows two purposes. The first purpose is the development of a full-featured tracking device that is solely driven by thermal energy harvested from the temperature difference between animal and environment. With regard to the limited energy income, we investigate how to reduce power consumption in the tracking sub-system while maximizing power input from the harvesting sub-system. Power income and consumption are being recorded in a field test, together with information about how and when each feature has been activated to verify the device’s functionality. The feature-set of the wildlife tracker consists of the following functions:
The animal’s activity is tracked and recorded as a single value, indicating how much the animal has moved over the last period. This measurement is implemented following the common approach of using an accelerometer that records events exceeding a certain threshold. More sophisticated approaches may gain more information about the type of movements and detect the type of moving or current animal position. These, however need significantly more energy due to higher sampling rates and processing power, for example, via a frequency analysis of accelerometer values in the tracker itself [14]. For our power-optimized tracker that may use the animal activity to schedule tasks, implementing a simple step counter is sufficient.
The position in our device should be gathered via GPS as this is the most commonly used technology and offers worldwide coverage. It did become an essential tool for studying migratory routes, home ranges or the migratory behavior of animals [15]. As other global navigation satellite system (GNSS) systems such as Galileo or Glonass work with a similar principle, GPS is a good representative for this category of location technology. Depending on the intention of the tracking device, positions are recorded at very short time intervals down to a record every few minutes. Long-term studies typically gather a position every hour or with intervals up to 40 h [15,16]. For our device, that aims on long-running observations, one location per hour is an adequate requirement and compromise as higher frequencies are usually not required and are likely to not work due to the high power consumption of GPS.
Wireless transfer of the data is needed to gather the recorded data remotely. Technologies such as the transmission via satellite or the usage of cellular networks are common to achieve worldwide coverage. However, both require high amounts of energy, making them unsuitable for our purpose. An alternative with low power consumption is a custom-built world-spanning receiver network such as the Motus wildlife tracking system that is capable of receiving very high frequency (VHF) beacons [17]. It is used to locate an animal worldwide, but only works in areas where a receiver is deployed. The reception of a location history or of sensor data is not possible with that system and thus would negate the advantage of having GPS on-board. Our approach is to use a world-spanning network similar to Motus, but one that offers transmission of custom data at a minimum of energy and over a long range. We found the LongRangeWideAreaNetwork (LoRaWAN) to be a promising candidate as it is already widely used and can still be deployed manually. While the transmission of the recorded history is possible with that system, we have only implemented a message of the last record as all data-points will be stored and later be retrievable from the collar’s internal memory.
The second purpose of our developed collar is the collection of environmental and performance-relevant data helping to analyze power input and thermal conditions at the animal. Valuable information are the thermal resistances of the device and the fur-device connections. To get an approximate value, sensors in the housing record the temperature gradient over the TEG and the ambient temperature. Due to the measurement method, we expect relatively high uncertainties of actual values, introduced by varying conditions such as the collar’s varying looseness to the animal or environmental factors such as wind and rain. Still, these results are valuable as average, real-life data for improving the power outcome and weight of future devices.
Furthermore, internal data concerning the power income and usage are stored together with the device’s state. It is desired to verify the power consumption for each task executed by the tracker and the performance of the implemented power management. With our implementation, a correlation between power income and ambient temperature, and its possible daily period can be derived.
3. System Design
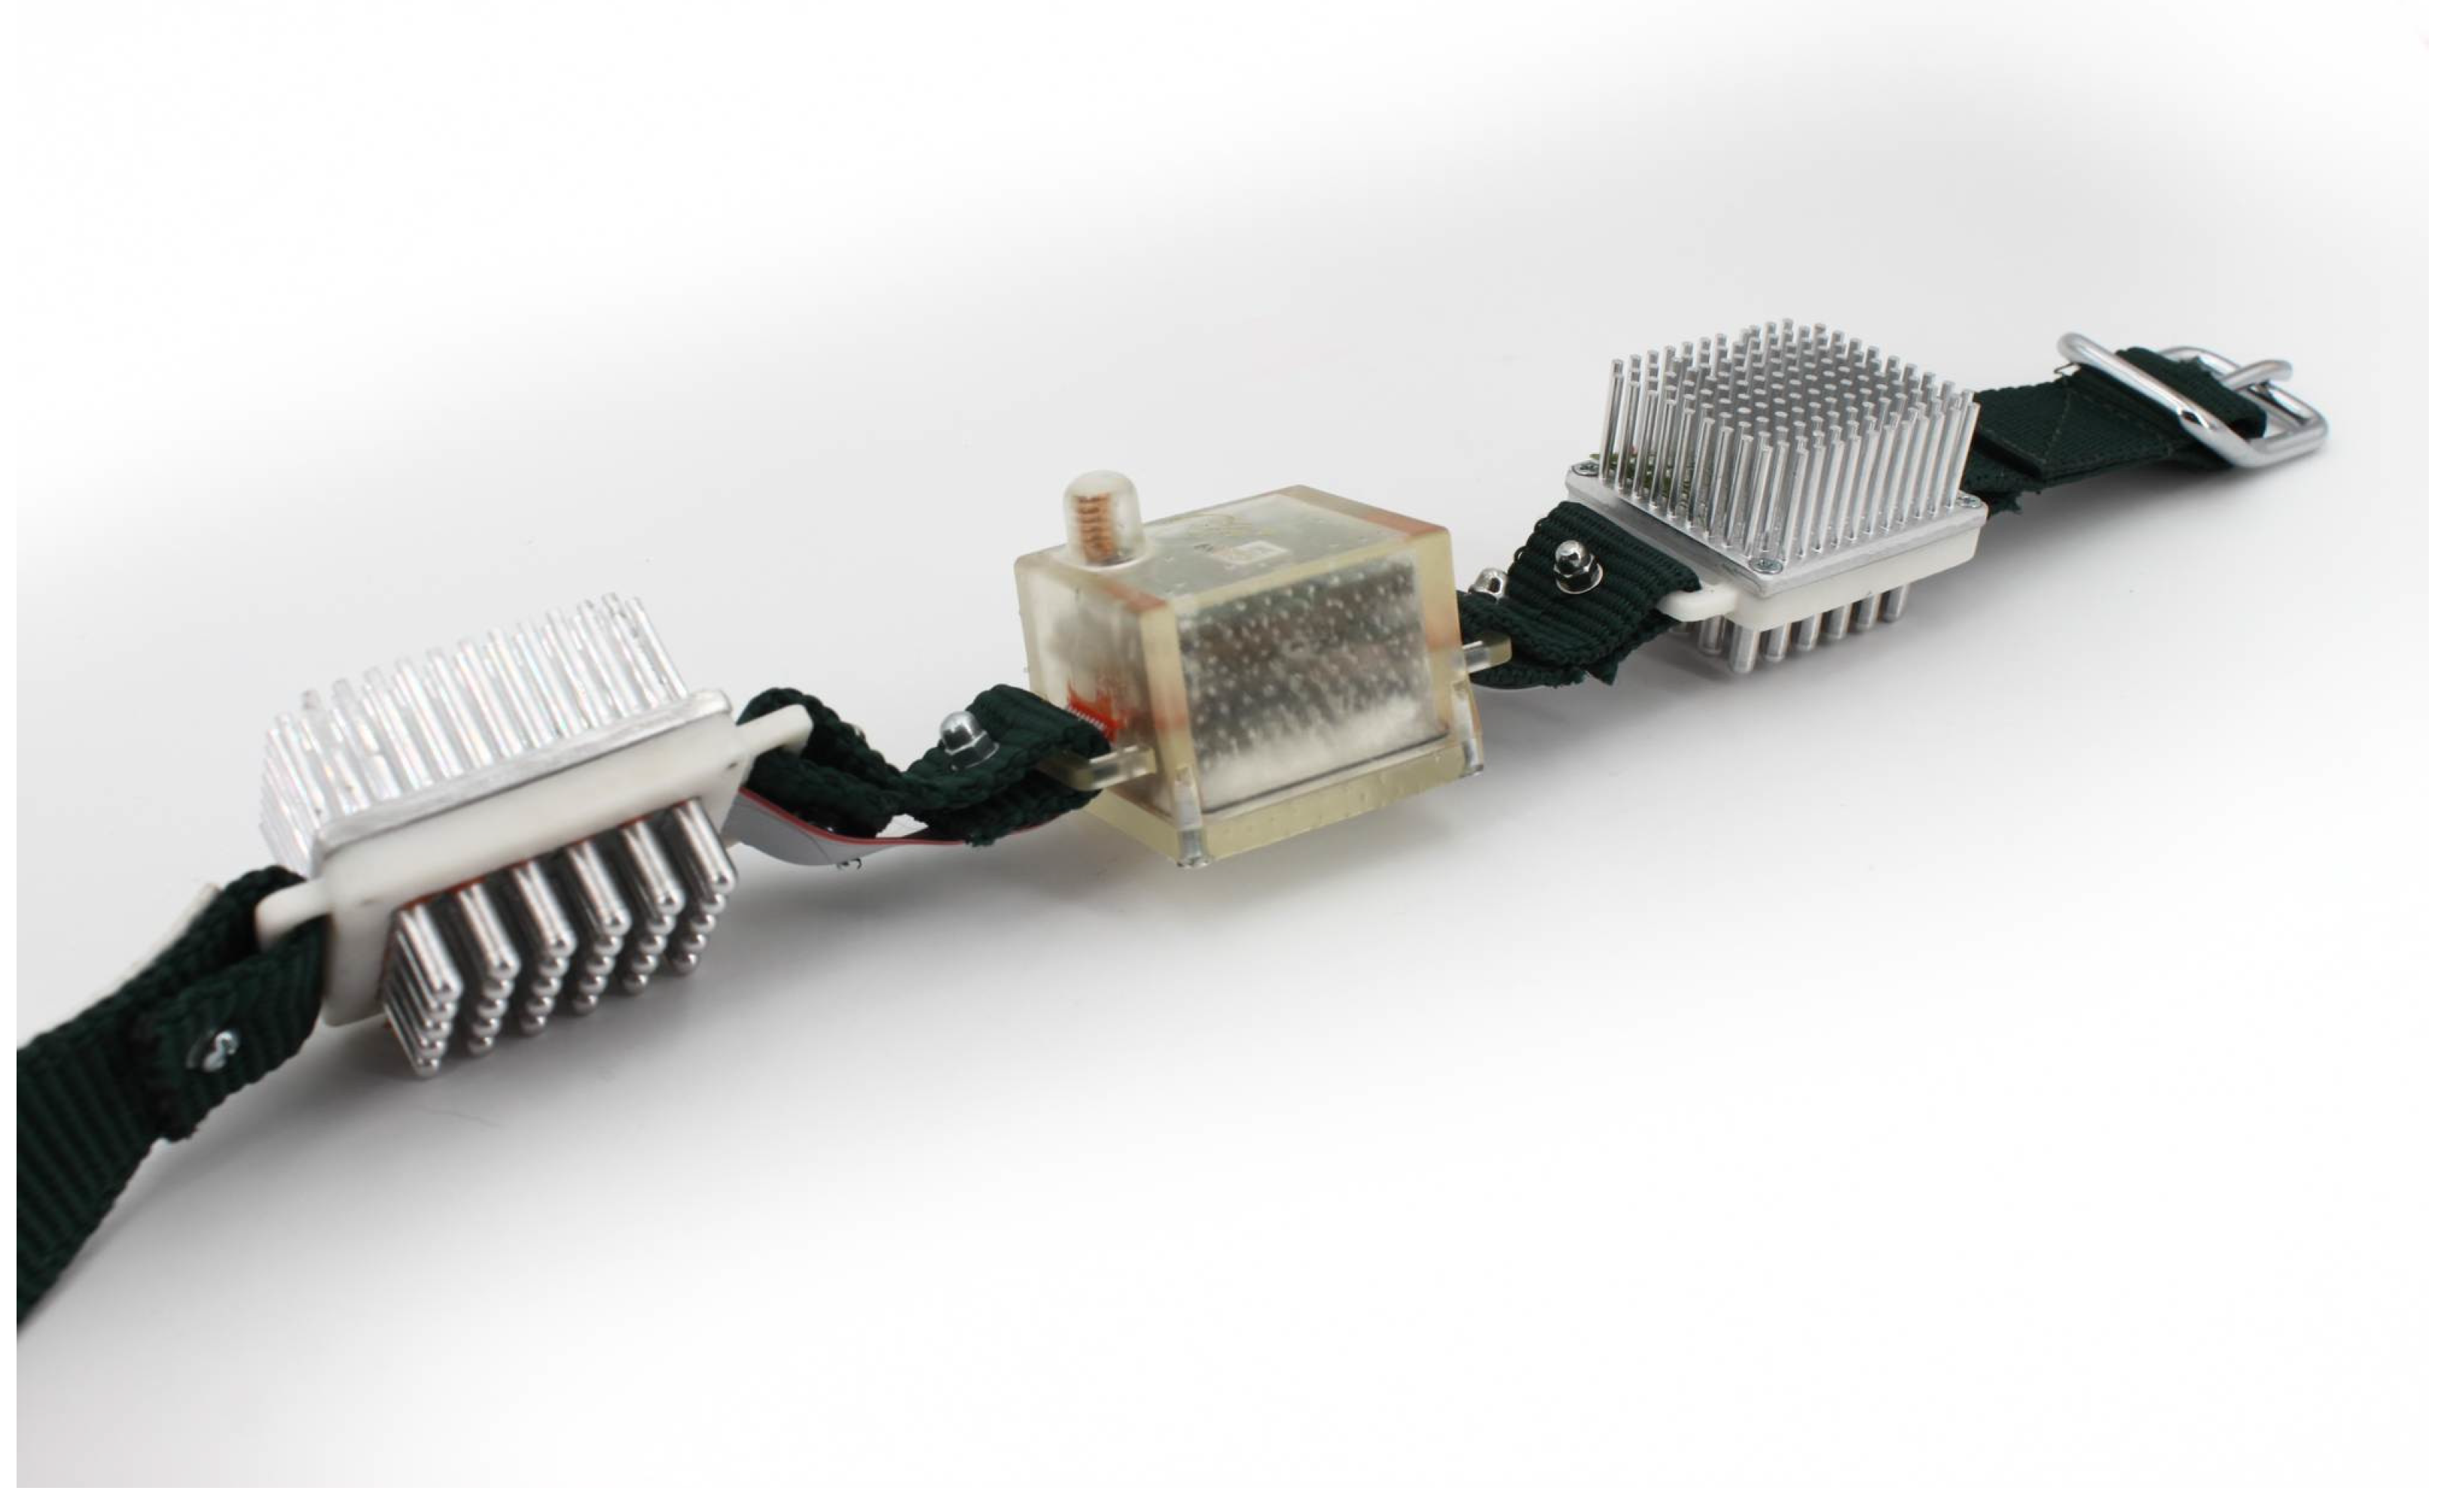
The design of our tracker is inspired by available collars such as trackers from the companies Vertex or ATS. These collars consist typically of one or more enclosures. In our case, the collar holds three enclosures, as shown in Figure 1. Two of them contain the thermal energy harvesting part of the system, the third contains the electronics for power management, tracking and wireless communication. More details about the different collar parts will follow in the next sections.
3.1. Energy Harvesting
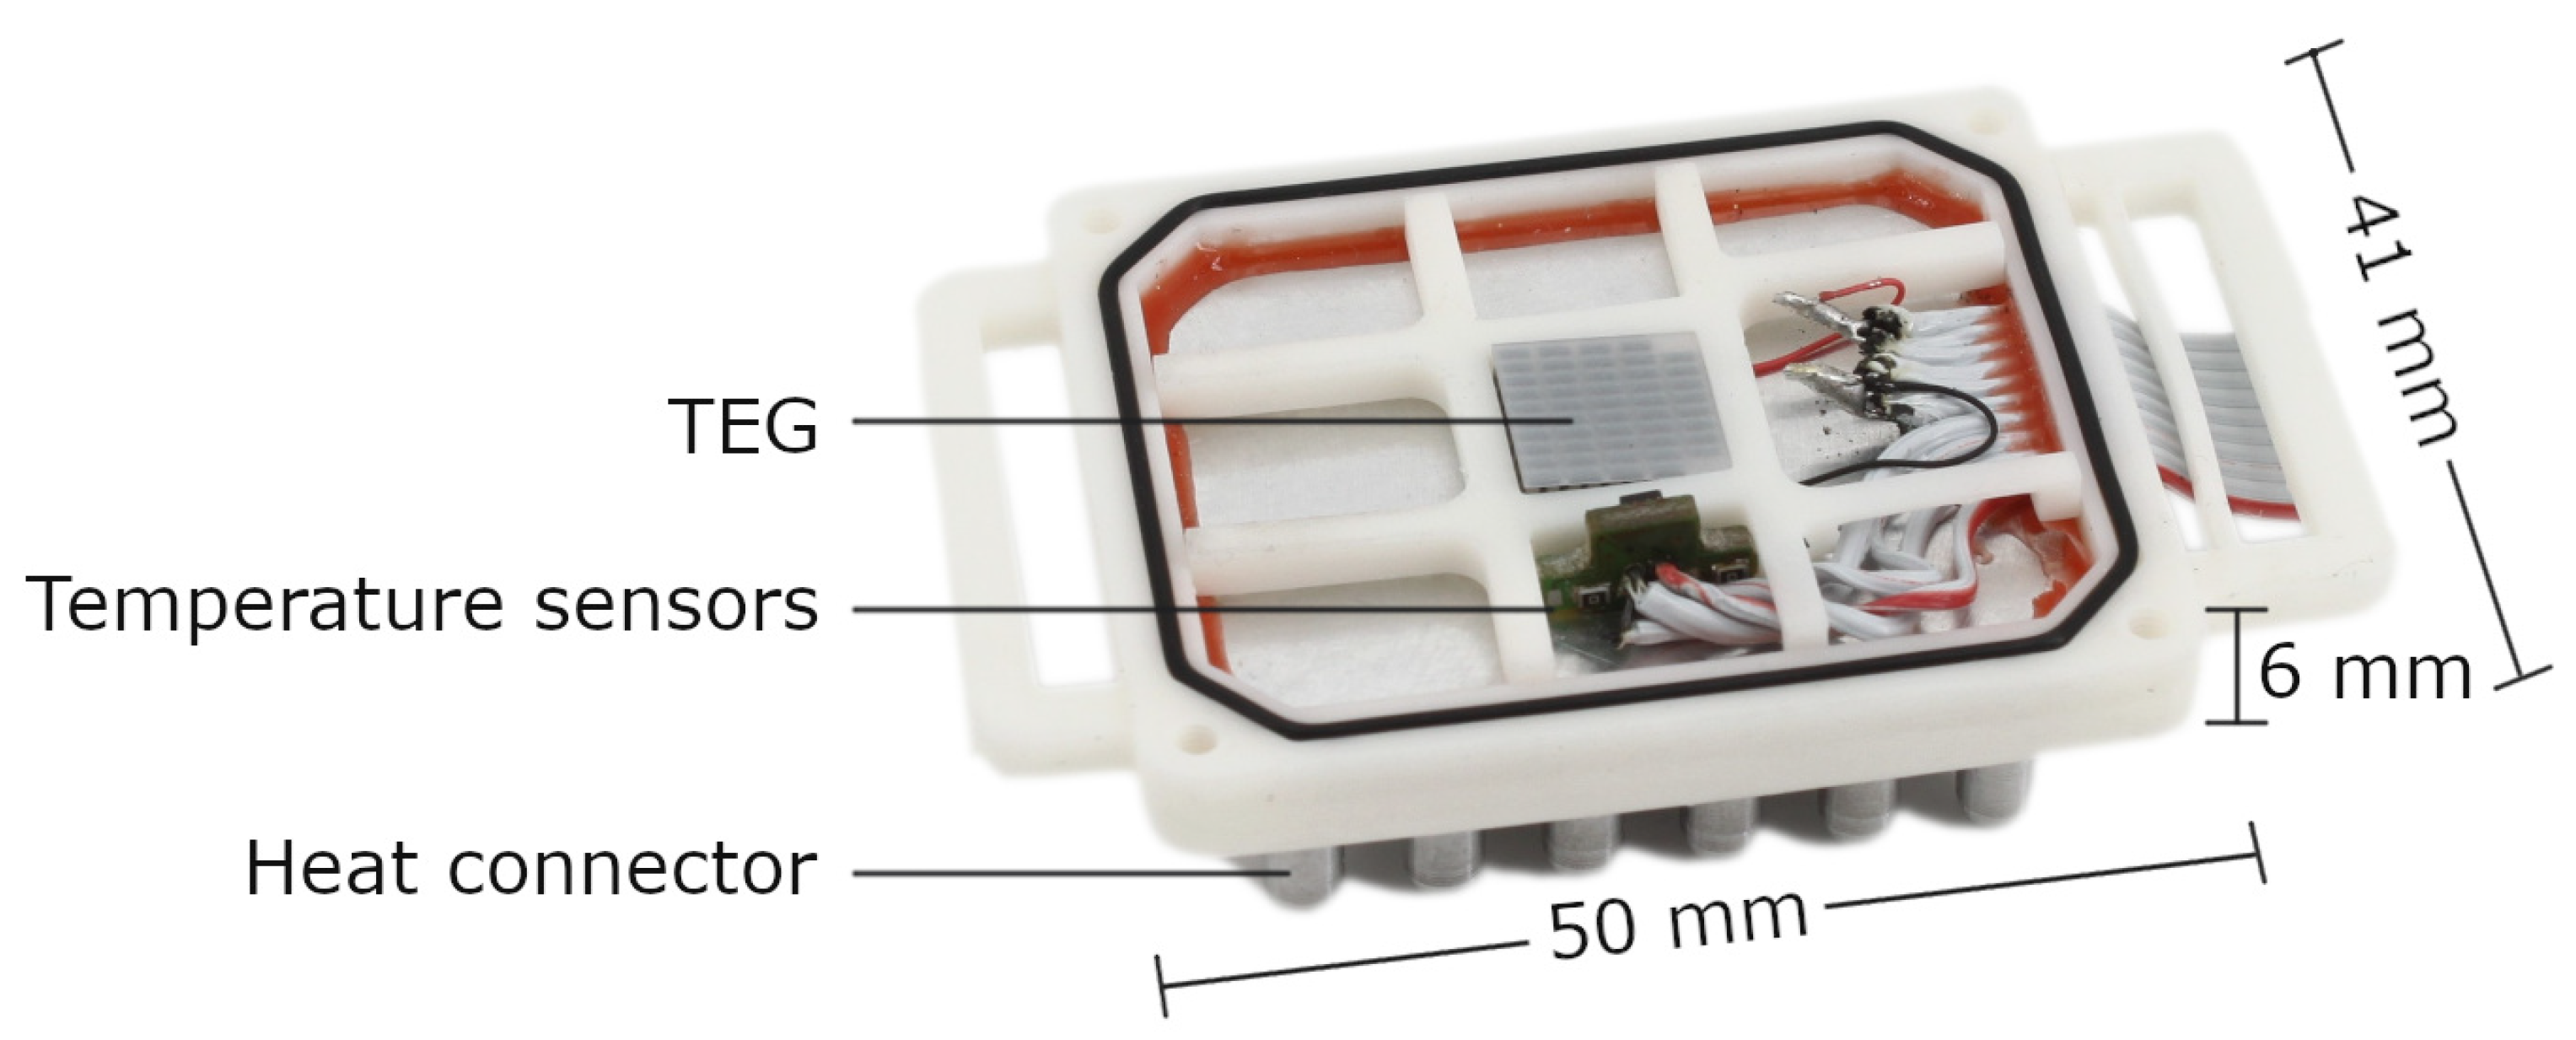
The thermal design of the harvester is already discussed in [13]. It consists of a TEG embedded between an aluminum heat connector at the animal side and a heat sink facing the environment, i.e., ambient air. Beside the TEG, two digital temperature sensors are placed on a PCB, which is embedded between the heat sink and the heat connector. The inside of the energy harvesting housing with its components is shown in Figure 2.
The heat sink is a commercially available from Fischer Elektronik. Its fins are cut down and modified to be screwed to the housing. The initial thermal resistance of the chosen heatsink is in the range of 0.5 / to 2.7 /, depending on the ambient wind speed [18]. We decreased the fin’s height to 10 to achieve a less bulkier device and reduce risks of injuries. We expect a slight increase of the thermal resistance of the heat sink to a maximum of 10 / in a worst case condition. Compared to the heat connector’s much higher thermal resistance this should be negligible.
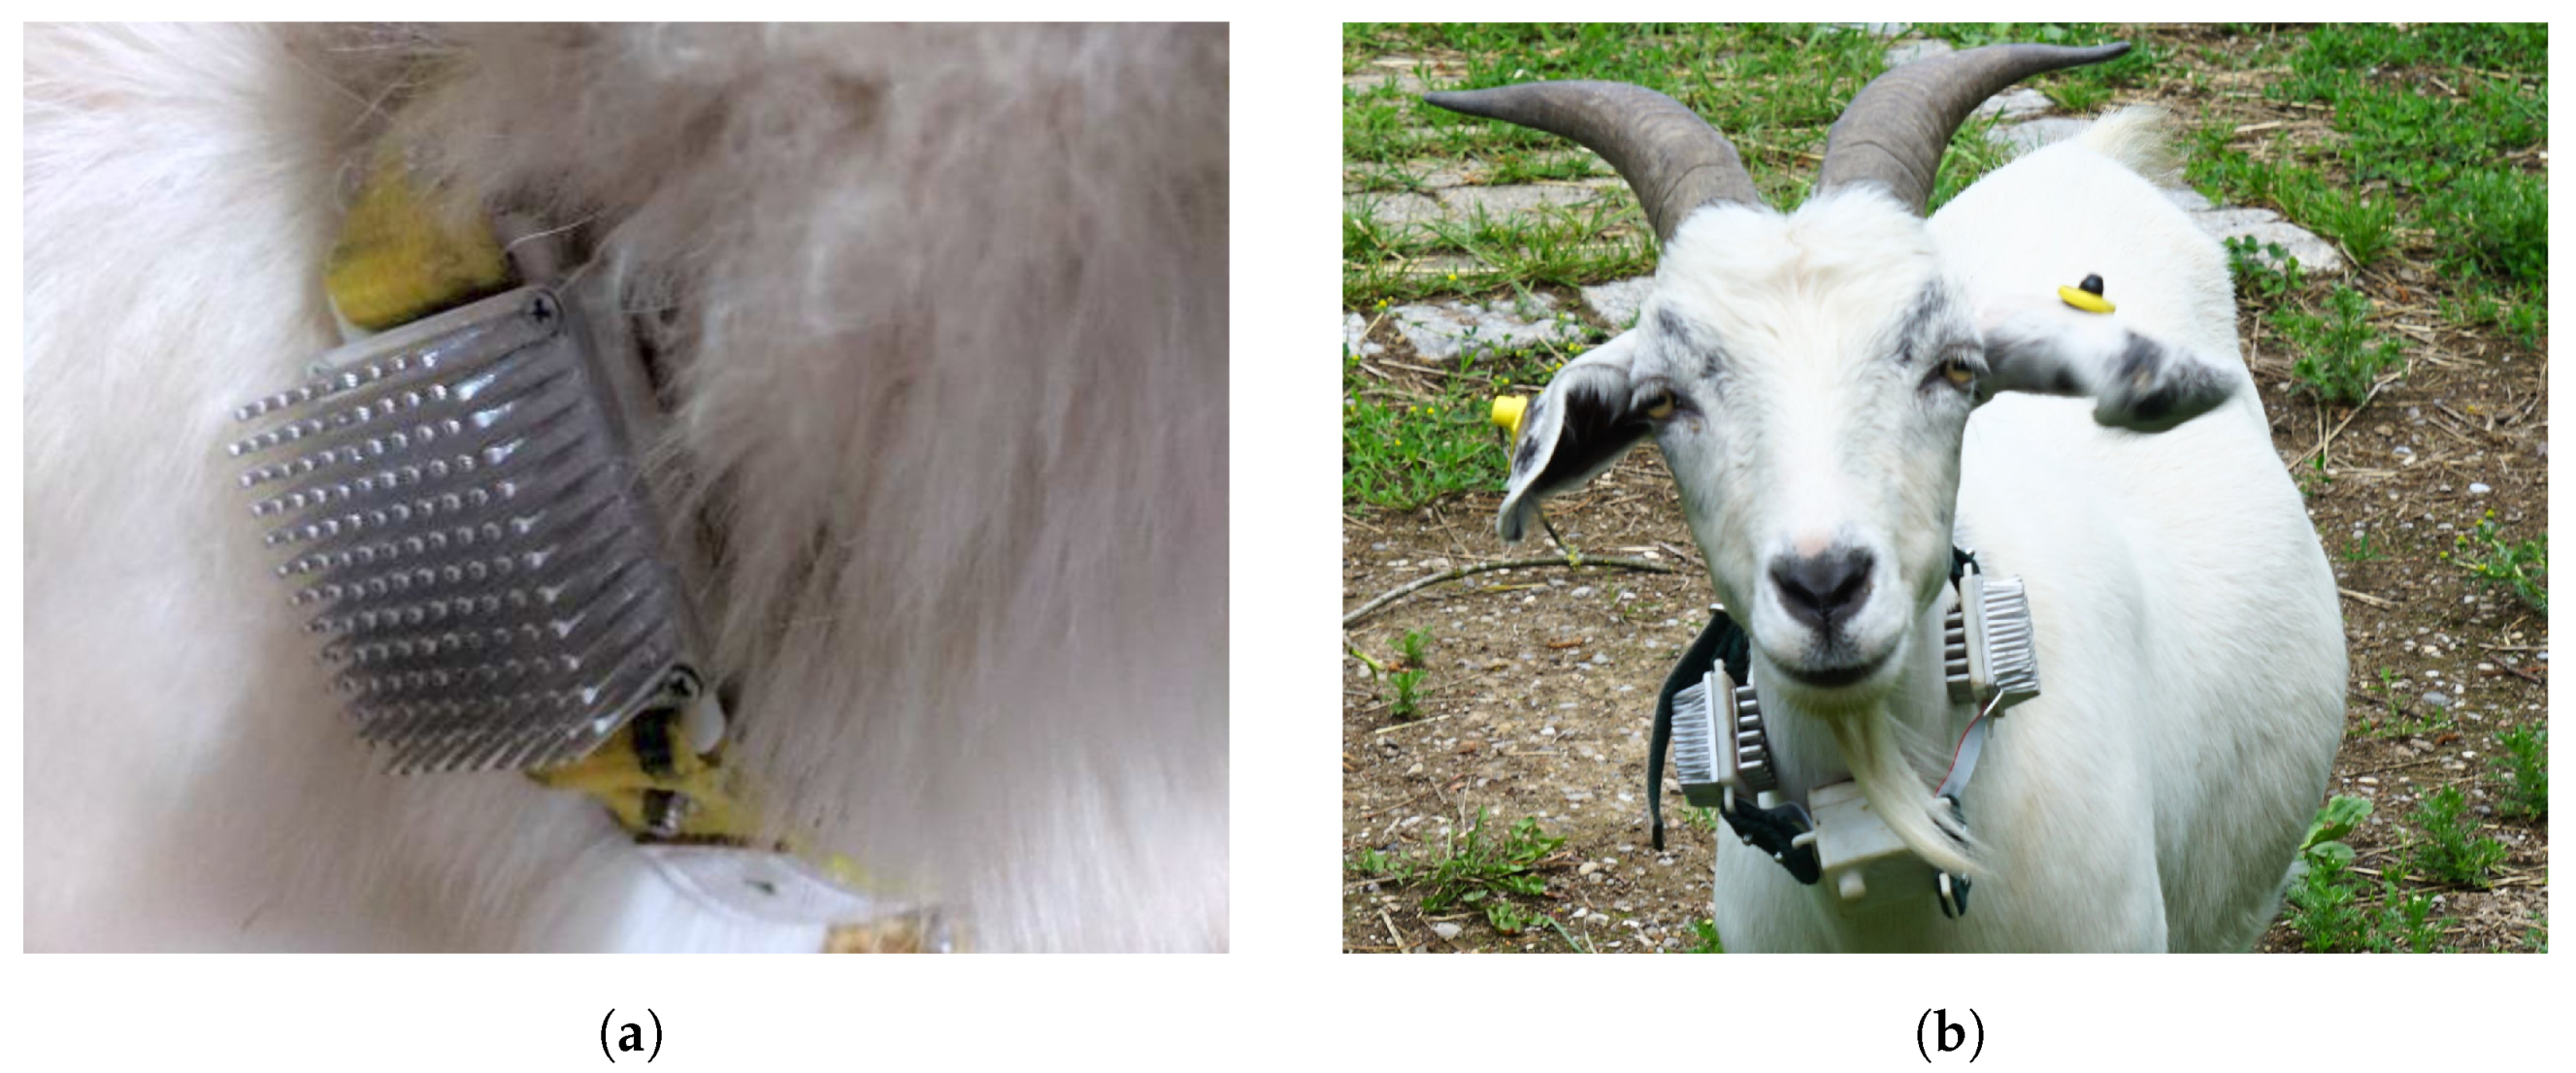
The heat connectors’ design is similar to that of the heat sink, as it ensures the closest contact of the heat connector and the animal skin. It is equipped with fins that penetrate through the fur of the animal to circumvent its high thermal resistance. Further details on the heat connector design are available in [13]. The length of the heat connectors’ fins is a critical parameter to achieve a good performance, i.e., a high temperature gradient at the TEG. Too short fins can not overcome the high thermal resistance of the fur, whereas too long fins leave room between the housing and the fur where the ambient air would cool down the device and lead to heat losses. In a test with different fin lengths attached to the desired animal, here a cashmere goat, a height of 10 was identified as the most suitable.
The two temperature sensors for monitoring the hot and cold side temperature of the TEG are embedded into a small cutout which was milled into heat sink and heat connector (see Figure 2). In the desired temperature range between −20 –50 , the sensors offer an accuracy of about [19]. Additionally they are equipped with a digital interface, which allows data transmission between the electronics and harvesting housing with a smaller number of wires in comparison to analog sensing solutions. Moreover, they are already calibrated and do not need an analog-to-digital-converter (ADC) at the main electronics board.
The housing at the animal’s side and the outlets for the cables are sealed with PDMS. The heat sink is screwed to the housing against a rubber O-ring that protects the inside against water and moisture. In the housing, besides the structure holding the TEG in place, there is no additional isolation applied.
3.1.1. Output Power Considerations for TEG
To achieve a high output power of the TEG, a low thermal resistance, hence a good connection to the animal is required. Whereas this can be easily achieved by harvesting from big areas, this option is limited by the collar weight and size an animal can carry. Additionally, a careful adaptation of the TEG to the ambient thermal condition is needed. However, a high temperature gradient at the TEG and a high thermal flux resulting in high electrical output power are inherently contradictory demands. Our approach on the compromises to be taken, especially concerning the choice of a TEG, is described in the following.
In our case, we are harvesting at relatively low temperatures and temperature gradients. The temperature of the animal skin is in the range of 30 to 33 [20], while we expect the ambient temperature to be in the range of −20 to 30 . It is well known that TEGs made of bismuth telluride delivers the highest performance in this temperature region and achieve a figure-of-merit (ZT) of about [21]. However, due to the thermal resistances of fur and ambient air, it can not be expected that the potentially high temperature differences between animal skin and ambient air can be used at the TEG. A former experiment found temperature gradients of only about 2.5 to 3.5 at the TEG [11]. Therefore, this situation is fundamentally different from thermoelectric harvesting devices embedded between highly conducting heat sources and heat sinks, operating at temperatures far beyond 100 and with much higher temperature differences . Consequently, the maximum output power and efficiency of such a device will be low due to the small temperature differences obtained: As an example, the theoretical power output limit when the thermal harvesting device is considered as an optimal Carnot-engine is at only 250 [22]. Even then, this output power is only achieved at very generous conditions, with a thermal harvesting device with a resistance of 10 / and an ambient temperature of . For the more realistic scenario of a gradient, the limit drops down to 1 .
In the scenario when a TEG is used as a thermal harvesting device, the maximum possible output power is only a fraction of the Carnot-limit. The TEG’s output power is not only dependent on the given temperature difference , but also on its Seebeck-coefficient and its internal electrical resistance , all together described in Equation (1). For the design process of our tracker, Equation (1) states that a high and are preferred over a low . However, if the resistance of electrical load attached to the TEG does not match , the possible output power given in Equation (1) will not be reached.
Another impact on output power is that the available at the TEG is further reduced when it is embedded between two thermal resistances and a is applied to the system. Here, reduces by a factor of , with a given as the sum of all three thermal resistances of the TEG itself and its two thermal interfaces (Equation (2)). In the scenario at the animal, we expect that our specific design of the thermal connection to the animal has a thermal resistance in the range of 35 / while the thermal resistance of the heat sink to the ambient air is in worst case in the range of 10 /, assuming calm wind [13]. The TEG’s thermal resistance, however, is often below 10 / and further intensifies the mismatch of Equation (2), as a too-low thermal resistance of the TEG will virtually short-circuit the temperature difference across the TEG. Furthermore the surrounding thermal resistances decrease the available output power when a load is attached to the TEG and electrical power is drawn. This effect is modeled by introducing an additional term into the effective electrical resistance as stated in Equation (3). Both Equations (2) and (3) are put into Equation (1) to compare the achievable output powers for the following examined TEGs.
3.1.2. Optimal Commercially Available TEGs
For this project, we restricted our selection of TEGs exclusively to commercially available devices. Although a wide variety of TEGs exists with different thermal and electrical resistance, , and size, for the purposes of this work it is sufficient to compare the TEG exclusively on a per thermocouple-leg basis. The optimal TEG with a maximum output power for a given thermal connection is then determined by choosing the corresponding number of thermocouples with a specific dimension. This is possible as, first, is constant over all different sets of TEGs as all use the same thermoelectric materials, here bismuth telluride. Second, for the same dimension and material of a thermocouple, its thermal and electrical resistance are fixed. The overall of the TEG and its thermal/electrical resistance is then determined by adding up the thermocouple parameters. It must, however, be considered that this approach is only valid as long as other effects such as additional resistances in the electrical connection of the thermocouples or parasitic thermal resistances are minor.
To compare the TEGs on the basis of their achievable maximum output power and output voltage , the following assumptions are made: An ambient temperature of 25 and an animal skin temperature of 30 , giving a temperature difference of 5 . The thermal resistances of the connections are fixed with = 35 / and = 10 /.
Here, we focus on the TEG series 1MC06-XXX_xx_TEG of the company TEC Microsystems, which only differ in their thermocouple height and quantity. Other sets of this manufacturer only vary in the spacing of the thermocouples and thus have the same properties with a smaller overall size. To compare the TEGs at the thermocouple level, their parameters, including , thermal resistance , and electrical resistance , are derived from the given datasheet of the whole TEG. We have verified that the calculated per couple is the same for all variants with negligible differences. Each thermocouple’s electrical and thermal resistance is, as expected, nearly constant (maximum deviation 3% and, , respectively) within each set of TEGs with the same height.
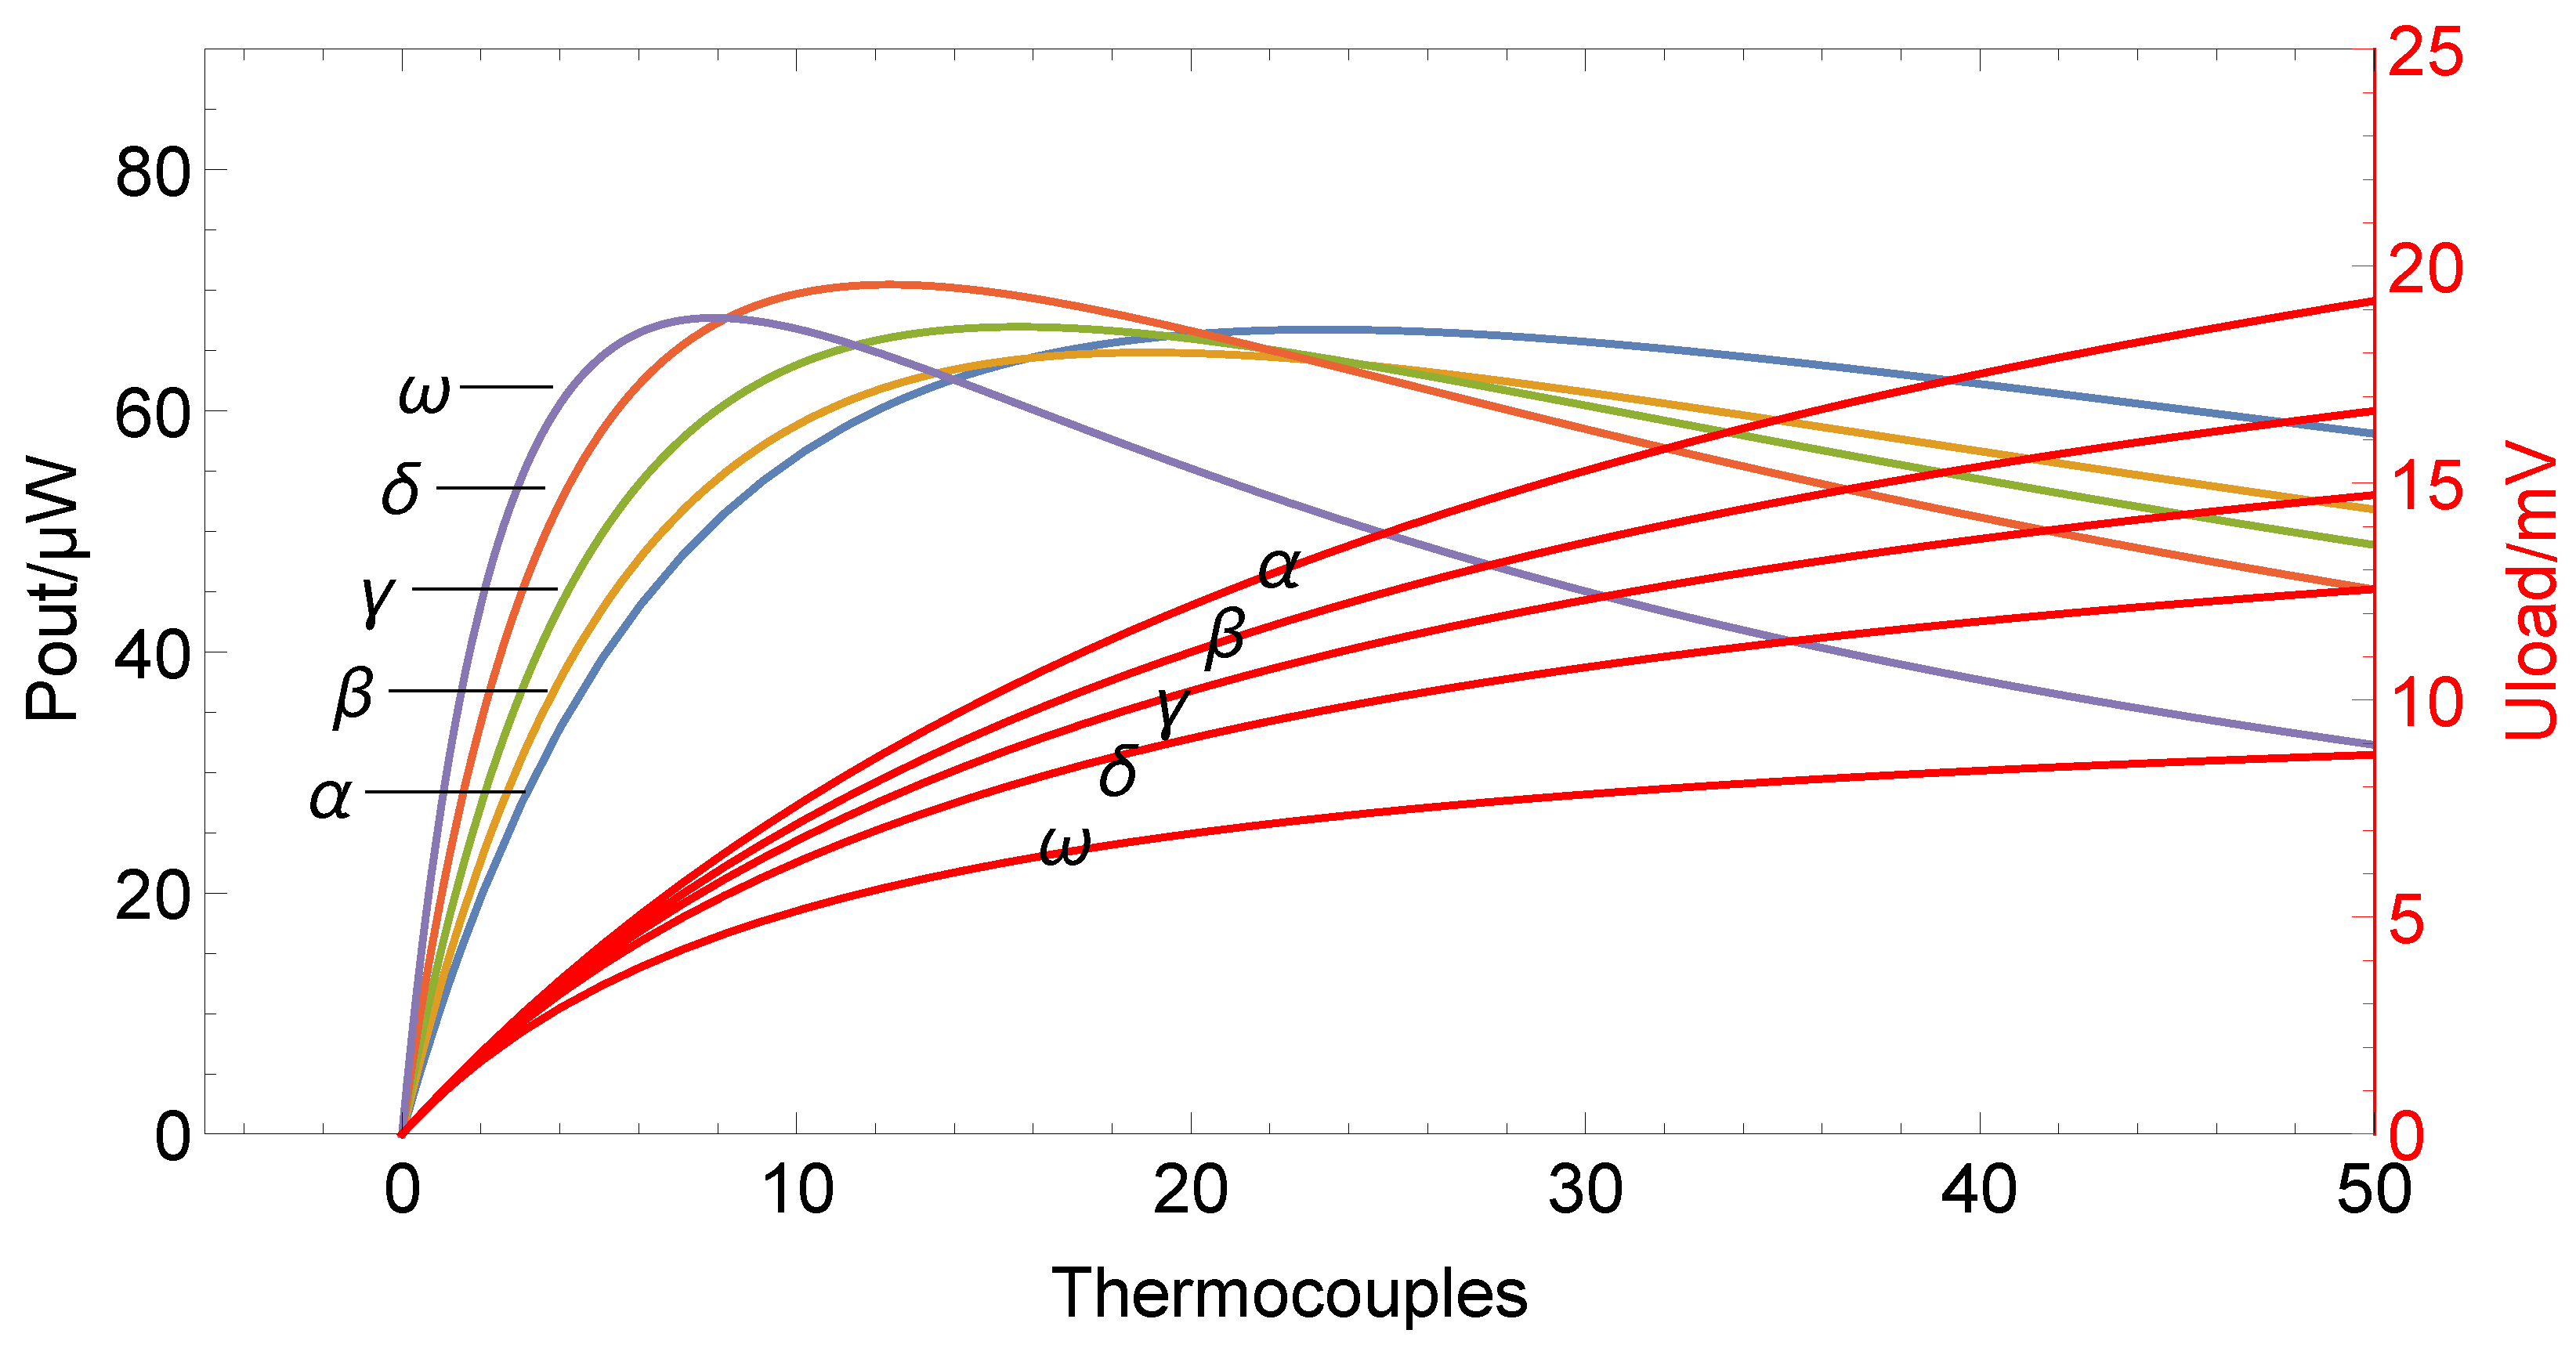
In total, we have compared five sets that differ in their thermocouple height from 5 to 16 . For each height variant and number of thermocouples, the corresponding output power and voltage related to our scenario are plotted in Figure 3. It can be seen that harvesting at low voltages is beneficial to get high output power. Thus, a low number of thermocouples with a small height is more promising in general. The configuration with the highest output power is a TEG with eight thermocouples and a height of 8 (curve in Figure 3), offering a promising power output of 70 , but has a low output voltage of less than 10 .
This low output voltage is a problem, as most CMOIS electronics, and also in our system, require a minimum supply voltage of about , which is several orders of magnitude higher. Therefore, an up-conversion of the TEG voltage is needed, which is accompanied by additional losses. Popular integrated circuits (ICs) for this task, such as the LTC3108 from Linear Technology or other devices from Texas Instruments do not work at 10 or achieve a very low efficiency of only 40% for input voltages around 20 [23]. Therefore, it is wise to take the efficiency of the up-conversion at the corresponding voltage into account to maximize the overall usable energy. The use of commercial ICs would not allow us to harvest at very low input voltages. However, as this implies the drop of the maximum achievable power output of the TEG, for our setup a custom-built electronics for the up-conversion was used. It works with an efficiency of about 60% at 20 , quickly dropping for voltages lower than 15 . Given that, the 1MC06-048_15_TEG was selected, as it delivers the highest output power at output voltages around 20 . To further increase the input power for the up-conversion, two TEGs are used in a parallel electrical connection. As all calculations are done for a worst-case scenario, the maximum power output and the voltage of the TEG will likely be higher.
3.2. Power Management
The power management is based on having an intermediate storage that catches enough energy to fulfill the demanded tasks once. This is necessary due to the low output voltage and output power of the TEG that are not high enough to drive any electronics directly. For example, on the one hand, GPS and a wireless transmission module typically work at a minimum voltage of and a supply current of 30 , respectively, up to 100 . On the other hand, the TEGs’ output power will be in the range of 24 to 220 , at presumed temperature gradients of 1 to 3 , here with the used TEG 1MC06-048_15_TEG. At the same time, the TEG output voltage will be at 20 to 60 , which reduces to a range from 10 to 30 if an optimal load at maximum output power is connected.
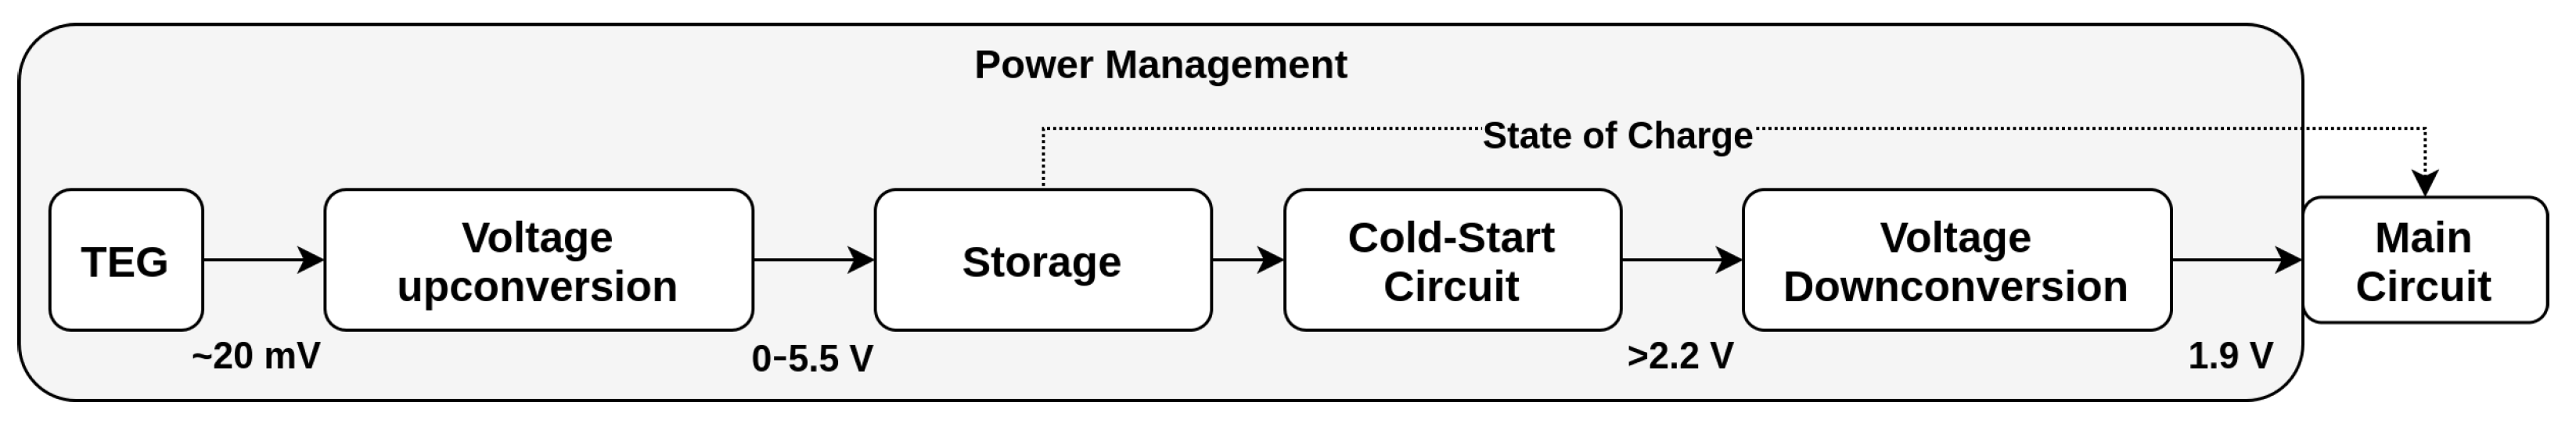
Therefore, the power management in our system consists of a voltage up-conversion, a capacitor as intermediate storage, and a second voltage stabilization stage. Figure 4 shows the entire chain up to the power-consuming part: First, the output voltage of the TEG (10 to 30 ) is up-converted and it charges a capacitor up to . A cold-start circuit monitors the capacitor voltage and turns on the rest of the system as soon as the voltage reaches a well-defined threshold. In the next step, the capacitor voltage is stepped down to a constant and regulated voltage for the main system. At this point, the main system takes over the power management, and only in the event of a very low energy state, the cold-start circuit will cut off the main system from the capacitor.
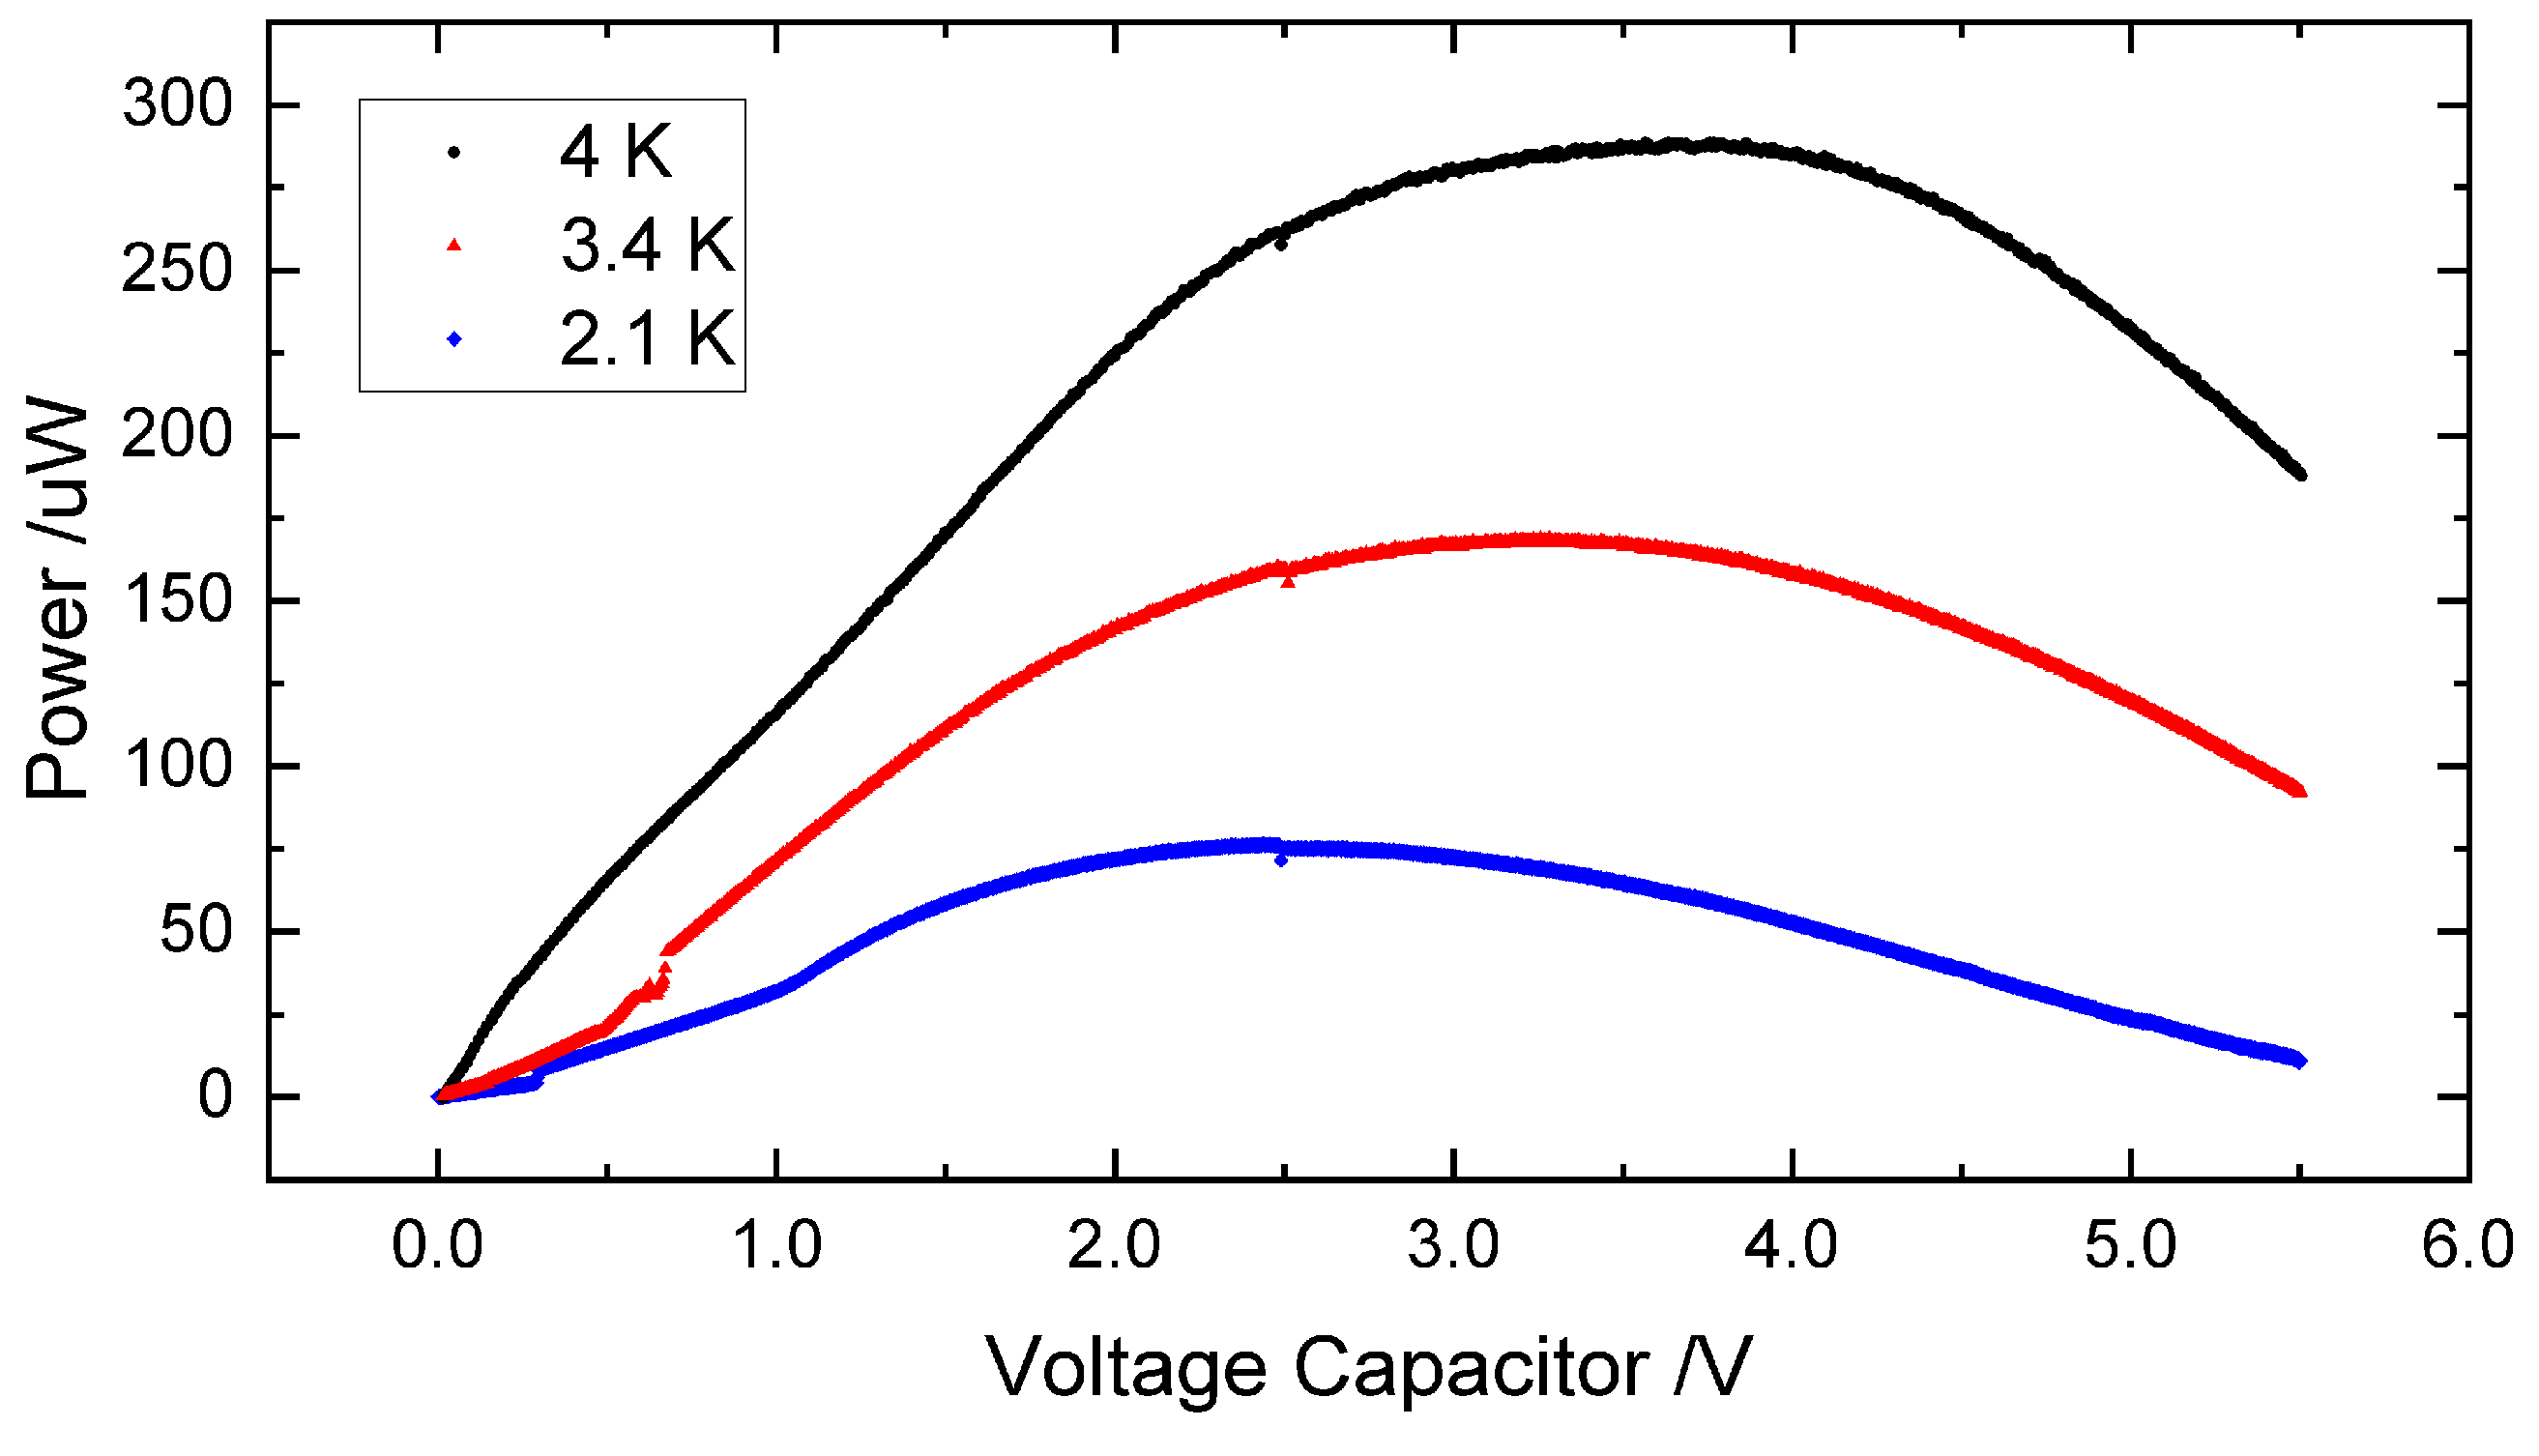
For the up-conversion step, a custom-designed low-voltage boost converter is used based on the design explained in [24]. It provides an unregulated output voltage, a cold start capability down to 10 , requires no auxiliary power and has an efficiency above 40% over a wide range of the expected input voltage, with a maximum efficiency of approximately 60% at an input voltage of 20 . Load matching is not implemented in the boost-converter. As the capacitor is directly attached the output of the boost converter, the overall power input is heavily dependent on the capacitor’s state-of-charge. The corresponding usable powers are shown in Figure 5: At a low capacitor voltage, the system can only retrieve low power from the boost converter, whereas at the capacitor voltage of around , the step-up converter delivers its maximum power. Therefore, the start-up phase from zero power for a system with an empty capacitor, needs a long time. Afterwards, the main electronics will monitor the capacitor voltage and schedule its tasks in such a way that the storage capacitor is most of the time in the optimal voltage range at . Although the optimal power point varies with the TEG’s current temperature difference, this is not monitored. It turned out that in the expected temperature range, the maximum in Figure 5 does not vary too much.
The energy storage capacity is chosen in such a way that it provides enough energy to complete the most power-hungry task, here the GPS, once. Long-term storage, using, e.g., a rechargeable battery, could be added; however, it is not foreseen in this concept, as we expect a continuous and constant energy income from the TEGs. In our case, the GPS module CAM-M8 (u-blox) needs around 26 in acquisition mode and can obtain a position within 7 when the aided start functionality is used [25]. At a supply voltage of , the energy storage needs, therefore, to provide at least 328 . However, since it is not guaranteed that a fix is always possible within 7 a minimum stored energy of 500 is desired. This is achievable by choosing the BZ015B603Z_B (AVX) as a storage capacitor that provides a capacitance of 60 . When charged up to its limit of and discharged down to , an energy budget of 760 is available, which enables the GPS module to run approximately for 16 .
The capacitor’s leakage is an important parameter as it significantly impacts the overall power consumption of the system when in sleep mode for extended periods. The datasheet claims a maximum leakage current of 10 and a low equivalent series resistance (ESR) of 80 [26], suitable for the purposes of this work. A low ESR is further needed to prevent high voltage drops when a current up to 100 is needed during wireless data transmission. We experimentally verified that the leakage current is even lower with 5 near its maximum rated voltage at and around at voltages below 3 .
A constant regulated voltage supply for the microcontroller and periphery is realized by the TPS62740 (Texas Instruments) step-down converter connected to the capacitor (see Figure 4). It is suitable for handling input voltages up to , can provide a constant output at a reasonably high efficiency, and has a typical quiescent current of only 360 [27], which is advantageous to reduce the overall power consumption when the rest of the system is in sleep. Additional circuitry based on [28] is connected to the enable pin of the TPS62740 as a voltage monitor and power switch and turns off the whole system when the capacitor voltage is below a certain threshold. This helps during the cold start phase when the energy storage is empty and prevents possible excessive current draw due to undefined behavior of the periphery in low voltage conditions. Detrimental effects of such a behavior are demonstrated in [29].
3.3. Main System and Periphery
The developed system can measure five physical properties, needed either for the wildlife-tracking purpose or to log the system performance: Time, voltage of the energy storage capacitor, activity, position of the tracker as well as the temperature difference over the TEGs in their separate housings. The gathered data is stored on the device itself, but eventually also transmitted wirelessly.
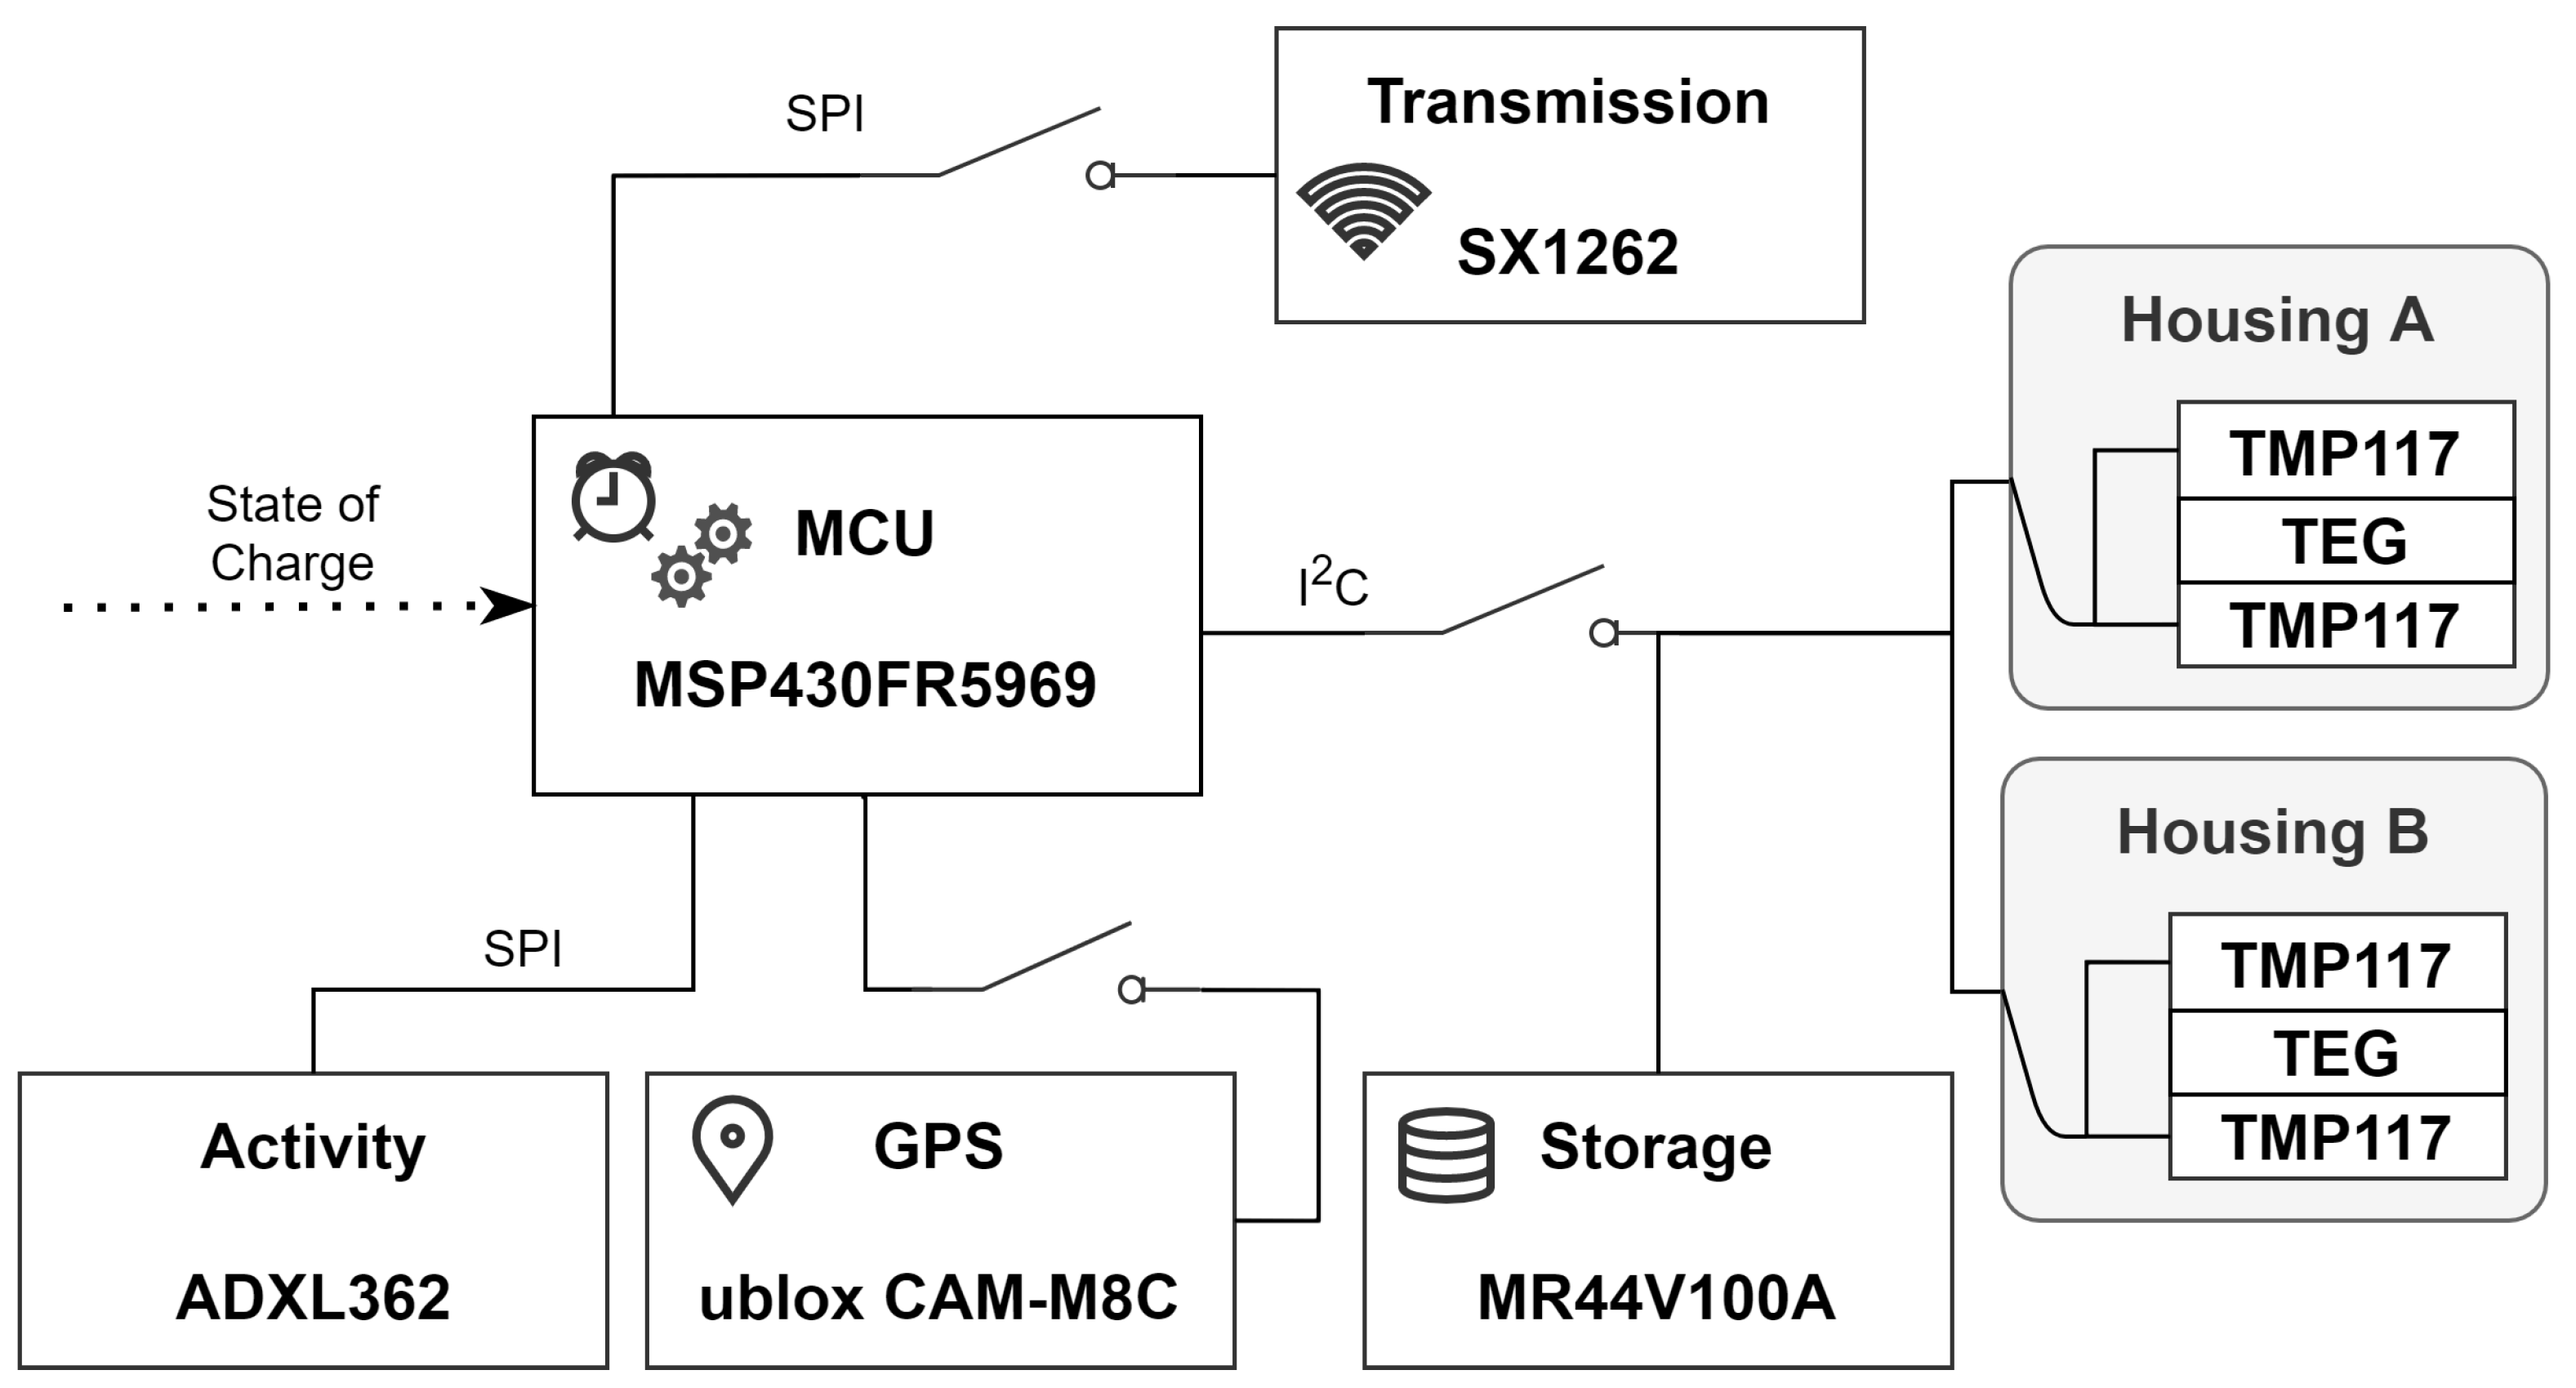
The overview in Figure 6 shows that the microcontroller unit (MCU) MSP430FR5969 (Texas Instruments) does centrally control all other components. It features an inbuilt realtime clock (RTC) that tracks time and wakes up the MCU periodically at a current draw of only 250 [30]. While the MCU is always connected to the power supply as long as the capacitor’s voltage (see Figure 4) is above the turn-on threshold voltage, all other periphery can be individually disconnected from the power supply by the MCU with a low leakage switch [31]. This reduces the system’s sleep current to an absolute minimum.
The temperature difference at the TEGs in each of the two housings is measured by two digital temperature sensors, TMP117 (Texas Instruments), the accuracy of which is claimed to be [19]. The four sensors are connected to the MCU via the same Inter-Integrated Circuit (I2C)-bus. This avoids the use of additional external components and reduces the number of wires needed to connect the harvesting and the electronics housing.
Besides the built-in Ferroelectric Random Access Memory (FRAM) of the MCU, an additional one with 1 capacity (MR44V064B (Lapis Semiconductor)) is connected to the I2C-bus [32]. It is used to store the aiding data for the GPS module and to save all measurement data. For the aiding data, 128 are reserved. The rest is used to store measurement data, each taking 30 B. For the experiment, a measurement was taken every 7 , hence the FRAM’s space lasts for about 18 days.
The CAM-M8 (u-blox), the chosen GPS-receiver, has a built-in antenna and is placed at the very top in the electronics housing. At each activation of the module, the current time is checked by the MCU and the corresponding aiding-data from the external FRAM is transferred to the CAM-M8 to speed-up the position calculation. The module’s sleep mode is not used. Instead, it is completely disconnected from the energy storage to save the about 100 the module otherwise would draw.
Activity is detected via an ADXL362 (Analog Devices) accelerometer configured so that it wakes up the MCU when a threshold of motion is detected. A counter is then increased by one and is later reset after its content is saved in the FRAM with the other data.
The voltage of the storage capacitor is measured with the internal ADC of the MCU via an on/off switchable voltage-divider. It is first captured at the beginning of any wake-up-event and a second time right before the MCU goes back to the sleep state. Both values are later saved in the set of measurement records.
Data is transmitted at 868 using the SX1262 (Semtech) chip embedded in a Lambda62 (RF Solutions) module. LongRange (LoRa) was selected for the physical layer and LoRaWAN to send out a package with a reduced set of data. A transmitted package has a payload of 11 B, respectively, 19 B when a GPS position is found. It includes a coarse voltage, the four temperature readings at the harvester-housings, activity, and time difference since the last wake-up. To this data, the LoRaWAN layer adds 9 B on additional information such as device address and a frame counter. As we are using a well documented and widely used technology that is not only compatible with self-deployed stations, already existing networks can receive and forward the data. With that, we connected our tracker to the world-spanning network TheThingsNetwork (TTN).
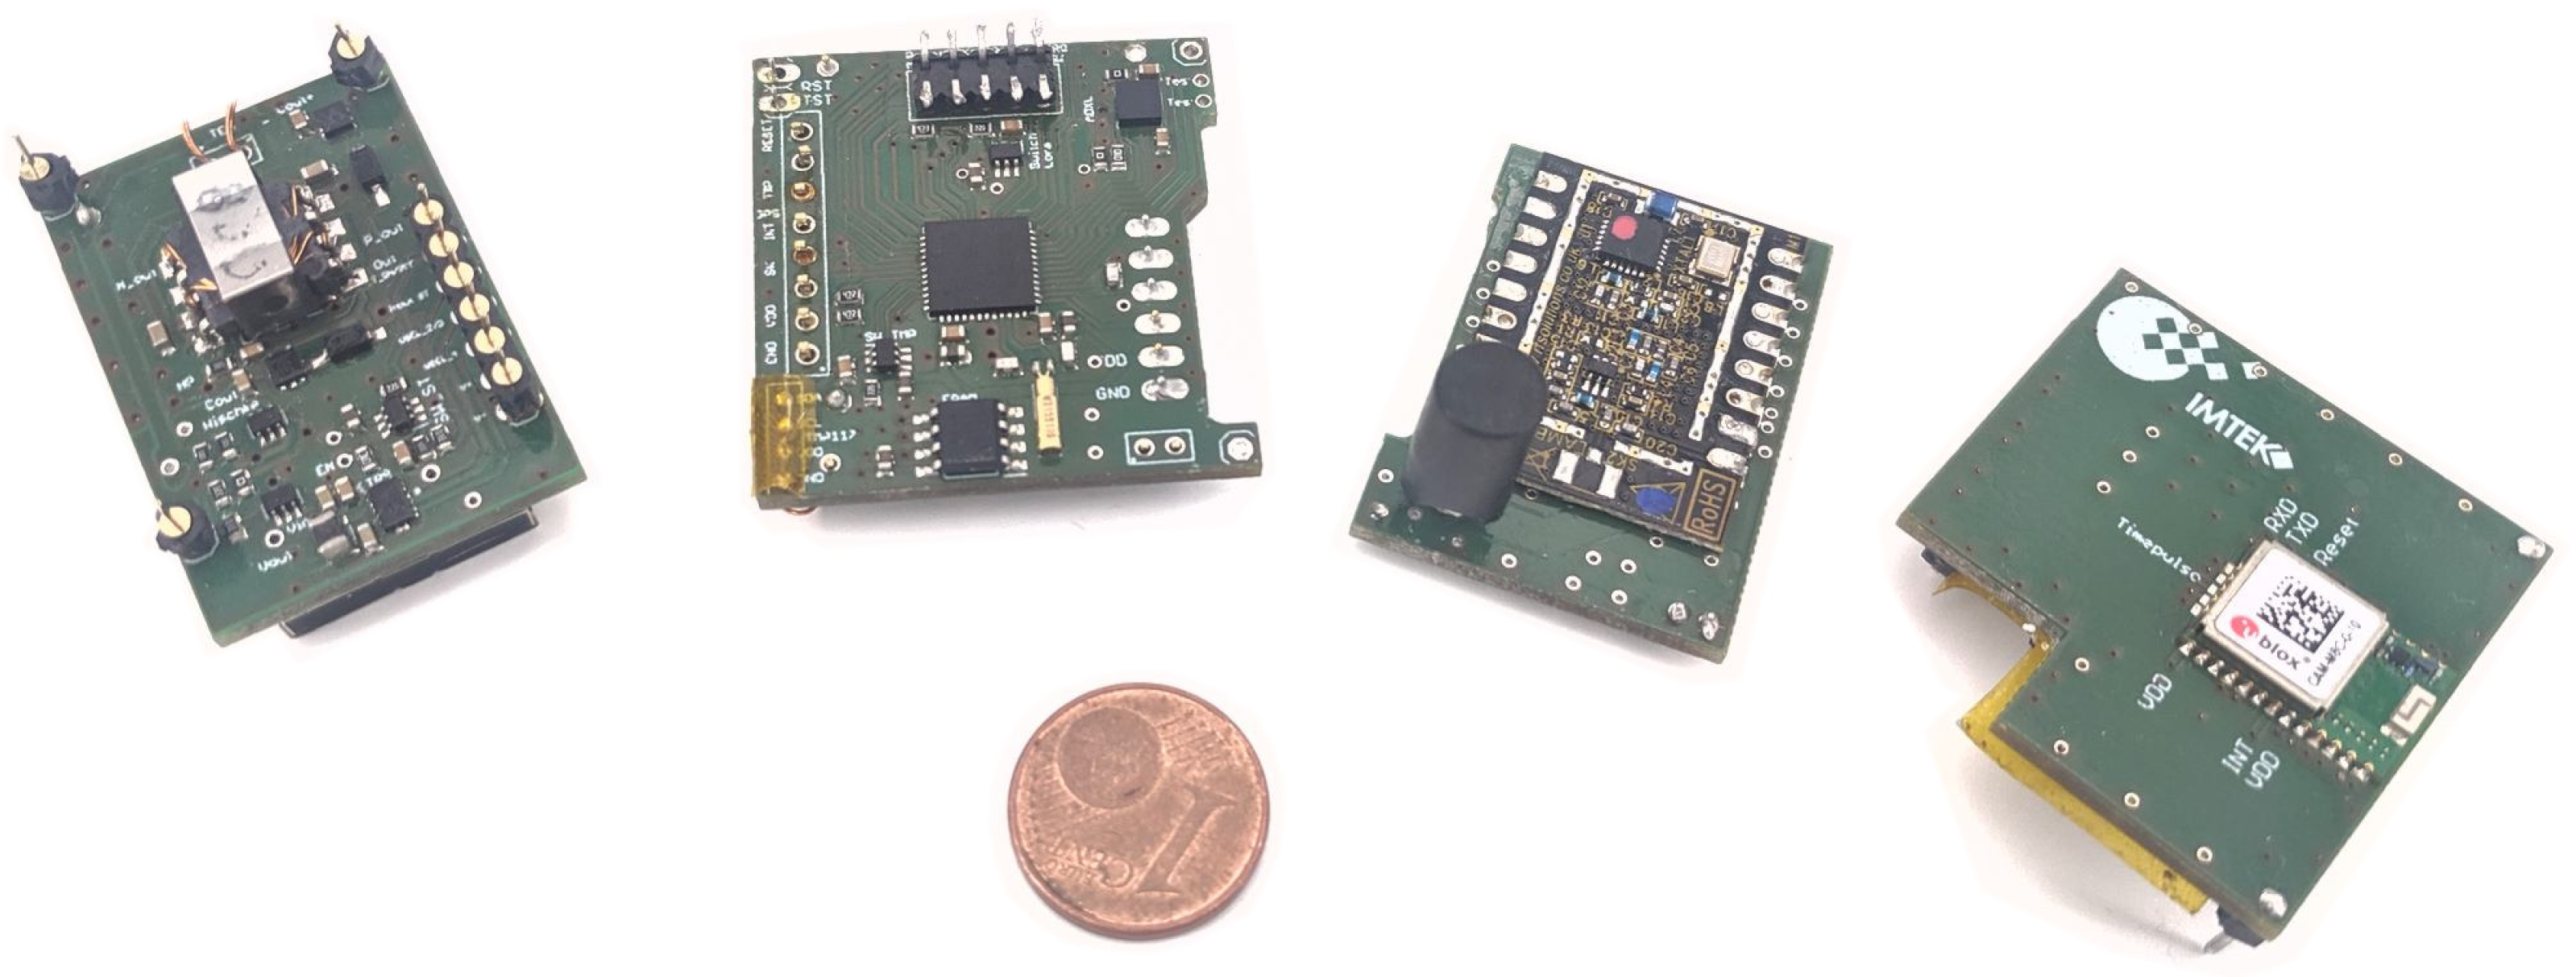
The main system with its periphery, excluding the temperature sensors in the TEG-housing, and power management is distributed over four custom-made PCBs as seen in Figure 7, stacked on top of each other in the electronics housing.
3.4. Task Scheduler Algorithm
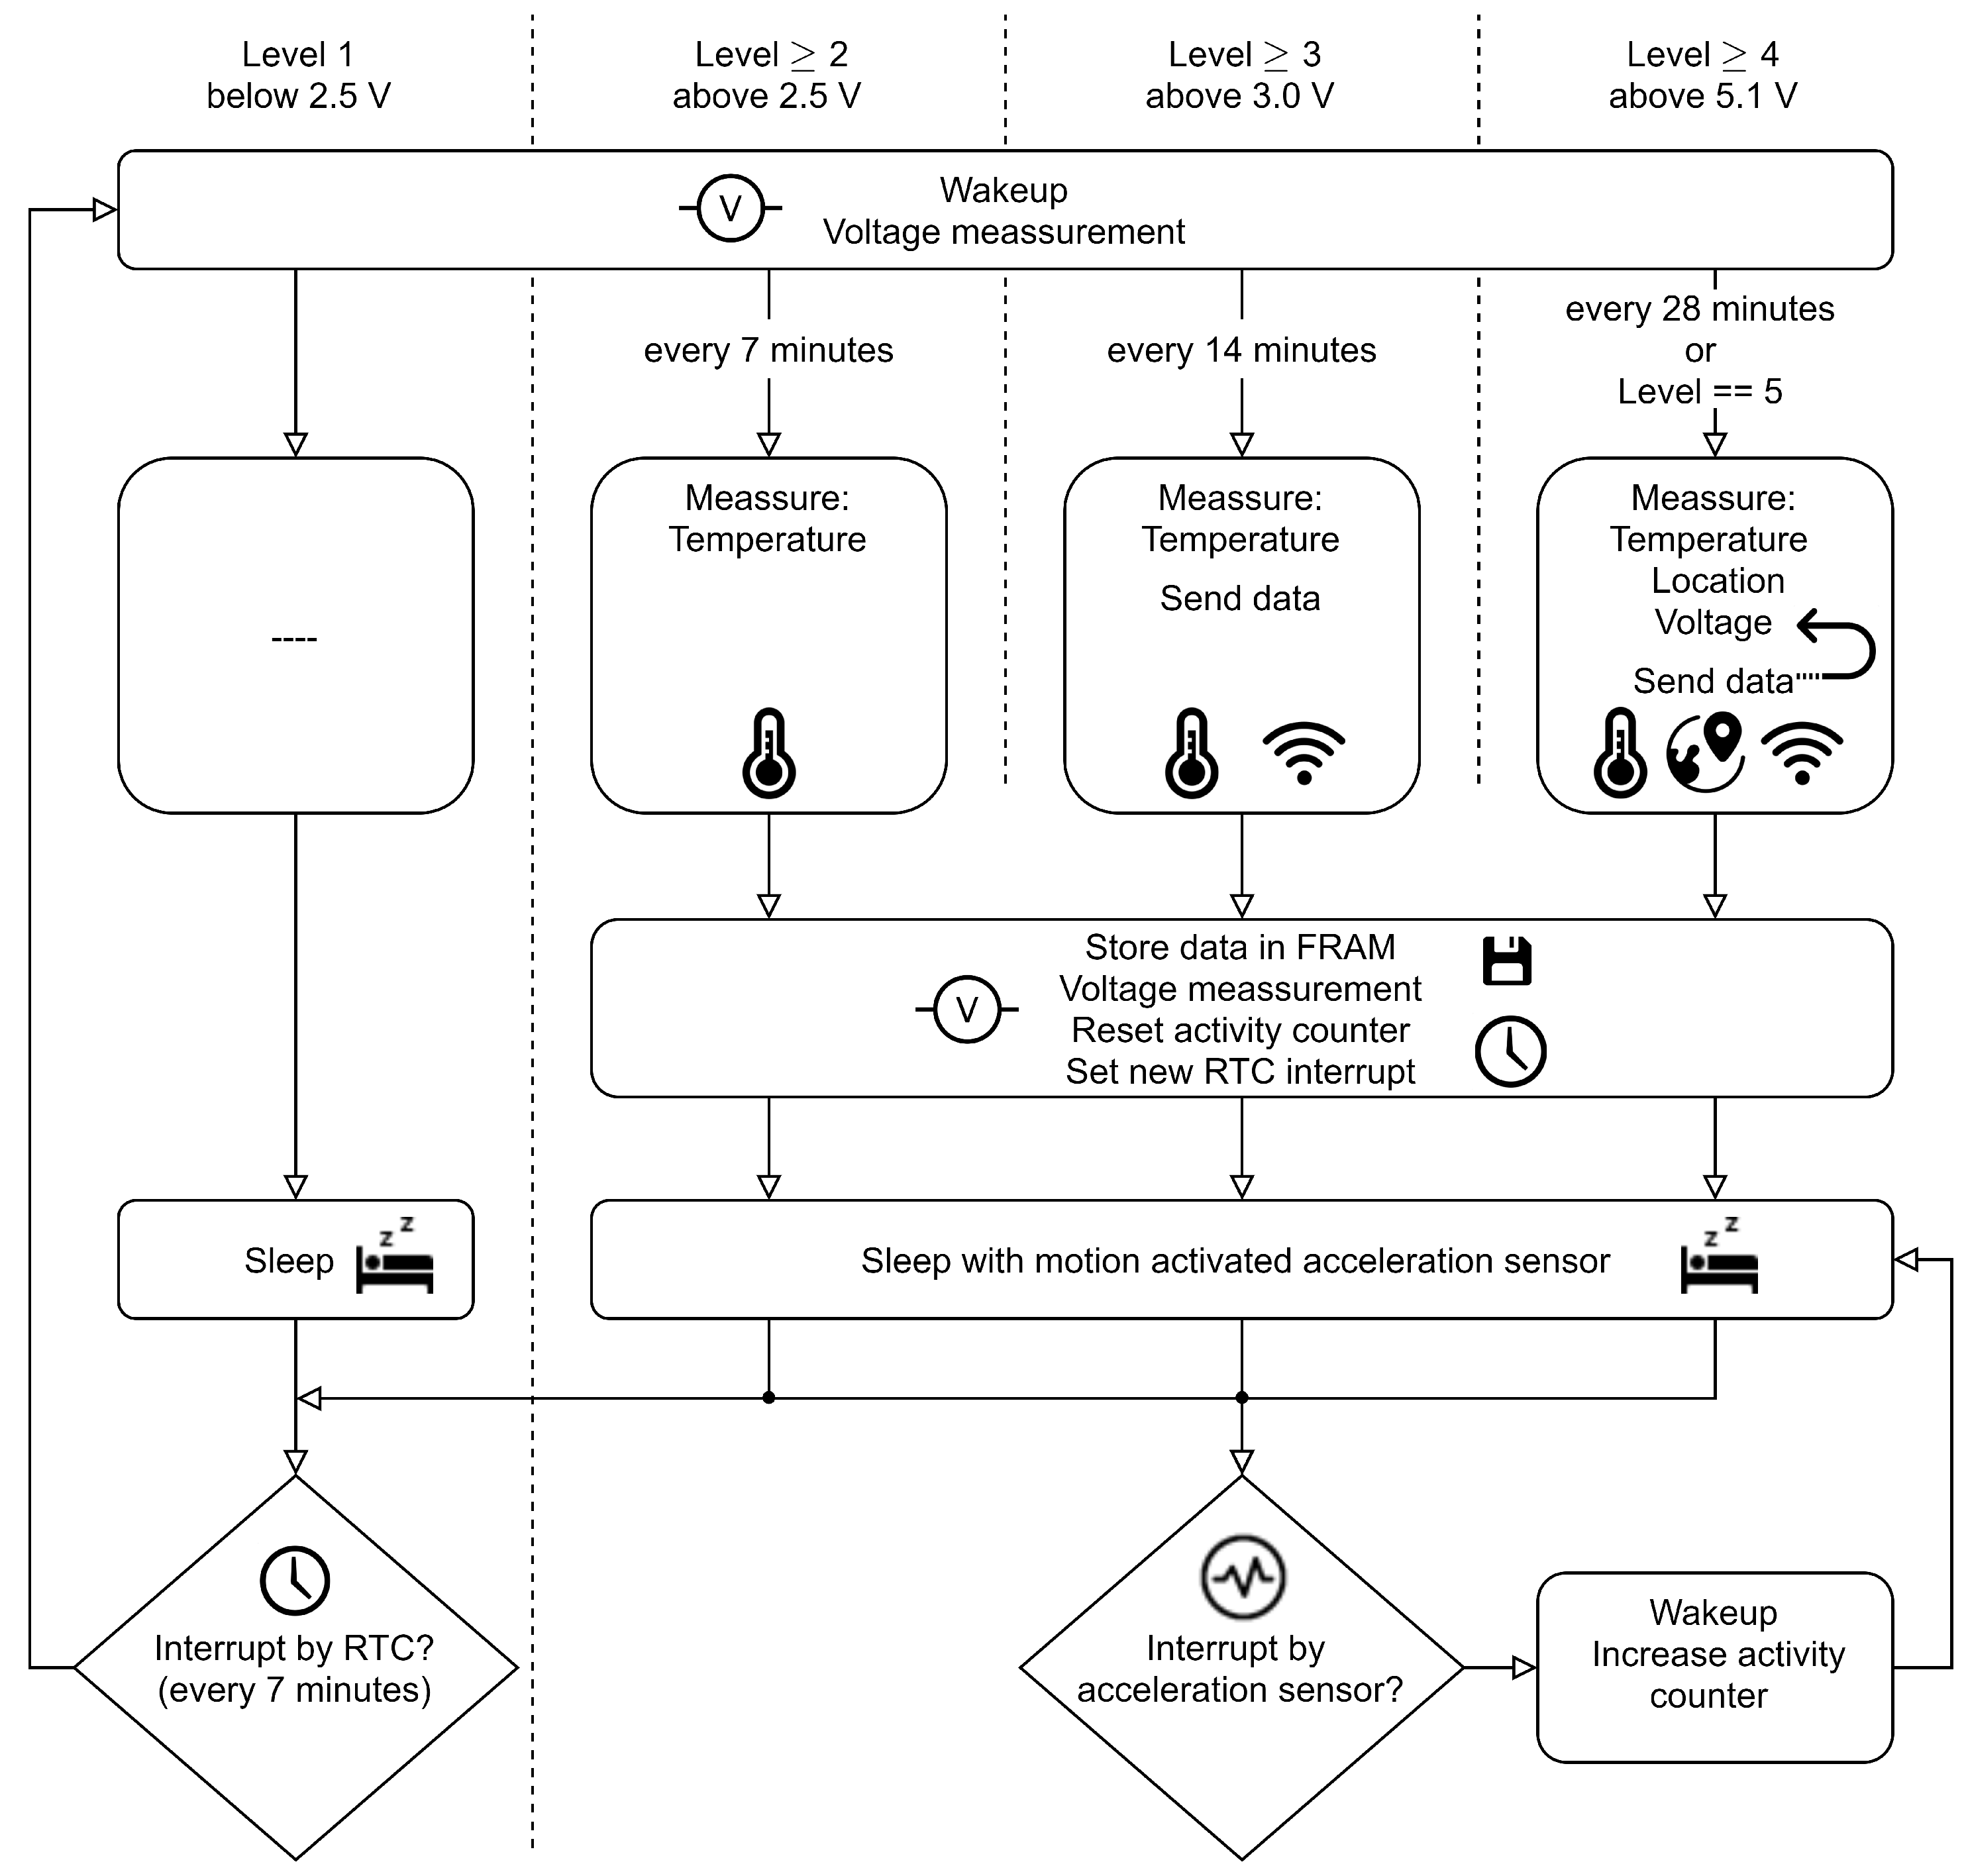
The scheduling of tasks in the main system has a critical impact on the overall available input power. As the TEG-step-up combination will deliver its maximum output power at a capacitor voltage around (see Figure 5) and as no other load-matching is integrated, it is the MCU’s responsibility to track and adapt the load for optimal power. This is achievable by scheduling tasks according to their energy consumption and the current state of charge. High power-consuming tasks are only triggered when the capacitor voltage rises above the respective thresholds. Low-consuming tasks take place at a low state of charge and are done more often to the extend that energy is still saved for a later execution of more energy-hungry tasks. For example, a simple measurement recording happens more often than the dataset’s transmission or a GPS-fix. It is worth mentioning that the system works best as long as there is always enough energy to continuously drive the main MCU with its internal RTC, allowing the collar to track and record time continuously. If the input power is too low and the capacitor voltage drops below , the main system will be shut off hard and will only be reconnected as soon as the voltage is in an acceptable range again. To stay on a point of maximum power and prevent a low-voltage condition, the algorithm chooses between the combination of three defined task sets: (1) the temperature readings of the hot side and cold side in the harvesting housing together with the animal activity, (2) the position calculation, and (3) the transmission of data. For the tasks, five energy levels are defined that correspond to specified capacitor voltages. In addition, a fixed time interval is given for most jobs. A task will be executed if both, the voltage level and the time interval match the settings defined for this task. If the time does not match, the task of the energy level below the current level will be executed. If the voltage level does not match, the task will be skipped and it will be triggered at its next interval. The intervals of the tasks are chosen so that its mean power consumption should be below the energy income. The tasks at levels four and five, acquiring the GPS position, are an exception. In those states, the GPS-receiver uses all available energy until it receives a position or until the capacitor voltage drops below . However, since the voltage in this state is measured once a second, it can also drop down to between two voltage readings. This means that the risk exists that no GPS signal is found and that at least 545 are consumed. Table 1 summarizes the available tasks and the corresponding energy level.
Most of the time, the whole system is put into sleep with all components turned off and wakes up only either because of a RTC timeout or when an activity event is detected. In the latter case, the system only increments the activity value that is later sent together with the rest of the data before it is reset. The flowchart in Figure 8 shows the entire process for all events. To lower the energy overhead for the algorithm, the MCU wakes up only at a very low interval of seven minutes. This reduces energy needed for each wake-up and for capacitor voltage readings, but also restricts the time interval when tasks can be executed to this schedule. For our use case, the seven minute time grid is granular enough to prevent the missing of a capacitor overcharge. It also is relaxed enough to give enough time for charging: At an input power of around 50 , 21 will be delivered to the capacitor per round. This is considerably higher than the energy consumption of the lower-level tasks that are done with the highest possible frequency, allowing us to save energy for the more energy-hungry tasks at higher voltage levels.
To conclude, the algorithm will take care that the voltage of the storage capacitor stays above as long as the power-income is at least 8 . Only the lower-level tasks are executed at low power incomes (between 8 to 9 ), and all higher ones are skipped. The voltage of the capacitor will then oscillate between and 3 . At higher power income, the capacitor will reach voltages up to . If this voltage is exceeded, the capacitor will be emptied down to by the high energy-consuming GPS-fix. Considering the efficiency of the energy-harvesting system, it follows that at a low power income situation, the system will be held in a state with relatively good efficiency according to Figure 5. The overall power could be improved by staying always in the high efficiency point, which was not possible in our case as the capacitor needed to be fully charged to provide enough energy for a GPS-fix. However, various concepts are conceivable to improve the situation, and will be followed in future studies.
4. Field Test and Validation
In a field test, three tracking collars were applied to cashmere goats. Those were able to graze freely on an area of about 15,000 m at the zoo Mundenhof in Freiburg, Germany. The test took place from 26 May to 12 July 2020, with a duration of 17 days.
Two of the three collars were fully equipped as described in Section 3. The third collar, used as the reference, was equipped with a battery instead of the capacitor. In addition, the output voltage of the two TEGs was separately captured via an operational amplifier attached to the MCU’s ADC instead of connecting them to the input of the power management circuit. In a small shelter for the animals, a LoRaWAN-receiver was placed that forwarded all transmitted packets of the collars to a central server via the online service TTN. This allowed us to check the current status of the collars in real-time and to demonstrate the successful functioning of the wireless transmission. The full data set for the analysis was recovered from the internal FRAM of all collars at the end of the field test.
The following data was gathered during the field test: The temperature at the hot/cold side of both TEG housings, the capacitor voltage at the very beginning when the MCU was woken up, and right before the system went again down to sleep, the time of the measurement points, the activity of the animal since the last measurement, status information about the GPS module and eventually the animal position. The ambient temperature, wind speed, and other environmental parameters were taken from the meteorological city station Freiburg, located around 5 away from the animals shelter.
The average ambient temperature during the experiment was about , with a maximum of 28 on 2 June 2020 and a minimum of on 31 May 2020. On 6 June 2020, rain started with at least 1 mm/d until 10 June 2020, with a peak of 19 mm/d on 5 June 2020.
4.1. Results
Not all collars worked over the whole period. One collar was already heavily damaged after two days and was therefore removed. The second collar lost connection to one of the two energy-harvesting housings after five days and stopped collecting data after seven days. We also removed this collar the next day, as this was due to the same issue: The connection between belt and housing broke, and so the collar was held only by the electrical wiring between the housings (see Figure 9b). The reference collar, which was battery-driven, lasted fifteen days until one harvesting housing got loose in the same way. Although contact to the goat was from then on degraded, it was still working until the end, held only by the electrical wiring. Apart from the mechanical issues, all collars could harvest enough energy to constantly work without any interruption of the system, especially the RTC. During the 166 run-time of the first tracker, 110 attempts for a GPS fix were made. The second tracker attempted 48 times for a fix during its total run-time of 54 . In both cases, enough energy was harvested for a GPS-fix each 1.1 to 1.5 . Each GPS-fix used around 620 . The scheduler started a major part of the GPS attempts because the capacitor voltage level reached the maximum allowed value (see Table 1). This happened mostly during night—at daytime, a high amount of scheduled fixes were omitted as the voltage was too low.
About 1429, respectively, 443 data points, were recorded in the FRAM by the energy-autonomous collars. The reference collar saved the maximum amount of 3252 datapoints and therefore started to overwrite the oldest data. Every collar was able to keep the intended seven minute record interval, thus having a high temporal resolution for the temperature and activity readings.
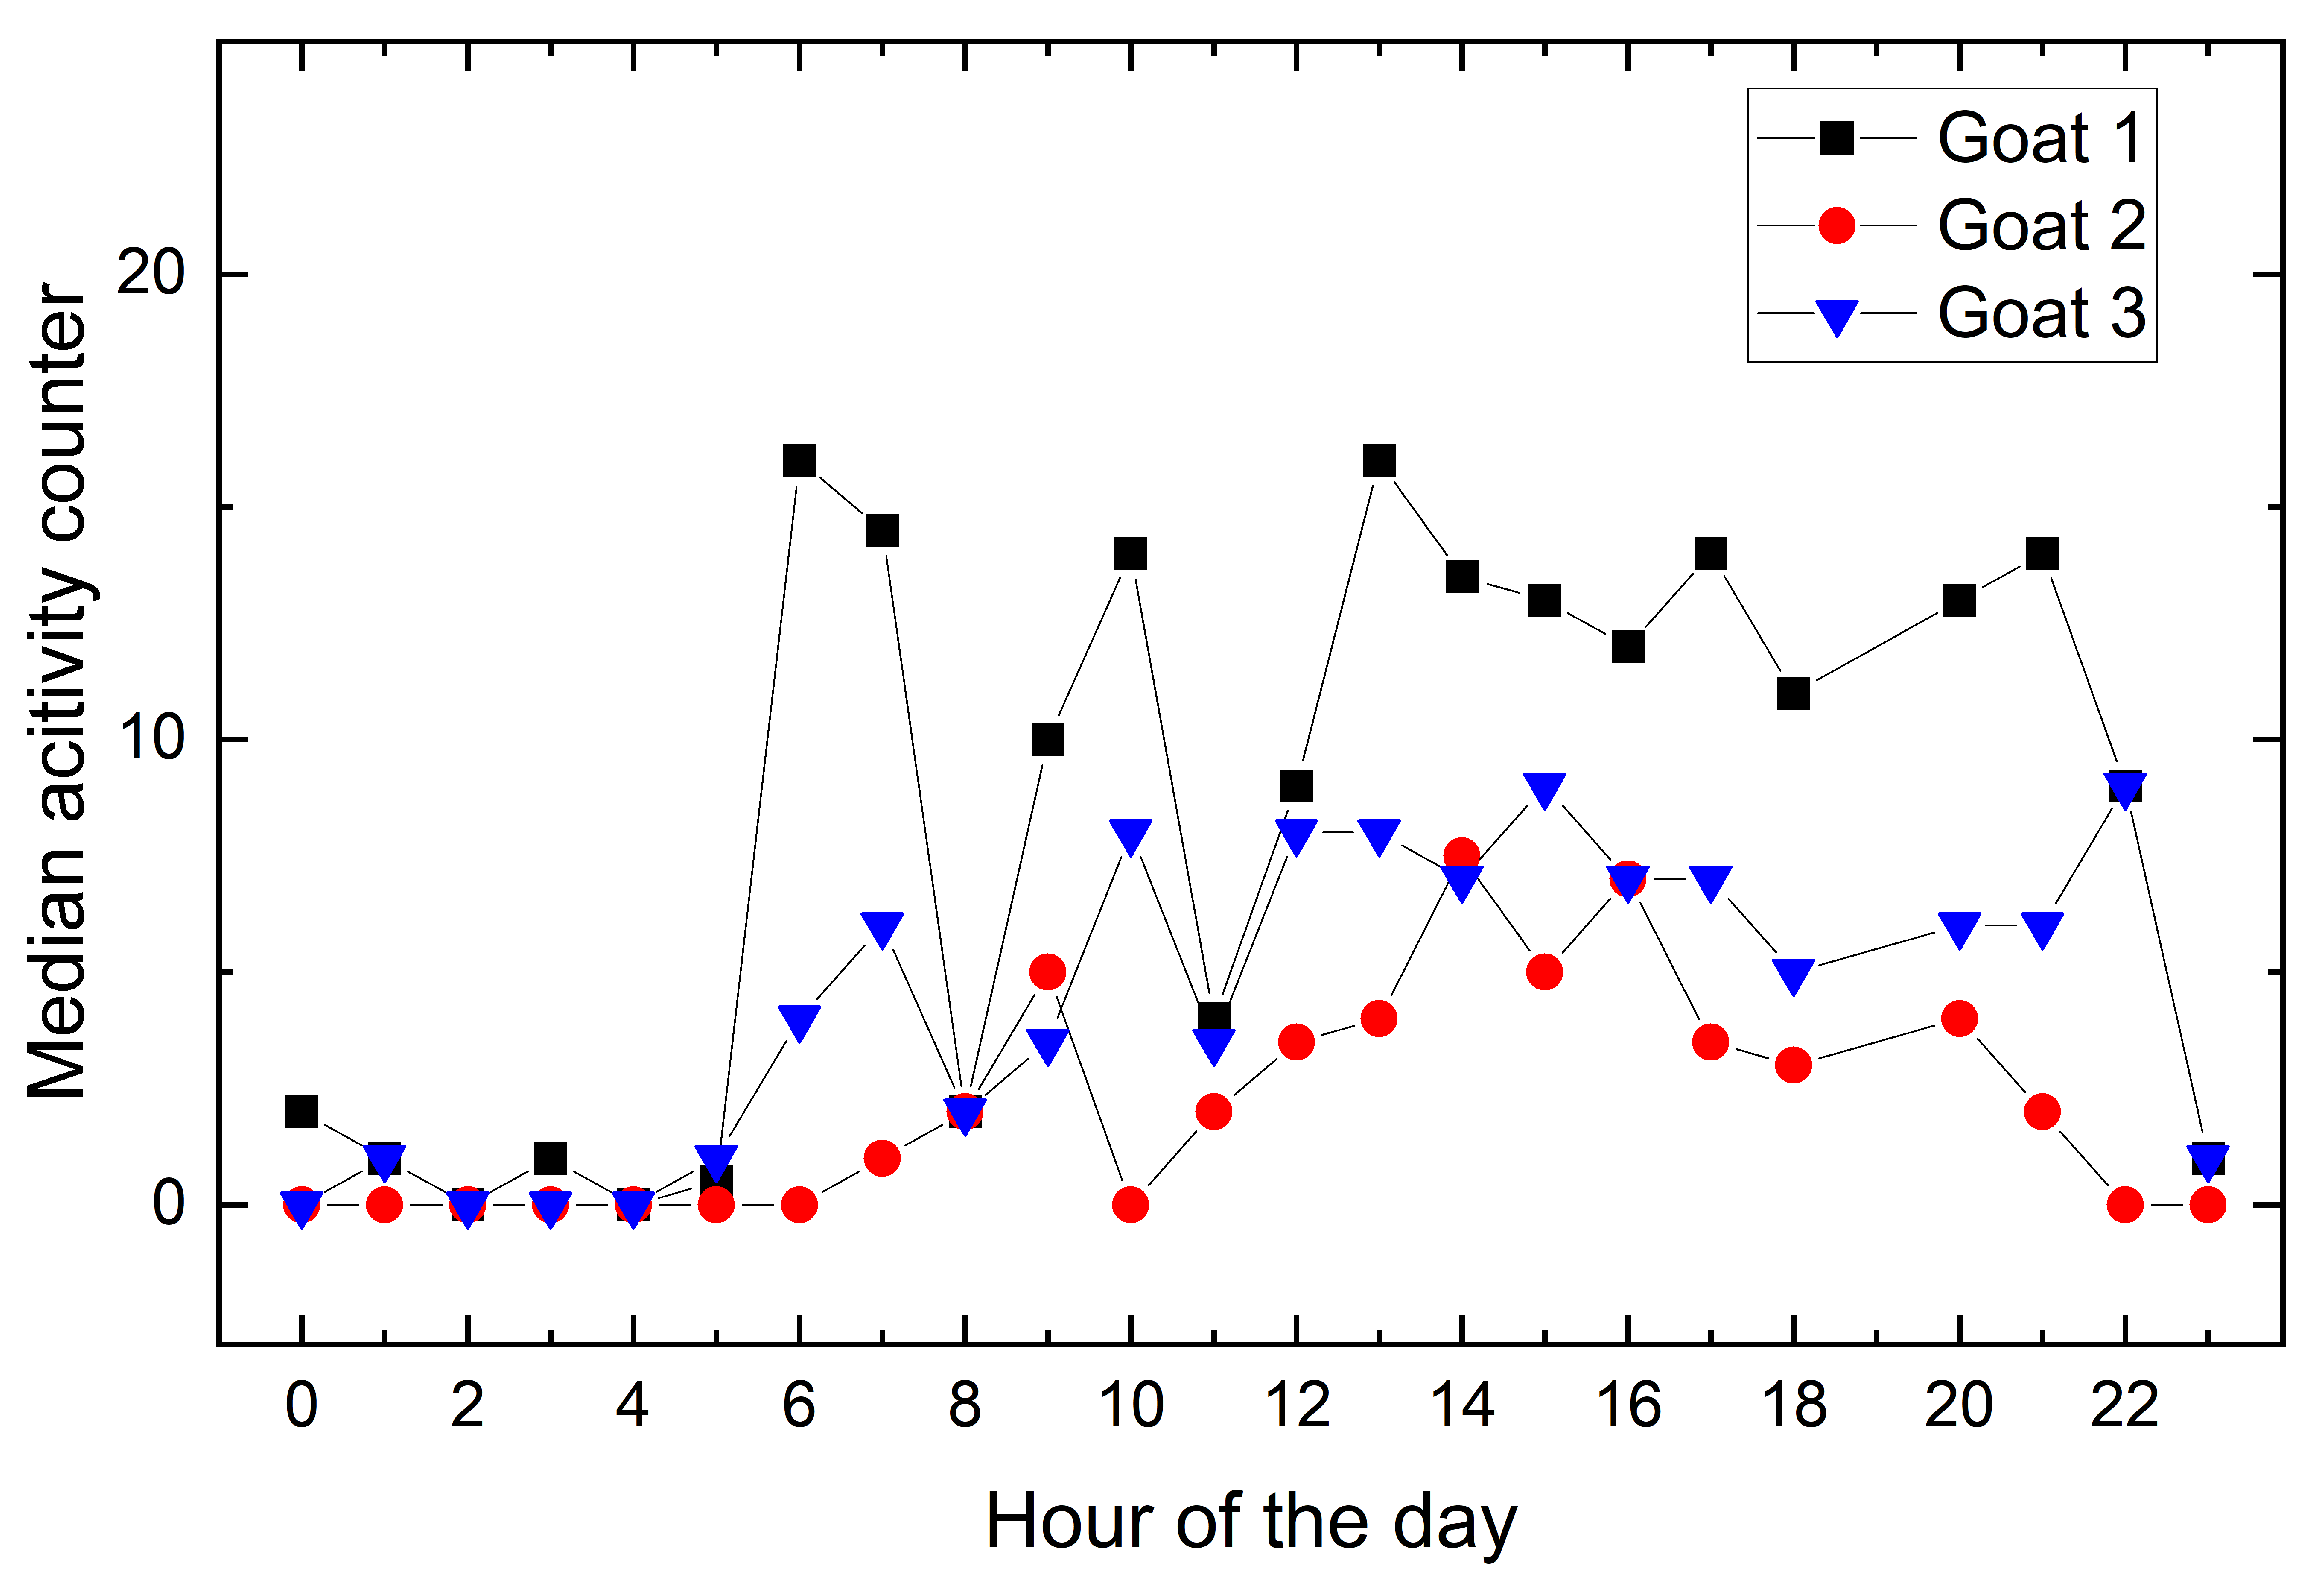
To compare the goats’ activities, the number of detected activities are binned to each hour of the day. Figure 10 shows the median of each activity bin over all recorded days and goats. The number of days included in the figure is different for each goat. The median activity of goat two only includes two days, while for goat one and three, seven, respectively, fifteen days are taken into account. It can be concluded from the activity data that the goats are mainly inactive between 23 and 5 o’clock. A lower measured activity in the time from 8 to 9 o’clock correlates to the feeding time of the goats, demonstrating that the daily routine of the goats can be revealed by the activity sensor.
4.1.1. Temperature Distribution
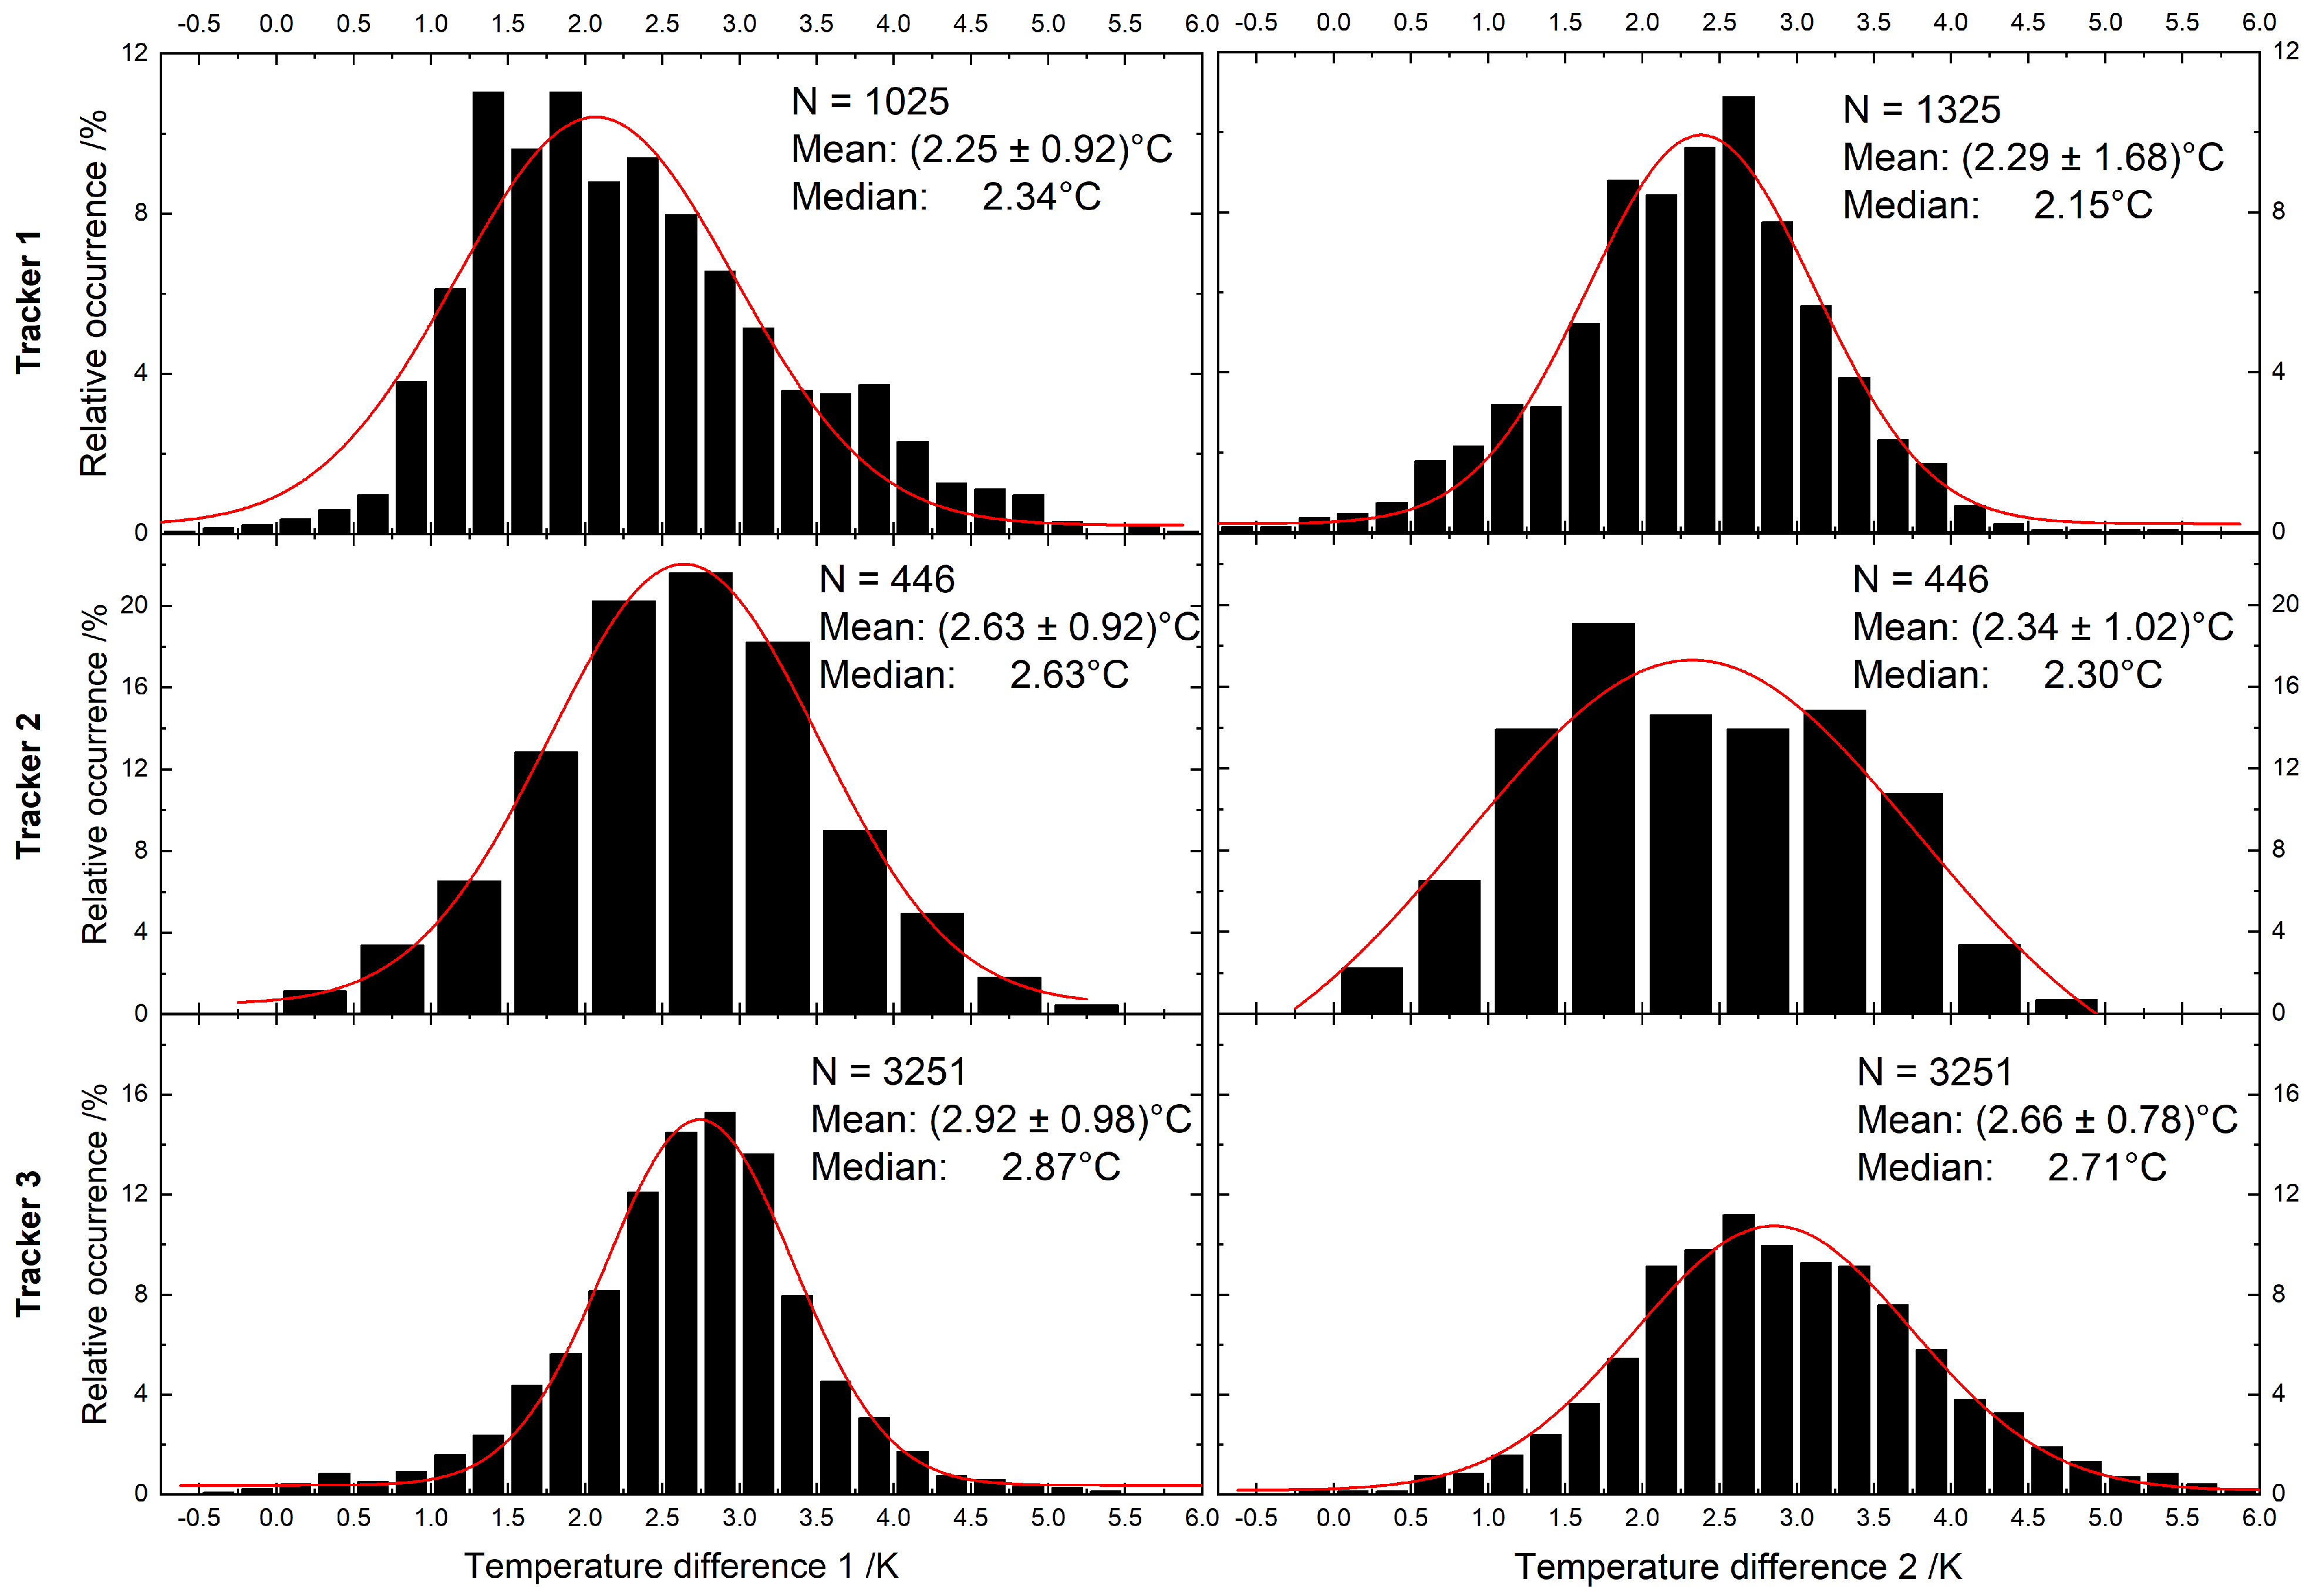
The average temperature-difference at the TEGs of each harvesting housing is with maxima between −0.5 to 6 . Their distribution for each of the six harvesting housings is shown in Figure 11. Here, it can be seen that the temperature differences follow a normal distribution without a lot of extreme temperatures.
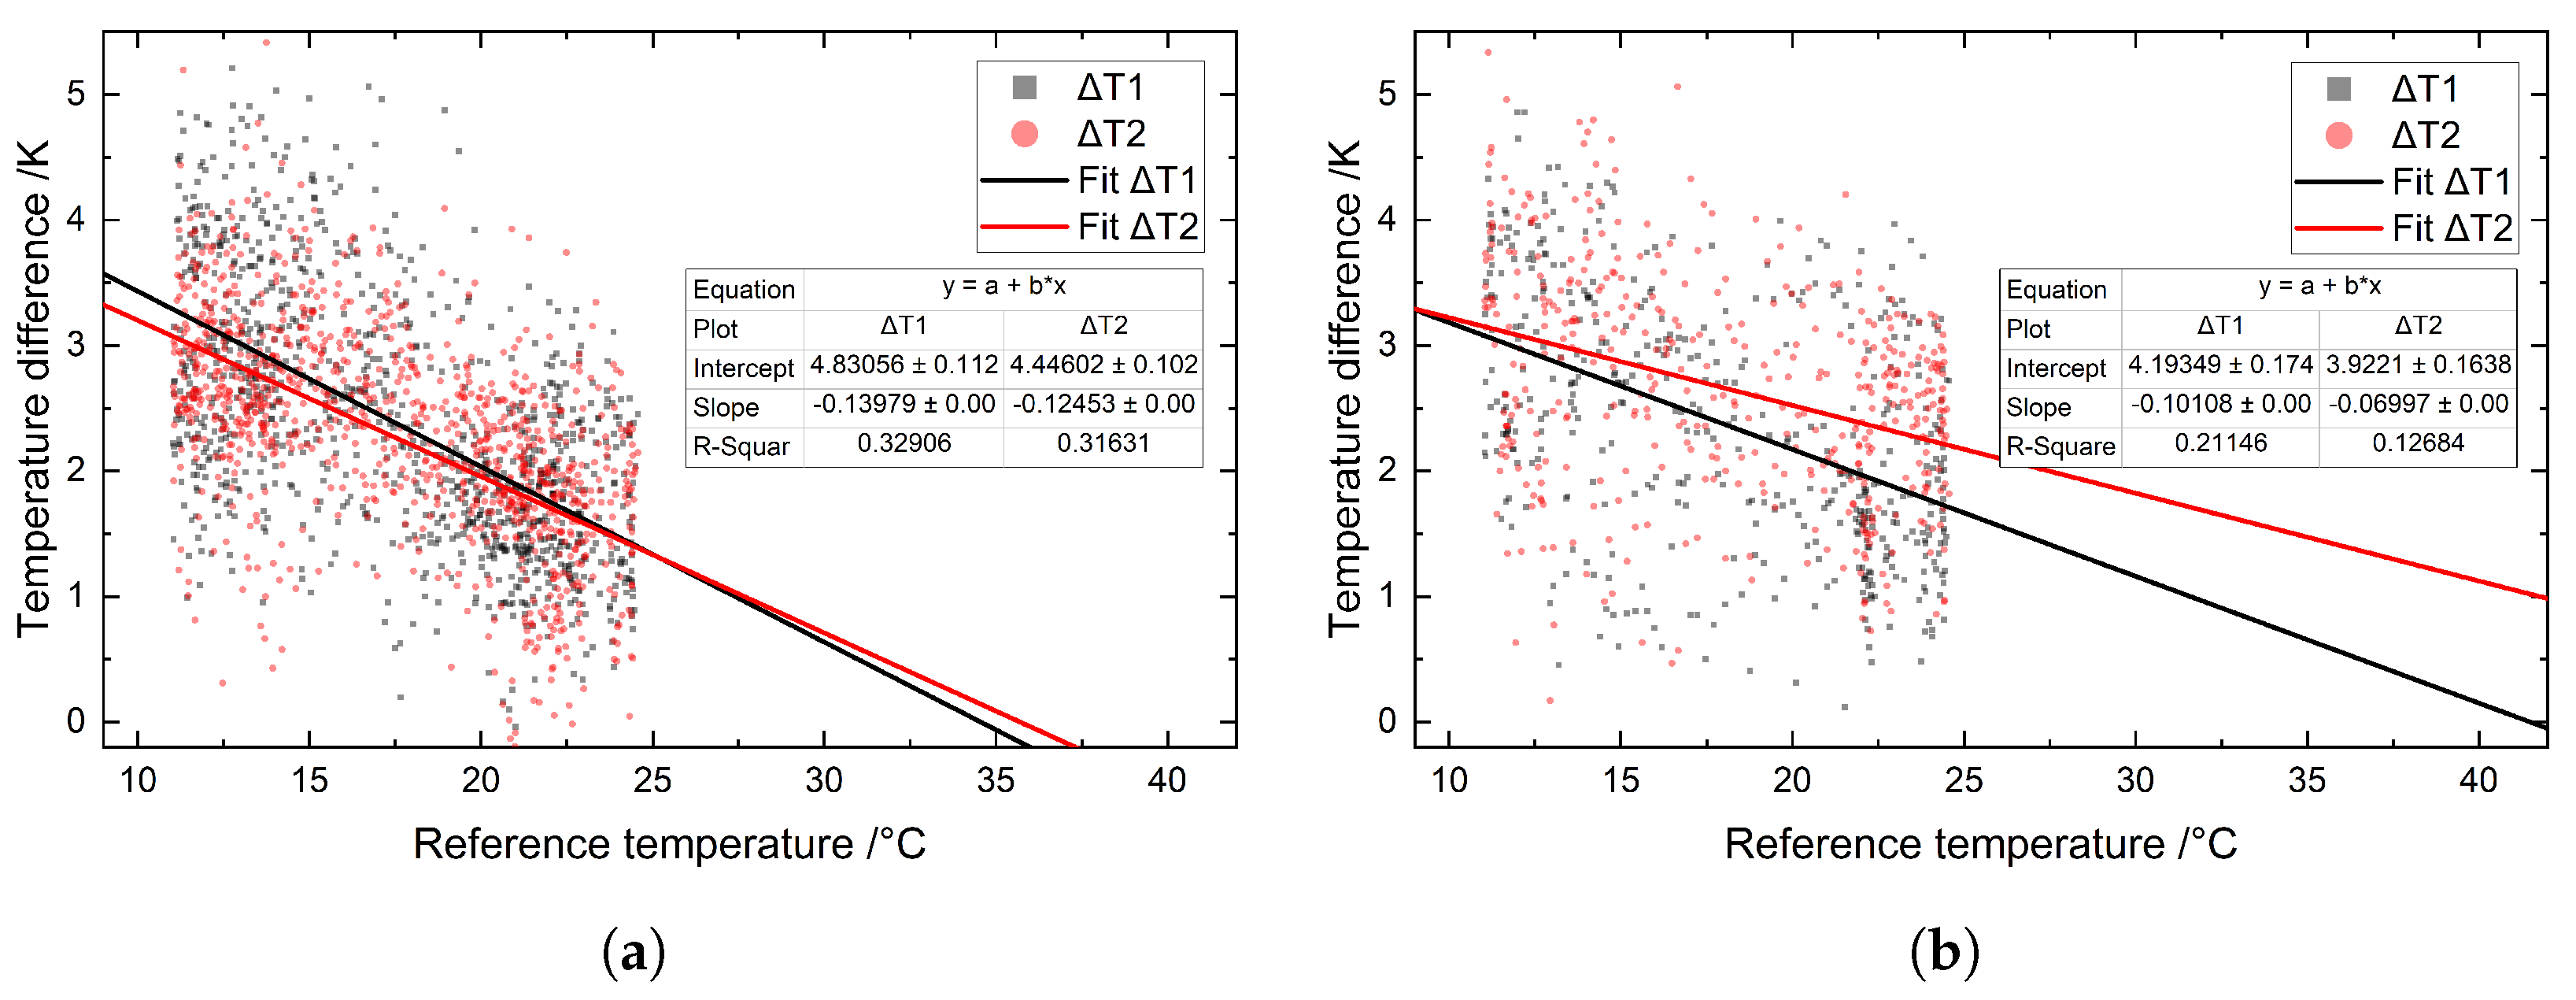
The temperature difference at the TEG () against the ambient temperature () is shown for the first goat in Figure 12a. Despite the large variety of , the trend reveals that lower ambient temperatures lead to higher and vice versa. To check for plausibility, a linear regression on and is done to derive the point of the x-axis intercept, at which ambient temperature equals the animal temperature. The linear relationship can be modeled by Equation (4) as long as constant thermal resistances are assumed and the ambient temperature deviation is small. In this case, the equation describes the thermal path from the animal’s inner body as a heat source through the thermal resistances (,,) to the environment according to [13].
The results should be close to 39 , which is the core body temperature for goats [33]. Indeed, the results are in the same range with / for goat 3, and / for goat 1. The second goat had the least number of measured points recorded, and its collar got loose in an early stage of the experiment. This might be the reason why the calculated body temperature of the animal results in / . The large variety of obtained results was expected, as especially the thermal resistance of the heatsink varies due to wind speed or other environmental factors such as rain or sun. Above these temperatures, the ambient temperature is higher than that of the animal. The gradient and thus output voltage of the TEG would reverse and cannot be used by our device.
4.1.2. Charging Power
The usable input power of the system was always greater than the power consumption; thus, measurements were recorded at an interval of 7 , as desired. To calculate the mean power income, the difference between the capacitor voltage right before the MCU goes to sleep and at the very beginning of the MCU’s next wake-up is taken. Together with the known sleep-time and capacity, the power income is calculated. In the same manner, energy drawn by the system in its on-state is derived.
For the mean input power calculation, measurements right after a GPS fix are excluded as the capacitor shows a significant recovery effect: A test in the laboratory revealed that after a high and long current draw, here about 30 for 20 when GPS is used, the voltage of the capacitor slowly recovers within several minutes. As the input power is derived from the voltage right after the high load and again after seven minutes, these points show unrealistic high charging powers above 300 . In addition, six measurement points of the first tracker and four of the second tracker were excluded as those were showing excessive power drain. We suspect that at those points, returning the full system into deep sleep, did not fully work. In total for goat 1 and 2, respectively, 1268 and 390 data points are used to calculate the mean charging power stated in Table 2.
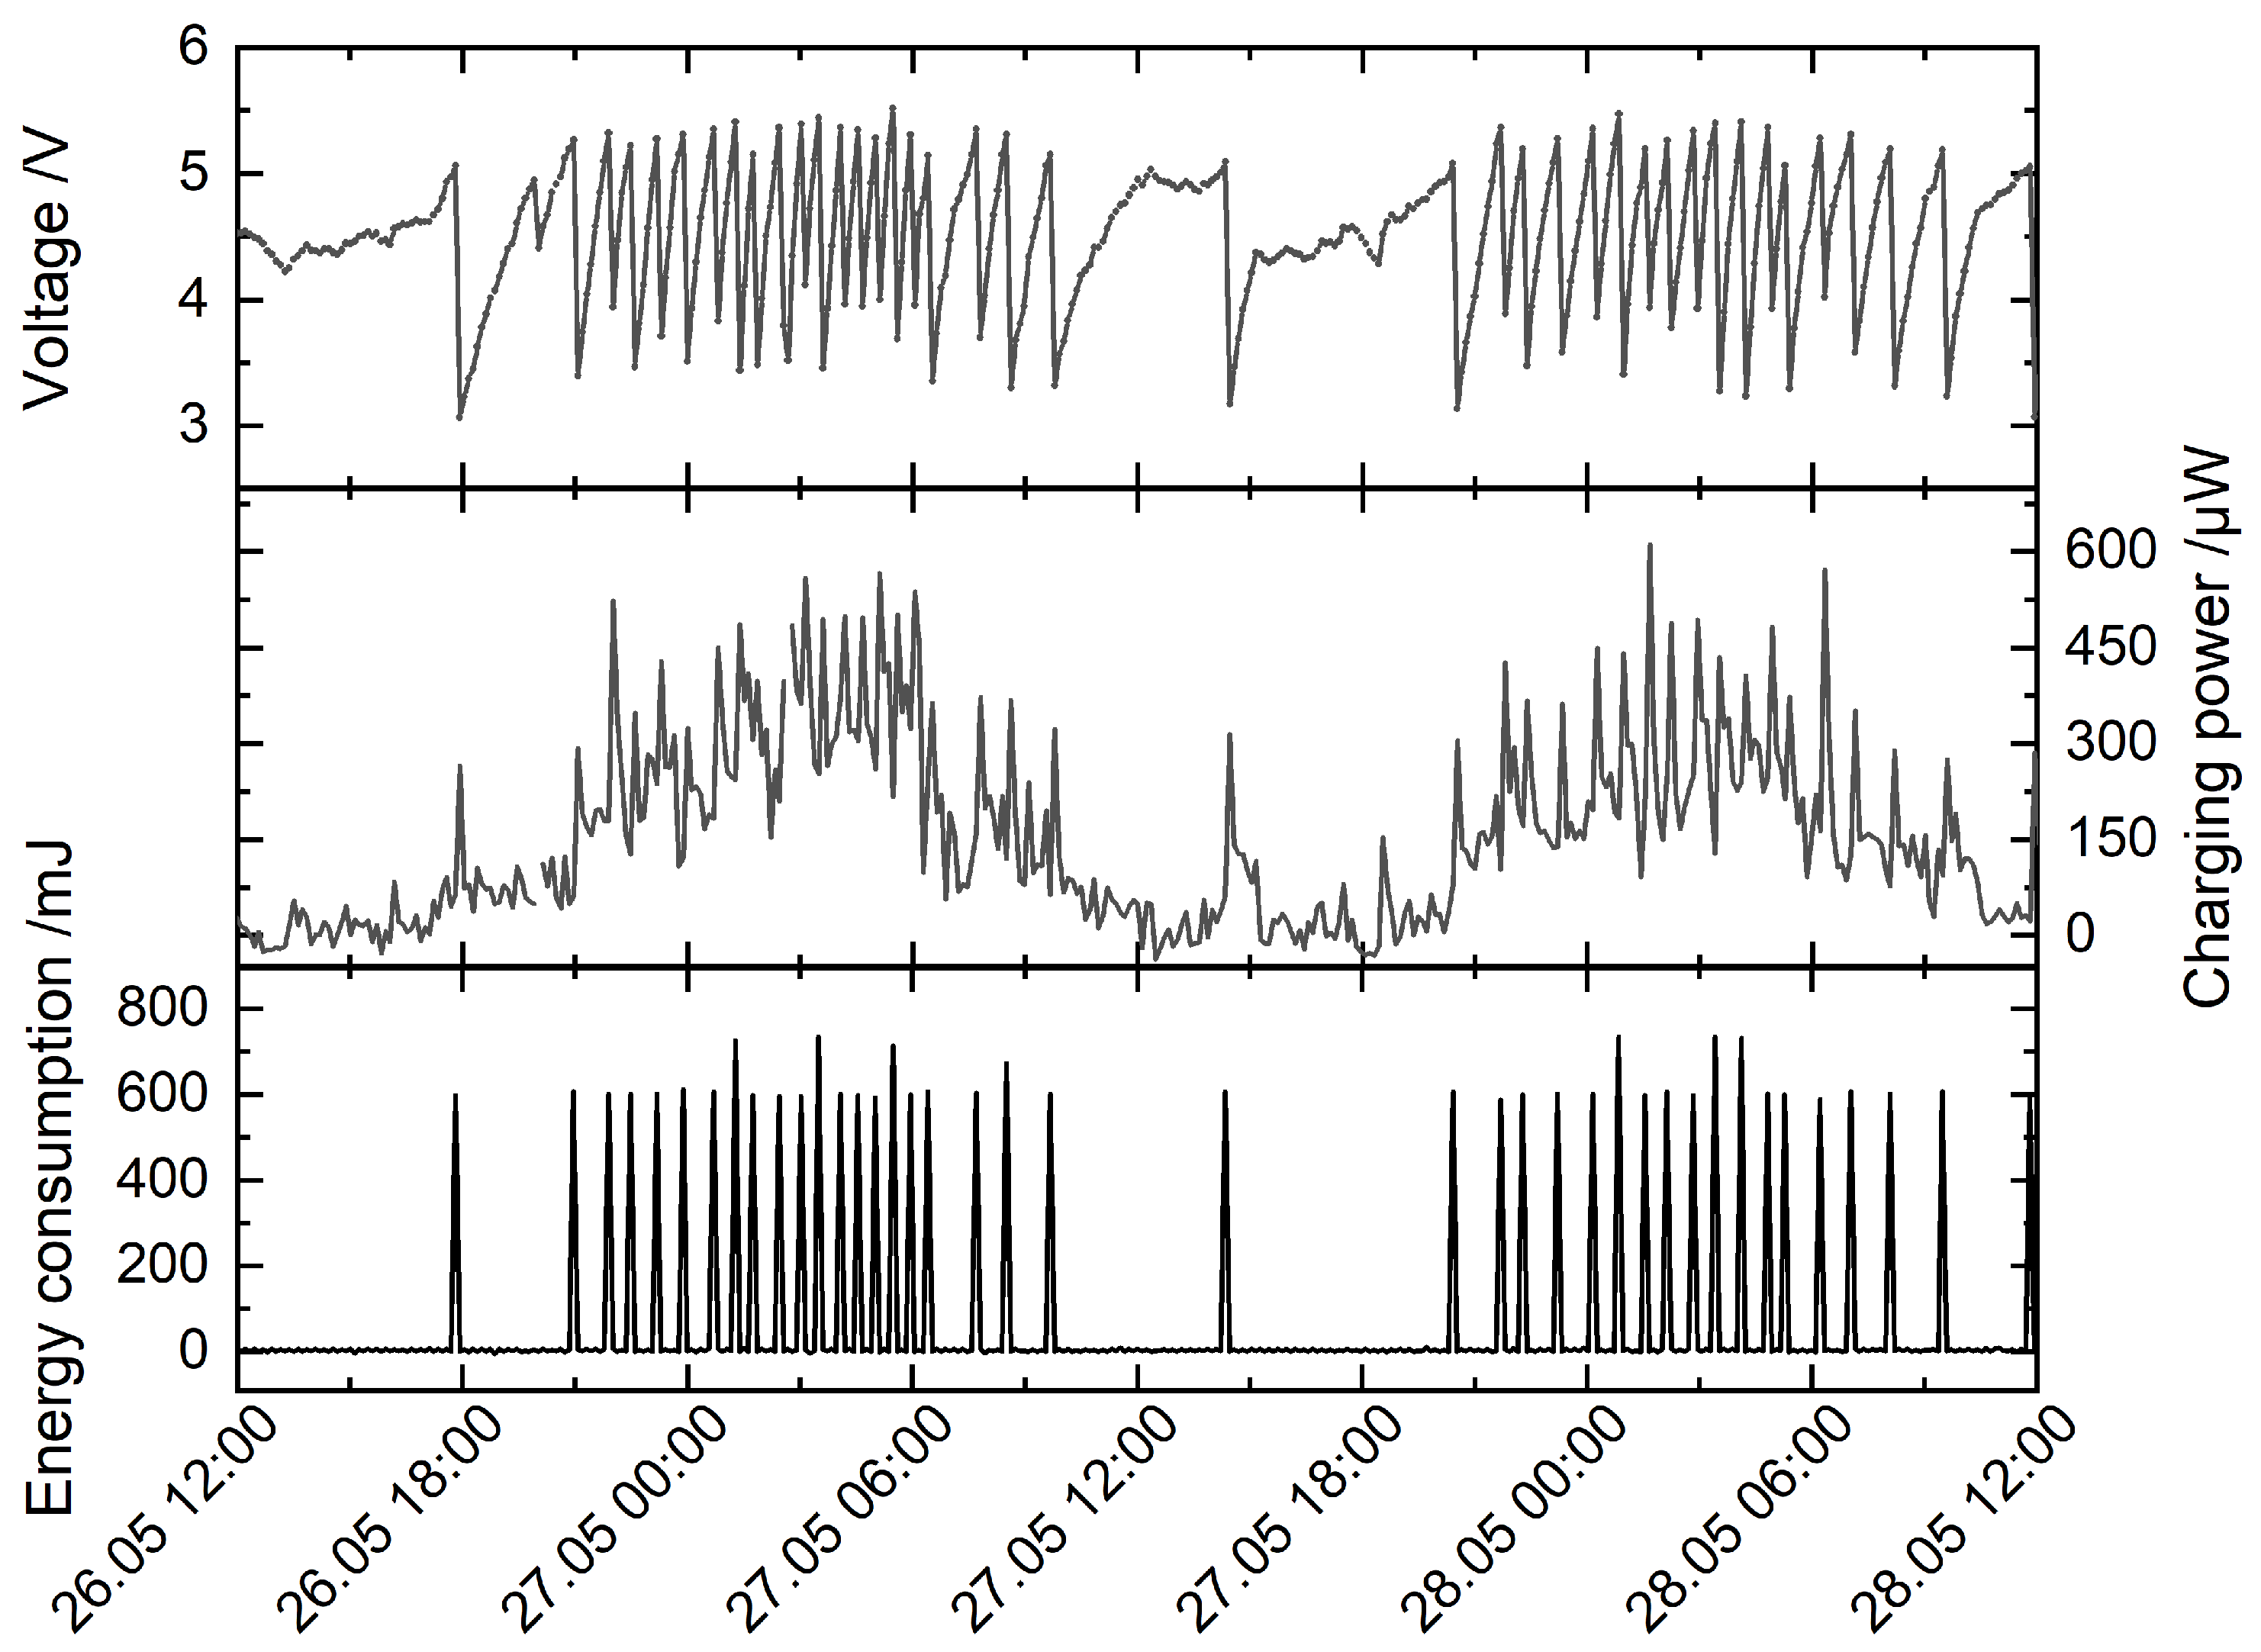
There is a daily period for the power income: It is higher at night than at daytime. Two exemplary days, with their charging power, capacitor voltage and energy consumption are presented in Figure 13. The plot in the figure for the charging power is not filtered, and therefore the erroneous peaks right after a GPS are included. Each GPS event is clearly noticeable by peaks in all three graphs. As the MCU schedules GPS fixes according to the time and voltage of the capacitor (as stated in Table 1), more positions are obtained at high input power phases. Here, the capacitor is emptied to the absolute minimum. However, the maximum voltage is likely reached in a short period where GPS is turned on again.
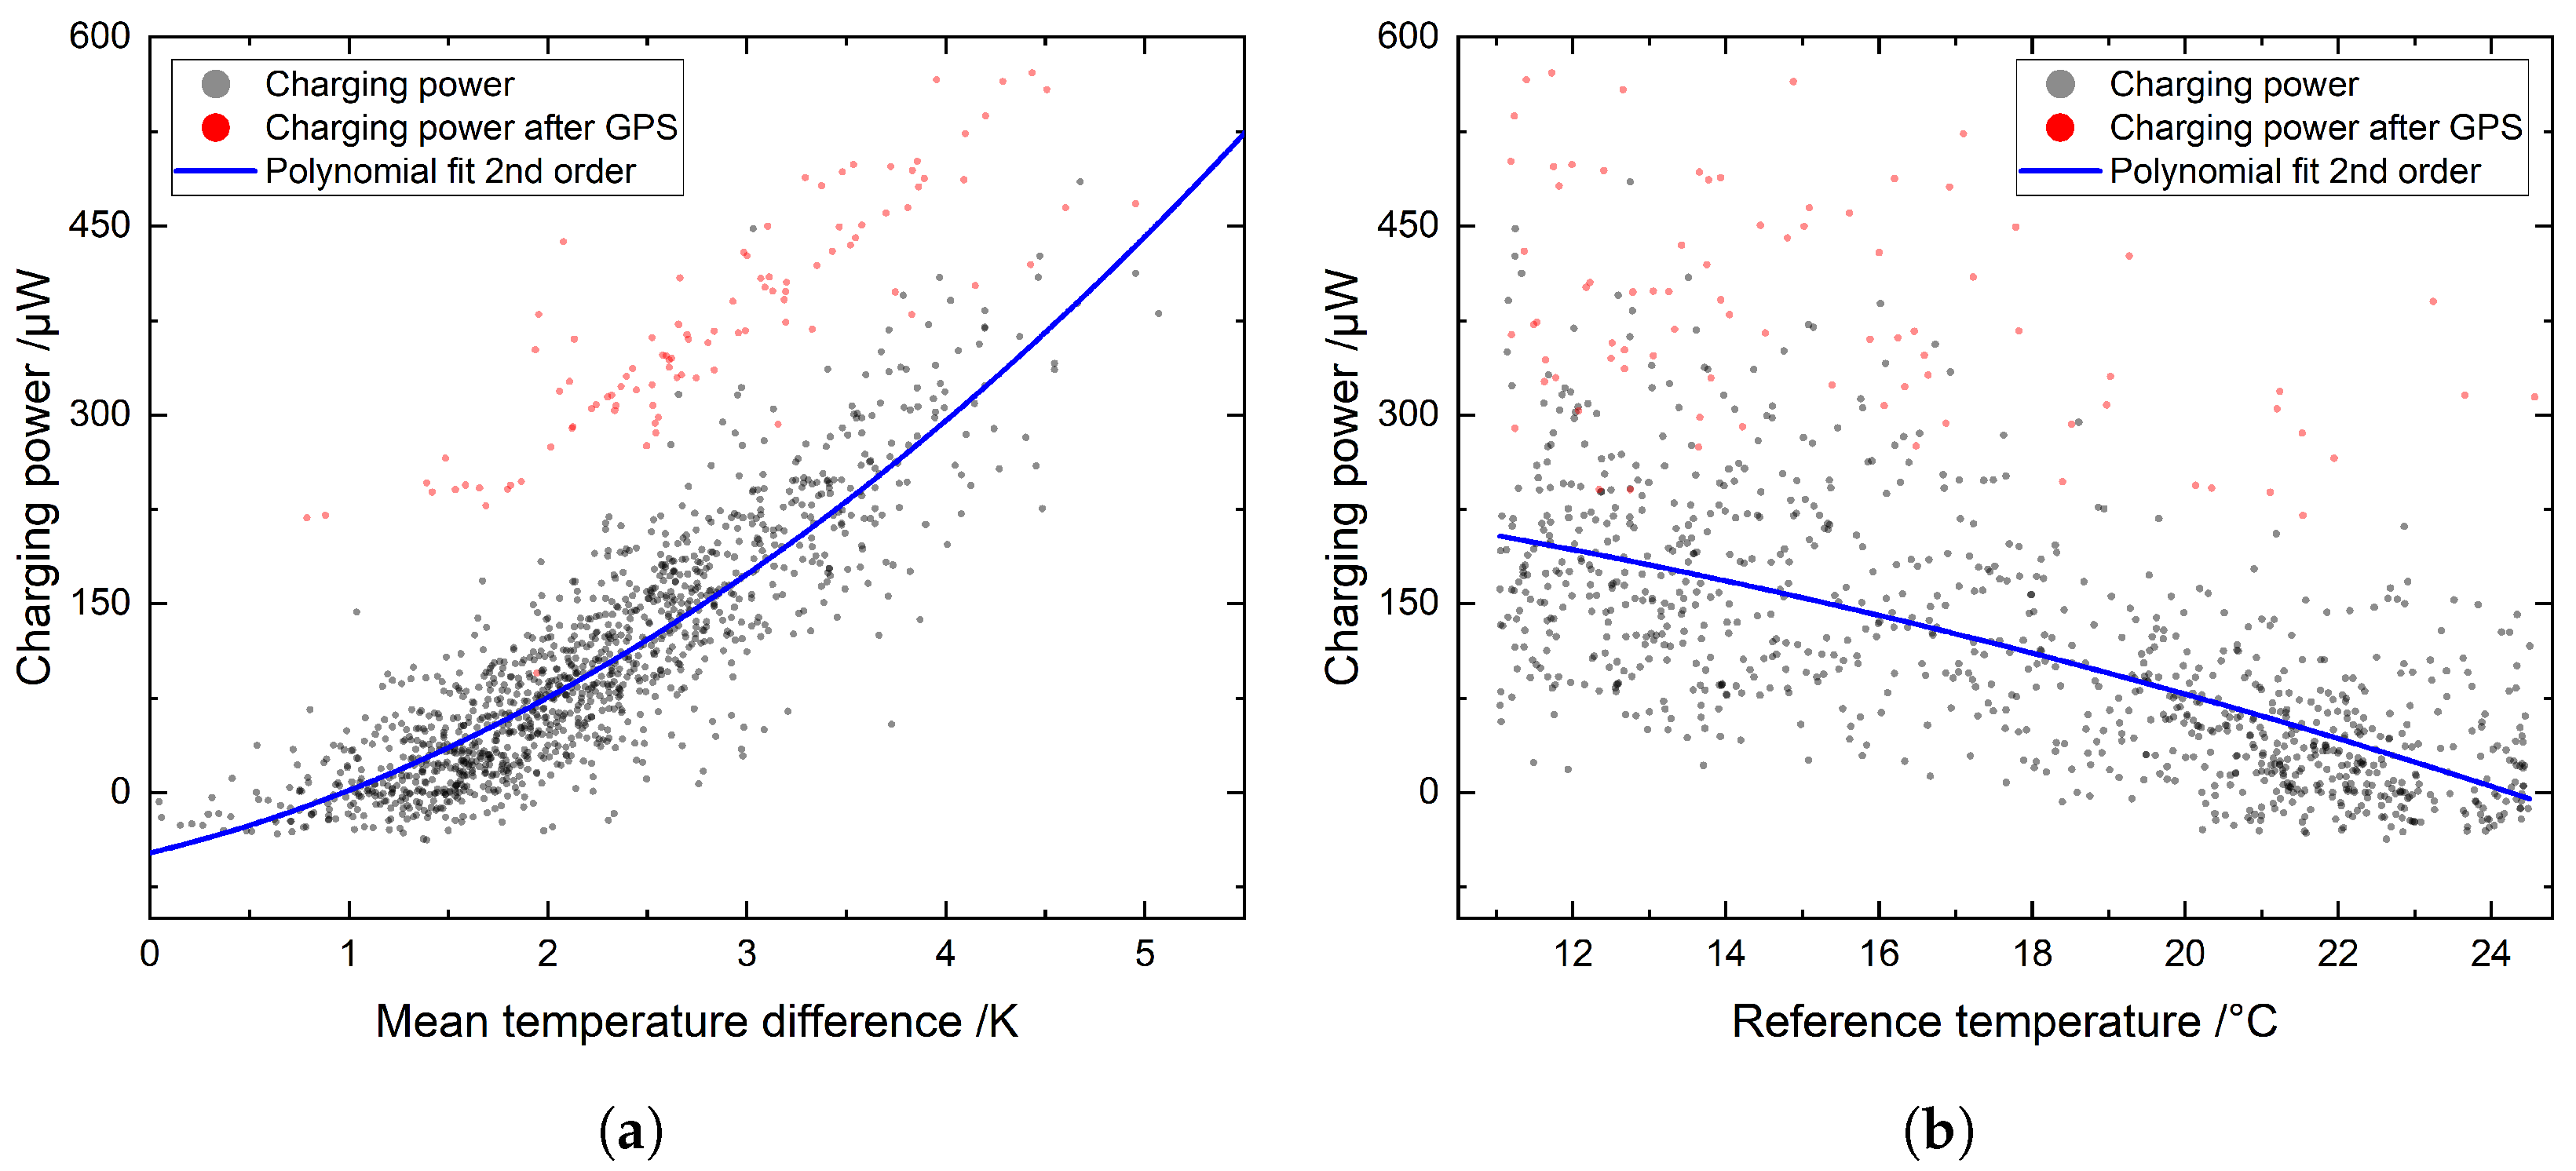
Charging power is directly dependent on the and thus on ambient temperature. We found that the system has a positive power income, including the power and conversion losses, down to a of () at the first goat and () at the second goat. It follows that the system installed on goat 1 and goat 2 can run on a maximum ambient temperature of () and () , respectively. These points are calculated via a 2nd-order polynomial fit on the recorded charging power and temperature at the TEGs. Again, all data points after a GPS fix are excluded. The measurements and their corresponding fit are shown in Figure 14 for the first goat. These values should be used with caution: The erratic influence of environmental influences such as wind-speed or local deviations from the recorded ambient temperature lead to non-constant thermal resistances, which was assumed for the calculation. Another impact is the change of thermal connection to the animal that happened, especially for the second collar that got loose during the field test. It is worth to mention that the charging power is also dependent on the state-of-charge of the capacitor at the time when the measurement was taken.
5. Discussion
The field test of our designed animal tracker proves that thermal harvesting systems can be used for tracking devices at warm-blooded animals. An average of 100 is suitable for systems that spend most of their time in sleep. With a GPS-fix every 1.1 to 1.5 , our system fulfills the requirements of typical tracking devices, in which the position calculation is executed once per hour or even less. In our field experiment, nearly none of the GPS fixes were successful, this, however, is due to the poor antenna design and position: First, it turned out that a high damping of the satellite signals is introduced by the narrow housing, 3D-printed from photopolymer, around the antenna. A further issue was the size of the electronics ground-plane that did not meet the GPS-module requirements according to the datasheet. The same issues also degraded the range of the used LoRa-modules to less than one kilometer, although an output power of 15 was set, which generally would have allowed remarkably higher ranges. The mentioned issues could be solved in a system that takes the antennas parameters into a better account and uses, for example, the animal’s body as a ground reference.
Our setup uses a harvesting area at the animal of 2 × and a total weight of 286 . It has been proven that if loads carried by the animal are below 5% of its weight, they have minimal impact on the animal’s health and behavior; however, their influence may not be negligible [2]. From that, it follows that our system is already suitable for smaller warm-blooded animals such as the lynx. Higher input power can easily be achieved for larger and heavier animals with larger harvesting areas but higher system weight. The constant power income and robustness of a thermal-harvesting tracker are of great advantage for long-term studies. However, the capacity of today’s batteries is already in a range that can achieve long run-time when used with our low-power system. For example, the CRV3 (Panasonic) with 3000 at 3 could deliver similar amounts of power over a period of 10 years, weighing only 39 . Still, leakage and degradation over that long time are concerns for battery-driven systems. Nevertheless, using both approaches in conjunction would allow us to double the system functionality and would deliver a fall-back operation for the failure of one power supply.
Outstanding features of the tracker are both a high amount of usable power harvested at low temperature-gradients of only 2 and a very low power but full-featured electronic system. The input power achieved with this design is doubled compared to our previous design in [12]. Substantial improvements are: First, a careful thermal adaption to the animal’s fur as already discussed in [13]. Second, harvesting at very low TEG output voltages down to 15 , which we managed to up-convert with low losses. This increases the available energy as the TEGs work closer to their maximum output-power point. Third, the indirect load-matching via the task-scheduler increased the up-conversion efficiency by selecting the tasks in an order for the system to stay close to the optimal capacitor voltage. A narrower control with regard to the best voltage could further increase the usable power. Most of the time, the capacitor voltage was between 4 to 5 , while the optimal one is around 3 (see Figure 5). This is a design choice, as the charging of the capacitor to higher voltages is necessary to provide enough energy for a GPS-fix. Larger capacitances or the usage of batteries would allow to stay near the optimal voltage of the intermediate storage. However, most alternatives have higher losses and leakage, which is an important factor, as the system is in deep sleep most of the time. The main electronics all together use less than 1 in that state, and thus our already low leakage capacitor ( 60 BZ015B603ZLB (Bestcap)) has the most significant impact on the overall power loss, with a leakage current of 10 . It is worth mentioning that sleep currents could be further lowered by a step-down converter that has even better efficiency than the one we used (TPS26740 (Texas Instruments)).
6. Summary
We have designed, built and tested a collar to track position, activity and temperature of a goat. It is the first collar that is equipped with power-hungry modules such as a GPS or a LoRa-transmitter and solely supplies itself via thermal energy-harvesting from the animal.
In a field test with cashmere goats, a high mean output power of around 100 is achieved with two TEGs that operate on the low temperature gradient between animal and environment. The usable mean power at night was higher with up to 211 compared to 85 during the day. Directly at the TEG, we found temperature differences of () . According to our calculations, our system can work down to a of () that corresponds to an ambient temperature of () . This is achieved with a harvesting area of 2 times at a total system weight of 286 .
The high input power is achieved by: First, a careful thermal adaption and the choice of TEGs with low output voltages but low internal electrical resistance. Second, a highly efficient up-conversion of TEG-output voltages down to 15 . Third, a power management that holds the energy storage close to the voltage with the highest input power. Fourth, very low energy consumption in deep sleep for the entire system, including losses, of 8 due to extra circuitry that disconnects most of the components from the energy storage. Most of the remaining sleep current is due to leakage of the storage capacitor.
With the harvested energy, the collar can try a position-fix every 1.1 to 1.5 , each fix using approximately 621 . The wireless transmission of data happens every 14 at an output power of 15 . With that, our developed collar already fulfills the usual tasks of commercially available trackers. There are chances that such systems might become a robust and long-living alternative to batteries in today’s trackers and enable long-term studies at the animal without needing to recapture them just for changing batteries.
Author Contributions
Conceptualization, E.B. and P.W.; methodology, E.B.; software, E.B.; validation, E.B., L.C. and L.M.C.; formal analysis, E.B. and L.C.; investigation, L.C. and E.B.; resources, P.W.; data curation, E.B. and L.C.; writing—original draft preparation, E.B.; writing—review and editing, L.M.C. and P.W.; visualization, E.B. and L.C.; supervision, E.B. and P.W.; project administration, P.W.; funding acquisition, E.B. All authors have read and agreed to the published version of the manuscript.
Funding
The article processing charge was funded by the Baden-Wuerttemberg Ministry of Science, Research and Art and the University of Freiburg in the funding program Open Access Publishing.
Institutional Review Board Statement
Ethical review and approval were waived for this study as animals chosen for this study are used to wear collars and regular contact to humans. No additional measures were taken compared to commonly used collars.
Informed Consent Statement
Not applicable.
Data Availability Statement
The data presented in this study are openly available in Zenodo at https://doi.org/10.5281/zenodo.5547295 (accessed on 24 September 2021).
Acknowledgments
The authors gracefully thank the Mundenhof Freiburg for their cooperation and their valuable contribution. They supported the experiment with their expertise in handling and taking care of the animals. We also thank the animal welfare officer of the Uniklinik Freiburg for her council and supervision of the experiment.
Conflicts of Interest
The authors declare no conflict of interest.
References
- White, P.C.L.; Taylor, A.C.; Boutin, S.; Myers, C.; Krebs, C.J.; White, P.C.L.; Taylor, A.C.; Boutin, S.; Myers, C.; Krebs, C.J. Wildlife Research in a changing world. Wildl. Res. 2009, 36, 275–278. [Google Scholar] [CrossRef]
- Brooks, C.; Bonyongo, C.; Harris, S. Effects of Global Positioning System Collar Weight on Zebra Behavior and Location Error. J. Wildl. Manag. 2008, 72, 527–534. Available online: https://wildlife.onlinelibrary.wiley.com/doi/pdf/10.2193/2007-061 (accessed on 28 May 2021). [CrossRef]
- Adu-Manu, K.S.; Adam, N.; Tapparello, C.; Ayatollahi, H.; Heinzelman, W. Energy-Harvesting Wireless Sensor Networks (EH-WSNs): A Review. Acm Trans. Sen. Netw. 2018, 14, 1–50. [Google Scholar] [CrossRef]
- Wijesundara, M.; Tapparello, C.; Gamage, A.; Gokulan, Y.; Gittelson, L.; Howard, T.; Heinzelman, W. Design of a Kinetic Energy Harvester for Elephant Mounted Wireless Sensor Nodes of JumboNet. In Proceedings of the 2016 IEEE Global Communications Conference (GLOBECOM), Washington, DC, USA, 4–8 December 2016; pp. 1–7. [Google Scholar] [CrossRef]
- Dagdeviren, C.; Li, Z.; Wang, Z.L. Energy harvesting from the animal/human body for self-powered electronics. Annu. Rev. Biomed. Eng. 2017, 19, 85–108. [Google Scholar] [CrossRef] [PubMed]
- Luo, Y.; Pu, L.; Zhao, Y. RF Energy Harvesting Sensor Networks for Healthcare of Animals: Opportunities and Challenges. arXiv 2018, arXiv:abs/1803.00106. [Google Scholar]
- LifeTag™; Cellular Tracking Technologies: Rio Grande, NJ, USA, 2019.
- Loreti, P.; Catini, A.; De Luca, M.; Bracciale, L.; Gentile, G.; Di Natale, C. The Design of an Energy Harvesting Wireless Sensor Node for Tracking Pink Iguanas. Sensors 2019, 19, 985. [Google Scholar] [CrossRef] [PubMed] [Green Version]
- Jain, V.R.; Bagree, R.; Kumar, A.; Ranjan, P. wildCENSE: GPS based animal tracking system. In Proceedings of the 2008 International Conference on Intelligent Sensors, Sensor Networks and Information Processing, Sydney, Australia, 15–18 December 2008; pp. 617–622. [Google Scholar] [CrossRef]
- Knight, C.; Davidson, J.; Behrens, S. Energy Options for Wireless Sensor Nodes. Sensors 2008, 8, 8037–8066. [Google Scholar] [CrossRef] [PubMed]
- Woias, P.; Schule, F.; Bäumke, E.; Mehne, P.; Kroener, M. Thermal Energy Harvesting from Wildlife. J. Phys. Conf. Ser. 2014, 557, 012084. [Google Scholar] [CrossRef]
- Bäumker, E.; Schüle, F.; Woias, P. Development of a batteryless VHF-Beacon and tracker for mammals. J. Phys. Conf. Ser. 2018, 1052, 012005. [Google Scholar] [CrossRef] [Green Version]
- Bäumker, E.; Beck, P.; Woias, P. Thermoelectric Harvesting Using Warm-Blooded Animals in Wildlife Tracking Applications. Energies 2020, 13, 2769. [Google Scholar] [CrossRef]
- Terrasson, G.; Llaria, A.; Marra, A.; Voaden, S. Accelerometer based solution for precision livestock farming: Geolocation enhancement and animal activity identification. Iop Conf. Ser. Mater. Sci. Eng. 2016, 138, 012004. [Google Scholar] [CrossRef] [Green Version]
- Latham, A.D.M.; Latham, M.C.; Anderson, D.P.; Cruz, J.; Herries, D.; Hebblewhite, M. The GPS craze: Six questions to address before deciding to deploy GPS technology on wildlife. N. Z. J. Ecol. 2015, 39, 143–152. [Google Scholar]
- Harrity, E.J.; Conway, C.J. Satellite transmitters reveal previously unknown migratory behavior and wintering locations of Yuma Ridgway’s Rails. J. Field Ornithol. 2020, 91, 300–312. [Google Scholar] [CrossRef]
- Taylor, P.; Crewe, T.; Mackenzie, S.; Lepage, D.; Aubry, Y.; Crysler, Z.; Finney, G.; Francis, C.; Guglielmo, C.; Hamilton, D. The Motus Wildlife Tracking System: A collaborative research network to enhance the understanding of wildlife movement. Avian Conserv. Ecol. 2017, 12, 8. [Google Scholar] [CrossRef]
- Fischer Elektronik GmbH & Co. KG. Datenblatt Produkt ICK S 50 × 50 × 20. Datasheet. 2020. Available online: https://www.fischerelektronik.de/web_fischer/de_DE/$catalogue/fischerData/PR/ICKS50x50x20_/datasheet.xhtml?branch=Kühlkörper (accessed on 26 May 2021).
- Texas Instruments Incorporated. TMP117 High-Accuracy, Low-Power, Digital Temperature Sensor. Datasheet. 2018. Available online: https://www.ti.com/lit/ds/symlink/tmp117.pdf?ts=1633404466025&ref_url=https%253A%252F%252Fwww.google.com.sg%252F (accessed on 26 May 2021).
- Cena, K.; Clark, J. Heat balance and thermal resistances of sheep’s fleece. Phys. Med. Biol. 1974, 19, 51. [Google Scholar] [CrossRef] [PubMed]
- Rowe, D.M. Thermoelectrics Handbook: Macro to Nano; CRC Press: Boca Raton, FL, USA, 2018. [Google Scholar]
- Penfield, P. Available Power from a Nonideal Thermal Source. J. Appl. Phys. 1961, 32, 1793–1794. [Google Scholar] [CrossRef]
- Analog Devices, Inc. Ultralow Voltage Step-Up Converter and Power Manager. Datasheet. 2019. Available online: https://www.analog.com/media/en/technical-documentation/data-sheets/3108fc.pdf (accessed on 1 April 2021).
- Woias, P.; Islam, M.; Heller, S.; Roth, R. A low-voltage boost converter using a forward converter with integrated Meissner oscillator. J. Phys. Conf. Ser. 2013, 476, 012081. [Google Scholar] [CrossRef]
- u-blox. u-blox M8 Concurrent GNSS Antenna Modules. Datasheet. 2019. Available online: https://www.u-blox.com/sites/default/files/CAM-M8-FW3_DataSheet_%28UBX-15031574%29.pdf (accessed on 3 May 2021).
- AVX Corporation. BestCap® Ultra-low ESR High Power Pulse Supercapacitors. Datasheet. 2017. BZ015B603ZAB. Available online: http://catalogs.avx.com/BestCap.pdf (accessed on 14 March 2016).
- Texas Instruments Incorporated. TPS6274x 360nA IQ Step Down Converter For Low Power Applications. Datasheet. 2013. Available online: https://www.ti.com/document-viewer/TPS62740/datasheet (accessed on 17 May 2021).
- Biancuzzi, G.; Wischke, M.; Peter, P.D.I.W. Elektrische Schaltung. DE DE102011014512A1, 20 September 2012. [Google Scholar]
- Woias, P.; Wischke, M.; Eichhorn, C.; Fuchs, B. An energy-autonomous wireless temperature monitoring system powered by piezoelectric energy harvesting. In Proceedings of the PowerMEMS 2009, Washington, DC, USA, 1–4 December 2009; pp. 209–212. [Google Scholar]
- Texas Instruments Incorporated. MSP430FR596x, MSP430FR594x Mixed-Signal Microcontrollers. Datasheet. 2014. Available online: https://www.mouser.de/pdfdocs/TI_MSP430FR59xx_Datasheet.PDF (accessed on 26 February 2021).
- Vishay Intertechnology, Inc. SiP32431, SiP32432 10 pA, Ultra Low Leakage and Quiescent Current, Load Switch with Reverse Blocking. Datasheet. 2017. Available online: https://www.vishay.com/docs/66597/sip32431.pdf (accessed on 18 May 2021).
- LAPIS Technology Co., Ltd. 64k(8,192-Word × 8-Bit) FeRAM. Datasheet. 2016. Available online: http://www.farnell.com/datasheets/2625480.pdf (accessed on 18 May 2021).
- Goodwin, S.D. Comparison of body temperatures of goats, horses, and sheep measured with a tympanic infrared thermometer, an implantable microchip transponder, and a rectal thermometer. J. Am. Assoc. Lab. Anim. Sci. 1998, 37, 51–55. [Google Scholar]
Figure 1.
The tracker is implemented as a collar that can be attached to the desired animal. Two of the three housings are dedicated to thermal energy harvesting. The remaining one contains the main electronics.
Figure 1.
The tracker is implemented as a collar that can be attached to the desired animal. Two of the three housings are dedicated to thermal energy harvesting. The remaining one contains the main electronics.

Figure 2.
Housing of the harvesting part: TEG with two temperature sensors between two thermal coupling parts. The top-side heat sink is detached.
Figure 2.
Housing of the harvesting part: TEG with two temperature sensors between two thermal coupling parts. The top-side heat sink is detached.

Figure 3.
Power output and corresponding open-circuit voltage of TEG for a fin-length of 15 , 12 , 10 , 8 , 5 at a total temperature difference of 5 and resistances of the thermal connections of 35 /, 10 /.
Figure 3.
Power output and corresponding open-circuit voltage of TEG for a fin-length of 15 , 12 , 10 , 8 , 5 at a total temperature difference of 5 and resistances of the thermal connections of 35 /, 10 /.

Figure 4.
Concept of the power management circuit: The output voltage of the TEG is first upconverted and stored in a capacitor. A cold start circuit disconnects the rest of the system if the voltage falls below a threshold. Otherwise, the capacitor voltage is stabilized to the constant output voltage needed to drive the attached electronics.

Figure 5.
Measured charging power for different temperature differences directly applied to the two connected TEGs in the lab. Only the power-management circuitry (see Figure 4) is used. At , a slight power dip can be seen at which the step-down converter is turned on.
Figure 5.
Measured charging power for different temperature differences directly applied to the two connected TEGs in the lab. Only the power-management circuitry (see Figure 4) is used. At , a slight power dip can be seen at which the step-down converter is turned on.

Figure 6.
Part of the electrical system responsible for the data acquisition. The MCU controls via digital protocols all periphery and may completely cut each component from the power supply with an additional switch.
Figure 6.
Part of the electrical system responsible for the data acquisition. The MCU controls via digital protocols all periphery and may completely cut each component from the power supply with an additional switch.

Figure 7.
PCBs that are later stacked on top in the electronics housing. From left to right: Power management board with cold-start switch, step-down and step-up converter, but here without soldered transformer and capacitor, board for wireless transmission, board with activity sensor, MCU and FRAM, board with GPS-receiver.

Figure 8.
Flowchart of the algorithm. Most of the time, the tracker is put into sleep and only wakes up after a period of seven minutes, checks the voltage, and fulfills the task according to a defined time and voltage level.
Figure 8.
Flowchart of the algorithm. Most of the time, the tracker is put into sleep and only wakes up after a period of seven minutes, checks the voltage, and fulfills the task according to a defined time and voltage level.

Figure 9.
Side-by-side: Collar attached to the animal’s fur in winter and late spring. As the goat
lost its fur, the thermal connection is not optimal any more in the field test in spring. (a) Prototype
of the thermal housing to determine the right fin length for an optimal penetration into the goat’s
fur—done in winter. (b) Goat with the tracker at the end of field-test in late spring. One housing is
detached from the collar.

Figure 10.
Median of activity events measured for each hour and goat during the trackers’ lifetime. The daily routine such as sleeping and resting can be obtained.
Figure 10.
Median of activity events measured for each hour and goat during the trackers’ lifetime. The daily routine such as sleeping and resting can be obtained.

Figure 11.
The distribution of temperature difference at the TEG in each of the trackers harvesting housings. Given: the total number of measurements for each tracker (N), mean and median for each housing, and a calculated normal distribution.
Figure 11.
The distribution of temperature difference at the TEG in each of the trackers harvesting housings. Given: the total number of measurements for each tracker (N), mean and median for each housing, and a calculated normal distribution.

Figure 12.
Temperature difference at the TEG versus ambient temperature measured by a weather
station. A linear fit is shown to extrapolate the zero-crossing with the x-axis. At this point, the
temperature difference at the TEG becomes zero and no thermal harvesting is possible. (a) First goat
with both housings having a similar thermal connection. (b) Second goat with less data points.

Figure 13.
Voltage, charging power, and power consumption of tracker 1 for the first two days.

Figure 14.
Charging power versus ambient temperature respectively the corresponding ΔT at the
TEG from the tracker of goat 1. The marked data are excluded as these are outliers recorded after
using high current periphery such as GPS. (a) Charging power versus ΔTTEG. (b) Charging power
versus the ambient temperature.


Table 1.
The algorithm executes tasks according to a fixed time interval, but only when the capacitor’s voltage is in the desired range or above. Otherwise, it is skipped.
Table 1.
The algorithm executes tasks according to a fixed time interval, but only when the capacitor’s voltage is in the desired range or above. Otherwise, it is skipped.
| Lvl | Voltage Range | Time Interval | Consumption | Task |
|---|---|---|---|---|
| 0 | 0 to 2.3 | - | 7 | Whole system is shut down by cold-start circuit |
| 1 | 2.3 to 2.5 | - | 8 | Only MCU and RTC is running, timetracking |
| 2 | 2.5 to 3 | 7 | Measurements are done and stored internally | |
| 3 | 3 to 5.1 | 14 | Measurements are done and transmitted | |
| 4 | 5.1 to 5.3 | 28 | Measurements are done, a GPS fix obtained and transmitted | |
| 5 | > | - | Same as level 4 |
Table 2.
Mean charging power of the capacitor, including losses for the up-conversion, storage, and the attached system.
Table 2.
Mean charging power of the capacitor, including losses for the up-conversion, storage, and the attached system.
| Goat 1 | Goat 2 | |
|---|---|---|
| Mean power income | ||
| Mean power income Night | ||
| Mean power income Day |
Publisher’s Note: MDPI stays neutral with regard to jurisdictional claims in published maps and institutional affiliations. |
© 2021 by the authors. Licensee MDPI, Basel, Switzerland. This article is an open access article distributed under the terms and conditions of the Creative Commons Attribution (CC BY) license (https://creativecommons.org/licenses/by/4.0/).
Share and Cite
MDPI and ACS Style
Bäumker, E.; Conrad, L.; Comella, L.M.; Woias, P. A Fully Featured Thermal Energy Harvesting Tracker for Wildlife. Energies 2021, 14, 6363. https://doi.org/10.3390/en14196363
AMA Style
Bäumker E, Conrad L, Comella LM, Woias P. A Fully Featured Thermal Energy Harvesting Tracker for Wildlife. Energies. 2021; 14(19):6363. https://doi.org/10.3390/en14196363
Chicago/Turabian StyleBäumker, Eiko, Luca Conrad, Laura Maria Comella, and Peter Woias. 2021. "A Fully Featured Thermal Energy Harvesting Tracker for Wildlife" Energies 14, no. 19: 6363. https://doi.org/10.3390/en14196363
Note that from the first issue of 2016, this journal uses article numbers instead of page numbers. See further details here.