
Edge Computing and IoT Analytics for Agile Optimization in Intelligent Transportation Systems

 , , ,
, , ,  ,
,  and
and 
Abstract
:1. Introduction
- To review accessible real open data repositories.
- To review approaches regarding optimization, simulation, machine learning, and agile optimization algorithms in ITS.
- To provide challenges and opportunities of cloud, fog, and edge computing and IoT analytics in ITS.
- To propose a methodology for solving the DRSP in the context of edge/fog computing.
2. Fundamental Concepts
2.1. Open Data Initiatives for Smart Cities
2.2. Optimization, Simulation and Machine Learning in ITS
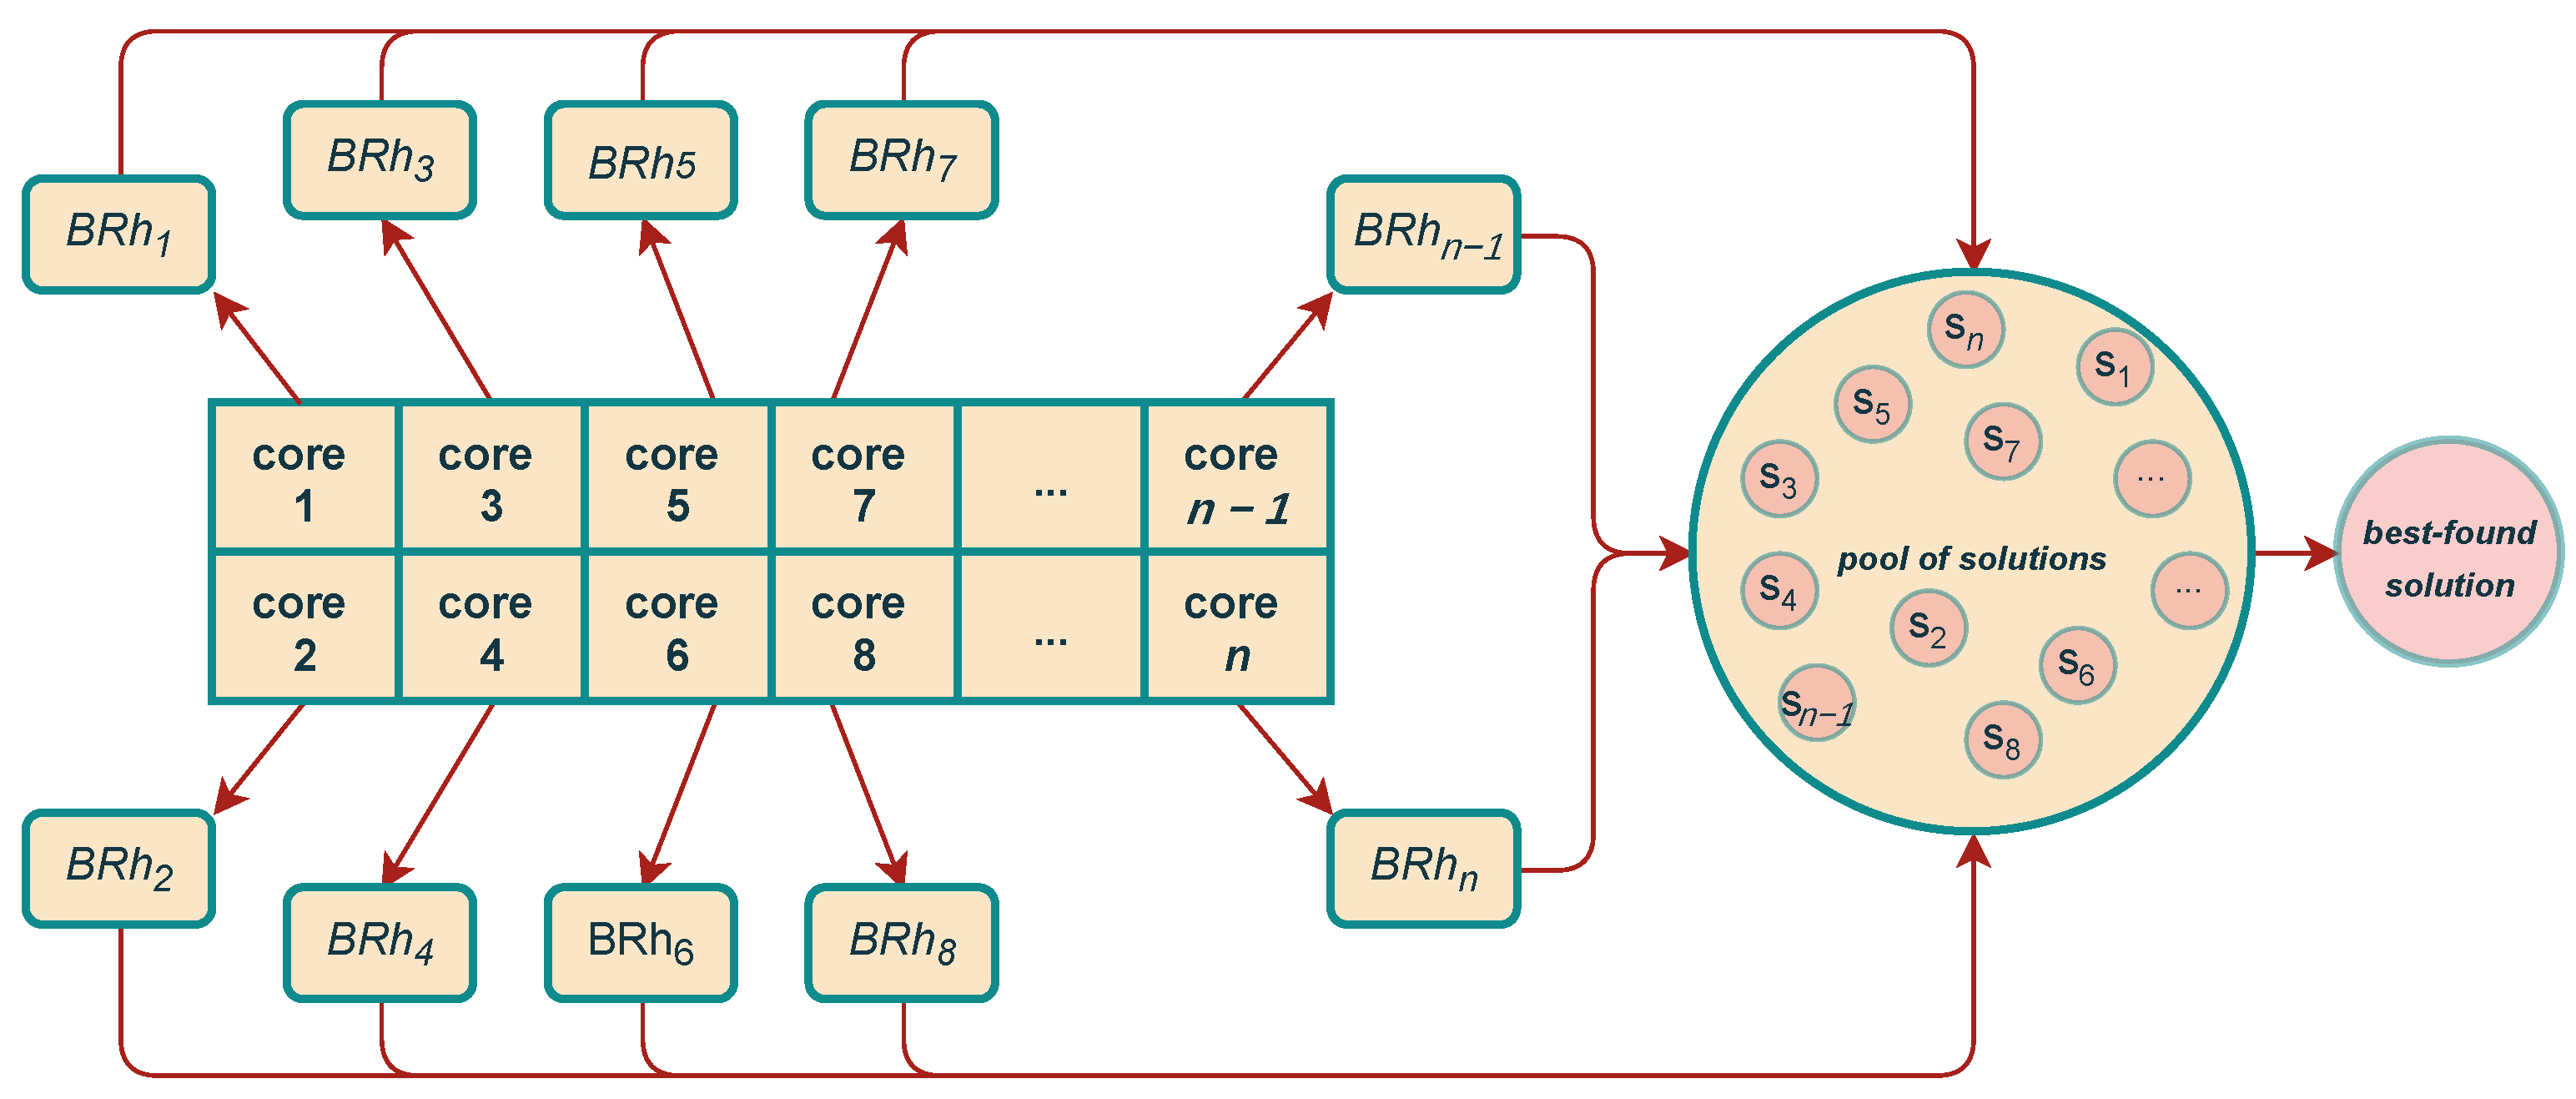
2.3. Agile Optimization Algorithms in ITS
3. Related Work
3.1. Cloud, Fog, and Edge Computing in ITS
3.2. IoT Analytics in ITS
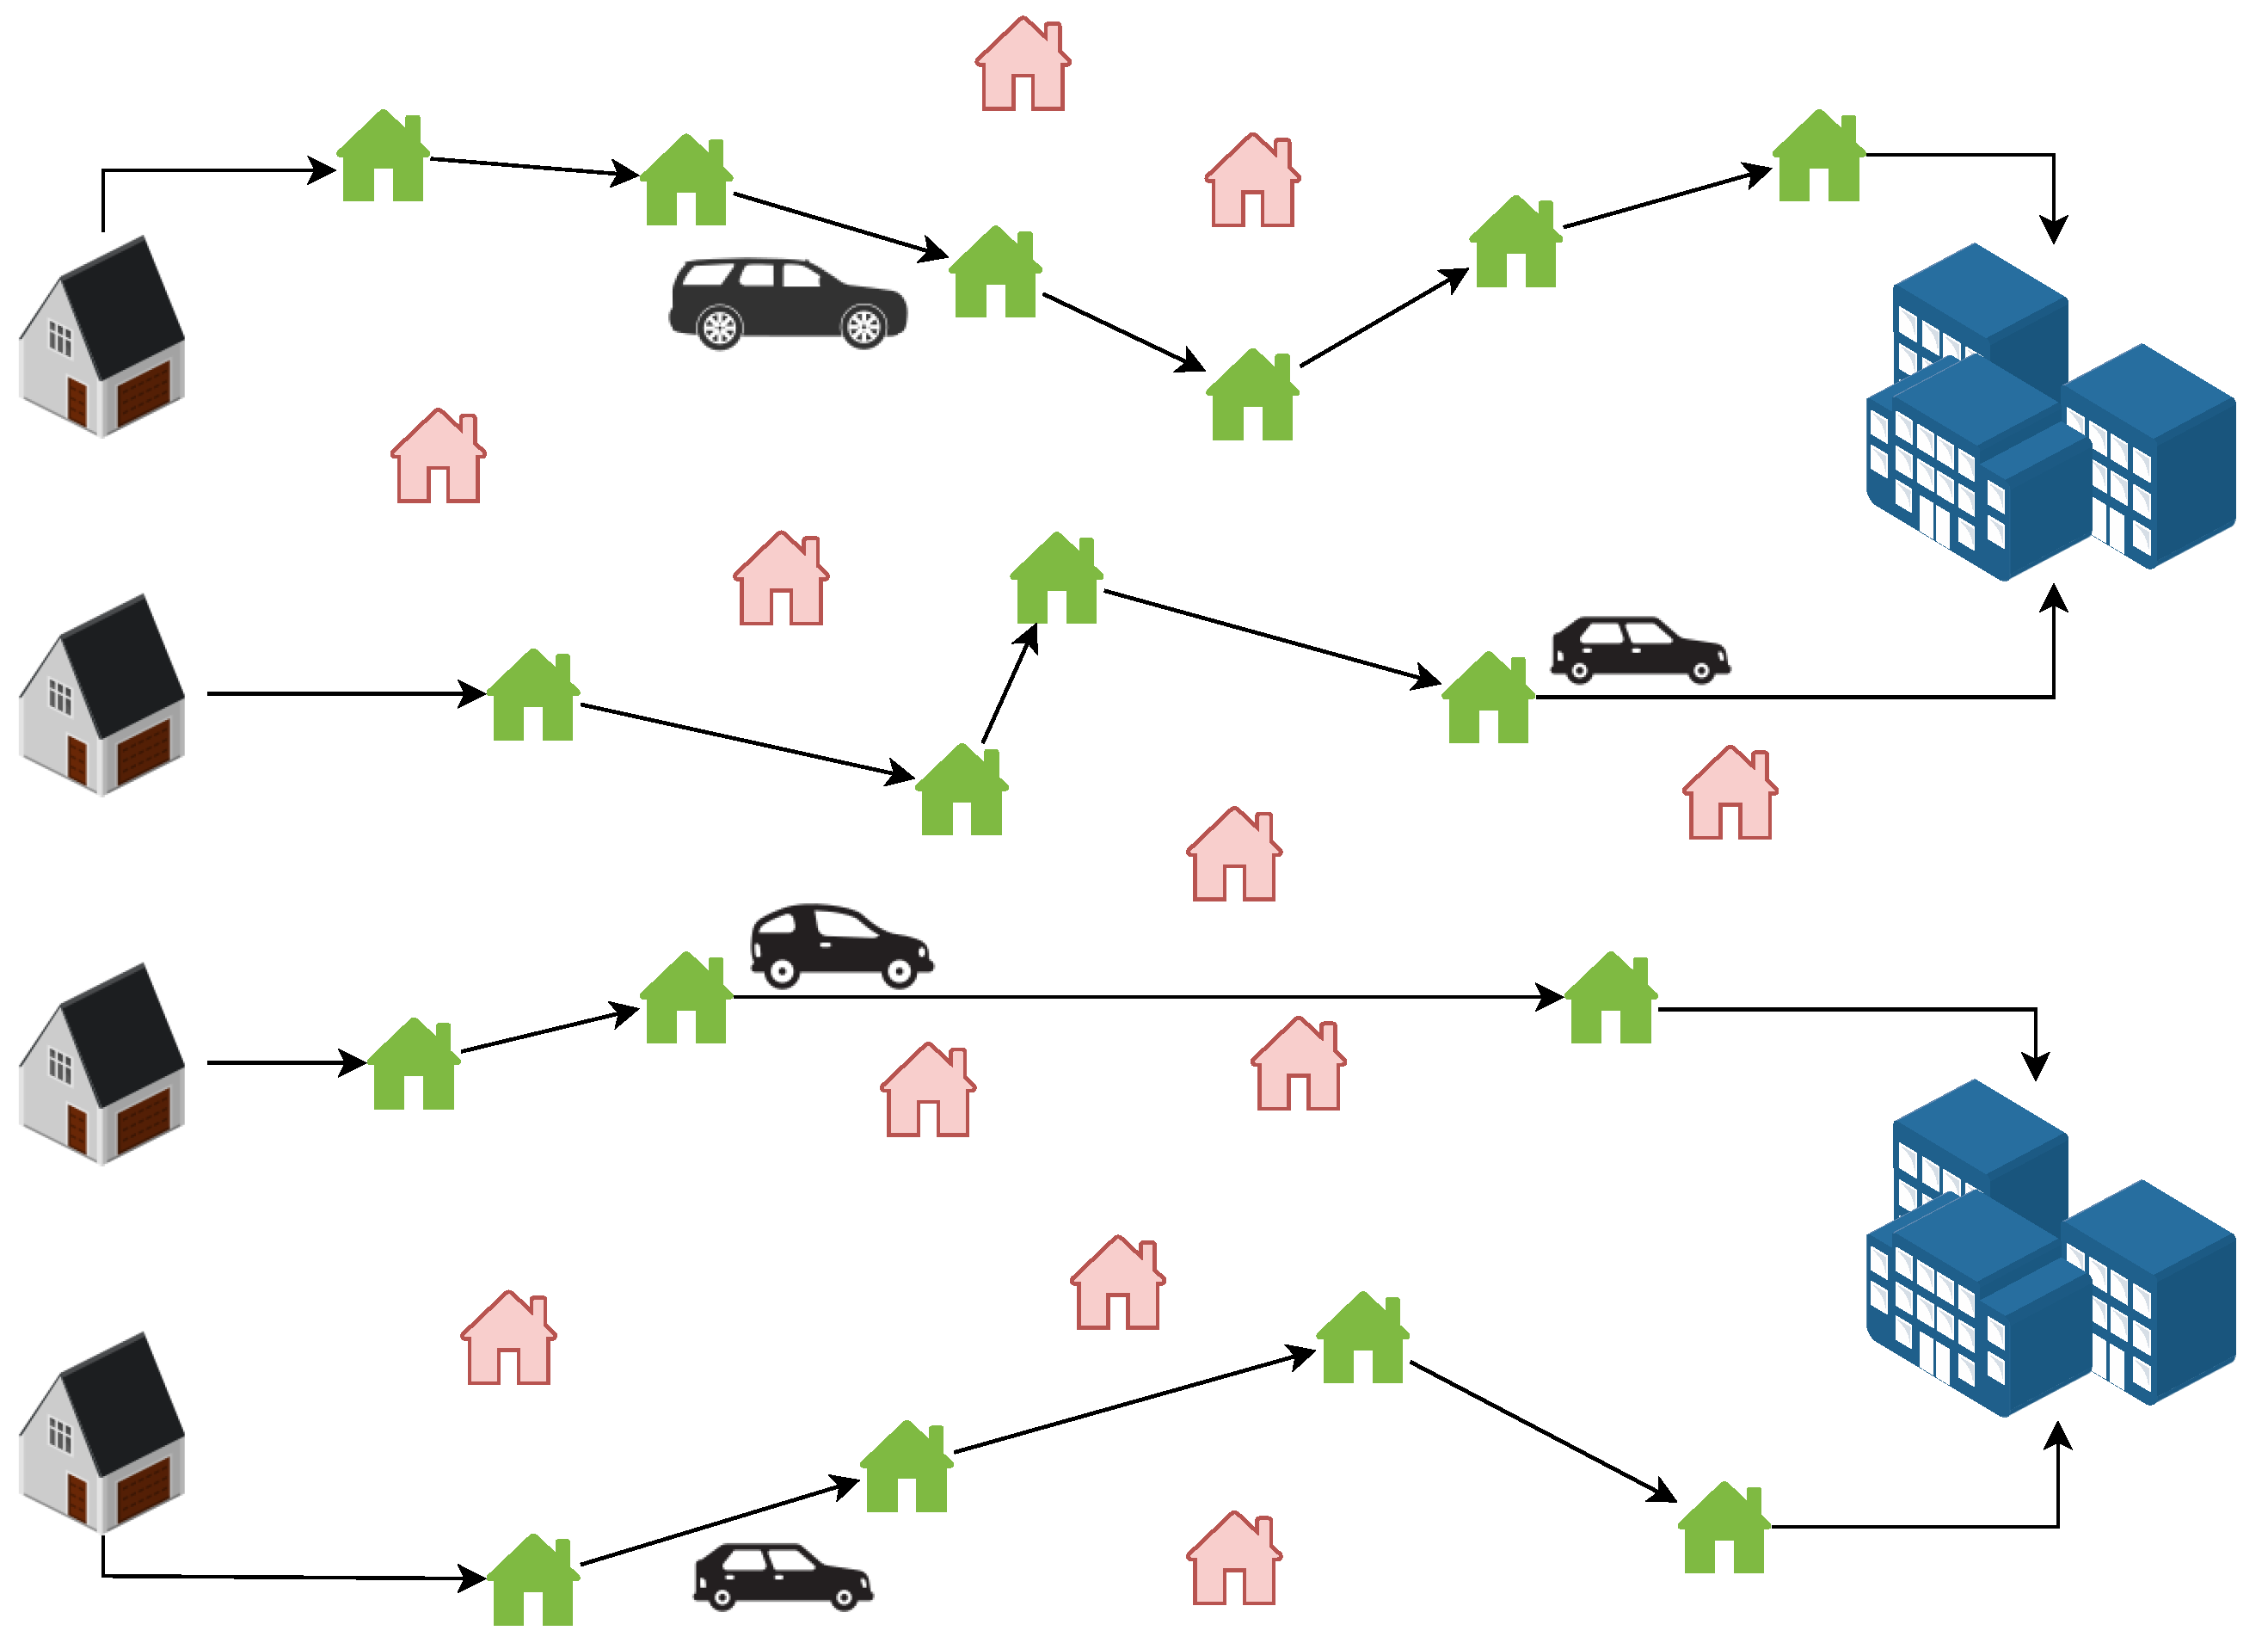
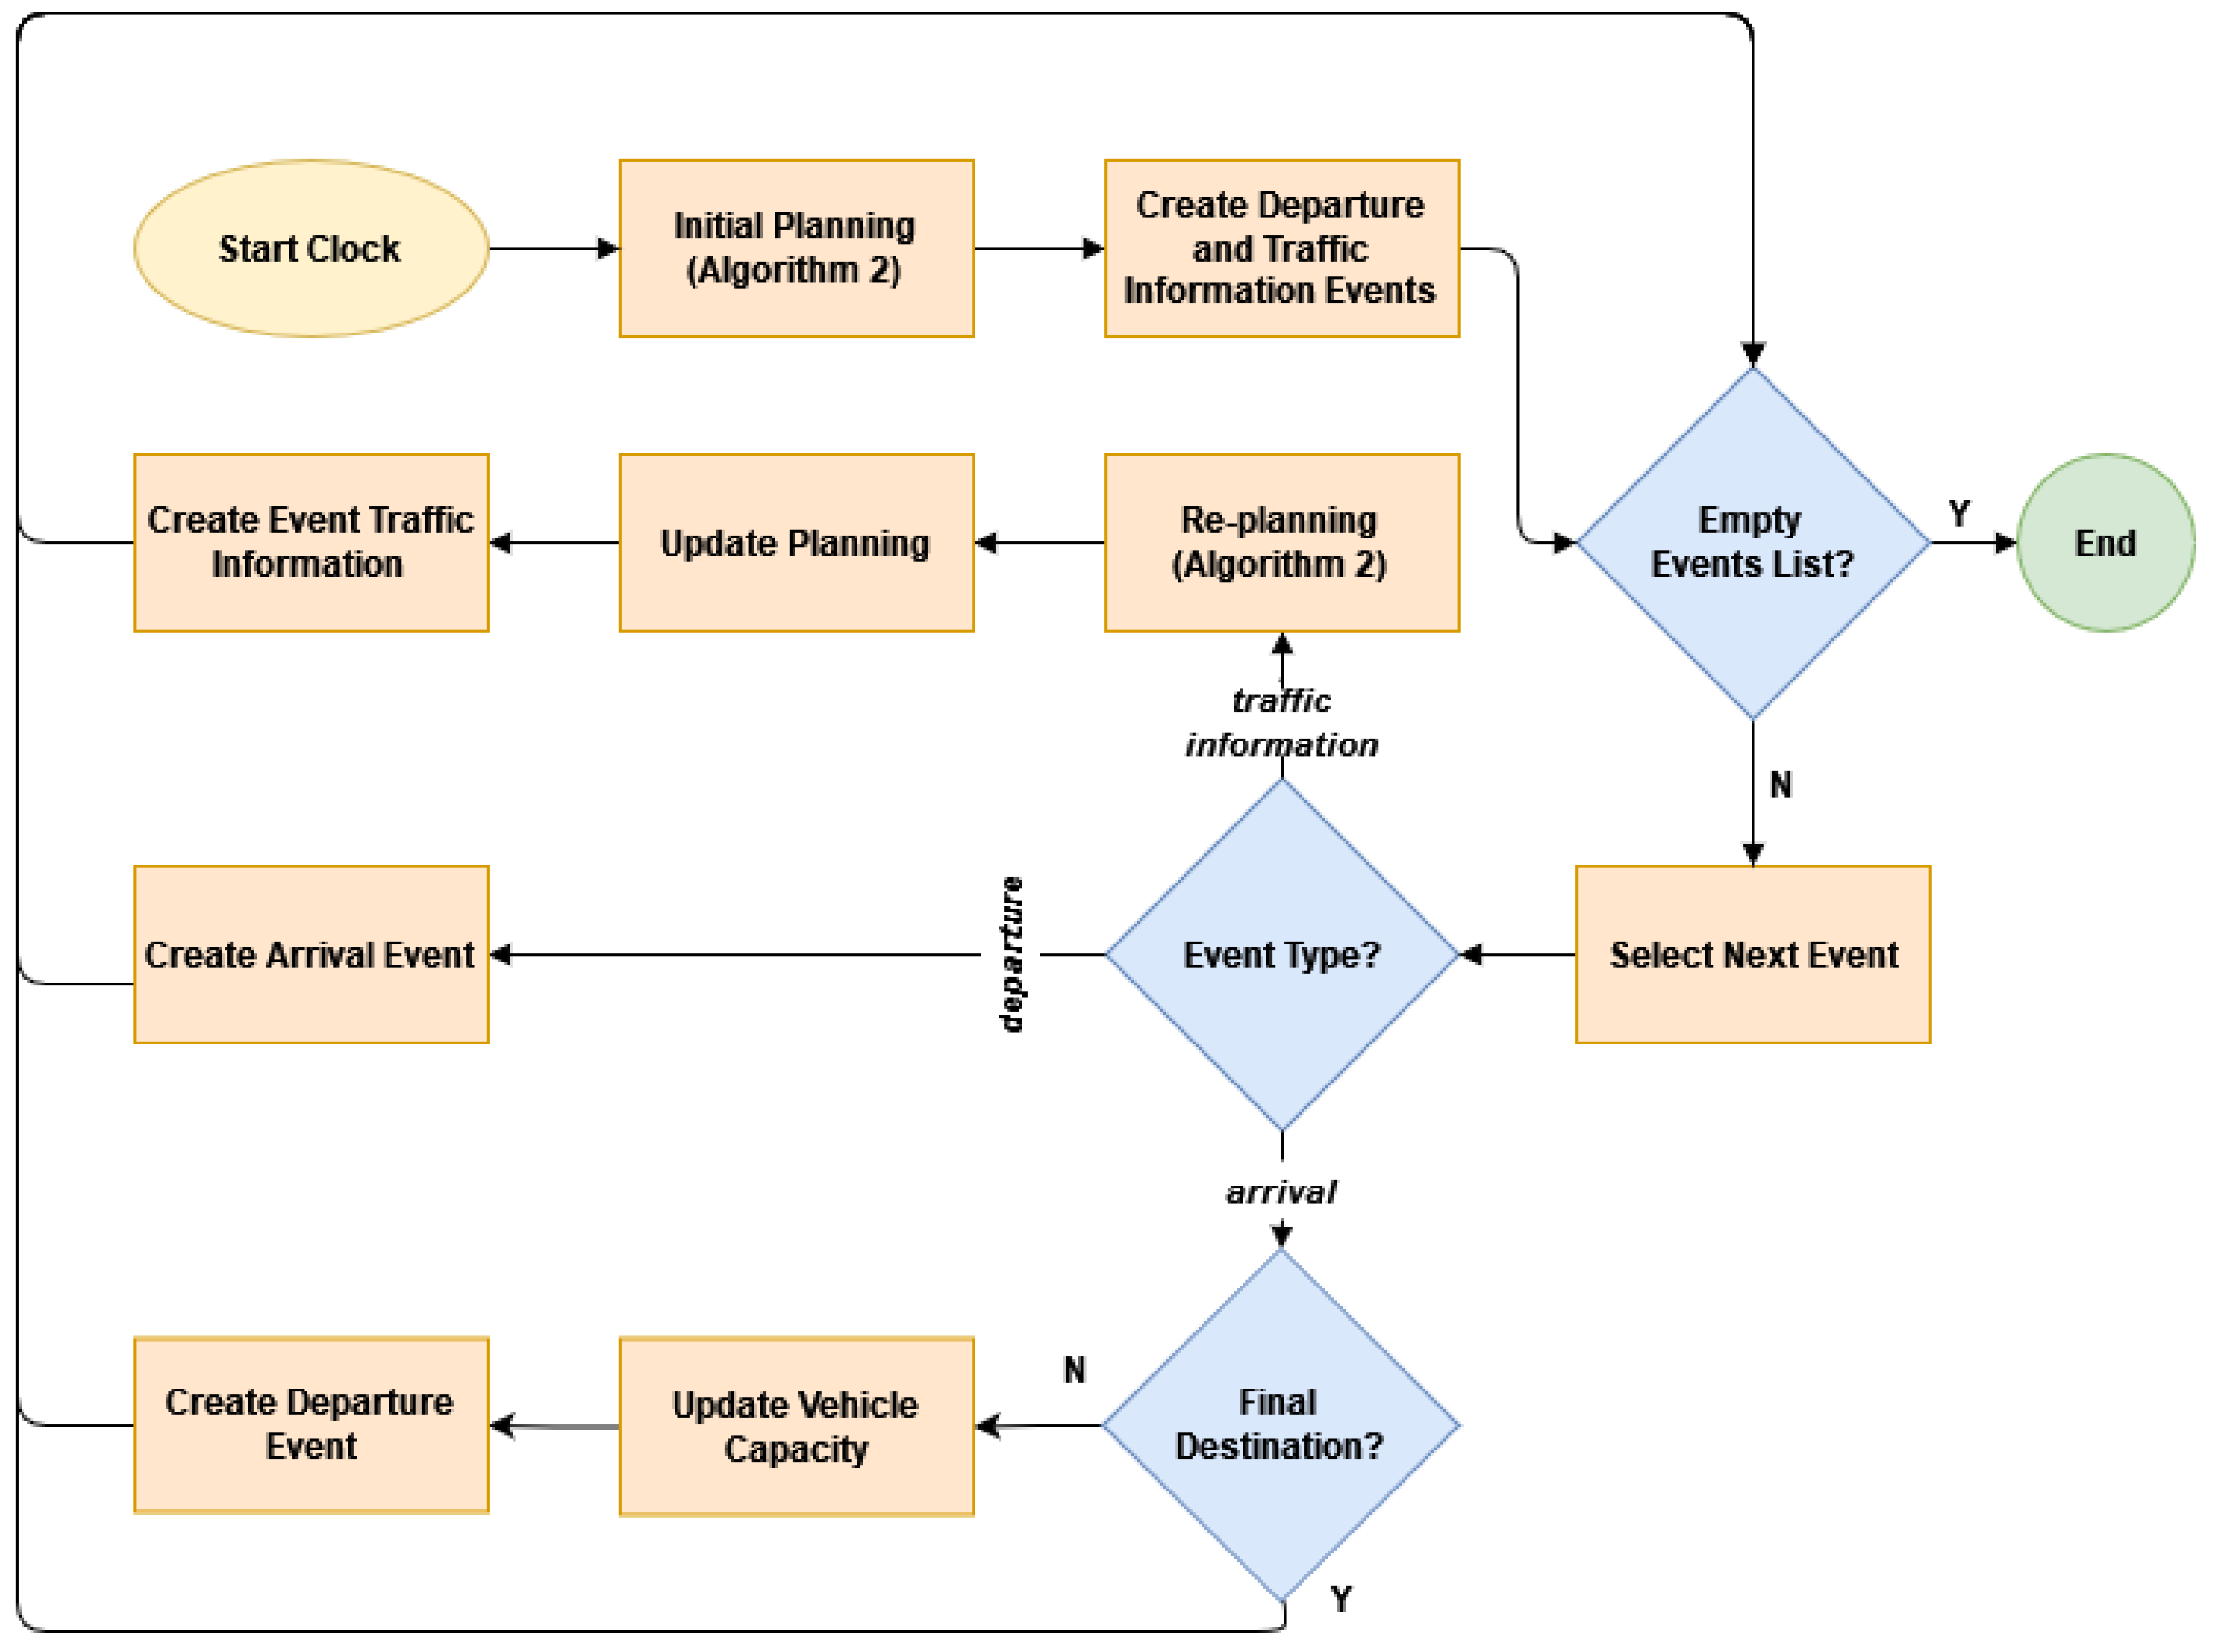
4. An Illustrative Case Study
5. Solution Approach
| Algorithm 1 Two-stage approach algorithm for solving a static RSP |
|
| Algorithm 2 Multi-Start Approach for solving RSP |
|
6. Computational Experiments and Results
7. Conclusions and Future Research
Author Contributions
Funding
Institutional Review Board Statement
Informed Consent Statement
Data Availability Statement
Acknowledgments
Conflicts of Interest
References
- Gruler, A.; Quintero-Araújo, C.L.; Calvet, L.; Juan, A.A. Waste collection under uncertainty: A simheuristic based on variable neighbourhood search. Eur. J. Ind. Eng. 2017, 11, 228–255. [Google Scholar] [CrossRef]
- Martins, L.d.C.; de la Torre, R.; Corlu, C.G.; Juan, A.A.; Masmoudi, M.A. Optimizing ride-sharing operations in smart sustainable cities: Challenges and the need for agile algorithms. Comput. Ind. Eng. 2021, 153, 107080. [Google Scholar] [CrossRef]
- Beneicke, J.; Juan, A.A.; Xhafa, F.; Lopez-Lopez, D.; Freixes, A. Empowering citizens’ cognition and decision making in smart sustainable cities. IEEE Consum. Electron. Mag. 2019, 9, 102–108. [Google Scholar] [CrossRef]
- Aazam, M.; Huh, E.N. Fog computing and smart gateway based communication for cloud of things. In Proceedings of the 2014 International Conference on Future Internet of Things and Cloud, Barcelona, Spain, 27–29 August 2014; pp. 464–470. [Google Scholar]
- Zhu, Y.; Zhu, X.; Zhu, S.; Guo, S. Intelligent transportation system based on Internet of Things. In Proceedings of the World Automation Congress 2012, Puerto Vallarta, Mexico, 24–28 June 2012; pp. 1–3. [Google Scholar]
- Bojan, T.M.; Kumar, U.R.; Bojan, V.M. An internet of things based intelligent transportation system. In Proceedings of the 2014 IEEE International Conference on Vehicular Electronics and Safety, Hyderabad, India, 16–17 December 2014; pp. 174–179. [Google Scholar]
- Ahlgren, B.; Hidell, M.; Ngai, E.C.H. Internet of things for smart cities: Interoperability and open data. IEEE Internet Comput. 2016, 20, 52–56. [Google Scholar] [CrossRef]
- Tang, C.; Xia, S.; Zhu, C.; Wei, X. Phase timing optimization for smart traffic control based on fog computing. IEEE Access 2019, 7, 84217–84228. [Google Scholar] [CrossRef]
- Aazam, M.; Huh, E.N. Fog computing micro datacenter based dynamic resource estimation and pricing model for IoT. In Proceedings of the 2015 IEEE 29th International Conference on Advanced Information Networking and Applications, Gwangju, Korea, 24–27 March 2015; pp. 687–694. [Google Scholar]
- Jiménez-Meza, A.; Arámburo-Lizárraga, J.; de la Fuente, E. Framework for estimating travel time, distance, speed, and street segment level of service (los), based on GPS data. Procedia Technol. 2013, 7, 61–70. [Google Scholar] [CrossRef] [Green Version]
- Agatz, N.; Erera, A.L.; Savelsbergh, M.W.; Wang, X. Dynamic ride-sharing: A simulation study in metro Atlanta. Procedia Soc. Behav. Sci. 2011, 17, 532–550. [Google Scholar] [CrossRef] [Green Version]
- Grasas, A.; Juan, A.A.; Faulin, J.; de Armas, J.; Ramalhinho, H. Biased randomization of heuristics using skewed probability distributions: A survey and some applications. Comput. Ind. Eng. 2017, 110, 216–228. [Google Scholar] [CrossRef]
- Rodríguez-Bolívar, M.P. Transforming City Governments for Successful Smart Cities; Springer: Berlin/Heidelberg, Germany, 2015; pp. 1–185. [Google Scholar]
- Janssen, M.; Charalabidis, Y.; Zuiderwijk, A. Benefits, Adoption Barriers and Myths of Open Data and Open Government. Inf. Syst. Manag. 2012, 29, 258–268. [Google Scholar] [CrossRef] [Green Version]
- Granickas, K. Understanding the Impact of Releasing and Re-Using Open; European Public Sector Information Platform: Brussels, Belgium, 2013; pp. 1–29. [Google Scholar]
- Solar, M.; Concha, G.; Meijueiro, L. A model to assess open government data in public agencies. In Proceedings of the International Conference on Electronic Government, Kristiansand, Norway, 3–6 September 2012; Springer: Berlin/Heidelberg, Germany, 2012; pp. 210–221. [Google Scholar]
- Ojo, A.; Curry, E.; Zeleti, F.A. A tale of open data innovations in five smart cities. In Proceedings of the Annual Hawaii International Conference on System Sciences, Kauai, HI, USA, 5–8 January 2015; Volume 2015, pp. 2326–2335. [Google Scholar]
- Abella, A.; Ortiz-de Urbina-Criado, M.; De-Pablos-Heredero, C. A model for the analysis of data-driven innovation and value generation in smart cities’ ecosystems. Cities 2017, 64, 47–53. [Google Scholar] [CrossRef]
- Vlahogianni, E.I. Computational intelligence and optimization for transportation big data: Challenges and opportunities. In Engineering and Applied Sciences Optimization; Springer: Cham, Switzerland, 2015; pp. 107–128. [Google Scholar]
- Saharan, S.; Bawa, S.; Kumar, N. Dynamic pricing techniques for Intelligent Transportation System in smart cities: A systematic review. Comput. Commun. 2020, 150, 603–625. [Google Scholar] [CrossRef]
- Satunin, S.; Babkin, E. A multi-agent approach to intelligent transportation systems modeling with combinatorial auctions. Expert Syst. Appl. 2014, 41, 6622–6633. [Google Scholar] [CrossRef]
- Shah, N.; Kumar, S.; Bastani, F.; Yen, I.L. Optimization models for assessing the peak capacity utilization of intelligent transportation systems. Eur. J. Oper. Res. 2012, 216, 239–251. [Google Scholar] [CrossRef]
- Taniguchi, E.; Shimamoto, H. Intelligent transportation system based dynamic vehicle routing and scheduling with variable travel times. Transp. Res. Part C Emerg. Technol. 2004, 12, 235–250. [Google Scholar] [CrossRef]
- Marques, M.C.; Neves-Silva, R. Traffic simulation for intelligent transportation systems development. In Proceedings of the 2005 IEEE Intelligent Transportation Systems, Vienna, Austria, 16 September 2005; pp. 320–325. [Google Scholar]
- Ramos, A.L.; Ferreira, J.V.; Barceló, J. Modeling & simulation for intelligent transportation systems. Int. J. Model. Optim. 2012, 2, 274. [Google Scholar]
- Fernández-Isabel, A.; Fuentes-Fernández, R. Analysis of intelligent transportation systems using model-driven simulations. Sensors 2015, 15, 14116–14141. [Google Scholar] [CrossRef] [Green Version]
- Kornhauser, A.L.; Mottola, P.; Stephenson, B. Transportation efficiency and the feasibility of dynamic ride sharing. In Proceedings of the 56th Annual Meeting of the Transportation Research Board, Washington, DC, USA, 24–28 January 1977. Transportation Research Record Serial. [Google Scholar]
- Lokhandwala, M.; Cai, H. Dynamic ride sharing using traditional taxis and shared autonomous taxis: A case study of NYC. Transp. Res. Part C Emerg. Technol. 2018, 97, 45–60. [Google Scholar] [CrossRef]
- Fagnant, D.J.; Kockelman, K.M. Dynamic ride-sharing and fleet sizing for a system of shared autonomous vehicles in Austin, Texas. Transportation 2018, 45, 143–158. [Google Scholar] [CrossRef]
- Haghighat, A.K.; Ravichandra-Mouli, V.; Chakraborty, P.; Esfandiari, Y.; Arabi, S.; Sharma, A. Applications of deep learning in intelligent transportation systems. J. Big Data Anal. Transp. 2020, 2, 115–145. [Google Scholar] [CrossRef]
- Fang, S.H.; Liao, H.H.; Fei, Y.X.; Chen, K.H.; Huang, J.W.; Lu, Y.D.; Tsao, Y. Transportation modes classification using sensors on smartphones. Sensors 2016, 16, 1324. [Google Scholar] [CrossRef] [Green Version]
- Said, A.M.; Abd-Elrahman, E.; Afifi, H. A comparative study on machine learning algorithms for green context-aware intelligent transportation systems. In Proceedings of the 2017 International Conference on Electrical and Computing Technologies and Applications (ICECTA 2017), Ras Al Khaimah, United Arab Emirates, 21–23 November 2017; Volume 2018, pp. 1–5. [Google Scholar]
- Nguyen, H.; Kieu, L.M.; Wen, T.; Cai, C. Deep learning methods in transportation domain: A review. IET Intell. Transp. Syst. 2018, 12, 998–1004. [Google Scholar] [CrossRef]
- Li, C.; Xu, P. Application on traffic flow prediction of machine learning in intelligent transportation. Neural Comput. Appl. 2021, 33, 613–624. [Google Scholar] [CrossRef]
- Karami, Z.; Kashef, R. Smart transportation planning: Data, models, and algorithms. Transp. Eng. 2020, 2, 100013. [Google Scholar] [CrossRef]
- Boukerche, A.; Wang, J. Machine Learning-based traffic prediction models for Intelligent Transportation Systems. Comput. Netw. 2020, 181, 107530. [Google Scholar] [CrossRef]
- Chen, C.; Liu, B.; Wan, S.; Qiao, P.; Pei, Q. An edge traffic flow detection scheme based on deep learning in an intelligent transportation system. IEEE Trans. Intell. Transp. Syst. 2021, 22, 1840–1852. [Google Scholar] [CrossRef]
- Jahangiri, A.; Rakha, H.A. Transportation Mode Recognition Using Mobile Phone Sensor Data. IEEE Trans. Intell. Transp. Syst. 2015, 16, 2406–2417. [Google Scholar] [CrossRef]
- Omrani, H. Predicting travel mode of individuals by machine learning. Transp. Res. Procedia 2015, 10, 840–849. [Google Scholar] [CrossRef] [Green Version]
- Gal, A.; Mandelbaum, A.; Schnitzler, F.; Senderovich, A.; Weidlich, M. Traveling time prediction in scheduled transportation with journey segments. Inf. Syst. 2017, 64, 266–280. [Google Scholar] [CrossRef]
- Talbi, E.G. Metaheuristics: From Design to Implementation; John Wiley & Sons: Hoboken, NJ, USA, 2009; Volume 74. [Google Scholar]
- Juan, A.A.; Faulin, J.; Grasman, S.E.; Rabe, M.; Figueira, G. A review of simheuristics: Extending metaheuristics to deal with stochastic combinatorial optimization problems. Oper. Res. Perspect. 2015, 2, 62–72. [Google Scholar] [CrossRef] [Green Version]
- Chica, M.; Juan, A.A.; Christopher, B.; Oscar, C.; David, W.K. Why simheuristics? Benefits, limitations, and best practices when combining metaheuristics with simulation. Stat. Oper. Res. Trans. 2020, 44, 311–334. [Google Scholar] [CrossRef] [Green Version]
- Ferone, D.; Gruler, A.; Festa, P.; Juan, A.A. Enhancing and extending the classical GRASP framework with biased randomisation and simulation. J. Oper. Res. Soc. 2019, 70, 1362–1375. [Google Scholar] [CrossRef]
- Martins, L.d.C.; Hirsch, P.; Juan, A.A. Agile optimization of a two-echelon vehicle routing problem with pickup and delivery. Int. Trans. Oper. Res. 2021, 28, 201–221. [Google Scholar] [CrossRef]
- Martins, L.d.C.; Tarchi, D.; Juan, A.A.; Fusco, A. Agile optimization for a real-time facility location problem in Internet of Vehicles networks. Networks 2021. [Google Scholar] [CrossRef]
- Kumar, K.V.; Kumar, K.D.; Poluru, R.K.; Basha, S.M.; Reddy, M.P.K. Internet of things and fog computing applications in intelligent transportation systems. In Architecture and Security Issues in Fog Computing Applications; IGI Global: London, UK, 2019; pp. 131–150. [Google Scholar]
- Bonomi, F.; Milito, R.; Zhu, J.; Addepalli, S. Fog computing and its role in the internet of things. In Proceedings of the MCC’12—Proceedings of the 1st ACM Mobile Cloud Computing Workshop, Helsinki, Finland, 13–17 August 2012; pp. 13–15. [Google Scholar]
- Peter, N. FOG Computing and Its Real Time Applications. Int. J. Emerg. Technol. Adv. Eng. FOG Comput. Real Time Appl. 2015, 5, 266. [Google Scholar]
- Bierzynski, K.; Escobar, A.; Eberl, M. Cloud, fog and edge: Cooperation for the future? In Proceedings of the 2017 2nd International Conference on Fog and Mobile Edge Computing (FMEC 2017), Valencia, Spain, 8–11 May 2017; pp. 62–67. [Google Scholar]
- Chen, S.; Wen, H.; Wu, J.; Lei, W.; Hou, W.; Liu, W.; Xu, A.; Jiang, Y. Internet of Things Based Smart Grids Supported by Intelligent Edge Computing. IEEE Access 2019, 7, 74089–74102. [Google Scholar] [CrossRef]
- Xhafa, F.; Aly, A.; Juan, A.A. Allocation of applications to Fog resources via semantic clustering techniques: With scenarios from intelligent transportation systems. Computing 2021, 103, 361–378. [Google Scholar] [CrossRef]
- Gohar, A.; Nencioni, G. The Role of 5G Technologies in a Smart City: The Case for Intelligent Transportation System. Sustainability 2021, 13, 5188. [Google Scholar] [CrossRef]
- Yan, G.; Wen, D.; Olariu, S.; Weigle, M.C. Security challenges in vehicular cloud computing. IEEE Trans. Intell. Transp. Syst. 2012, 14, 284–294. [Google Scholar] [CrossRef]
- Wang, K.; Yin, H.; Quan, W.; Min, G. Enabling Collaborative Edge Computing for Software Defined Vehicular Networks. IEEE Netw. 2018, 32, 112–117. [Google Scholar] [CrossRef]
- He, W.; Yan, G.; Xu, L.D. Developing vehicular data cloud services in the IoT environment. IEEE Trans. Ind. Inform. 2014, 10, 1587–1595. [Google Scholar] [CrossRef]
- Dobre, C.; Xhafa, F. Intelligent services for Big data science. Future Gener. Comput. Syst. 2014, 37, 267–281. [Google Scholar] [CrossRef]
- Xiao, Y.; Zhu, C. Vehicular fog computing: Vision and challenges. In Proceedings of the 2017 IEEE International Conference on Pervasive Computing and Communications Workshops (PerCom Workshops 2017), Kona, HI, USA, 13–17 March 2017; pp. 6–9. [Google Scholar]
- Tanganelli, G.; Vallati, C.; Mingozzi, E. A fog-based distributed look-up service for intelligent transportation systems. In Proceedings of the 18th IEEE International Symposium on A World of Wireless, Mobile and Multimedia Networks, WoWMoM 2017—Conference, Macau, China, 12–15 June 2017; pp. 4–9. [Google Scholar]
- Badidi, E.; Mahrez, Z.; Sabir, E. Fog computing for smart cities’ big data management and analytics: A review. Future Internet 2020, 12, 190. [Google Scholar] [CrossRef]
- Zhang, J.; Wang, F.Y.; Wang, K.; Lin, W.H.; Xu, X.; Chen, C. Data-driven intelligent transportation systems: A survey. IEEE Trans. Intell. Transp. Syst. 2011, 12, 1624–1639. [Google Scholar] [CrossRef]
- Minh, Q.T.; Kamioka, E.; Yamada, S. CFC-ITS: Context-Aware Fog Computing for Intelligent Transportation Systems. IT Prof. 2018, 20, 35–44. [Google Scholar] [CrossRef]
- Darwish, T.S.; Abu Bakar, K. Fog Based Intelligent Transportation Big Data Analytics in The Internet of Vehicles Environment: Motivations, Architecture, Challenges, and Critical Issues. IEEE Access 2018, 6, 15679–15701. [Google Scholar] [CrossRef]
- Raza, S.; Wang, S.; Ahmed, M.; Anwar, M.R. A survey on vehicular edge computing: Architecture, applications, technical issues, and future directions. Wirel. Commun. Mob. Comput. 2019, 2019. [Google Scholar] [CrossRef]
- Brennand, C.A.; Filho, G.P.; Maia, G.; Cunha, F.; Guidoni, D.L.; Villas, L.A. Towards a fog-enabled intelligent transportation system to reduce traffic jam. Sensors 2019, 19, 3916. [Google Scholar] [CrossRef] [Green Version]
- Chiang, M.; Zhang, T. Fog and IoT: An overview of research opportunities. IEEE Internet Things J. 2016, 3, 854–864. [Google Scholar] [CrossRef]
- Tufail, A.; Namoun, A.; Alrehaili, A.; Ali, A. A Survey on 5G Enabled Multi-Access Edge Computing for Smart Cities: Issues and Future Prospects. Int. J. Comput. Sci. Netw. Secur. 2021, 21, 107–118. [Google Scholar]
- Cheng, X.; Yang, L.; Shen, X. D2D for intelligent transportation systems: A feasibility study. IEEE Trans. Intell. Transp. Syst. 2015, 16, 1784–1793. [Google Scholar] [CrossRef]
- Camacho, F.; Cárdenas, C.; Muñoz, D. Emerging technologies and research challenges for intelligent transportation systems: 5G, HetNets, and SDN. Int. J. Interact. Des. Manuf. 2018, 12, 327–335. [Google Scholar] [CrossRef]
- Lee, Y.; Jeong, S.; Masood, A.; Park, L.; Dao, N.N.; Cho, S. Trustful Resource Management for Service Allocation in Fog-Enabled Intelligent Transportation Systems. IEEE Access 2020, 8, 147313–147322. [Google Scholar] [CrossRef]
- Raza, N.; Jabbar, S.; Han, J.; Han, K. Social Vehicle-To-Everything (V2X) communication model for Intelligent Transportation Systems based on 5G scenario. In Proceedings of the International Conference on Future Networks and Distributed Systems, Amman, Jordan, 26–27 June 2018. ACM International Conference Proceeding Series. [Google Scholar]
- Muthuramalingam, S.; Bharathi, A.; Gayathri, N.; Sathiyaraj, R.; Balamurugan, B. IoT based intelligent transportation system (IoT-ITS) for global perspective: A case study. In Internet of Things and Big Data Analytics for Smart Generation; Springer: Cham, Switzerland, 2019; pp. 279–300. [Google Scholar]
- Dai, X.; Ma, T. IoT perception and public transportation network optimization based on big data algorithms. Pers. Ubiquitous Comput. 2021, 1–12. [Google Scholar] [CrossRef]
- Swarnamugi, M.; Chinnaiyan, R. Modelling and Reasoning Techniques for Context–Aware Computing in Intelligent Transportation System. arXiv 2021, arXiv:2107.14374. [Google Scholar]
- Mohandu, A.; Kubendiran, M. Survey on Big Data Techniques in Intelligent Transportation System (ITS). Mater. Today Proc. 2021, 47, 8–17. [Google Scholar] [CrossRef]
- Calabrese, F.; Diao, M.; Di Lorenzo, G.; Ferreira, J.; Ratti, C. Understanding individual mobility patterns from urban sensing data: A mobile phone trace example. Transp. Res. Part C Emerg. Technol. 2013, 26, 301–313. [Google Scholar] [CrossRef]
- Zanella, A.; Bui, N.; Castellani, A.; Vangelista, L.; Zorzi, M. Internet of things for smart cities. IEEE Internet Things J. 2014, 1, 22–32. [Google Scholar] [CrossRef]
- Mahdavinejad, M.S.; Rezvan, M.; Barekatain, M.; Adibi, P.; Barnaghi, P.; Sheth, A.P. Machine learning for internet of things data analysis: A survey. Digit. Commun. Netw. 2018, 4, 161–175. [Google Scholar] [CrossRef]
- Graser, A. MovingPandas: Efficient structures for movement data in Python. GIForum 2019, 1, 54–68. [Google Scholar] [CrossRef]
- Pappalardo, L.; Simini, F.; Barlacchi, G.; Pellungrini, R. scikit-mobility: A Python library for the analysis, generation and risk assessment of mobility data. arXiv 2019, arXiv:1907.07062. [Google Scholar]
- Bao, W.; Liu, X.Y. Spatial Influence-aware Reinforcement Learning for Intelligent Transportation System. arXiv 2019, arXiv:1912.06880. [Google Scholar]
- Teng, H.; Liu, Y.; Liu, A.; Xiong, N.N.; Cai, Z.; Wang, T.; Liu, X. A novel code data dissemination scheme for Internet of Things through mobile vehicle of smart cities. Future Gener. Comput. Syst. 2019, 94, 351–367. [Google Scholar] [CrossRef]
- Cao, H.; Wachowicz, M.; Cha, S. Developing an edge computing platform for real-time descriptive analytics. In Proceedings of the 2017 IEEE International Conference on Big Data (Big Data), Boston, MA, USA, 11–14 December 2017; pp. 4546–4554. [Google Scholar]
- Panadero, J.; Freixes, A.; Mozos, J.M.; Juan, A.A. Agile Optimization for Routing Unmanned Aerial Vehicles under Uncertainty. In Proceedings of the XIII Congreso Español de Metaheurísticas, Algoritmos Evolutivos y Bioinspirados (MAEB 2017), Granada, Spain, 23–26 October 2018; pp. 635–640. [Google Scholar]
- Quintero-Araujo, C.L.; Caballero-Villalobos, J.P.; Juan, A.A.; Montoya-Torres, J.R. A biased-randomized metaheuristic for the capacitated location routing problem. Int. Trans. Oper. Res. 2017, 24, 1079–1098. [Google Scholar] [CrossRef]
- Adi, E.; Anwar, A.; Baig, Z.; Zeadally, S. Machine learning and data analytics for the IoT. Neural Comput. Appl. 2020, 32, 16205–16233. [Google Scholar] [CrossRef]
- Wei, J.; Long, K.; Gu, J.; Ju, Q.; Zhu, P. Optimizing bus line based on metro-bus integration. Sustainability 2020, 12, 1493. [Google Scholar] [CrossRef] [Green Version]
- Bistaffa, F.; Blum, C.; Cerquides, J.; Farinelli, A.; Rodríguez-Aguilar, J.A. A computational approach to quantify the benefits of ridesharing for policy makers and travellers. IEEE Trans. Intell. Transp. Syst. 2019, 22, 119–130. [Google Scholar] [CrossRef]
- Fikar, C.; Juan, A.A.; Martinez, E.; Hirsch, P. A discrete-event driven metaheuristic for dynamic home service routing with synchronised trip sharing. Eur. J. Ind. Eng. 2016, 10, 323–340. [Google Scholar] [CrossRef]
- Panadero, J.; Juan, A.A.; Bayliss, C.; Currie, C. Maximising reward from a team of surveillance drones: A simheuristic approach to the stochastic team orienteering problem. Eur. J. Ind. Eng. 2020, 14, 485–516. [Google Scholar] [CrossRef]
- Martí, R. Multi-start methods. In Handbook of Metaheuristics; Springer: Boston, MA, USA, 2003; pp. 355–368. [Google Scholar]


| Open Data Name | Format | Update Frequency | ||
|---|---|---|---|---|
| Name | City | Link | ||
| Open Data BCN | Barcelona | https://opendata-ajuntament.barcelona.cat/data/en/organization/transport?page=2 | All | availability/need |
| London data store | London | https://data.london.gov.uk/ | All | Daily/ availability/need |
| Data.gov | United state | https://data.gov/ | All | availability |
| NYC Open Data | New York City | https://data.cityofnewyork.us/ | CSV and XLSX and XML & RDF & RSS | availability |
| Data and information | Amsterdam | https://data.amsterdam.nl/datasets/zoek/ | CSV and XLSX and XLS and API | Daily |
| Overheid | Netherlands | https://data.overheid.nl/ | All | Daily |
| Helsinki Region Info-share | Helsinki | https://hri.fi/en_gb/ | All | availability |
| Chicago Data Portal | Chicago | https://data.cityofchicago.org/ | CSV and XLSX and XML and RDF and RSS | availability |
| Quebec data | Quebec | https://www.donneesquebec.ca/ | All | availability/need |
| Data.Rio | Rio | https://www.data.rio/ | CSV and XLSX | availability |
| Dublinked | Dublin Region | https://data.smartdublin.ie/ | All | availability/need |
| Data.gov | Ireland | https://data.gov.ie/ | All | availability |
| Berlin Open Data | Berlin | https://daten.berlin.de/ | CSV and PDF and WFS and HTML | availability |
| GovData | Germany | https://www.govdata.de/ | XLSX and ZIP and PDF and CSV and WMS adn HTML | availability |
| European Union | several cities in Europe | https://data.europa.eu/euodp/en/data/ | All | availability |
| European data portal | Several cities | https://www.europeandataportal.eu/en | All | availability |
| Name | Sector Availability | ||||
|---|---|---|---|---|---|
| Economic | Environment and Agriculture | Culture and Education | Transportation | Health | |
| Open Data BCN | Trade, employment, science, and technology. | Air quality, green point, list of associations and environment equipment and activities. | Accommodation, regulated education, list of grants, tourism points, temporary exhibitions. | Parking spots, biking stations, bus stops, street sections, traffic incidence notices, transportation equipment. | Measures the impact of COVID, family planning, hospitals, protected housing, social services centers. |
| London data store | List of the number of jobs, data on broader economic conditions. | Recycling, household waste, carbon dioxide emission, employment by industry, domestic energy efficiency. | Number of visits by country, annual education, working-age population, international visitors by city. | Number of journeys, traffic flow of vehicles, number of bicycles, road information. | Annual London survey, physically active children, public health. |
| Data.gov | Loan data, retail, services’ annual survey, the survey of business owners, construction price, economic indicators. | Oil and gas well map, clean air status, state soil geographic, earthquake locations, uranium location database, animal or plant diseases. | National register of historic districts, cultural resources, national automotive center, higher education school location, citizen participation. | Traffic data, railroad mileposts, airport runways, pedestrian crashes, bicycles, and pedestrian facilities. | Infant health indicators census tract and year, all live births in Illinois, human disease. |
| NYC Open Data | Civil service list, NYC jobs, BIC-issued violations, NYC free tax prep sites, payments received for DCA fines. | Water consumption, public recycling bins, natural gas consumption. | Latin cultural organizations, NYC museum recreation, physical education, bilingual education programs, art galleries, tourism grants. | Transportation sites and structure, new driver applications, subway entrances, real-time traffic speed. | Hospitals’ facilities, mental health service, health center district. |
| Data and information | Income and expenditure, employment of Amsterdam, international trade. | — | Sports providers, running routes, primary education, culture in Amsterdam, museums and galleries, hotels. | Traffic forecasting traffic model, mobility of public transport, walking and cycling, metro and tram rail management. | Health districts, social care, city care districts. |
| Overheid | Income before inflow, income after outflow, purchase data, international trade, transit trade. | Electricity balance, supply, and consumption, supply of natural gas, public electricity network, noise pollution, fruit growing, history of agriculture. | Public libraries, history of education, education expenses, museums’ size, class, visitors. | Disabled parking spaces, passenger mobility, travel characteristics, modes of transport, traffic performance. | Serious obesity in children, health expenditure, youth protection programs. |
| Helsinki Region Info share | Statistical yearbook of Helsinki, income by stage of life and area, income and consumption. | Nature data of Espoo city, energy consumption, district heat production, urban tree database of the city. | Places, events, and activities, grammar school, number of students, art and culture subsidies. | Intersections with traffic lights, signposts for bicycles, pedestrian traffic, parking payment zones. | Deaths and cause of death, comparison of child welfare, care for the mentally disabled. |
| Chicago Data Portal | Current employee information budget. | Energy usage, average electricity, green roofs map. | Individual Chicago landmarks, public library location, neighborhood boundaries. | Chicago street names, traffic crashes, taxi trips, average daily traffic counts, parking permit zones. | COVID cases, tests, and deaths, neighborhood health clinics, community service centers. |
| Quebec data | Business register, forest certification, pricing zone, list of work stoppages. | List of large parks, district parks and public spaces, public trees, food inspection, urban agriculture. | Places of interest of the city, all parks and green space, funding granted, administrative data, museum institutions. | Injuries suffered by accident, the road network of the city, sidewalks, and parking. | Daily number confirmed COVID cases, list of days of hospitalization. |
| Data.Rio | Budget execution revenue. | Air quality, rainfall zones, hydrography. | Proportion of room, special education, the arrival of tourists, basic education development, ranking of national tourists. | Bike racks, cycle network, passenger movement. | Municipal health units, programmatic health areas, pay health insurance. |
| Dublinked | Location of enterprise centers’ contact information. | Public lighting infrastructure, bin locations, local electoral areas, details of bathing water status, noise monitoring. | Location of sculptures, libraries, art centers, third level institutions, school warden duty points. | Bikeshare scheme, bicycle traffic volumes, road infrastructure, traffic congestion. | Locations health centers, contact information. |
| Data.gov | The location of enterprise centers, industrial estates, annual budget. | Wind energy development, winter service plan, water, power plants, number of farms, public slipways. | Tourism attractions, arts facilities, primary schools, the record of protected structures, number of registered teachers. | Parking of vehicles, road schedule, traffic congestion, traffic lights. | COVID-19 daily statistics, aftercare service, child welfare referrals. |
| Berlin Open Data | Gastronomy, shops, and other businesses. | List of street tree planting, used glass recycling. | List of memorial plaques, monuments of the state of Berlin. | Road traffic accidents, the volume of vehicles, parking space. | Covid number of cases, Covid number of indicators, staff in the public health service. |
| GovData | Foreign trade, import, export, employees gross wages. | Monitoring radioactivity, public wastewater treatment, pig and sheep population, land use and harvesting, electricity. | Tourist accommodation, the record of institute. | Wheel counting data, occupied parking spaces, road traffic accidents. | Daily alcohol consumption, diagnostic statistics. |
| European Union | Eu customs tariff, economic sentiment indicator. | European electricity market, European food consumption, number of dairy cows, greenhouse gas emissions, global surface water exploration. | Number of trips by country, world region of destination, tourism accommodation, classification of European skills. | Airport traffic data, the number of passengers. | Health programs, purity, and potency of drugs. |
| European data portal | Information of electronic address, goods decelerate, budget. | Land use, protected areas, oil, gas, water, pesticide sale, meat production. | List of courses, library collection, football data. | Public transport, schedule data, vehicles, passengers air transport. | Pharmacy type, number of confirmed COVID cases, deaths by week. |
| Open Data Name | Type of Transport | ||||||
|---|---|---|---|---|---|---|---|
| Name | Car-Taxi | Bus | Bike | Metro | Tram | EV/UAV | Airplane/Ship |
| Open Data BCN | YES | YES | YES | YES | YES | YES/NO | NO |
| London data store | YES | YES | YES | YES | YES | YES/NO | NO |
| Data.gov | YES | YES | YES | YES | YES | YES | YES |
| NYC Open Data | YES | YES | YES | YES | NO | Yes/NO | NO/ YES |
| Data and information | YES | YES | NO | YES | YES | NO | NO |
| Overheid | YES | YES | YES | YES | YES | NO | NO |
| Helsinki Region Infoshare | YES | YES | YES | YES | YES | NO | NO/YES |
| Chicago Data Portal | YES | YES | YES | NO | NO | NO | NO |
| Quebec data | YES | YES | NO | YES | NO | NO | NO |
| Data.Rio | YES | YES | YES | YES | NO | NO | NO/ YES |
| Dublinked | YES | YES | YES | NO | NO | NO | NO |
| Data.gov | YES | YES | YES | NO | NO | YES/NO | NO/ YES |
| Berlin Open Data | YES | YES | YES | NO | YES | NO | NO |
| GovData | YES | YES | YES | YES | YES | NO | NO/ YES |
| European Union | YES | YES | NO | YES | YES | NO | NO/ YES |
| European data portal | YES | YES | YES | YES | YES | YES/NO | NO/ YES |
| References | Year | Use Case | 4G/5G/6G | IoT | Fog | Cloud | ITS | Opt | ML | Data Analysis |
|---|---|---|---|---|---|---|---|---|---|---|
| [47] | 2019 | Self-driving vehicles, sensors raw data | X | X | X | X | X | X | ||
| [48] | 2012 | Fog characteristics | X | X | ||||||
| [49] | 2015 | Analyzed Fog Computing and its real time applications | X | X | X | X | ||||
| [50] | 2017 | Combination of cloud, fog and edge computing | X | X | X | |||||
| [51] | 2019 | Edge computing system for IoT-based | X | X | ||||||
| [52] | 2021 | Optimization methods, semantic clustering | X | X | X | X | X | |||
| [53] | 2021 | Various dimensions of 5G on ITS | X | X | X | X | ||||
| [54] | 2012 | Analyze security challenges, potential privacy threats in vehicular clouds | X | X | X | |||||
| [55] | 2018 | Collaborations different edge computing, vehicular edge computing | X | X | X | |||||
| [56] | 2014 | Multilayered vehicular data cloud, cloud computing and IoT technologies | X | X | X | X | X | |||
| [57] | 2014 | Analysis challenges of next-generation Big Data services CAPIM platform, Context-Aware Framework | X | X | X | |||||
| [58] | 2017 | Connect vehicles into mobile fog nodes | X | X | X | X | ||||
| [59] | 2017 | Service for fog computing with mobile nodes | X | X | ||||||
| [60] | 2020 | Fog-based data pipeline | X | X | X | X | X | |||
| [61] | 2011 | Multifunctional data-driven intelligent transportation system | X | X | X | |||||
| [62] | 2018 | Context-aware fog computing, multiple intelligent | X | X | X | X | ||||
| [63] | 2018 | Real-time ITS big data analytics in the Internet of vehicles | X | X | X | X | X | |||
| [64] | 2019 | Vehicular Edge Computing architecture, smart vehicle | X | X | X | X | X | |||
| [65] | 2019 | Traffic service, control congestion, roads classification | X | X | X | |||||
| [66] | 2016 | Challenges of fog and IoT | X | X | X | X | ||||
| [67] | 2021 | Multi-access edge computing | X | X | X | X | ||||
| [68] | 2015 | Device-to-device communications. vehicular networks | X | |||||||
| [69] | 2018 | Wireless technologies, vehicle-to-x connectivity | X | X | X | |||||
| [70] | 2020 | Vickrey–Clarke–Groves auction mechanism, road side unit | X | X | X | |||||
| [71] | 2018 | Vehicular-to-Everything, cellular 5G technologies, roadside infrastructure | X | X | X | X | X | |||
| [72] | 2019 | IoT-ITS system, multiple regression analysis, multiple discriminant analysis and logistic regression | X | X | X | |||||
| [73] | 2021 | Road traffic, traffic information | X | X | X | X | ||||
| [74] | 2021 | Context-awareness in the Intelligent Transportation System | X | X | X | X | X | X | ||
| [75] | 2021 | ITS, Big data analytics | X | X | X | X | ||||
| [76] | 2013 | Mobile phone data, mobility information | X | X | X | |||||
| [10] | 2013 | Vehicles, travel time, distance | X | X | ||||||
| [77] | 2014 | Urban IoT system | X | X | X | X | ||||
| [78] | 2018 | Smart cities IoT data | X | X | X | X | X | X | X | |
| [79] | 2019 | Movement data, python library | X | |||||||
| [80] | 2019 | Mobility analysis | X | X | ||||||
| [81] | 2019 | Spatial influence-based communication, multi-agent Deep Deterministic Policy Gradient | X | X | X | |||||
| [82] | 2019 | Mobile vehicles, taxi trajectory | X | X | X | X | X | |||
| [83] | 2017 | Mobile edge nodes, transit bus data | X | X | X | X | ||||
| [5] | 2012 | Vehicle subsystem, the station subsystem and the monitoring center | X | X | ||||||
| [84] | 2018 | Team orienteering problem, simheuristic algorithm, biased-randomized heuristic, simulation techniques | X | X | ||||||
| [86] | 2020 | Data generating for IoT, IoT applications | X | X | X | X | X | X | ||
| [87] | 2020 | Bus line optimization, metro integration | X |
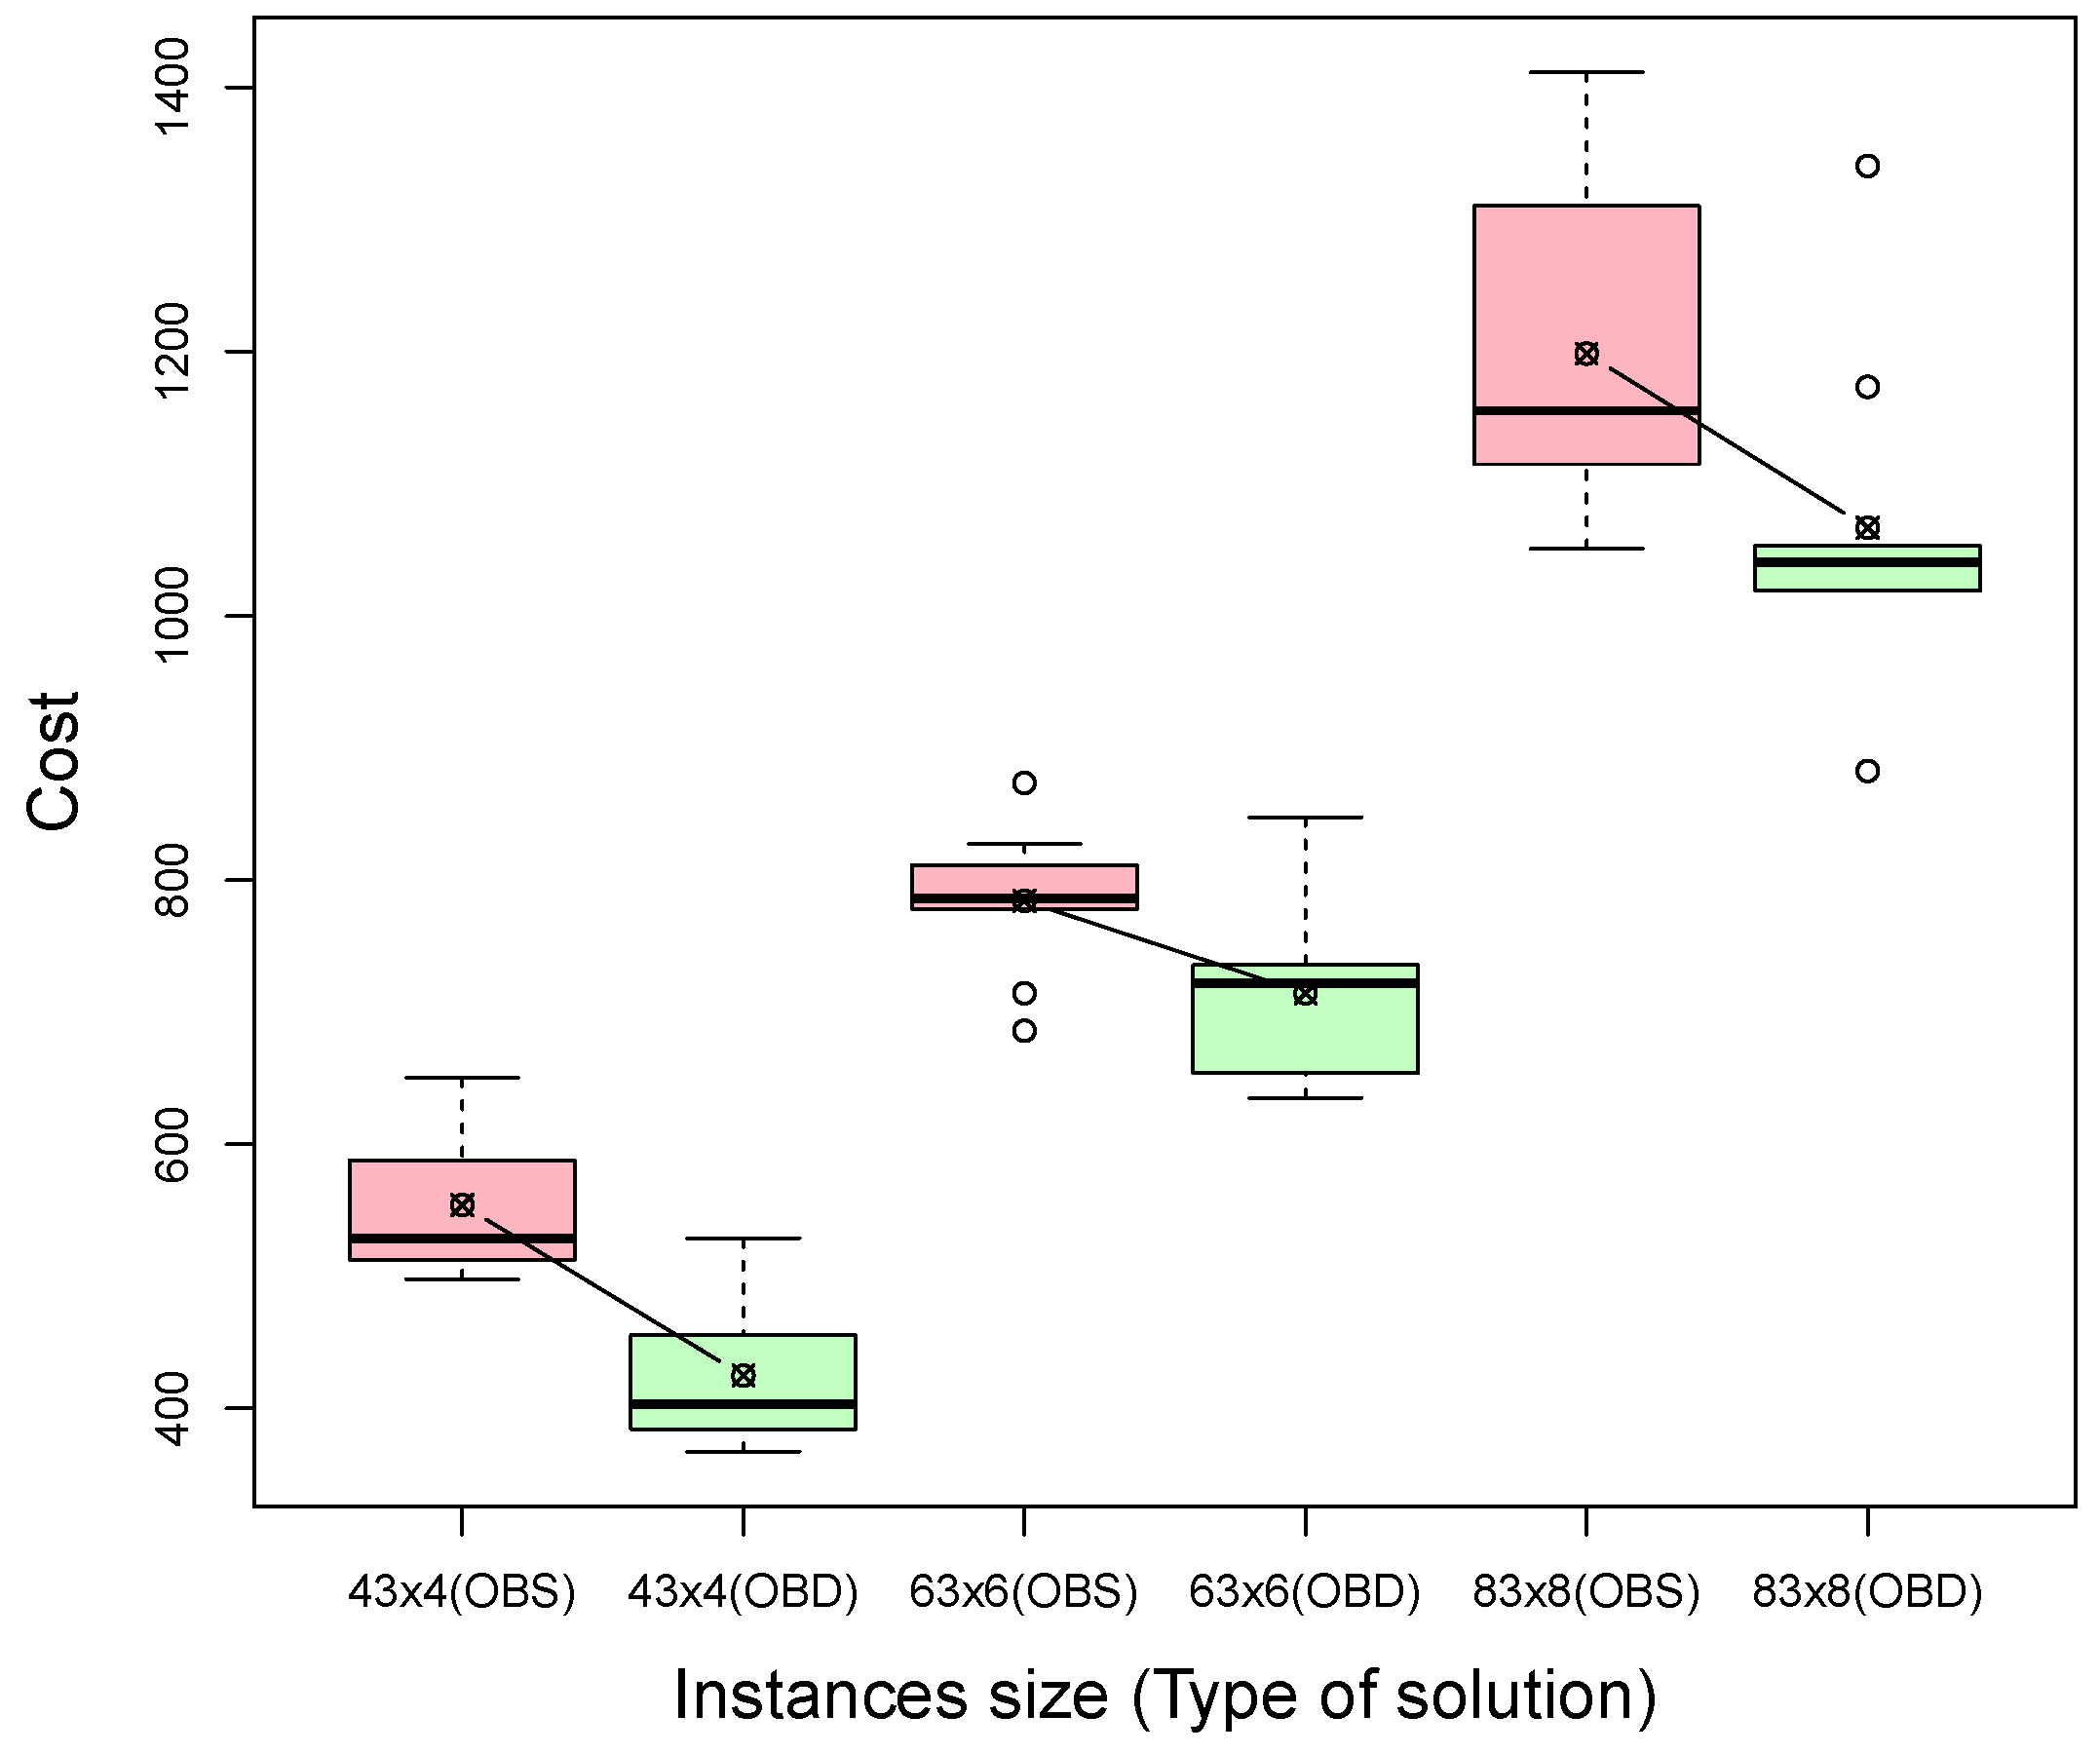
| Instance | Served Customers | Total Collected Fee | OBS Cost | OBD Cost | Gap |
|---|---|---|---|---|---|
| drsp43x4-1 | 17 | 237 | 595.80 | 384.14 | −35.53% |
| drsp43x4-2 | 18 | 295 | 587.88 | 492.58 | −16.21% |
| drsp43x4-3 | 20 | 373 | 512.51 | 398.23 | −22.30% |
| drsp43x4-4 | 22 | 394 | 502.89 | 402.97 | −19.87% |
| drsp43x4-5 | 15 | 223 | 582.33 | 374.95 | −35.61% |
| drsp43x4-6 | 22 | 347 | 528.00 | 528.70 | 0.13% |
| drsp43x4-7 | 16 | 261 | 497.84 | 367.13 | −26.26% |
| drsp43x4-8 | 23 | 468 | 528.30 | 455.39 | −13.80% |
| drsp43x4-9 | 18 | 313 | 650.22 | 418.83 | −35.59% |
| Average | 19.00 | 323.44 | 553.97 | 424.77 | −22.78% |
| drsp63x6-1 | 33 | 676 | 685.87 | 635.04 | −7.41% |
| drsp63x6-2 | 34 | 678 | 777.73 | 735.61 | −5.42% |
| drsp63x6-3 | 31 | 494 | 811.37 | 726.05 | −10.51% |
| drsp63x6-4 | 35 | 700 | 786.22 | 721.99 | −8.17% |
| drsp63x6-5 | 30 | 515 | 714.26 | 665.46 | −6.83% |
| drsp63x6-6 | 33 | 560 | 827.48 | 847.60 | 2.43% |
| drsp63x6-7 | 30 | 506 | 799.50 | 654.05 | −18.19% |
| drsp63x6-8 | 28 | 383 | 873.49 | 791.88 | −9.34% |
| drsp63x6-9 | 34 | 608 | 782.46 | 650.52 | −16.86% |
| Average | 32.00 | 568.89 | 784.26 | 714.24 | −8.92% |
| drsp83x8-1 | 40 | 582 | 1114.75 | 1020.69 | −8.44% |
| drsp83x8-2 | 38 | 722 | 1411.50 | 1040.39 | −26.29% |
| drsp83x8-3 | 39 | 660 | 1310.40 | 1173.44 | −10.45% |
| drsp83x8-4 | 43 | 740 | 1050.79 | 1051.51 | 0.07% |
| drsp83x8-5 | 34 | 516 | 1155.35 | 882.54 | −23.61% |
| drsp83x8-6 | 39 | 661 | 1092.90 | 1019.06 | −6.76% |
| drsp83x8-7 | 41 | 730 | 1124.13 | 1019.06 | −9.35% |
| drsp83x8-8 | 40 | 726 | 1315.08 | 1340.66 | 1.95% |
| drsp83x8-9 | 39 | 668 | 1212.02 | 1052.88 | −13.13% |
| Average | 39.22 | 667.22 | 1198.55 | 1066.69 | −10.67% |
Publisher’s Note: MDPI stays neutral with regard to jurisdictional claims in published maps and institutional affiliations. |
© 2021 by the authors. Licensee MDPI, Basel, Switzerland. This article is an open access article distributed under the terms and conditions of the Creative Commons Attribution (CC BY) license (https://creativecommons.org/licenses/by/4.0/).
Share and Cite
Peyman, M.; Copado, P.J.; Tordecilla, R.D.; Martins, L.d.C.; Xhafa, F.; Juan, A.A. Edge Computing and IoT Analytics for Agile Optimization in Intelligent Transportation Systems. Energies 2021, 14, 6309. https://doi.org/10.3390/en14196309
Peyman M, Copado PJ, Tordecilla RD, Martins LdC, Xhafa F, Juan AA. Edge Computing and IoT Analytics for Agile Optimization in Intelligent Transportation Systems. Energies. 2021; 14(19):6309. https://doi.org/10.3390/en14196309
Chicago/Turabian StylePeyman, Mohammad, Pedro J. Copado, Rafael D. Tordecilla, Leandro do C. Martins, Fatos Xhafa, and Angel A. Juan. 2021. "Edge Computing and IoT Analytics for Agile Optimization in Intelligent Transportation Systems" Energies 14, no. 19: 6309. https://doi.org/10.3390/en14196309
APA StylePeyman, M., Copado, P. J., Tordecilla, R. D., Martins, L. d. C., Xhafa, F., & Juan, A. A. (2021). Edge Computing and IoT Analytics for Agile Optimization in Intelligent Transportation Systems. Energies, 14(19), 6309. https://doi.org/10.3390/en14196309