Article

Quality of Life Surveys as a Method of Obtaining Data for Sustainable City Development—Results of Empirical Research

Faculty of Organization and Management, Silesian University of Technology, ul. Roosevelta 26-28, 41-800 Zabrze, Poland
*
Author to whom correspondence should be addressed.
Energies 2021, 14(22), 7592; https://doi.org/10.3390/en14227592
Submission received: 3 August 2021 / Revised: 4 November 2021 / Accepted: 8 November 2021 / Published: 13 November 2021
(This article belongs to the Special Issue Advanced Technologies in Smart Cities)

Abstract

:
Citizens are beginning to play a key role in the development of the smart city concept, providing a wealth of information for the sustainable development of cities. For this research, we planned and conducted empirical studies to examine the areas influencing the quality of life from the point of view of municipalities. A questionnaire form was developed and a survey was conducted on a sample of 84 municipal offices in Poland. We tabulated, statistically processed and analysed the results and thoroughly investigated the areas influencing the quality of life, their impact and importance. We determined which areas of the city are included in municipal research and checked whether there was a need to expand these areas. We found that the people responsible for research in municipal offices are aware that the quality of life is influenced by many areas and conditions. However, these people only choose selected areas for research and have a problem with indicating what can be extended to them. At the end of the article, the limitations of the conducted research are indicated and the directions for further research are proposed.

1. Introduction

The smart city concept is constantly developing and evolving. The development of the concept also affects the definitions of a smart city. Currently, a city can be considered smart when it undertakes investments in human and social capital and infrastructure (transportation, information and communication technologies) for sustainable economic development and high quality of life, with wise use of natural resources and instruments of participatory democracy [1,2]. There are three basic stages in the development of the smart city concept [3,4,5]. In successive stages of development, emphasis is placed on selected aspects of city activities. Currently, citizens are starting to play a key role in the development of cities. It is the citizens who should provide information, take an active part in development and co-create their city [1,2]. Nowadays, it is believed that the human factor in the smart city concept is more important than the technological factor [6]. Appropriate use of human and social capital has to lead to the sustainable development of cities. Generally, sustainable development can be viewed as the idea or concept of development that meets the needs of the modern generation without compromising the ability of future generations to meet their own needs [7]. There have been many definitions of sustainable development and attempts to define the meaning of this term [8,9,10,11,12,13,14]. The city as a unit—composed of many different elements, between which there are various types of relationships, functioning in a specific area, in a specific environment—should be treated as a dynamic, functional whole, and therefore, as a territorial social system [15]. Thus, the city requires a different approach to the issue of sustainable development, namely an integrated approach, including the social, economic and ecological dimensions, often additionally taking into account spatial and institutional aspects [16,17,18]. The essence of the concept of the territorial social system, especially useful in relation to the city, is the effective control of the territory by the residents who live there, which is also a necessary condition for sustainable development [15]. The planning of sustainable city development requires a thorough knowledge of individual elements of the city system and the network of relations between them, adopting assumptions and goals leading to achieving a balance in the city, as well as adjusting these assumptions to local conditions. For these reasons, it is not possible to directly replicate even the most successful solutions taken from other geographical, natural, political and socio-economic realities. It is necessary to obtain a variety of information from the city level, with particular emphasis on information from residents living in a given area. Many factors and conditions influence the city’s sustainable development. Multi-criteria smart city models try to describe these phenomena. One of the most popular models is the multi-criteria Smart City Model [19]. In this model, six basic areas are distinguished: smart economy, smart mobility, smart governance, smart environment, smart people and smart living, all of which influence each other and are expected to lead to sustainable development. Complex relationships and interactions take place between these areas [20,21,22]. Many authors emphasise the need to collect various data that can be used for the sustainable development of the city [23,24,25,26]. The results of research on European projects [27] also draw attention to this. Quality of life surveys are an important source of obtaining information from residents. There is little information in the literature on quality of life research and the use of this information to make decisions in various areas of city activity. There is a clear cognitive gap regarding obtaining information from residents and using it for the sustainable development of the city. Thus, we developed a concept for a comprehensive study of how cities understand and research the quality of life of their residents and use this information for sustainable development [28]. This research represents a completely new approach to collecting information from residents. So far, quality of life surveys have only been used to determine the satisfaction of residents, assess the achievements of city authorities and to possibly collect data needed to calculate indicators [29,30,31]. Here, we propose a new way of conducting research that will provide information on how municipal offices carry out this research and how they use the obtained information for the purposes of sustainable development. The proposed research consists of three phases. The first phase is to define how municipal offices understand the areas influencing the quality of life and to what extent they use these areas for research carried out in their area. The first phase of the research, therefore, addresses the issue of data collection by the city office. The aim of this phase of the research is to find out whether city halls are able to collect data from different areas of activity so that it can be used for city development at a later time. The results of the first phase of the research will be presented in this study. In the second phase of the research, it is planned to investigate how cities analyse and process the data obtained from the quality of life survey in order to prepare them for use for sustainable development. In the third phase of the research, it is planned to determine which data obtained from the quality of life survey are used to make decisions and actions for the sustainable development of the city.
The aim of the study is to examine the areas influencing the quality of life from the point of view of municipalities. Thus, the idea is to learn how city halls interpret areas that are potential data sources and how these areas are used in the office’s quality of life surveys of residents. Gathering this information will allow us to determine whether city halls are able to obtain data from different areas of activity, which, in the long run, could be used for the needs of sustainable city development. The research was conducted on the whole population of cities located in Poland with a population over 50,000. The objects of the research are municipal offices. The following research questions were formulated:
Q1:
How do cities perceive the areas influencing the quality of life and their importance?
Q2:
In what areas do cities conduct quality of life research and do they see the need to expand them?
Q3:
What are the relationships between the areas influencing the quality of life, their importance, the areas covered by the research (consideration) and the areas which should be expanded upon in the research (extensibility)?

2. Literature Review

For decades, quality of life has been a subject of interest in many fields of science, including sociology, economics, medicine, psychology, philosophy, ethics and management sciences [32,33,34,35,36,37,38,39,40,41,42,43].
Quality of life is a complex concept that is difficult to define, encompassing many aspects and elements that influence and interact with each other. The multifaceted nature of the quality of life has resulted in a number of interpretations and definitions of this term, which partially change over time [29,40,41,42,43,44,45,46,47,48,49]. The complexity of the concept of quality of life directly results from its division into subjective (qualitative, non-measurable) factors, individually assessed from the perspective of the individual, and objective (quantitative, measurable) factors, giving a picture of the economic situation on the basis of ‘hard’ indicators [50,51,52]. They are considered in terms of welfare, standard of living (in an objective, measurable sense) and well-being, quality of life (in a subjective and qualitative sense) [53,54,55]. The division of the quality of life into these basic areas, together with their definition in two approaches: subjective and objective, is presented in the model developed by E. Allardt [56]. Objective and subjective, internal and external aspects must be related to each other from the point of view of internal compliance and complementarity of this concept [57]. In order to properly define the concept of quality of life, it is necessary to take a holistic view of this issue and take into account its multidimensional nature. By analysing various definitions, one can adopt a generalised interpretation of this concept in the context of the city [29,44,46,47,48,49]. The quality of life in the city is the whole of the living conditions of individuals and communities, shaped in the social, economic, environmental and awareness dimensions in a specific space of a territorial unit, which in an objective and subjective (quantitative and qualitative) perspective determine the sense of satisfying the needs and fulfilling life aspirations in a given place and time [29,49]. Therefore, a holistic approach to measuring the quality of life requires the association of objective indicators (measurable with the available statistical data) with subjective indicators related to feelings, assessments in surveys [56]. Research on the quality of life requires taking into account two categories: direct quality of life, which is reflected as the result of questionnaires, and indirect, reflected as result of public statistics, determined using indicators, e.g., the number of doctors per 1000 residents [54,55].
Three types of quality of life surveys are carried out in the European Union: the European Quality of Life Survey, the European Union Statistics on Income and Living Conditions (EU-SILC) and surveys of the quality of life in European cities under the Urban Audit Program. The European Quality of Life Survey is carried out by the European Foundation for the Improvement of Living and Working Conditions (Eurofound) established by the European Commission. The main areas of the research concern: employment and working conditions, work-life balance, industrial relations and partnership, social cohesion. The assumptions of the study refer to the integrity of three spheres of life: ‘have, be and love’ according to 12 quality of life areas, giving a total of 161 indicators in the following categories: health, employment, income poverty, education, family, participation in the life of the community and society, housing, environment, transport, communication, safety, free time, satisfaction with life [58]. The European Union Statistics on Income and Living Conditions (EU-SILC) in Poland is conducted and published by Statistics Poland. The main areas of research are the source of data on the income situation, poverty and other living conditions of the population. The research method is a direct interview with the respondent—a voluntary survey of private households [59]. Research on the quality of life in European cities under the Urban Audit programme is carried out as a joint undertaking: of the European Commission, the Directorate General for Regional Policy of the European Union and the Statistical Office of the European Community (Eurostat), which is the coordinator of all works [60]. The contractors of the programme are national statistical offices, municipal offices and local governments. The aim of the survey is to obtain comparable statistical data on living conditions in European cities. The data concern, inter alia, demography, structure of households, labour market, education and health protection [61]. Urban Audit in its basic version focuses on the objective quality of life in cities, most often defined in Poland as living conditions. The subjective quality of life indicators—satisfaction with life and its various aspects—is complementary to the information obtained in this programme [62].
Polish experience in measuring the quality of life is currently focused on public statistics, government research and commercial research. Most important in terms of the usefulness of the results and the availability of data is Social Diagnoses about the conditions and quality of life of Poles (Diagnozy społeczne o warunkach i jakości życia Polaków), a study commissioned by the Ministry of Labour and Social Policy by a team of experts using data from Statistics Poland. It is a representative, independent survey of the objective and subjective quality of life of Poles. Subsequent editions were carried out in the years 2000, 2003, 2005, 2007, 2010, 2013 and 2015, each time resulting in a research report entitled Social Diagnosis—Conditions and Quality of Life of Poles. Available data from 2015 assess respondents’ quality of life according to the criterion of gender and age, education, and social and professional status in eight dimensions of life: level of civilisation, material well-being, social well-being, pathology, social capital, mental well-being, physical well-being and life stress [63]. Additionally, quality of life surveys are conducted at the local level by local government departments, or municipal offices. The results of these studies are used for internal purposes defined by cities.
There is a wealth of literature on researching the quality of life in cities, using the methods and other tools presented above.
In recent years, there have been many publications on the study of the quality of life in cities [31,64,65,66,67,68,69,70,71]. However, the literature review did not show that the data obtained from the quality of life survey were used for the sustainable development of the city. The obtained data are generally used for [30,31,71,72]:
(a)
Obtaining information from the managers on whether the city is developing in the planned direction and at a satisfactory pace;
(b)
Identification of development barriers and updating the existing city development strategies;
(c)
Communication between the municipal office and residents;
(d)
Creating indicators and rankings;
(e)
Assessment of the achievements of city authorities.
Individual authors on our research team noticed that the data obtained from the quality of life survey are marginally processed and used to make decisions and actions aimed at the sustainable development of the city in various areas [28,31].

3. Materials and Methods

The subjects of the present research are municipal offices located in Poland, in cities of various sizes. In Poland, according to the data of Statistics Poland, 944 localities with the status of a city were registered as of 1/01/2020. Taking into account the number of residents, these cities can be divided into 11 groups: 1, over 1,000,000; 2, 500,000–999,999; 3, 250,000–499,999; 4, 100,000–249,999; 5, 50,000–99,999; 6, 25,000–49,999; 7, 10,000–24,999; 8, 5000–9999; 9, 2500–4999; 10, 1000—2499; 11, below 1000. When starting the research, a research sample was selected. It was assumed that large cities would be selected for the study and that the research sample should be relatively large. Therefore, we selected for this study the entire population of cities in Poland with more than 50,000 inhabitants. In total, 84 cities belonging to five size groups were selected for the study (Table 1).
Taking into account the small number of cities in the first groups, for the purposes of research, the cities were divided into three size groups: over 250,000 residents (10 cities), from 100,000 to 249,999 residents (25) and from 50,000 to 99,999 residents (41). This division into three research groups was used in the description of research results and in statistical tests.
The organization of the research procedure is shown in Figure 1.
The research methodology, research questions were formulated and a questionnaire survey was chosen as the research tool. Based on the literature study, the original questionnaire form we prepared contained 29 closed-ended questions. In order to allow respondents to provide their own answers, the category ‘other’ was added to several questions. The survey form ends with a certificate which takes into account the size of the city, income per capita and the province in which the city is located. It was assumed that the research would be anonymous. As part of the tender, a professional organisation was selected to carry out the research. The survey was addressed to people in municipal offices who manage or conduct research on the quality of life of residents. The research was carried out in the period from October to December 2020; 76 cities responded from the sample of 84 cities to which the study was directed, a return level of 90.5%. For the purposes of this study, responses to 10 questions from the survey were used, including the four most extensive questions on areas influencing quality of life. Included in the questions about these areas were 25 areas, the names of which were formulated by the authors of this paper based on their literature studies.
The data collected in the study were prepared using IBM SPSS Statistics and the R programme [73]. A five-point Likert measurement scale was adopted in the key questions. For the purposes of assessing and comparing the areas of the study of the quality of life in cities in terms of their impact, importance, consideration and extensibility, the analysis of the basic characteristics of the central tendency (mean, median, modal) and variability (standard deviation, range: minimum–maximum) was used. The results are summarised in the following tables. The basic tools for examining the influence of the city size on the obtained results were the Kruskal–Wallis test and analysis of variance (ANOVA). In order to identify which size groups of cities significantly differentiate (impact, importance, consideration and extensibility) in the areas under consideration, the Mann–Whitney U-test and Student’s t-test were used, including bootstrap methods [74] (1000 replications each time, simple random sampling with replacement). Bootstrapping methods simulate a stochastic process on the basis of a sample by resampling. The work uses a non-parametric bootstrap, in which replications are samples randomly replaced from the original sample (results). Bootstrapping methods were used due to the small number of analysed groups. The conclusion was restrictive in the assumption that there is a significant influence of the city size on the obtained results when it is simultaneously confirmed by non-parametric tests (Kruskal–Wallis test, Mann–Whitney U-test) and parametric tests (ANOVA, t-test). The generalised study of the relationship between the considered attributes (impact, importance, inclusion in the study, necessity to extend) was carried out by averaging (arithmetic mean) the scores for each of the analysed areas. Then, a correlation analysis was performed using the Pearson correlation coefficient. Additionally, the dependencies occurring in pairs are presented in the figures along with a simple regression analysis. When formulating conclusions, a significance level of 0.05 was adopted.

4. Results

The research was carried out on a sample of 84 cities, and 76 municipal offices replied to the research. Based on the research results, out of 76 cities, only 35 carry out a formalised survey on the quality of life of their residents. This group includes 10 cities with more than 250,000 residents, 12 cities with 100,000–249,999 residents and 14 cities with 50,000–99,999 residents. In the remaining studied cities (41 municipal offices), we found that no formalised research on the quality of life of residents was carried out. Therefore, the research procedure was conducted for a group of 35 cities that carry out formalised quality of life research.
The first stage of the research procedure was to identify the areas that affect the quality of life from the point of view of the municipal office.
Searching for the answer to the first research question (Q1), whether cities are able to identify the areas influencing the quality of life and their importance, the offices were asked to indicate the areas which, by their task, affect the quality of life. The respondents had the opportunity to choose from 25 areas proposed by the authors of the study, and to add another area which, in their opinion, has an impact on the quality of life, and was not proposed. In none of the municipalities surveyed did respondents add another area of their own. We assessed the impact of each area on the quality of life on a five-point scale: 1—definitely not; 2—probably not; 3—neither yes nor no; 4—probably; 5—definitely yes. The obtained results, ranked taking into account the mean value, are summarised in Table 2.
Based on the obtained results, we can conclude that all surveyed offices considered the proposed areas in the survey as having an impact on the quality of life of the residents. The mean value obtained in each case is over 4, i.e., all areas, according to the respondents, affect the quality of life to the extent of ‘definitely yes’ or ‘probably’. None of the areas received a score of 1 (‘definitely not’), and only single indications in the six examined areas received a score of 2 (‘probably not’). The obtained results confirm that municipal offices are aware that the quality of life of residents is influenced by many areas and various conditions. Therefore, conducting research on the quality of life requires offices to take into account many components that will describe the phenomenon under study. When analysing the obtained results, taking into account the mean, the studied areas can be divided into two groups. The first group with a mean above 4.5 indicates the areas which, according to the offices, have a high impact on the quality of life (16 areas). Among these areas, the most important ones for the quality of life can be identified. According to the surveyed cities, the most important areas for the quality of life are living conditions in the city, public safety and education. The second observation in this group is the identification of eight areas which, according to the respondents, have the greatest impact on the quality of life. The mean as well as the minimum and maximum values are included here. The areas indicated are living conditions in the city, public safety, education, housing, future perspectives, leisure opportunities, transport and communication and working conditions in the city. These areas can be considered the most important for the quality of life from the perspective of the municipal office and there are no discrepancies between individual offices. All surveyed municipal offices consider these areas to be of key importance, influencing the quality of life of the residents. The second group of areas, which obtained a mean above 4.0 and below 4.5, has an average impact on the quality of life (nine areas). In this group, there are larger discrepancies between individual offices. There are areas which, according to individual offices, may not have any impact on the quality of life.
In order to investigate whether the size of the city has an influence on the obtained results, comparative analyses were carried out using the Kruskal–Wallis, ANOVA, Mann–Whitney U-test and Student’s t-test for three groups of the studied cities. The obtained research results clearly indicate the existence of a significant difference in the assessment of the impact on the quality of life in relation to the ‘leisure opportunities’ (Kruskal–Wallis: Chi-square = 6.000, df = 1, p = 0.014, ANOVA: F = 4.945, df = 2, p = 0.013). The influence of large cities is significantly greater than that of medium-sized cities (U = 27, p = 0.014, t = 3.317, df = 11, p = 0.007, p (bootstrap) = 0.006).
The second stage of the research procedure was to determine the importance of areas in assessing the quality of life in the city. In the survey, the offices were asked to determine the importance (significance) of individual areas influencing the quality of life. The respondents had an option to choose the areas out of 25 proposed by the authors of the study. The names of these areas were the same as in the earlier study of the areas’ impact on quality of life. Each area was assessed on a five-point scale: 1—definitely unimportant; 2—probably unimportant; 3—neither important nor unimportant; 4—probably important; 5—definitely important. The obtained results, ranked taking into account the mean value, are summarised in Table 3.
Based on the obtained results, we can conclude that the surveyed offices considered all the proposed areas in the survey as important (significant) in assessing the quality of life of residents. The obtained mean value in the case of 24 areas is over 4.0, i.e., all areas, according to the respondents, have an impact on the quality of life to the extent of ‘definitely important’ or ‘probably important’. In the case of the last area, the 25th area, technical services obtained a mean importance of 3.94. None of the areas received a score of 1 (‘definitely unimportant’), and only single indications in the five studied areas obtained a score of 2 (‘probably unimportant’). The obtained results confirm that municipal offices are aware that all areas in the study of the quality of life of residents are important. When analysing the obtained results, taking into account the mean, the studied areas can be divided into two groups. The first group with a mean above 4.5 indicates the areas which, according to the offices, are of high importance (13 areas). As in the case of the study of the impact on the quality of life, one might be tempted to identify the areas of greatest importance for the study of the quality of life. Based on the mean as well as the minimum and maximum value, four such areas were identified: public safety, living conditions in the city, housing and leisure activities. The second group, which obtained a mean above 3.9 and below 4.5, is important in assessing the quality of life at the mean level (12 areas). In this group, there are larger discrepancies between individual offices. There are areas which, according to individual offices, may have a rather unimportant impact on the quality of life.
Interesting information is provided by checking whether the size of the city has an impact on the obtained results. The obtained results indicate a significant difference in the area of ‘leisure opportunities’ (Kruskal–Wallis: Chi-square = 6.000, df = 1, p = 0.14, ANOVA: F = 6.807, df = 2, p = 0.003) and ‘sports and recreation’ (Kruskal–Wallis: Chi-square = 5.192, df = 1, p = 0.023, ANOVA: F = 5.442, df = 2, p = 0.009). In terms of ‘leisure opportunities’ (as in the case of the impact assessment), larger cities ascribe more importance than medium-sized cities (U = 27, p = 0.014, t = 3.317, df = 11, p = 0.007, p (bootstrap) = 0.006) and small in relation to the mean (U = 48, p = 0.016, t = 2.569, df = 16, p = 0.021, p (bootstrap) = 0.023). For ‘sport and recreation’, the results are similar. In relation to the medium-sized cities, large cities ascribe greater importance to this area (U = 27, p = 0.023, t = 2.581, p = 0.018, p (bootstrap) = 0.010) and small cities ascribe greater importance to this area than medium-sized cities (U = 38, p = 0.006, t = 3.206, p = 0.004, p (bootstrap) = 0.002). Therefore, it can be said that medium-sized cities (compared to the other two groups) significantly determine a lower importance of ‘leisure opportunities’ and ‘sports and recreation’ in the study of the quality of life in the city.
The third stage of the research procedure was to determine in which areas cities conduct quality of life research. Respondents chose the areas in which they conduct quality of life research using a five-point scale: 1—definitely not; 2—probably not; 3— neither yes nor no; 4—probably; 5—definitely yes. The obtained results, ranked taking into account the mean value, are summarised in Table 4.
The obtained results indicate large differences in the selection of areas for studying the quality of life in individual municipal offices. Based on the mean value and the minimum and maximum values, only the first seven areas (Table 4) can be included in the surveys by all offices. Only five areas from this group received a ‘probably’ or ‘definitely yes’ answer in all surveyed offices. Areas from item 8 to item 20 are assessed by at least one office as not applicable in the study (answer 2—probably not). The areas from items 21 to 25 are assessed even more negatively; the answer is 1 (‘definitely not’) at least once. Such answers indicate that municipal offices only choose selected areas related to the quality of life for their research, and they only conduct research within these areas. There is a certain dissonance here. The previous answers (Table 2 and Table 3) show that offices are aware that the quality of life is influenced by many areas, while the actual research conducted among their residents is only chosen by the offices in selected areas and their number is relatively small.
Interesting information is provided by checking whether the size of the city has an impact on the obtained results. The conducted tests showed a significant difference between the considered groups of cities in terms of: ‘leisure opportunities’ (Kruskal–Wallis: Chi-square = 7.500, df = 1, p = 0.006, ANOVA: F = 7.099, df = 2, p = 0.003), ‘civil society’ (Kruskal–Wallis: Chi-square = 7.940, df = 1, p = 0.005, ANOVA: F = 3.556, df = 2, p = 0.040), ‘sports and recreation’ (Kruskal–Wallis: Chi-square = 13.636, df = 1, p < 0.001, ANOVA: F = 13.709, df = 2, p < 0.001) and ‘transport and communication’ (Kruskal–Wallis: Chi-square = 7.500, df = 1, p = 0.006, ANOVA: F = 4.605, df = 2, p = 0.017). Large cities and small cities included the area of ‘leisure opportunities’ and ‘sports and recreation’ to a larger extent, and with more significance in the study than medium-sized cities (large compared to medium-sized cities: U = 22.5, p = 0.006, t = 3.924, df = 11, p = 0.002, p (bootstrap) = 0.008; small compared to medium-sized cities: U = 47, p = 0.021, t = 2.481, df = 19.395, p = 0.022, p (bootstrap) = 0.041). Large cities, compared to other cities, took into account the area of ‘civil society’ to a larger extent, and with more significance (large compared to medium-sized cities: U = 19, p = 0.005, t = 3.345, df = 19, p = 0.003, p (bootstrap) = 0.005; large in relation to small-sized cities: U = 32.5, p = 0.027, t = 2.694, df = 17.424, p = 0.015, p (bootstrap) = 0.014), as well as the area ‘transport and communication’ (large compared to medium-sized cities: U = 22.5, p = 0.006, t = 3.924, df = 11, p = 0.002, p (bootstrap) = 0.010; large in relation to small-sized cities: U = 36, p = 0.025, t = 3.122, df = 13, p = 0.008, p (bootstrap) = 0.015).
The fourth stage of the research procedure was to determine from the city’s point of view whether there is a need to expand the currently studied areas influencing the quality of life. Respondents chose the areas which, in their opinion, should be expanded upon in the conducted quality of life research using a five-point scale: 1—definitely not; 2—probably not; 3—neither yes nor no; 4—probably; 5—definitely yes. The obtained results, ranked taking into account the mean value, are summarised in Table 5.
The obtained results indicate large differences in perception, which should be expanded upon in the research on the quality of life carried out by individual municipal offices. All 25 areas received answers ranging from the lowest (1) to the highest (5), which means that one office considers the area indicated to be definitely important in terms of the need for an expansion, while the other office considers the same area definitely not important. All surveyed areas obtained a mean value in the range from 3.03 to 3.37, which means that it is difficult to indicate areas that, according to the majority of surveyed offices, should be qualified for the need of an expansion. Offices give the impression that they do not really know what areas in which their research could be expanded upon. Only the first ten areas with a mean above 3.25 can be considered as potential areas where opportunities for expanding upon the conducted quality of life research can be sought. Obtaining a mean answer of 3 can be considered a statement by the offices that there are no universal areas that should be expanded upon. Each office, taking into account the currently studied areas affecting the quality of life, proposes the possibility of expanding them to areas specific to a given office, the number of which is usually small. This can give the impression that offices have a problem with identifying areas and do not really know in what areas their research could be expanded upon.
In terms of the need to expand upon the quality of life research, no significant differences in terms of city size were identified.
The fifth stage of the research procedure was to determine the relationship between the areas influencing the quality of life, their importance, areas included in the research and areas which should be expanded upon in the research.
In order to define the generalised relationships between the impact, importance, consideration and the need to expand upon the research in relation to the analysed areas, the following pairs were compared:
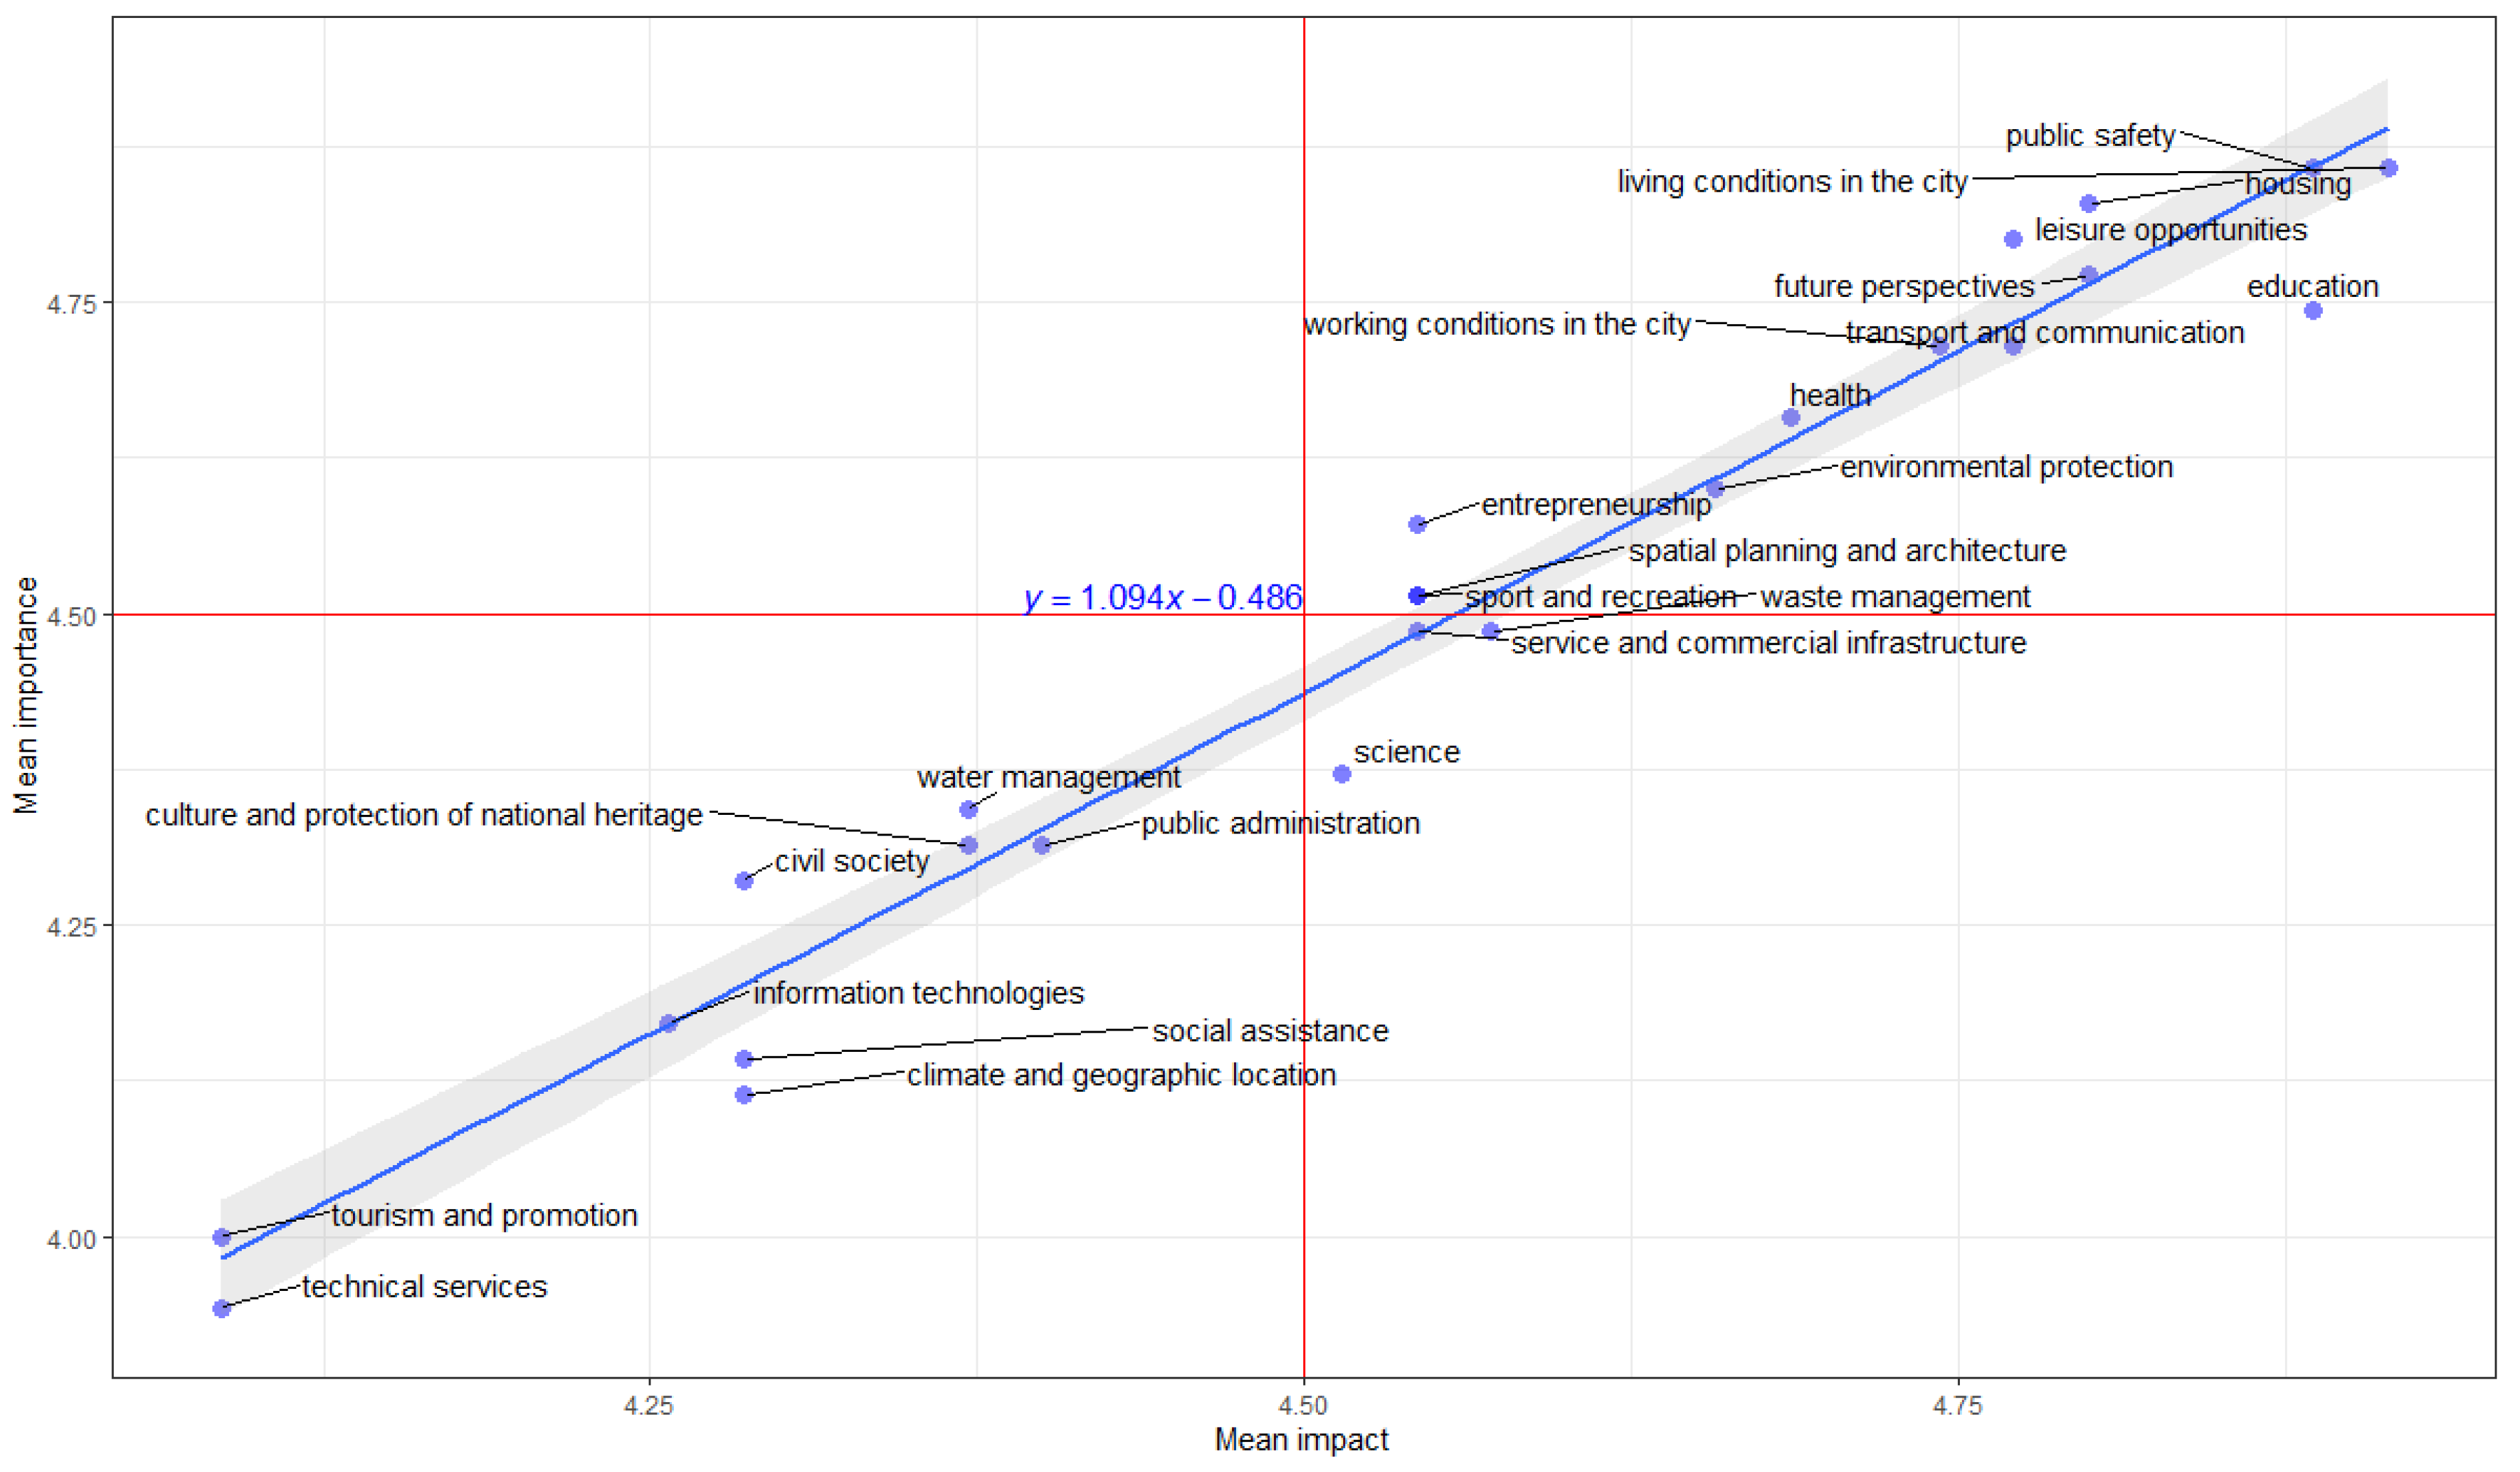
  • Mean impact, mean importance;
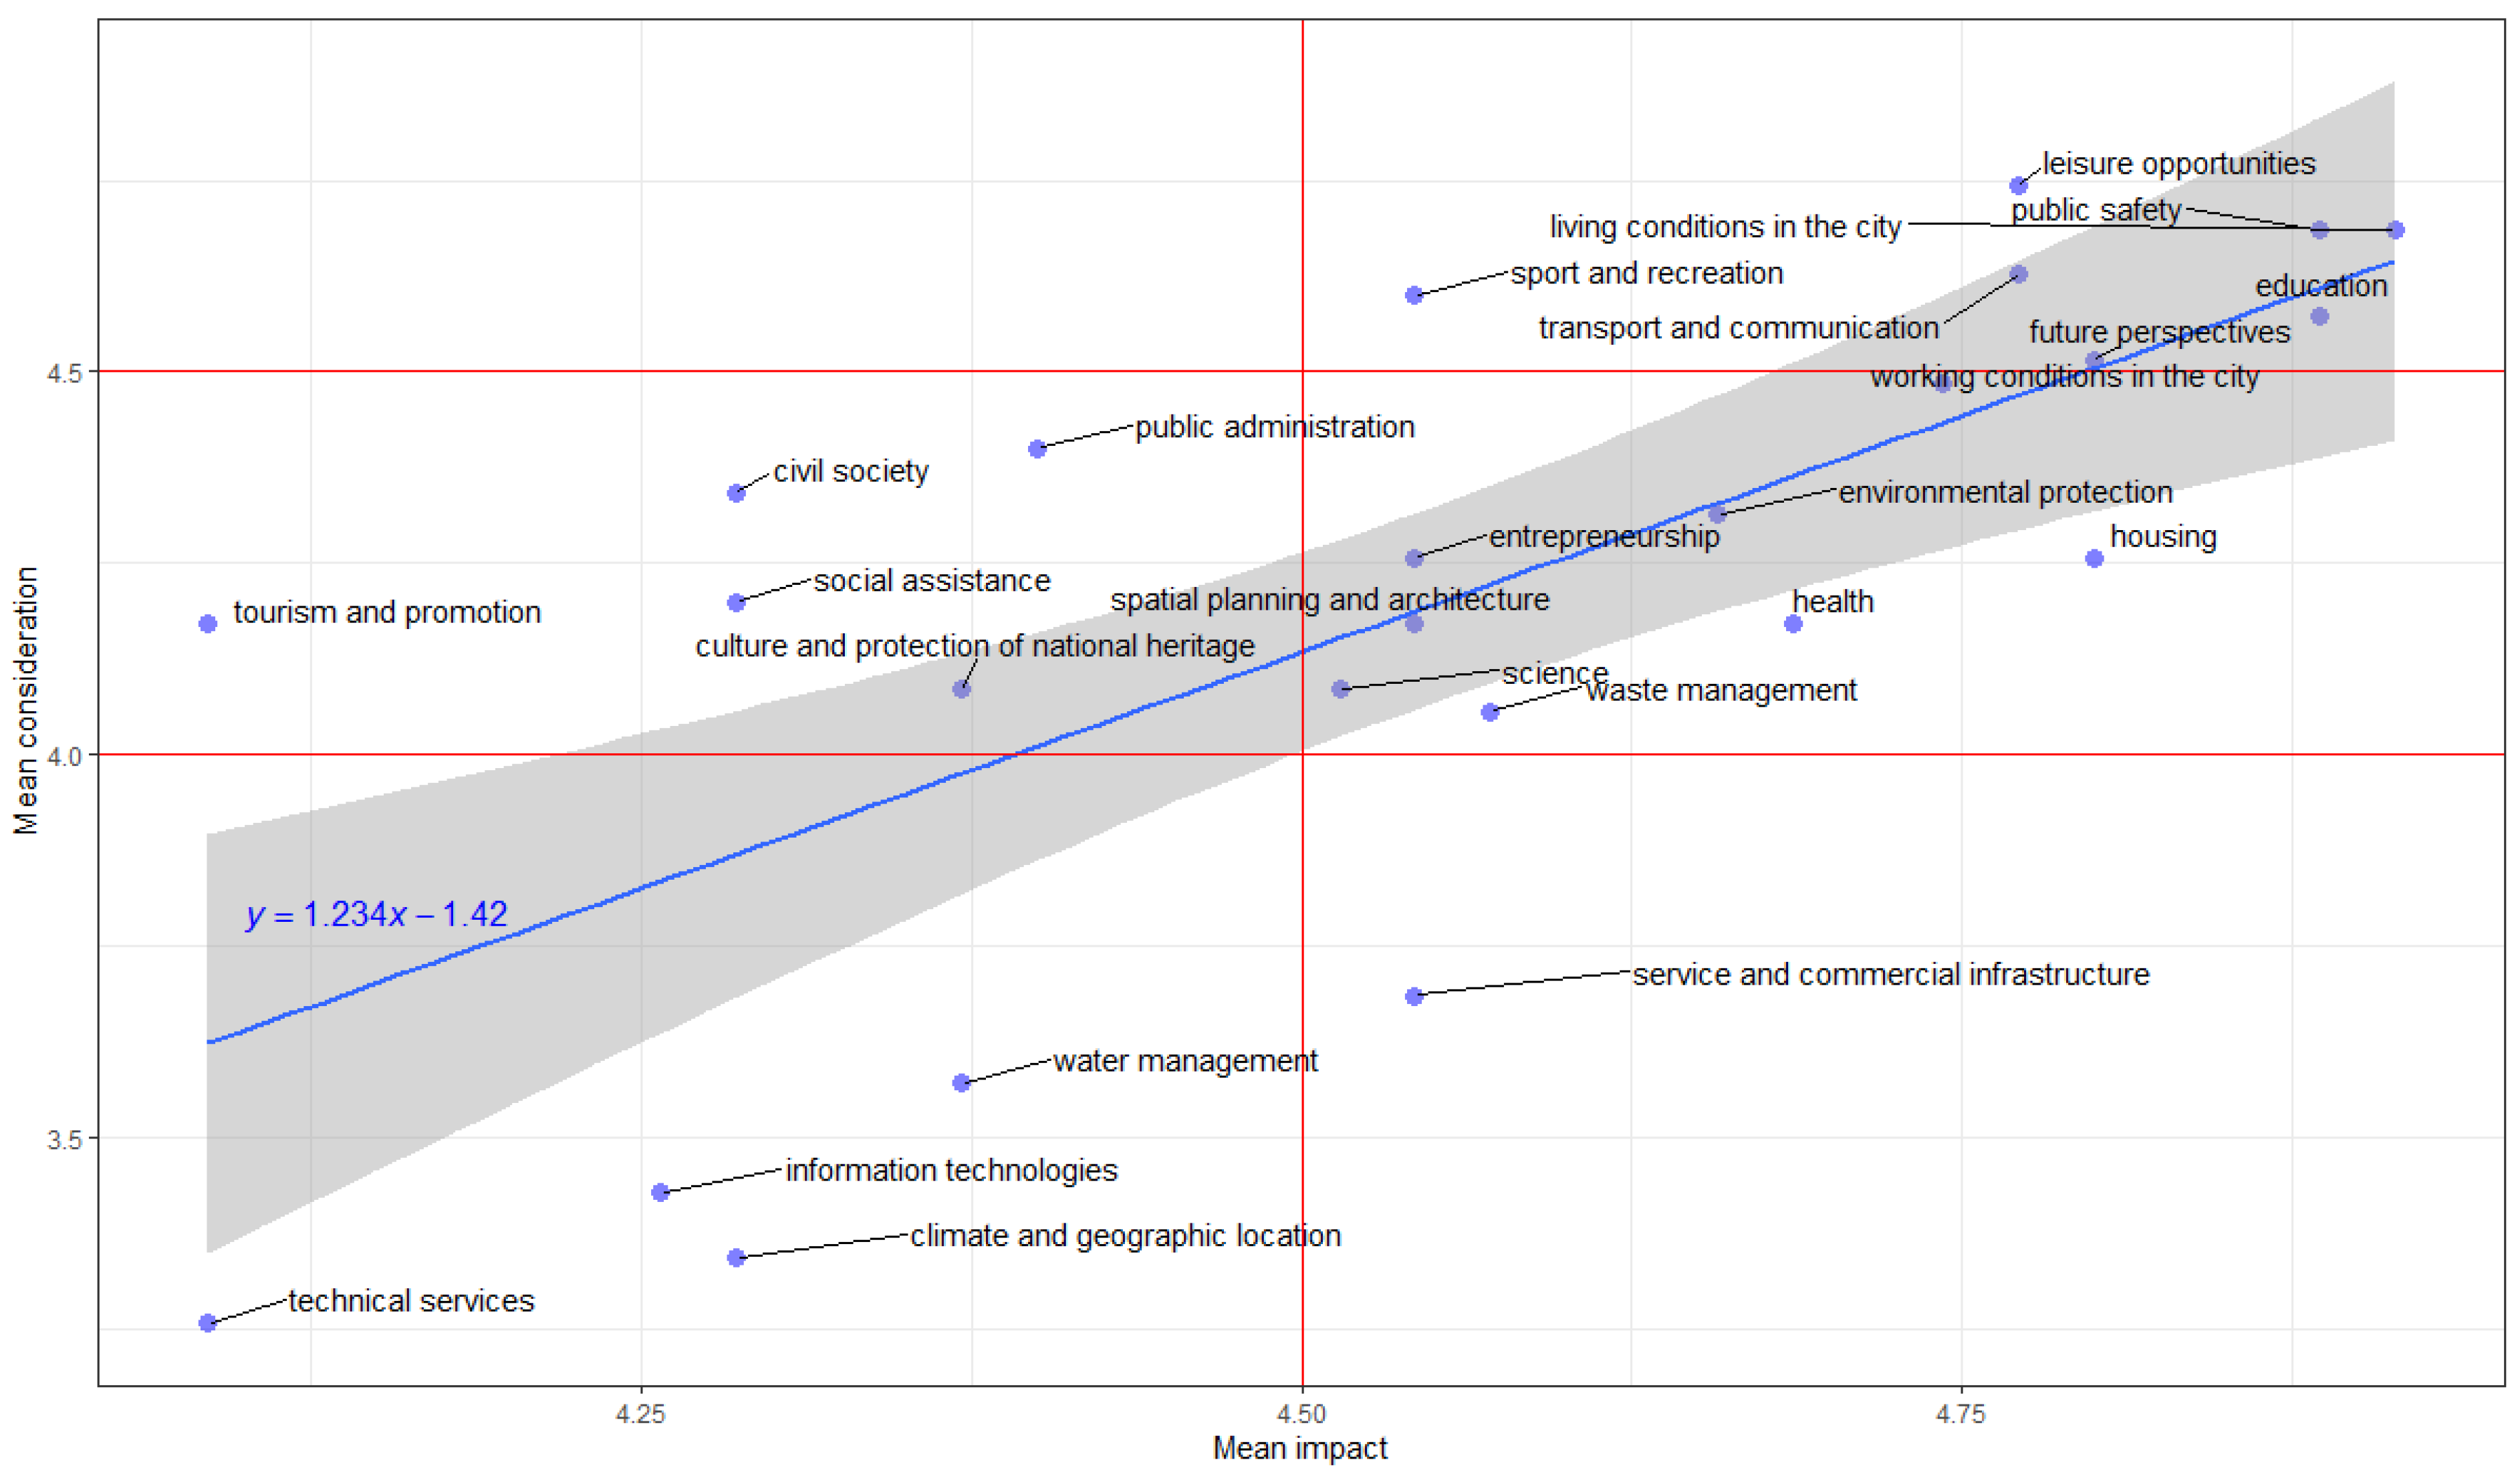
  • Mean impact, mean consideration;
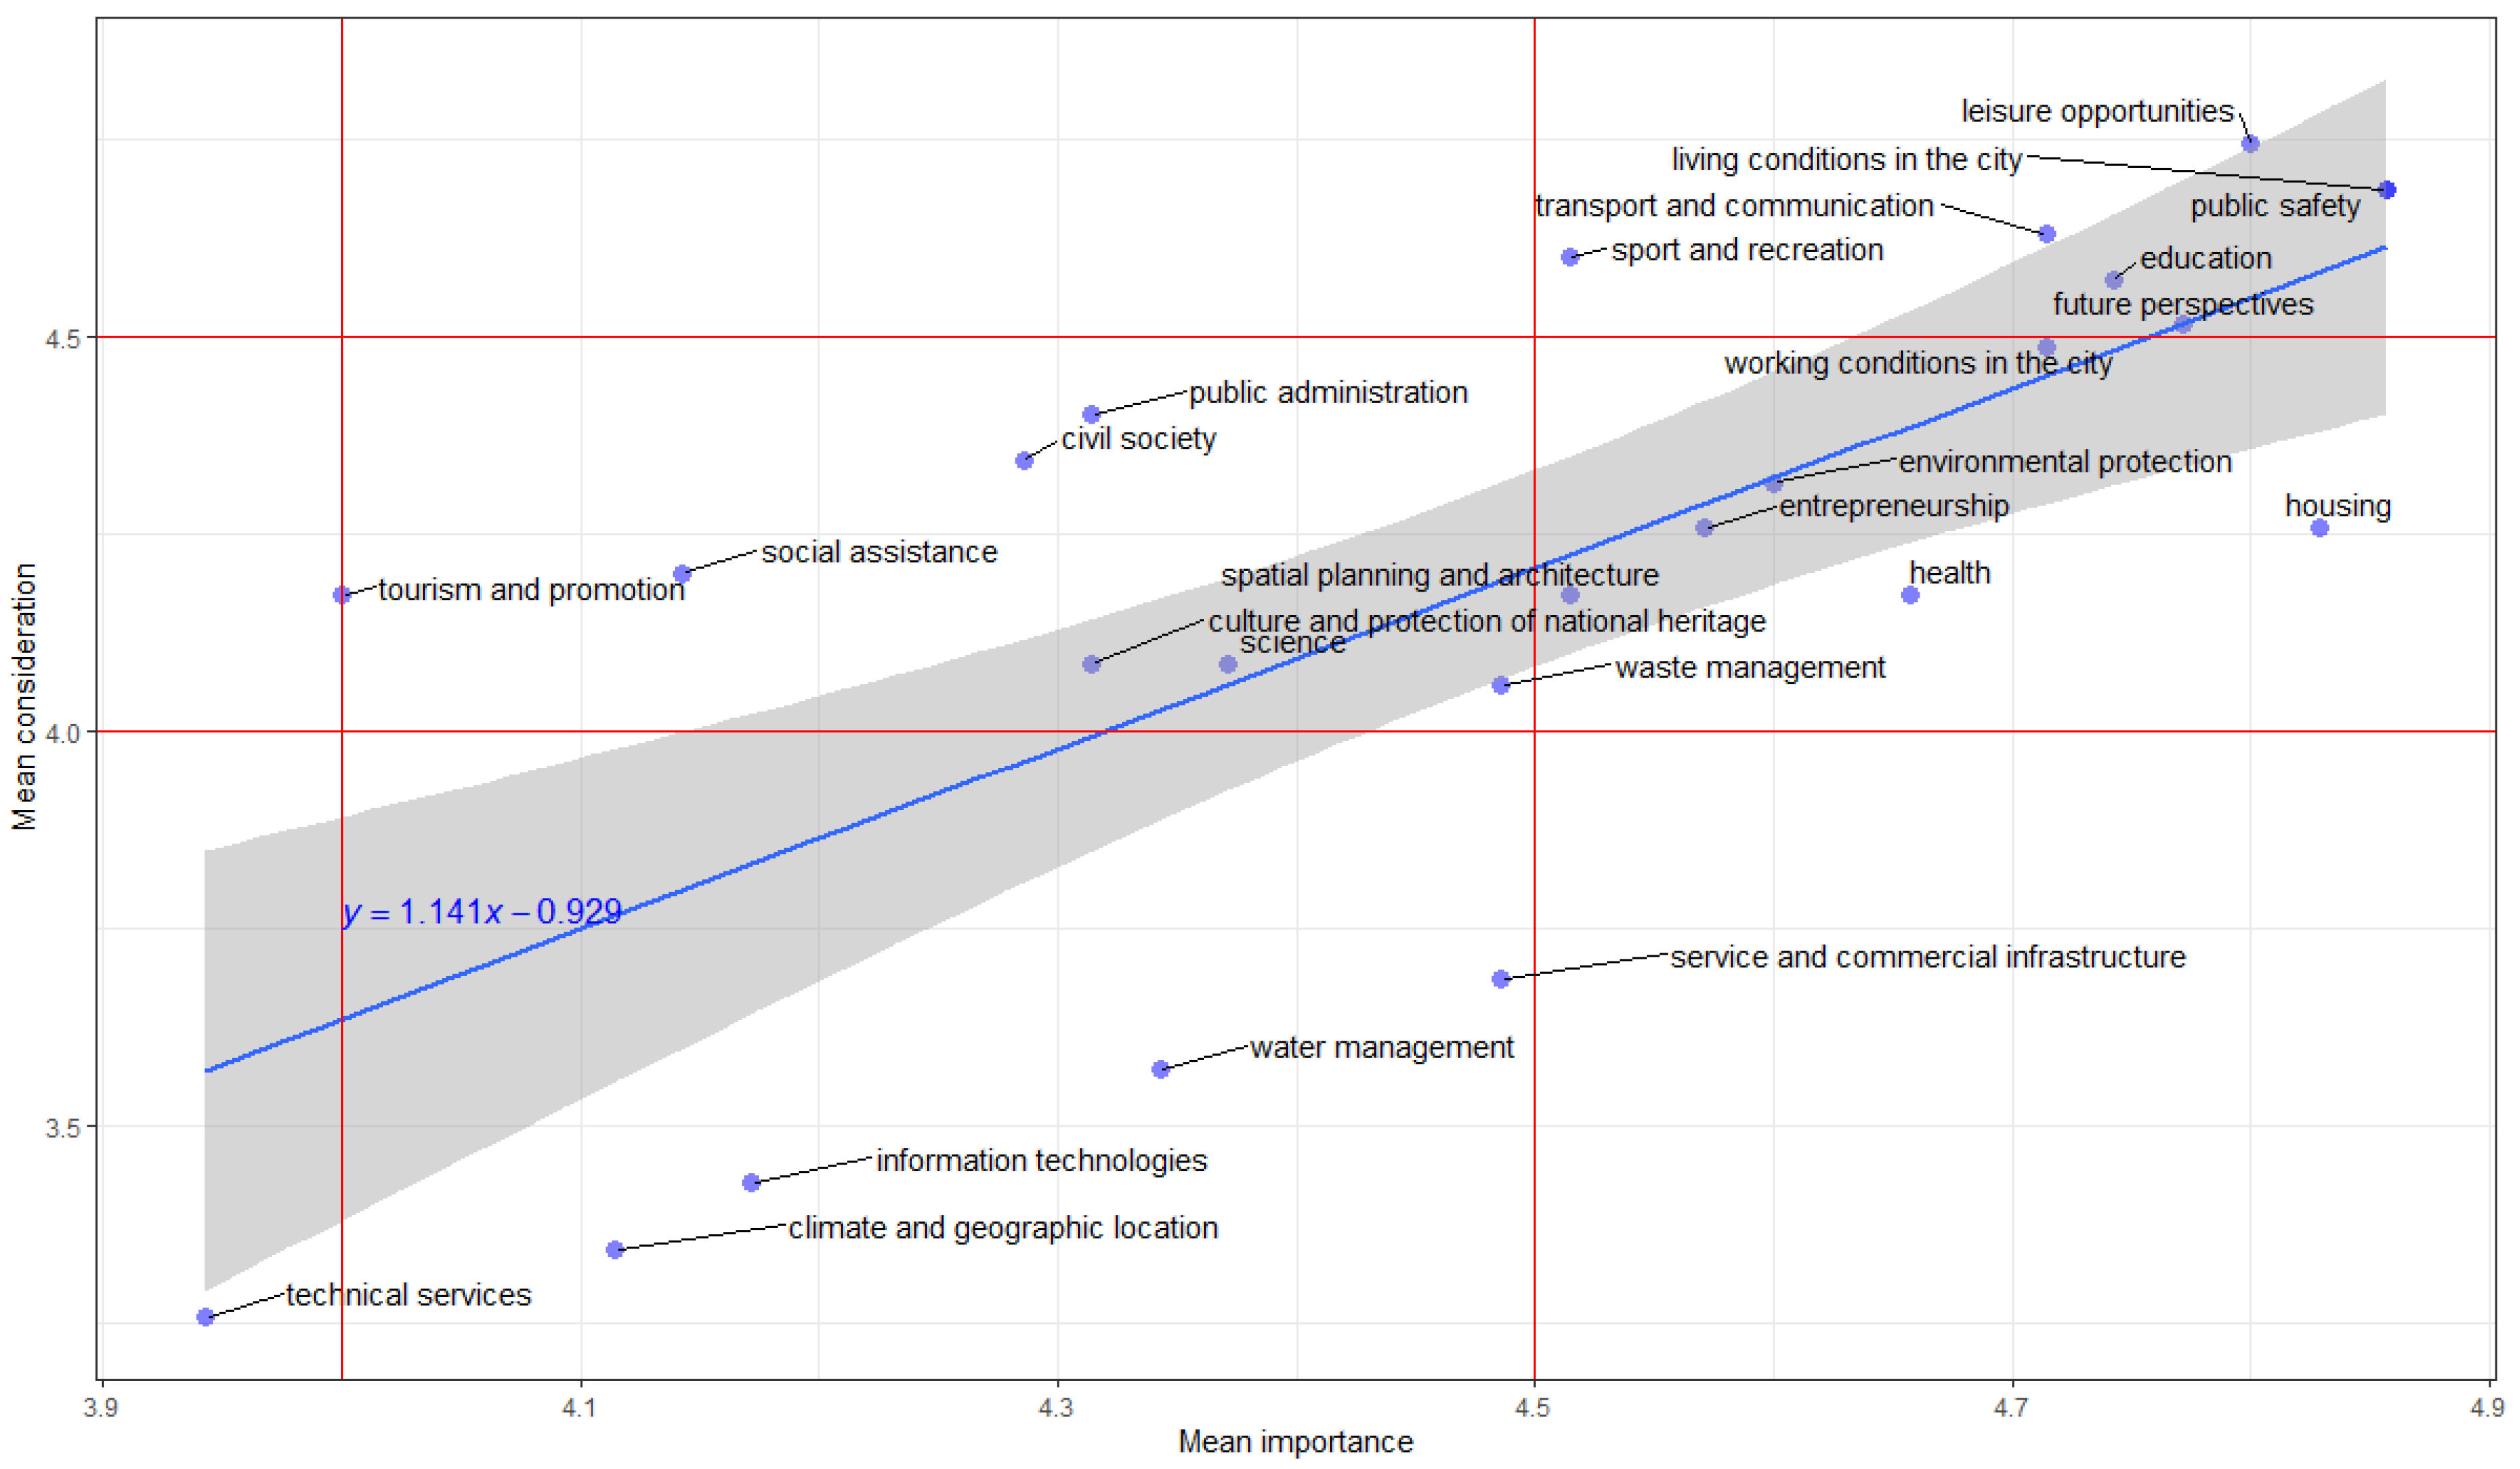
  • Mean importance, mean consideration;
  • Mean impact, mean need for expansion (extensibility);
  • Mean importance, mean need for expansion (extensibility); and
  • Mean consideration, mean need for expansion (extensibility).
The values of the correlation coefficient between the studied variables along with the border significance value are presented in Table 6.
Based on the data presented in Table 6, it can be concluded that there are correlations between the following pairs:
  • Impact and importance: a very strong positive relationship which may mean that impact and importance are understood in a similar way;
  • Impact and consideration: a strong positive relationship, indicating that city quality studies generally take more account of areas that are believed to have a greater impact; and
  • Importance and consideration: a strong positive relationship, which indicates that areas of greater importance are generally considered more in the study of the quality of life.
There is no significant correlation between the other pairs. This applies to the relationship between the need to expand upon research in the indicated areas and other features of these areas (impact, importance, consideration). Taking into account the numerical characteristics presented in Table 5, it can be concluded that the cities are not able to determine whether the research should be expanded in any of the areas, regardless of whether the area is important, considered or has an impact on the quality of life of the residents.
The identified relationship between the impact and importance is shown in Figure 2.
Figure 2 shows the distribution of mean values of importance in relation to the impact of the studied areas along with a linear approximation of the relationship and a 95% confidence interval. The slope coefficient of the line 1.094 (t = 25.127, p < 0.001) indicates that a higher impact is accompanied by a greater importance. Taking into account the range of variability of the mean values of impact and importance, it can additionally be noted that areas considered to ‘probably have an impact’ are ‘probably important’ and areas considered to ‘definitely have an impact’ are ‘definitely important’. From this point of view, the studied areas can be divided into two main groups:
  • Areas that are definitely important and have a decisive impact on the quality of life (e.g., public safety); and
  • Areas that are rather important and probably have an impact on the quality of life (e.g., social assistance).
Therefore, it can be concluded that the variability of the importance of a given area is the carrier of information about the variability of its impact on the quality of life.
A significant relationship was also identified between mean importance and mean consideration of areas in the study. Figure 3 shows this relationship with the linear regression function and the 95% confidence interval for the value of this function.
In the case of the pair of features ‘mean importance’ and ‘mean consideration’, the relationship is not as strong and clear as it is in the case of the pair ‘importance’ and ‘impact’. The value of the slope of the regression function 1.141 (t = 5.120, p < 0.001) indicates that the increase in mean importance is accompanied by a slightly higher increase in mean consideration.
Due to the strong correlation between impact and importance, similar results were obtained when analysing the correlation of mean consideration versus mean impact. The results are presented in Figure 4.
The value of the slope of the regression function 1.234 (t = 4.819, p < 0.001) indicates that, similarly to the importance, the increase in the mean impact is accompanied by a slightly greater increase in the mean consideration.
Based on the information presented in Figure 2 and Figure 3, the studied areas can be divided into four groups:
  • Areas that are clearly and definitely important (definitely have an impact) and clearly definitely considered (e.g., public safety);
  • Areas that are definitely important (definitely have an impact) and probably considered (e.g., health, housing);
  • Areas that are important (have an impact) and probably considered (e.g., social assistance); and
  • Areas that are probably important (probably have an impact) and it is difficult to determine whether they are considered (e.g., IT).
The lack of a significant correlation between the need for extensibility and the other examined features of the areas corresponds to a relatively low variability of the mean extensibility in the range of 3.03–3.37. Cities cannot determine whether research should be expanded upon in a given area or not. The respondents’ clear inclusion in the quality of life survey of areas considered important and having an impact on the quality of life, while not being able to determine whether the survey should be expanded upon, indicates that cities make little use of the information collected in the survey.

5. Discussion

The conducted research procedure provided the necessary information to describe how municipal offices understand the areas influencing the quality of life, which they use in their research, and whether they see the need to expand upon these areas. People responsible for conducting quality of life surveys among residents are aware that many areas affect the quality of life. This is confirmed by the research results obtained in the first and second stages of the research procedure. Cities are aware that many areas affect the quality of life. Taking the mean into account, these areas can be divided into two groups, the first area having a high impact on the quality of life, where small discrepancies between individual offices can be noticed. In the second group, in which areas affect the quality of life to an average extent, there are greater discrepancies between offices. Municipal offices also stated that all areas proposed in the research are important (significant) in assessing the quality of life of the residents. Here, too, taking into account the mean, it is possible to divide into two groups the areas with high and average importance. The obtained results clearly indicate that municipal offices correctly perceive the areas influencing the quality of life and their importance, which is the answer to the first research question Q1.
Cities realise that the quality of life is influenced by many areas and various conditions. Therefore, when conducting research on the quality of life, cities should take into account as many areas and interdependencies between them as possible. Such a holistic view of the quality of life research should provide a large amount of information that, after appropriate processing, could be used to make decisions in various spheres of city activity. The obtained results coincide with the results of other studies described in the literature [31,66,67,71]. In all models of data collection for the purposes of quality of life research, attention is paid to a possible broad spectrum of factors [65]. In model 1, presented by Kaklauskas, 24 factors were indicated; in models 2 and 3, 30 factors were indicated; and in model 4, 39 factors influencing the quality of life were indicated [65]. Regardless of the adopted methodology of conduct, in order to effectively study the quality of life, it is necessary to include as many areas as possible in the conducted research that affect the analysed issues.
The second, slightly surprising result of the research is the statement that municipal offices conduct quality of life research only in selected areas and the number of these areas is limited. This was presented in the third stage of our research procedure, taking into account the mean of only five areas included in the research by all offices. This shows a disturbing picture of quality of life research conducted in offices. Municipal offices, despite being aware that the quality of life is influenced by many areas, only conduct research in selected, relatively few areas. Confronting this with the results of other studies in the literature [31,71], we can conclude that offices consciously make such decisions. Only selected areas are studied, and on this basis, only fragmentary, incomplete data are obtained. These data, in turn, taking into account the deficit of the necessary information, are not used to make decisions. Offices collect certain data on the quality of life, but are not able to process them properly, analyse them and use them to make decisions. Difficulties in the correct selection of areas for the study of the quality of life are confirmed by the results of the research on the need to extend the currently studied areas influencing the quality of life. In the fourth stage of our research procedure, we found that it is difficult to indicate the areas which, in the opinion of all offices, should be expanded upon in quality of life research. Each office has its own vision of what could possibly be expanded upon in the conducted research. The offices examine relatively few areas influencing the quality of life and do not see any special need to expand upon these areas with new, different ones that will provide the necessary information. Therefore, the answer to the second research question (Q2) is that municipal offices only conduct research on the quality of life in selected areas and see no need to expand upon this research, or only see it to a limited extent.
The present research showed significant dependencies between the areas influencing the quality of life, their importance and areas included in research by offices. However, no significant relationships were found between the above-mentioned elements and the areas which should be expanded upon in the conducted research. This was established in the fifth stage of our research procedure. Unfortunately, there was a limitation in the lack of literature in this area. It is not possible to relate the obtained research results to others due to the lack of this type of research described in the literature. The obtained results confirm that the persons responsible for the quality of life research similarly assess the impact strength and importance of a given area. This may mean that these people equate power of influence with importance, which may further mean that they see the gradation of individual areas, but have a problem with distinguishing the strength of the influence from the importance of the areas. The strong correlation found between impact and consideration as well as importance and consideration show that cities in their quality of life surveys more often include areas that they believe have greater impact and importance. This seems to be a rational observation—areas that the city thinks have more influence and more importance are more often included in the conducted research. However, some dissonance is still visible. Despite the awareness that all areas affect the quality of life, only selected areas are allocated to research, consciously leaving other areas at the ‘no research’ level. In this way, cities are depriving themselves of data from unexplored areas, and this information will later be missing. The lack of significant dependencies between the impact, importance, consideration and the possibility of expanding upon the conducted research means that cities have a problem with identifying areas that could be expanded upon in the conducted research. Cities cannot determine whether research should be expanded upon in a given area or not. This shows that there is no idea of which areas could be further explored and what information could be obtained in this way. As the city does not know what additional areas to study and what information will be useful, this may mean that the municipal office is not able to use this information properly. The city collects some fragmented data on the quality of life of its residents, but does not use this information or only uses it to a limited extent. Hence, it can be concluded that the municipal office does not see the need to research additional areas and obtain new information, because it will not be able to use this anyway. Taking into account the third research question (Q3), the found relationships confirm that cities understand impact and importance in a similar way, and usually include areas that have greater impact and importance in their research. However, they do not know in which areas the research could be expanded upon, because in the current situation, they are not able to use this information.

6. Conclusions

The city as a unit is composed of many different elements, between which there are various types of relations that should be treated as a dynamic, functional whole. Therefore, planning the sustainable development of a city requires knowledge of individual elements of the city system and the network of relations between them, adopting appropriate assumptions and goals to achieve a balance in the city, as well as adjusting these assumptions to local conditions. To obtain this, it is necessary to obtain a variety of information from the city level, with particular emphasis on information from residents. Quality of life surveys are an important source of this type of information, and they should be periodically carried out by municipal offices. Our original research concept was developed to investigate how cities understand and conduct research on the quality of life, and how they use this information for the purposes of sustainable development. The first stage of this work was to determine how cities understand the areas affecting quality of life and to what extent they use these areas for research carried out in their area. A look at the areas influencing the quality of life from the point of view of the municipal office provided a wealth of interesting information. The obtained research results confirm that the people responsible for conducting quality research are aware that the quality of life is influenced by many areas and that these areas are important (significant) in research. Therefore, these people have sufficient knowledge of the activities they carry out. However, the results of our research show that municipal offices only conduct research in selected areas influencing the quality of life. This seems to be a conscious choice. A serious problem arises here, as the people responsible for quality of life research do not see the possibility of using this information for the purposes of sustainable city development. In order for the city to develop, this type of information should reach various organisational units and people in the municipal office. These places should be analysed and decisions and actions should be taken on that basis. If at the stage of data collection—conducting quality of life research—these data are not collected, then they cannot be used later. The conducted research drew attention to an important aspect. If a city wants to use data from the quality of life survey for the purposes of sustainable development, to the city must be properly prepared to collect data. People conducting this type of research should be aware of what kind of data are needed and what they will be used for, along with how to conduct quality of life surveys to include as many areas as possible and collect all the necessary data. If the above-mentioned activities are successfully implemented, municipal offices will be able to obtain necessary data, and, after appropriate analysis, use this information to make decisions and take action at various levels and tiers of management. The study of the quality of life, apart from determining the satisfaction of residents, assessing the achievements of city authorities and collecting data for the calculation of indicators, will be able to provide valuable information for the sustainable development of a city, which municipal offices can use in various areas and fields of their activities. The results of our work represent an important contribution to the development of the discipline. Based on our research, we confirmed that a properly organized process of studying the quality of life of residents will provide useful information for city development. Thus, the survey of residents’ quality of life is a valuable source of data collection and provides new opportunities for city offices to use it.
In subsequent studies, we will present the results of the next phases of research on the analysis and use of information from the quality of life survey to make decisions and take action in the field of sustainable development.
Looking back at the research carried out, it is necessary to pay attention to its limitations. The survey research was carried out in municipal offices by persons responsible for quality of life surveys. Therefore, information was obtained from people who carry out this type of research in offices. These people gave specific answers, which are most likely burdened with their subjective approach to the analysed issues. Obtaining such a result in questionnaire surveys is a natural phenomenon resulting from the specificity of this type of research. In order to objectify the obtained data, additional research is needed. We have planned additional case studies in selected offices. During these studies, it will be possible to access a larger group of employees who are linked to quality of life research and to source documentation in this regard. The planned surveys should provide objective information on the quality of life surveys conducted by offices and the use of this information. These studies, in conjunction with the current research, will provide an objectified and comprehensive picture of the analysed issues.

Author Contributions

Conceptualisation, M.J.L.; methodology, M.J.L., M.W.; software, M.W.; validation, M.J.L., M.W.; formal analysis, M.J.L., M.W.; investigation, M.J.L., M.W.; resources, M.J.L., M.W.; data curation, M.J.L., M.W.; writing—original draft preparation, M.J.L., M.W.; writing—review and editing, M.J.L., M.W.; visualisation, M.J.L., M.W.; supervision, M.J.L., M.W.; project administration, M.J.L., M.W.; funding acquisition, M.J.L., M.W. All authors have read and agreed to the published version of the manuscript.

Funding

This research was funded by the resources of the Silesian University of Technology (project no. BK-235/ROZ-1/2020) (13/010/BK_20/0042).

Institutional Review Board Statement

Not applicable.

Informed Consent Statement

Not applicable.

Data Availability Statement

Data is contained within the article.

Conflicts of Interest

The authors declare no conflict of interest.

References

  1. Albino, V.; Berardi, U.; Dangelico, R.M. Smart cities: Definitions, dimensions, performance, and initiatives. J. Urban Technol. 2015, 22, 3–21. [Google Scholar] [CrossRef]
  2. Caragliu, A.; Del Bo, C.; Nijkamp, P. Smart Cities in Europe. J. Urban Technol. 2011, 18, 65–82. [Google Scholar] [CrossRef]
  3. Borcuch, A.; Piłat-Borcuch, M. The importance of selected factors in smart city development: The student’s perspective. Int. J. Appl. Res. 2016, 2, 604–611. [Google Scholar]
  4. Beck, A. Smart cities, in essence. Plan. News 2018, 44, 10–11. [Google Scholar]
  5. Kubina, M.; Sulyova, D.; Vodak, J. Comparison of Smart City Standards, Implementation and Cluster Models of Cities in North America and Europe. Sustainability 2021, 13, 3120. [Google Scholar] [CrossRef]
  6. Simonofski, A.; Asensio, E.S.; Smedt, J.D.; Snoeck, M. Citizen participation in smart cities: Evaluation framework proposal. In Proceedings of the 2017 IEEE 19 Conference on Business Informatics (CBI), Thessaloniki, Greece, 24–27 July 2017; pp. 227–236. [Google Scholar]
  7. Brundtland, G.H. Our Common Future, WCED; Oxford University Press: Oxford, UK, 1987. [Google Scholar]
  8. Glavič, P.; Lukman, R. Review of sustainability terms and their definitions. J. Clean. Prod. 2007, 15, 1875–1885. [Google Scholar] [CrossRef]
  9. Lozano, R. Envisioning sustainability three-dimensionally. J. Clean. Prod. 2008, 16, 1838–1846. [Google Scholar] [CrossRef]
  10. Espinoza, A.; Porter, T. Sustainability, complexity and learning: Insights from complex systems approaches. Learn. Organ. 2011, 18, 54–72. [Google Scholar] [CrossRef] [Green Version]
  11. Koroneos, C.J.; Rokos, D. Sustainable and integrated development–A critical analysis. Sustainability 2012, 4, 141–153. [Google Scholar] [CrossRef] [Green Version]
  12. Pappas, E. A new systems approach to sustainability: University responsibility for teaching sustainability in contexts. J. Sustain. Educ. 2012, 3, 3–18. [Google Scholar]
  13. Zavodna, L.S. Critical questions in sustainability definitions. Int. J. Sustain. Hum. Dev. 2013, 1, 138–145. [Google Scholar]
  14. Amini, M.; Bienstock, C.C. Corporate sustainability: An integrative definition and framework to evaluate corporate practice and guide academic research. J. Clean. Prod. 2014, 76, 12–19. [Google Scholar] [CrossRef]
  15. Chojnicki, Z. Koncepcja terytorialnego systemu społecznego (A concept of a territorial social system). Przegląd Geogr. 1988, 60, 491–510. [Google Scholar]
  16. Sneddon, C.; Howarth, R.B.; Norgaard, R.B. Sustainable development in a post-Brundtland world. Ecol. Econ. 2006, 57, 253–268. [Google Scholar] [CrossRef]
  17. Bugge, H.C.; Watters, L. A Perspective on Sustainable Development after Johanesburg on the Fifteenth Anniversary of Our Common Future: An Interview with Gro Brundtland. Georget. Int. Environ. Law Rev. 2003, 5, 359–366. [Google Scholar]
  18. Petrişor, A.I.; Petrişor, L.E. The shifting relationship between urban and spatial planning and the protection of the environment: Romania as a case study. Present Environ. Sustain. Dev. 2013, 7, 268–276. [Google Scholar]
  19. Giffinger, R.; Fertner, C.; Kramar, H.; Kramar, H.; Kalasek, R.; Pichler-Milanovic, N.; Meijers, E. Smart Cities. Ranking of European Medium-Sized Cities, Centre for Regional Science, Vienna University of Technology 2007. Available online: http://www.smart-cities.eu/download/smart_cities_final_report.pdf (accessed on 23 February 2021).
  20. Jonek-Kowalska, I.; Kaźmierczak, J.; Kramarz, M.; Hilarowicz, A.; Wolny, M. Introduction to the research project “Smart City: A holistic approach”. In Proceedings of the 5th SGEM International Multidisciplinary Scientific Conferences on Social Science and Arts SGEM, Albena, Bulgaria, 26 August–1 September 2018; pp. 101–112. [Google Scholar]
  21. Airaksinen, M.; Seppä, I.P.; Huovila, A.; Neumann, H.M.; Iglar, B.; Bosch, P. Smart city performance measurement framework CITY keys. In Proceedings of the 2017 International Conference on Engineering, Technology and Innovation (ICE/ITMC), Madeira, Portugal, 27–29 June 2017; pp. 718–723. [Google Scholar]
  22. Lombardi, P.; Giordano, S.; Caragliu, A.; Del Bo, C.; Deakin, M.; Nijkamp, P.; Kourtit, K. An Advanced Triple-Helix Network Model for Smart Cities Performance, Vrije Universiteit Amsterdam, Research Memorandum. 2011. Available online: http://degree.ubvu.vu.nl/repec/vua/wpaper/pdf/20110045.pdf (accessed on 23 February 2021).
  23. Huovila, A.; Penttinen, T.; Airaksinen, M.; Pinto-Seppä, I.; Piira, K. Smart city performance measurement system. In Proceedings of the 41-th IAHS World Congress Sustainability Innovation for the Future, Algarve, Portugal, 13–16 September 2016; pp. 1–10. [Google Scholar]
  24. Bosch, P.; Jongeneel, S.; Neumann, H.-M.; Branislav, I.; Huovila, A.; Airaksinen, M.; Pinto-Seppä, I. Recommendations for a Smart City index, Technical Report 3.3, Project: CITY Keys-Smart City Performance Measurement Framework. 2016. Available online: https://www.researchgate.net/publication/326783291_Recommendations_for_a_smart_city_index (accessed on 4 November 2021).
  25. Allam, Z.; Newman, P. Redefining the Smart City: Culture, Metabolism and Governance. Smart Cities 2018, 1, 4–25. [Google Scholar] [CrossRef] [Green Version]
  26. Desdemoustier, J.; Crutzen, N.; Giffinger, R. Municipalities’ understanding of the smart city concept: An exploratory analysis in Belgium. Technol. Forecast. Soc. Chang. 2019, 142, 129–141. [Google Scholar] [CrossRef]
  27. Camboim, G.F.; Zawislak, P.A.; Pufal, N.A. Driving elements to make cities smarter: Evidences from European projects. Technol. Forecast. Soc. Chang. 2019, 142, 154–167. [Google Scholar] [CrossRef]
  28. Ligarski, M.J.; Wolny, M. How cities aspiring to implement the smart city concept conduct research on the quality of life-development of the research concept and the first summary of results. In Proceedings of the 37 IBIMA Conference, Cordoba, Spain, 30–31 May 2021. [Google Scholar]
  29. Insch, A.; Florek, M. A great place to live, work and play: Conceptualising place satisfaction in the case of a city’s residents. J. Place Manag. Dev. 2008, 1, 138–149. [Google Scholar] [CrossRef]
  30. Insch, A. Managing residents’ satisfaction with city life: Application of importance- satisfaction analysis. J. Town City Manag. 2010, 1, 164–174. [Google Scholar]
  31. Macke, J.; Casagrande, R.M.; Sarate, J.A.R.; Silva, K.A. Smart city and quality of life: Citizen perception in a Brazilian case study. J. Clean. Prod. 2018, 182, 717–726. [Google Scholar] [CrossRef]
  32. Smith, D.M. The Geography of Social Well-Being in the United States: An. Introduction to Territorial Social Indicators; Mc Graw-Hill: New York, NY, USA, 1973. [Google Scholar]
  33. Wingo, L. The quality of life: Toward a microeconomic definition. Urban Stud. 1973, 10, 3–18. [Google Scholar] [CrossRef]
  34. Andrews, F.M.; Withey, S.B. Social Indicators of Well-Being: Americans’ Perceptions of Life Quality; Plenum Press: New York, NY, USA, 1976. [Google Scholar]
  35. Liu, B.C. Quality of Life Indicators in US Metropolitan Areas: A Statistical Analysis; Praeger: New York, NY, USA, 1976. [Google Scholar]
  36. Najman, J.M.; Levine, S. Evaluating the impact of medical care and technologies on the quality of life: A review and critique. Soc. Sci. Med. 1981, 15, 107–115. [Google Scholar] [CrossRef]
  37. Kaplan, R.M.; Bush, J.W. Health-related quality of life measurement for evaluation research and policy analysis. Health Psychol. 1982, 1, 61–80. [Google Scholar] [CrossRef]
  38. Calman, K.C. Quality of life in cancer patients–An hypothesis. J. Med. Ethics 1984, 10, 124–127. [Google Scholar] [CrossRef] [PubMed] [Green Version]
  39. Beesley, K.B.; Russwurm, L.H. Social indicators and quality of life research: Toward synthesis. Environments 1989, 20, 22–39. [Google Scholar]
  40. Felce, D.; Perry, J. Quality of life: Its definition and measurement. Res. Dev. Disabil. 1995, 16, 51–74. [Google Scholar] [CrossRef]
  41. Farquhar, M. Elderly people’s definitions of quality of life. Soc. Sci. Med. 1995, 41, 1439–1446. [Google Scholar] [CrossRef]
  42. Brooks, R.; EuroQol Group. EuroQol: The current state of play. Health Policy 1996, 37, 53–72. [Google Scholar] [CrossRef]
  43. Diener, E.; Suh, E.M.; Lucas, R.E.; Smith, H.L. Subjective well-being: Three decades of progress. Psychol. Bull. 1999, 125, 276–302. [Google Scholar] [CrossRef]
  44. Nussbaum, M.; Sen, A. The Quality of Live; Oxford University Press: Oxford, UK, 1993; Available online: http://oxford.universitypressscholarship.com/view/10.1093/0198287976.001.0001/acprof-9780198287971 (accessed on 20 April 2021).
  45. Cella, D.F. Quality of life: Concept and definition. J. Pain Symptom Manag. 1994, 9, 186–192. [Google Scholar] [CrossRef]
  46. Theofilou, P. Quality of Life: Definition and Measurement. Eur. J. Psychol. 2013, 9, 150–162. [Google Scholar] [CrossRef]
  47. Uysal, M.; Sirgy, M.J.; Woo, E.; Kim, H.L. Quality of life and well-being research in tourism. Tour. Manag. 2016, 53, 244–261. [Google Scholar] [CrossRef]
  48. WHOQOL. The World Health Organisation. Meas. Qual. Life 2012, 1, 1–106. Available online: https://www.who.int/tools/whoqol (accessed on 4 November 2021).
  49. Cai, T.; Verze, P.; Bjerklund, J.T.E. The Quality of Life Definition: Where Are We Going? Uro 2021, 1, 14–22. [Google Scholar] [CrossRef]
  50. van Kamp, I.; Leidelmeijer, K.; Marsman, G.; de Hollander, A. Urban environmental quality and human well-being. Landsc. Urban Plan. 2003, 65, 5–18. [Google Scholar] [CrossRef]
  51. Bérenger, V.; Verdier-Chouchane, A. Multidimensional measures of well-being: Standard of living and quality of life across countries. World Dev. 2007, 35, 1259–1276. [Google Scholar] [CrossRef]
  52. Costanza, R.; Fisher, B.; Ali, S.; Beer, C.; Bond, L.; Boumans, R.; Snapp, R. Quality of life: An approach integrating opportunities, human needs, and subjective well-being. Ecol. Econ. 2007, 61, 267–276. [Google Scholar] [CrossRef]
  53. Morrison, P.S. Subjective wellbeing and the city. Soc. Policy J. N. Z. 2007, 31, 74–103. [Google Scholar]
  54. Ballas, D.; Tranmer, M. Happy people or happy places? A multilevel modelling approach to the analysis of happiness and well-being. Int. Reg. Sci. Rev. 2012, 35, 70–102. [Google Scholar] [CrossRef]
  55. Pinto, S.; Fumincelli, L.; Mazzo, A.; Caldeira, S.; Martins, J.C. Comfort, well-being and quality of life: Discussion of the differences and similarities among the concepts. Porto Biomed. J. 2017, 2, 6–12. [Google Scholar] [CrossRef] [PubMed]
  56. Allardt, E. Having, Loving, Being: An Alternative to the Swedish Model of Welfare Research. In The Quality of Life; Nussbaum, M., Sen, A., Eds.; Oxford University Press: Oxford, UK, 1993; Available online: https://oxford.universitypressscholarship.com/view/10.1093/0198287976.001.0001/acprof-9780198287971-chapter-8 (accessed on 20 April 2021).
  57. Borys, T. Typologia jakości życia i pomiar statystyczny (Quality of life typology and statistical measurement). Wiadomości Stat. 2015, 7, 1–18. [Google Scholar]
  58. European Foundation for the Improvement of Living and Working Conditions. Second European Quality of Life Survey-Overview; Office for Official Publications of the European Communities: Luxembourg, 2009; ISBN 9789289708470. Available online: https://www.eurofound.europa.eu/sites/default/files/ef_publication/field_ef_document/ef0902en_7.pdf (accessed on 22 April 2021).
  59. Hlasny, V.; Verme, P. Top Incomes and Inequality Measurement: A Comparative Analysis of Correction Methods Using the EU SILC Data. Econometrics 2018, 6, 30. [Google Scholar] [CrossRef] [Green Version]
  60. Eurostat. Quality of Life (QoL). Available online: https://ec.europa.eu/eurostat/web/gdp-and-beyond/qualityof-life/data (accessed on 22 April 2021).
  61. Feldmann, B. The Urban Audit—Measuring the Quality of Life in European Cities, Eurostat, Statistic in Focus, 82/2008. Available online: https://edz.bib.uni-mannheim.de/www-edz/pdf/statinf/08/KS-SF-08-082-EN.PDF (accessed on 22 April 2021).
  62. Sojda, A.; Owczarek, T.; Wolny, M. Smart City w ujęciu zorientowanym na dane–Polska bazie Eurostat (Smart City in a data-oriented approach–Poland in the Eurostat database). Sci. Pap. Sil. Univ. Technol. Organ. Manag. Ser. 2018, 130, 557–566. [Google Scholar]
  63. Czapliński, J.; Panek, T. Diagnoza społeczna 2015 Warunki i jakość życia Polaków (Social Diagnosis 2015 Objective and Subjective Quality of Life in Poland) Contemporary Economics. Q. Univ. Financ. Manag. Wars. 2015, 9, 1–547. [Google Scholar]
  64. Węziak-Białowolska, D. Quality of life in cities–Empirical evidence in comparative European perspective. Cities 2016, 58, 87–96. [Google Scholar] [CrossRef]
  65. Kaklauskas, A.; Zavadskas, E.K.; Radzeviciene, A.; Ubarte, I.; Podviezko, A.; Podvezko, V.; Kuzminske, A.; Banaitis, A.; Binkyte, A.; Bucinskas, V. Quality of city life multiple criteria analysis. Cities 2018, 72, 82–93. [Google Scholar] [CrossRef]
  66. Papachristou, I.A.; Rosas-Casals, M. Cities and quality of life. Quantitative modeling of the emergence of the happiness field in urban studies. Cities 2019, 88, 191–208. [Google Scholar] [CrossRef]
  67. Moeinaddini, M.; Asadi-Sheraki, Z.; Aghaabbasi, M.; Saadi, I.; Zaly Shah, M.; Cools, M. Applying non-parametric models to explore urban life satisfaction in European cities. Cities 2020, 105, 102851. [Google Scholar] [CrossRef]
  68. Goerlich, F.J.; Reig, E. Quality of life ranking of Spanish cities: A non-compensatory approach. Cities 2021, 109, 102979. [Google Scholar] [CrossRef]
  69. Przybyłowski, P.; Przybyłowski, A.; Kałaska, A. Utility Method as an Instrument of the Quality of Life Assessment Using the Examples of Selected European Cities. Energies 2021, 14, 2770. [Google Scholar] [CrossRef]
  70. Mouratidis, K. Urban planning and quality of life: A review of pathways linking the built environment to subjective well-being. Cities 2021, 115, 103229. [Google Scholar] [CrossRef]
  71. Rodríguez Bolívar, M.P. Analyzing the Influence of the Smart Dimensions on the Citizens’ Quality of Life in the European Smart Cities’ Context, Public Administration and Information Technology. In Smart Cities and Smart Governance; Estevez, E., Pardo, T.A., Scholl, H.J., Eds.; Springer: Cham, Switzerland, 2021; pp. 239–256. [Google Scholar]
  72. Ge, J.; Hokao, K. Research on residential lifestyles in Japanese cities from the viewpoints of residential preference, residential choice and residential satisfaction. Landsc. Urban Plan. 2006, 78, 165–178. [Google Scholar] [CrossRef]
  73. R Core Team. R: A Language and Environment for Statistical Computing; R Foundation for Statistical Computing: Vienna, Austria, 2021; Available online: https://www.R-project.org/ (accessed on 4 November 2021).
  74. Efron, B.; Tibshirani, R.J. An Introduction to the Bootstrap; CRC Press: Boca Raton, FL, USA, 1994. [Google Scholar]
Figure 1. Steps of the research procedure. Source: Own work.
Energies 14 07592 g001
Figure 2. Relationship between the mean impact and the importance of the studied areas.
Energies 14 07592 g002
Figure 3. Relationship between the mean importance and the consideration of the studied areas.
Energies 14 07592 g003
Figure 4. Relationship between the mean impact and the consideration of the studied areas.
Energies 14 07592 g004
Table 1. List of cities in 5 size groups and the number of cities surveyed and those that responded to the survey.
Group NumberCity Size
(Number of Residents)
Number of Cities
in Poland
Number of Cities StudiedNumber of Cities that Responded to the Survey
Number%
IAbove 1,000,000111100
II500,000–999,999444100
III250,000–499,99966583.3
IV100,000–249,99928282589.3
V50,000–99,99945454191.1
Total84847690.5
Source: Own work.
Table 2. Summary of answers to the question whether the given areas affect the quality of life in the city, as well as basic statistics.
No.Do the Given Areas, in Your Opinion, Affect the Quality of Life in the City? N = 35Mean (1)Median (2)Mode (3)Std. Deviation (4)Minimum (5)Maximum (6)
1living conditions in the city4.91550.28445
2public safety4.89550.32345
3education4.89550.32345
4housing4.80550.40645
5future perspectives4.80550.40645
6leisure opportunities4.77550.42645
7transport and communication4.77550.42645
8working conditions in the city4.74550.44345
9health4.69550.53035
10environmental protection4.66550.53935
11waste management4.57550.50245
12sport and recreation4.54550.50545
13entrepreneurship4.54550.56135
14spatial planning and architecture4.54550.56135
15service and commercial infrastructure4.54550.70125
16science4.51550.56235
17public administration4.40450.69525
18water management4.37440.54735
19culture and protection of national heritage4.37440.69025
20civil society4.29440.66735
21social assistance4.29440.66725
22climate and geographic location4.29440.78925
23information technologies4.26440.61135
24technical services4.09440.61235
25tourism and promotion4.09440.81825
Source: Own work.
Table 3. Summary of answers to the question regarding the importance (significance) of individual areas in assessing the quality of life in the city.
No.What Is, in Your Opinion, the Importance (Significance) of These Areas in Assessing the Quality of Life in the City? N = 35Mean (1)Median (2)Mode (3)Std. Deviation (4)Minimum (5)Maximum (6)
1public safety4.86550.35545
2living conditions in the city4.86550.35545
3housing4.83550.38245
4leisure opportunities4.80550.40645
5future perspectives4.77550.49035
6education4.74550.44345
7transport and communication4.71550.45845
8working conditions in the city4.71550.45845
9health4.66550.53935
10environmental protection4.60550.55335
11entrepreneurship4.57550.55835
12sport and recreation4.51550.50745
13spatial planning and architecture4.51550.56235
14waste management4.49550.56235
15service and commercial infrastructure4.49550.61235
16science4.37440.64625
17water management4.34440.53935
18public administration4.31440.67625
19culture and protection of national heritage4.31440.67625
20civil society4.29440.66735
21information technologies4.17440.56835
22social assistance4.14440.55035
23climate and geographic location4.11440.67625
24tourism and promotion4.00440.76725
25technical services3.94440.59135
Source: Own work.
Table 4. Summary of answers to the question about the areas that offices took into account in the conducted quality of life research.
No.Are the Areas Listed below Included in Your Quality of Life Survey? N = 35Mean (1)Median (2)Mode (3)Std. Deviation (4)Minimum (5)Maximum (6)
1leisure opportunities4.745.0050.44345
2public safety4.695.0050.58335
3living conditions in the city4.695.0050.47145
4transport and communication4.635.0050.49045
5sport and recreation4.605.0050.49745
6education4.575.0050.60835
7future perspectives4.515.0050.65835
8working conditions in the city4.495.0050.70225
9public administration4.405.0050.81225
10civil society4.344.0050.76525
11environmental protection4.315.0050.99325
12housing4.265.0051.01025
13entrepreneurship4.265.0050.95025
14social assistance4.204.0050.96425
15tourism and promotion4.174.0050.89125
16spatial planning and architecture4.174.0050.95425
17health4.174.0050.98525
18culture and protection of national heritage4.094.0050.95125
19science4.094.0051.06725
20waste management4.065.0051.16225
21service and commercial infrastructure3.694.003 a1.13215
22water management3.574.0051.33515
23information technologies3.433.0031.14515
24climate and geographic location3.344.0041.30515
25technical services3.263.0031.14615
Source: Own work. a Multiple modes exist; the smallest value is shown.
Table 5. Summary of answers to the question concerning the areas which should be expanded upon in the conducted research on the quality of life.
No.What Areas, in Your Opinion, Should Be Expanded upon in the Current Research on the Quality of Life in your City? N = 35Mean (1)Median (2)Mode (3)Std. Deviation (4)Minimum (5)Maximum (6)
1working conditions in the city3.373.0031.14015
2environmental protection3.344.0041.23515
3 health3.343.0031.11015
4civil society3.313.0031.25515
5service and commercial infrastructure3.293.0031.17815
6housing3.293.003 a1.20215
7future perspectives3.293.0031.25015
8entrepreneurship3.293.0031.17815
9information technologies3.293.0031.04515
10spatial planning and architecture3.263.0031.17215
11water management3.203.0031.10615
12climate and geographic location3.173.0030.95415
13science3.173.0031.15015
14waste management3.113.0031.23115
15leisure opportunities3.113.0031.23115
16sport and recreation3.113.0031.18315
17transport and communication3.113.0031.15715
18technical services3.113.0031.05115
19living conditions in the city3.113.0031.23115
20public safety3.093.0031.22215
21culture and protection of national heritage3.093.0031.17315
22tourism and promotion3.093.0031.19715
23education3.063.0031.18715
24social assistance3.063.0031.21115
25public administration3.033.0031.17515
Source: Own work. a Multiple modes exist; the smallest value is shown.
Table 6. Results of the correlation analysis between impact, importance, consideration and the need to expand upon areas.
Pearson’s Product–Moment Correlation
Mean ImpactMean ImportanceMean ConsiderationMean Expandability
mean impact1.0000.9820.7090.127
p-value <0.001<0.0010.546
mean importance0.9821.0000.7300.208
p-value<0.001 <0.0010.319
mean consideration0.7090.7301.000−0.151
p-value<0.001<0.001 0.473
mean extensibility 0.1270.208−0.1511.000
p-value0.5460.3190.473
Source: Own work.
Publisher’s Note: MDPI stays neutral with regard to jurisdictional claims in published maps and institutional affiliations.

