
Influence of Cavitation in Common-Rail Diesel Nozzles on the Soot Formation Process through Measuring Soot Emissions

 , ,
, ,  and
and
Abstract
:
1. Introduction
2. Materials and Methods
2.1. Materials
2.1.1. Nozzles and Fuel
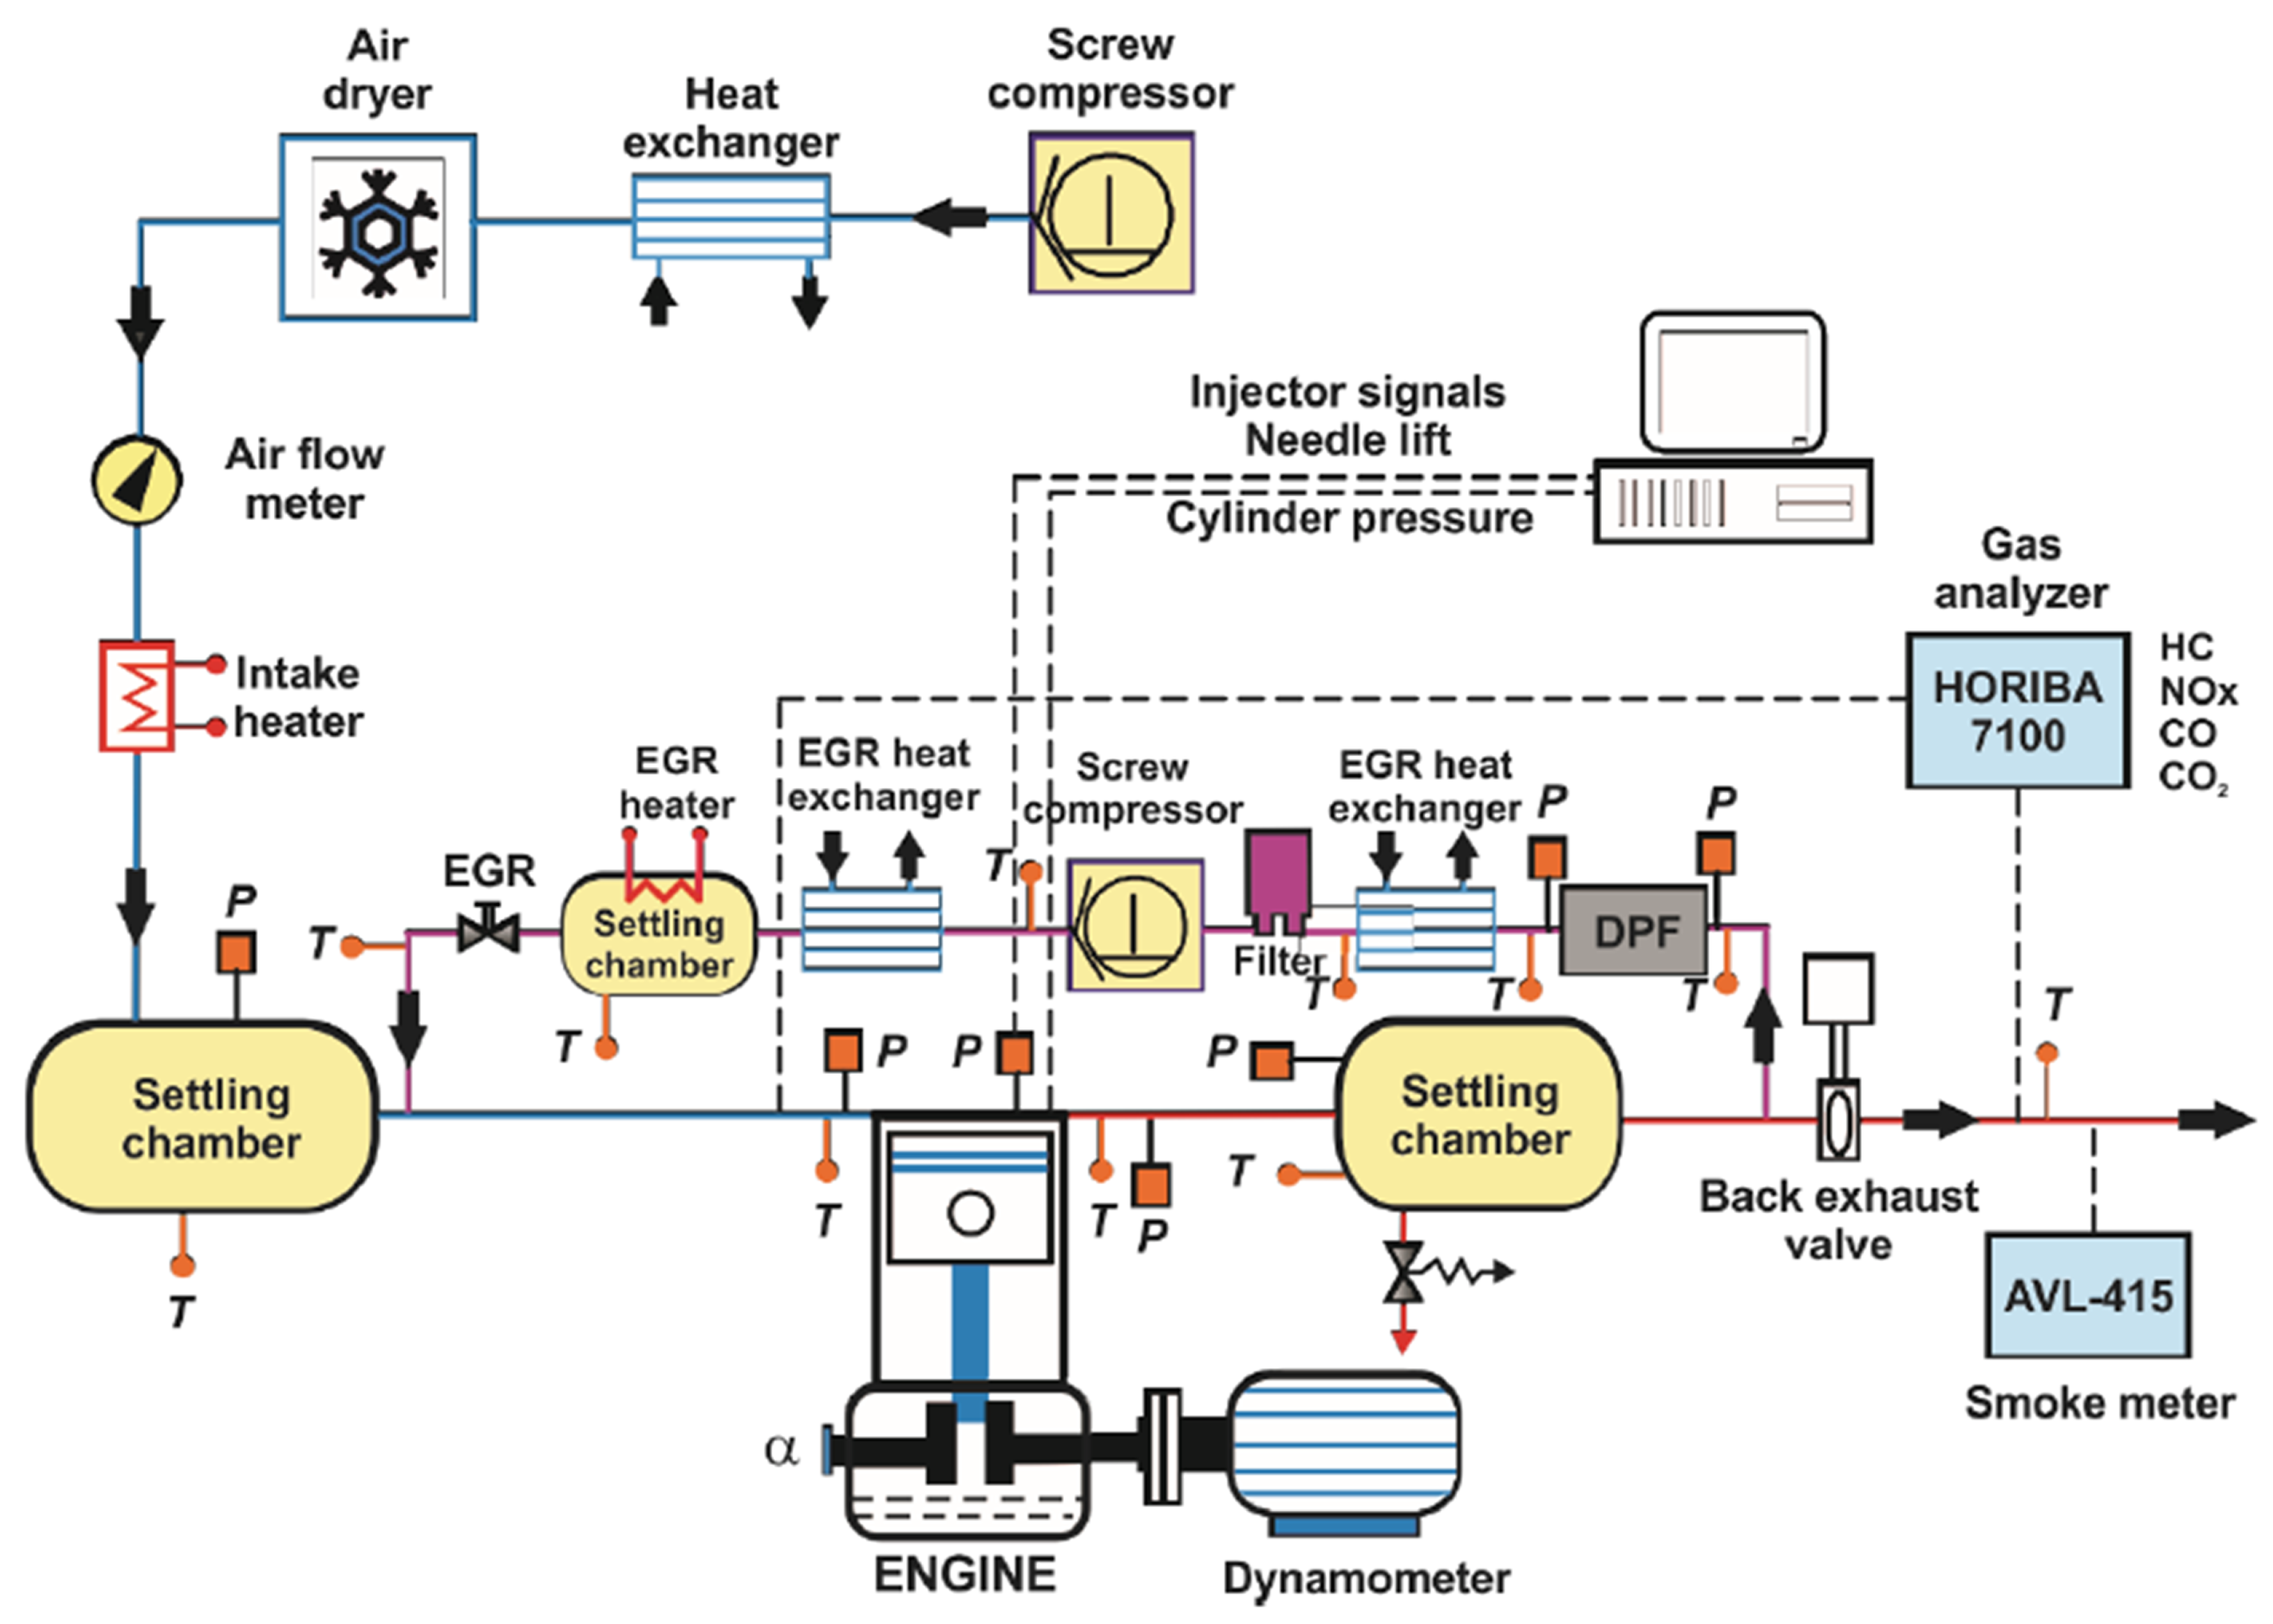
2.1.2. Single-Cylinder Engine and Opacimeter
2.1.3. Combustion Diagnostic Model
2.2. Methods
2.2.1. Hydraulic Characterization
2.2.2. Soot Formation Process Characterization from the Soot Emissions
2.2.3. Methodology for Analysis of the Results
3. Results and Discussion
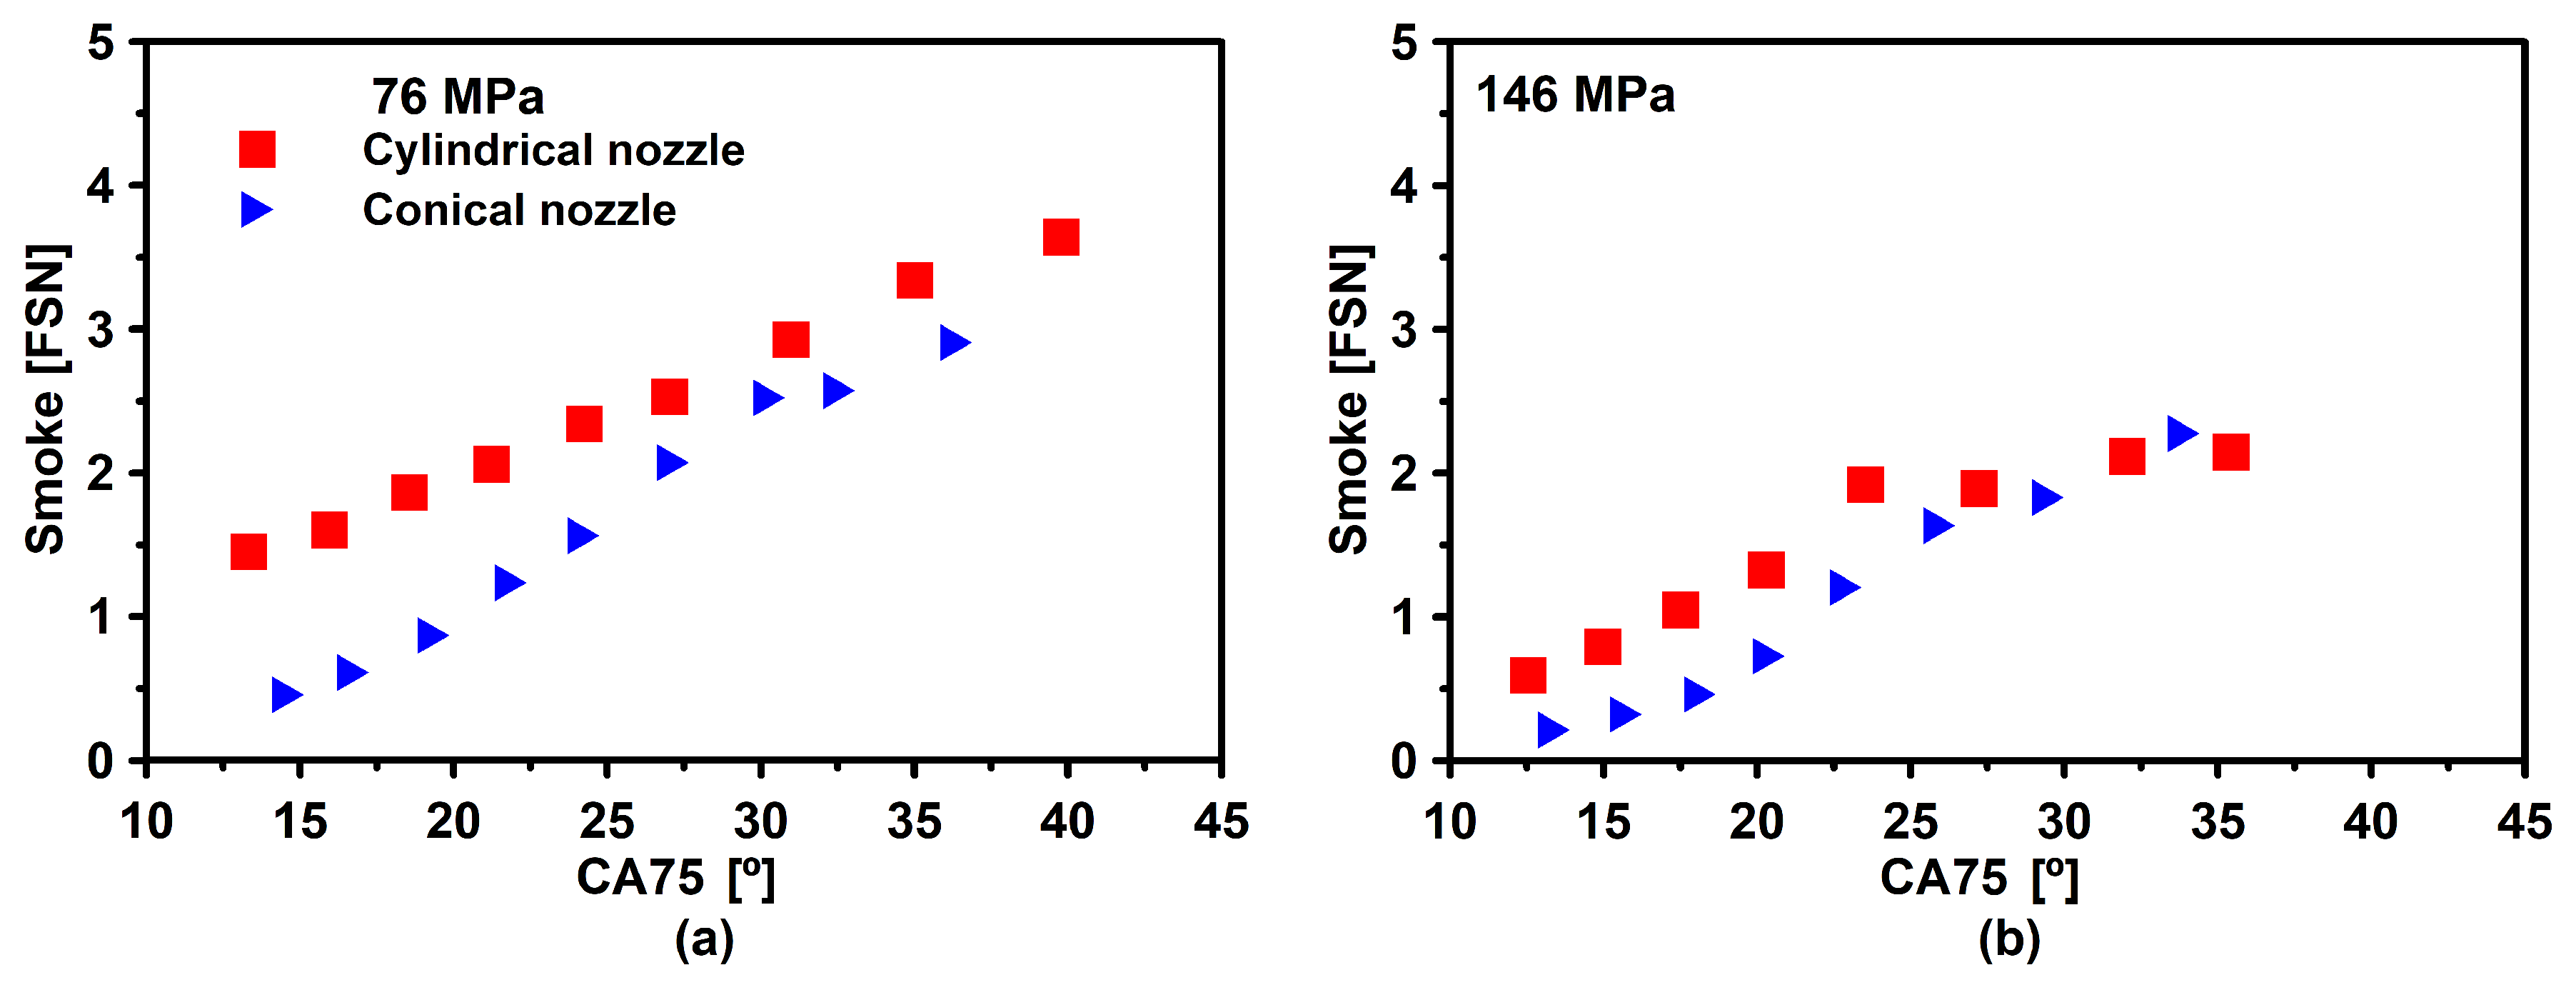
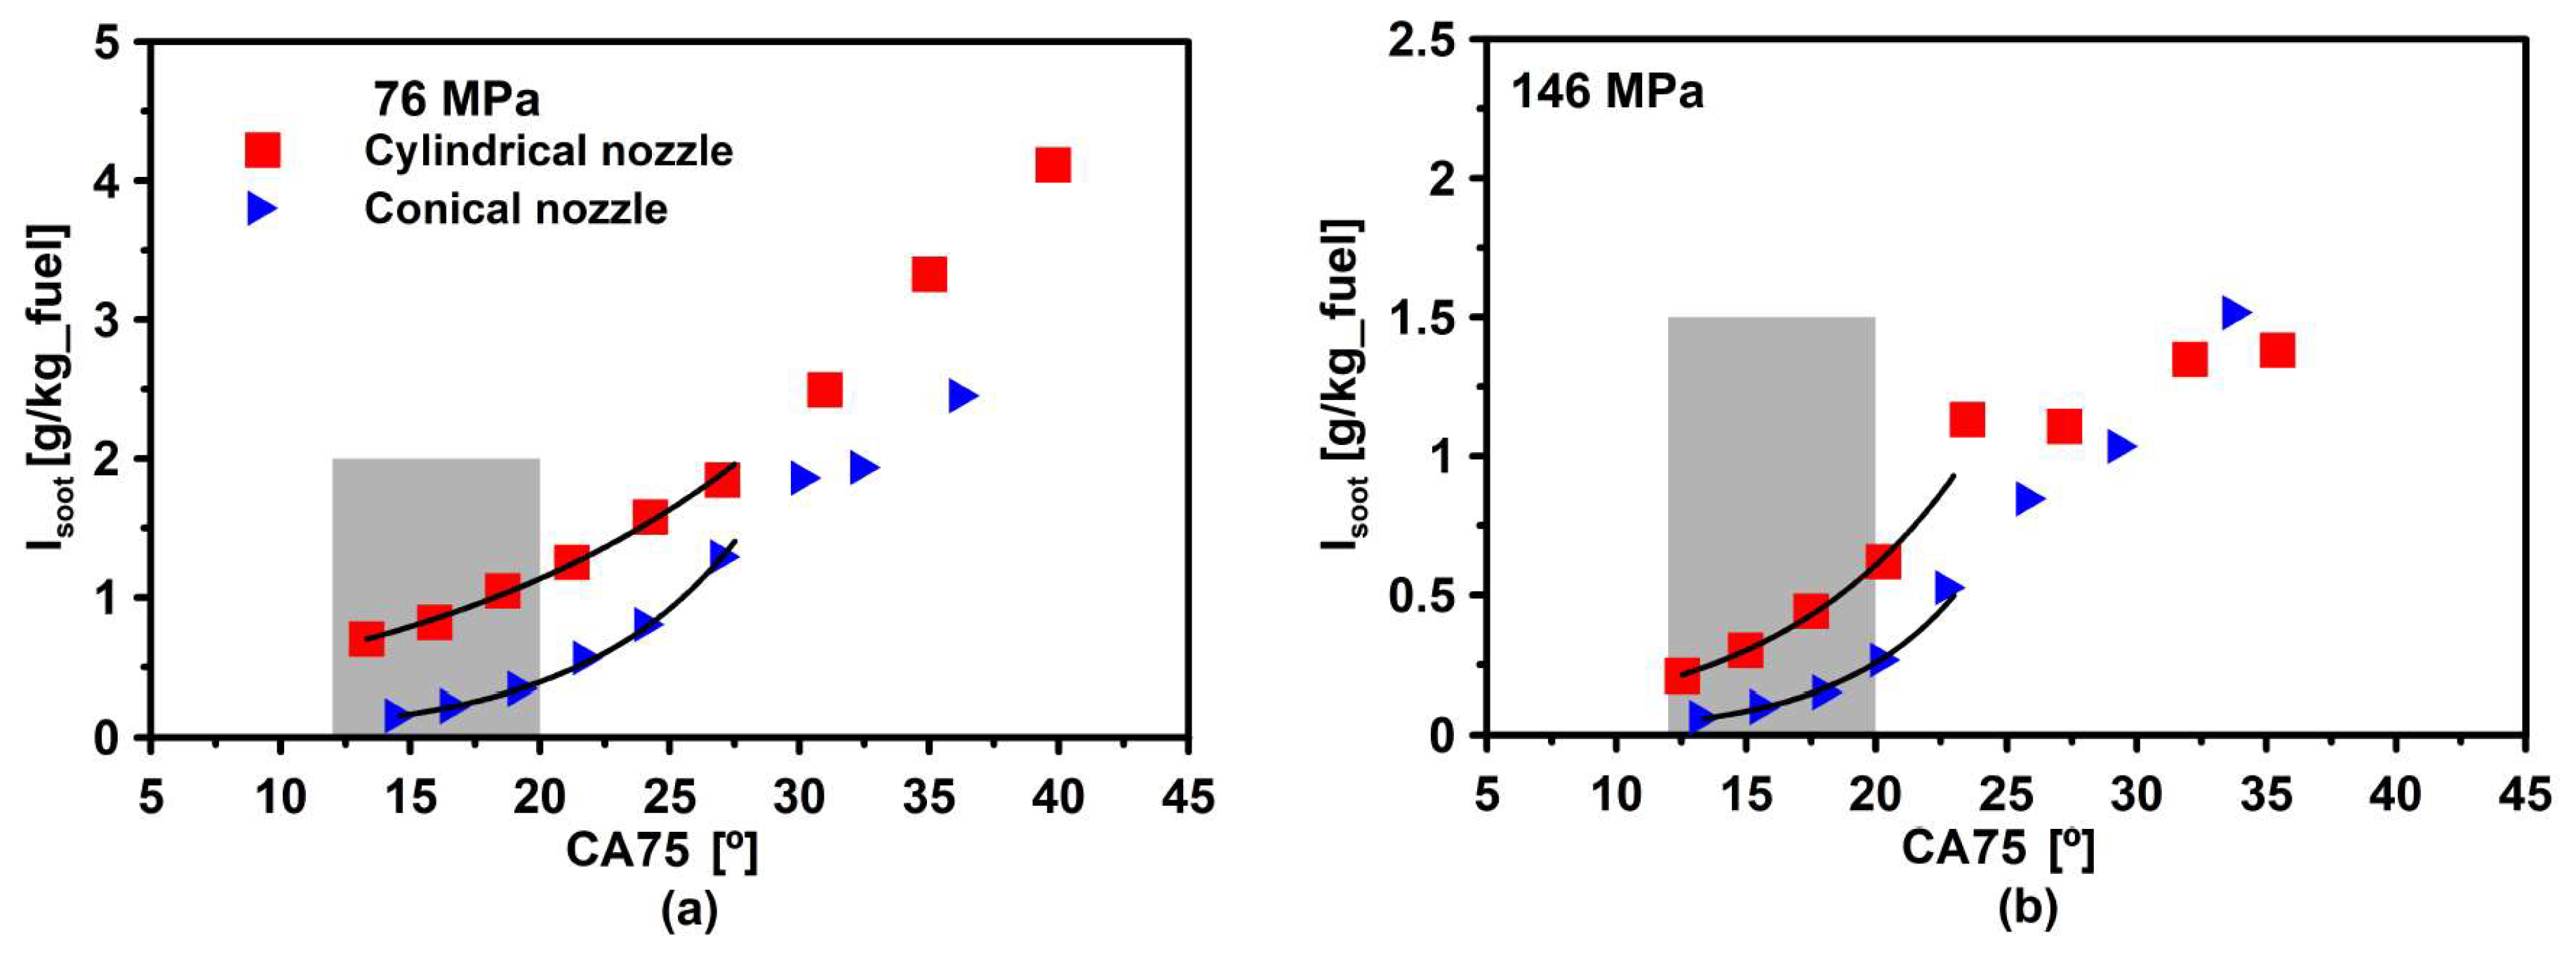
Effects of Cavitation on the Soot Formation Process
4. Conclusions
Author Contributions
Funding
Institutional Review Board Statement
Informed Consent Statement
Data Availability Statement
Acknowledgments
Conflicts of Interest
Abbreviations
| Velocity coefficient | |
| Angle obtained, when 75% of the fuel mass has been burned | |
| d | Diameter |
| Filter Smoke Number | |
| Equivalence fuel/air ratio at the lift-off | |
| Fuel/air ratio | |
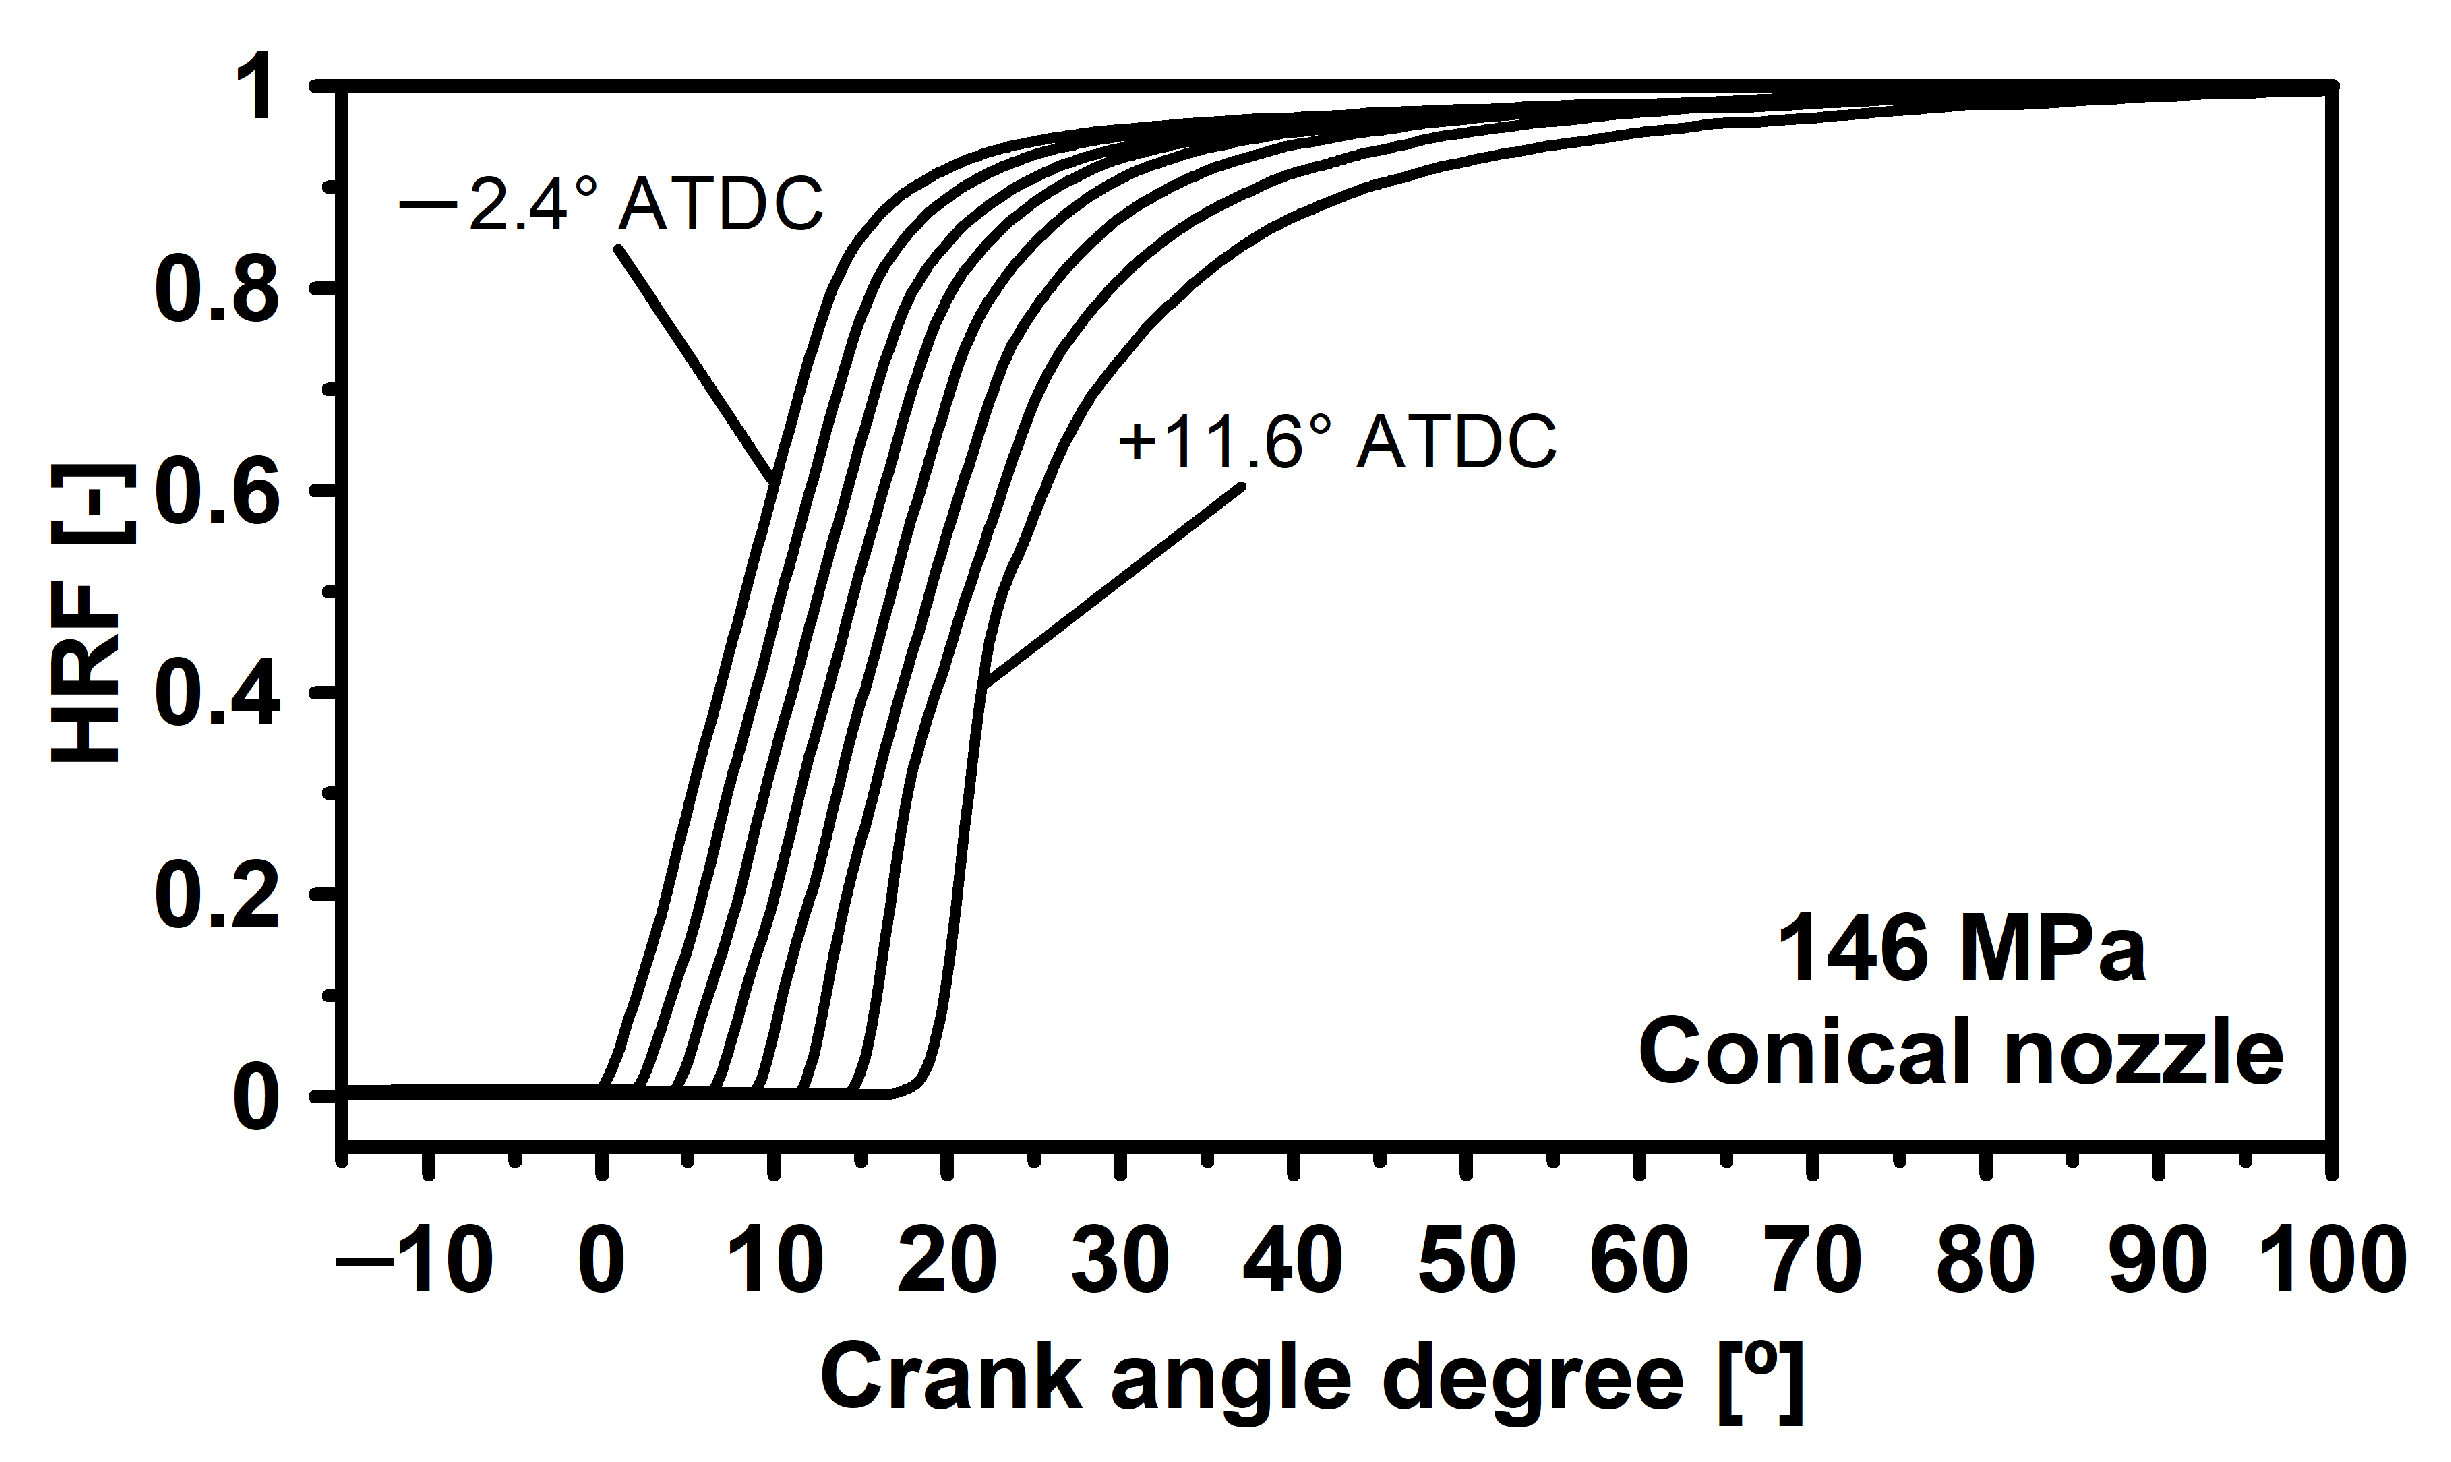
| Heat Release Fraction | |
| Soot emission index | |
| K | Proportionality constant |
| Flame length | |
| Lift-off length | |
| p | Pressure |
| Start of Injection | |
| T | Temperature |
| Temperature at end-of-combustion, when 75% of the total heat has been released | |
| Oxygen mass fraction | |
| Greek symbols | |
| Increase | |
| Density | |
| Subscripts | |
| a | Air |
| Effective | |
| f | Fuel |
| Inlet of the nozzle orifice | |
| Outlet of the nozzle orifice | |
| Common-rail | |
| Reference |
References
- Ferraro, F.; Russo, C.; Schmitz, R.; Hasse, C.; Sirignano, M. Experimental and numerical study on the effect of oxymethylene ether-3 (OME3) on soot particle formation. Fuel 2021, 286, 119353. [Google Scholar] [CrossRef]
- Bermúdez, V.; García, A.; Villalta, D.; Soto, L. Assessment on the consequences of injection strategies on combustion process and particle size distributions in Euro VI medium-duty diesel engine. Int. J. Engine Res. 2020, 21, 683–697. [Google Scholar] [CrossRef]
- Jamrozik, A.; Tutak, W.; Grab-Rogaliński, K. Combustion Stability, Performance and Emission Characteristics of a CI Engine Fueled with Diesel/n-Butanol Blends. Energies 2021, 14, 2817. [Google Scholar] [CrossRef]
- Mei, D.; Yu, Q.; Zhang, Z.; Yue, S.; Tu, L. Effects of Two Pilot Injection on Combustion and Emissions in a PCCI Diesel Engine. Energies 2021, 14, 1651. [Google Scholar] [CrossRef]
- Fernández-Rodríguez, D.; Lapuerta, M.; German, L. Progress in the Use of Biobutanol Blends in Diesel Engines. Energies 2021, 14, 3215. [Google Scholar] [CrossRef]
- Rao, L.; Zhang, Y.; Kook, S.; Kim, K.S.; Kweon, C.B. Understanding the soot reduction associated with injection timing variation in a small-bore diesel engine. Int. J. Engine Res. 2021, 22, 1001–1015. [Google Scholar] [CrossRef]
- López, J.J.; Martín, J.; García, A.; Villalta, D.; Warey, A. Implementation of two color method to investigate late cycle soot oxidation process in a CI engine under low load conditions. Appl. Therm. Eng. 2017, 113, 878–890. [Google Scholar] [CrossRef]
- Bjørgen, K.O.P.; Emberson, D.R.; Løvås, T. Combustion and soot characteristics of hydrotreated vegetable oil compression-ignited spray flames. Fuel 2020, 266, 116942. [Google Scholar] [CrossRef]
- Xu, Z.; Duan, X.; Liu, Y.; Deng, B.; Liu, J. Spray combustion and soot formation characteristics of the acetone-butanol-ethanol/diesel blends under diesel engine-relevant conditions. Fuel 2020, 280, 118483. [Google Scholar] [CrossRef]
- Yraguen, B.F.; Poursadegh, F.; Genzale, C.L. Assessment of engine combustion network recommendations for measurement of ignition and lift-off length. Int. J. Engine Res. 2021, 22, 1838–1849. [Google Scholar] [CrossRef]
- Pastor, J.V.; García, A.; Micó, C.; García-Carrero, A.A. Experimental study of influence of Liquefied Petroleum Gas addition in Hydrotreated Vegetable Oil fuel on ignition delay, flame lift off length and soot emission under diesel-like conditions. Fuel 2020, 260, 116377. [Google Scholar] [CrossRef]
- Rao, L.; Zhang, Y.; Kook, S.; Kim, K.S.; Kweon, C.B. Understanding in-cylinder soot reduction in the use of high pressure fuel injection in a small-bore diesel engine. Proc. Combust. Inst. 2019, 37, 4839–4846. [Google Scholar] [CrossRef]
- Desantes, J.M.; Garcia-Oliver, J.M.; Novella, R.; Pachano, L. A numerical study of the effect of nozzle diameter on diesel combustion ignition and flame stabilization. Int. J. Engine Res. 2020, 21, 101–121. [Google Scholar] [CrossRef]
- Payri, R.; Viera, J.P.; Gopalakrishnan, V.; Szymkowicz, P.G. The effect of nozzle geometry over ignition delay and flame lift-off of reacting direct-injection sprays for three different fuels. Fuel 2017, 199, 76–90. [Google Scholar] [CrossRef]
- Pastor, J.V.; García-Oliver, J.M.; López, J.J.; Vera-Tudela, W. An experimental study of the effects of fuel properties on reactive spray evolution using Primary Reference Fuels. Fuel 2016, 163, 260–270. [Google Scholar] [CrossRef]
- Cristofaro, M.; Edelbauer, W.; Koukouvinis, P.; Gavaises, M. A numerical study on the effect of cavitation erosion in a diesel injector. Appl. Math. Model. 2020, 78, 200–216. [Google Scholar] [CrossRef]
- López, J.J.; de la Garza, O.A.; la Morena, J.D.; Martínez-Martínez, S. Effects of cavitation in common-rail diesel nozzles on the mixing process. Int. J. Engine Res. 2017, 18, 1017–1034. [Google Scholar] [CrossRef]
- Salvador, F.J.; de la Morena, J.; Carreres, M.; Jaramillo, D. Numerical analysis of flow characteristics in diesel injector nozzles with convergent-divergent orifices. Proc. Inst. Mech. Eng. Part D J. Automob. Eng. 2017, 231, 1935–1944. [Google Scholar] [CrossRef] [Green Version]
- Guo, G.; He, Z.; Zhang, Z.; Duan, L.; Guan, W.; Duan, X.; Jin, Y. Visual experimental investigations of string cavitation and residual bubbles in the diesel nozzle and effects on initial spray structures. Int. J. Engine Res. 2020, 21, 437–447. [Google Scholar] [CrossRef]
- Fimml, W.; Chmela, F.G.; Pirker, G.; Wimmer, A. Influence of Cavitation in the Injection Nozzle on Combustion in Diesel Engines. Int. J. Engine Res. 2010, 11, 375–390. [Google Scholar] [CrossRef]
- Benajes, J.; Molina, S.; González, C.; Donde, R. The role of nozzle convergence in diesel combustion. Fuel 2008, 87, 1849–1858. [Google Scholar] [CrossRef]
- Som, S.; Ramirez, A.I.; Longman, D.E.; Aggarwal, S.K. Effect of nozzle orifice geometry on spray, combustion, and emission characteristics under diesel engine conditions. Fuel 2011, 90, 1267–1276. [Google Scholar] [CrossRef]
- Maes, N.; Skeen, S.A.; Bardi, M.; Fitzgerald, R.P.; Malbec, L.M.; Bruneaux, G.; Pickett, L.M.; Yasutomi, K.; Martin, G. Spray penetration, combustion, and soot formation characteristics of the ECN Spray C and Spray D injectors in multiple combustion facilities. Appl. Therm. Eng. 2020, 172, 115136. [Google Scholar] [CrossRef]
- Payri, F.; López, J.J.; Garcia, A.; de la Garza, O.A.; Houille, S. Effects of cavitation in common-rail diesel nozzles on the soot formation process. SAE Tech. Pap. 2013, 2. [Google Scholar] [CrossRef]
- Macian, V.; Bermúdez, V.; Payri, R.; Gimeno, J. New technique for determination of internal geometry of a diesel nozzle with the use of silicone methodology. Exp. Tech. 2003, 27, 39–43. [Google Scholar] [CrossRef]
- Olmeda, P.; Martin, J.; Garcia, A.; Villalta, D.; Warey, A.; Domenech, V. A Combination of Swirl Ratio and Injection Strategy to Increase Engine Efficiency. SAE Int. J. Engines 2017, 10. [Google Scholar] [CrossRef] [Green Version]
- Molina, S. Influence of Injection Parameters and Exhaust Gas Recirculation on the Combustion Process, Performace, and Emissions in a Diesel Engine of 1.8 Liters. Ph.D. Thesis, Universitat Politècnica de València, Valencia, Spain, 2003. (In Spanish). [Google Scholar]
- Christian, R.; Knopf, F.; Jaschek, A.; Schindler, W. A new method for filter smoke number measurement with improved sensitivity. Mot. Z. 1993, 54, 16–22. [Google Scholar]
- Payri, F.; Olmeda, P.; Martín, J.; García, A. A complete 0D thermodynamic predictive model for direct injection diesel engines. Appl. Energy 2011, 88, 4632–4641. [Google Scholar] [CrossRef]
- López, J.J.; Garcia-Oliver, J.M.; Martin, J.; Chemisky, J.P.; Bouet, A. A soot radiation model for diesel sprays. SAE Tech. Pap. 2012. [Google Scholar] [CrossRef]
- Arrégle, J.; López, J.J.; García, J.M.; Fenollosa, C. Development of a zero-dimensional Diesel combustion model. Part 1: Analysis of the quasi-steady diffusion combustion phase. Appl. Therm. Eng. 2003, 23, 1301–1317. [Google Scholar] [CrossRef]
- Siebers, D.; Higgins, B. Flame lift-off on direct-injection diesel sprays under quiescent conditions. SAE Tech. Pap. 2001. [Google Scholar] [CrossRef]
- Siebers, D.; Higgins, B.; Pickett, L. Flame lift-off on direct-injection diesel fuel jets: Oxygen concentration effects. SAE Tech. Pap. 2002. [Google Scholar] [CrossRef]
- Kong, J.; Bea, C. Effect of a conical nozzle orifice of the combustion and emissions in a direct-injection compression ignition engine under low-load conditions. Proc. Inst. Mech. Eng. Part D J. Automob. Eng. 2015, 229, 3–13. [Google Scholar] [CrossRef]

| Nozzle | [µm] | [µm] | k-Factor [-] |
|---|---|---|---|
| Conical nozzle | 135 | 105 | 3 |
| Cylindrical nozzle | 122 | 122 | 0 |
| Characteristic | Value |
|---|---|
| Bore | 75.1 mm |
| Stroke | 88.0 mm |
| Displacement volume | 399 cm3 |
| Connecting rod length | 123.8 mm |
| Bowl diameter | 46.3 mm |
| Depth of bowl | 14.3 mm |
| Compression ratio | 16.5 |
| Exhaust valve diameter | 23.4 mm |
| Intake valve diameter | 25.6 mm |
| Swirl number | 2.15 |
| Bowl volume | 18.3 cm3 |
| Number of valves per cylinder | 4 |
| Parameter | Value |
|---|---|
| Engine speed | 1000 rpm |
| Intake pressure | 0.15 MPa |
| Intake temperature | 45 °C |
| Backpressure at exhaust gas line | 0.16 MPa |
| Water temperature | 80 °C |
| Oil temperature | 90 °C |
| Fuel temperature | 40 °C |
| Injection pressure | 76 MPa and 146 MPa |
| F/A equivalence ratio | 0.6 |
| Nozzle | [-] | [mm] | Operating Conditions |
|---|---|---|---|
| Conical nozzle | 0.84/0.85 | 0.099/0.099 | Injection pressure: 76/146 MPa |
| back pressure 6 MPa | |||
| Cylindrical nozzle | 0.78/0.80 | 0.112/0.109 | Injection pulse 4 ms |
Publisher’s Note: MDPI stays neutral with regard to jurisdictional claims in published maps and institutional affiliations. |
© 2021 by the authors. Licensee MDPI, Basel, Switzerland. This article is an open access article distributed under the terms and conditions of the Creative Commons Attribution (CC BY) license (https://creativecommons.org/licenses/by/4.0/).
Share and Cite
López, J.J.; de la Garza, O.A.; De la Morena, J.; Martínez-Martínez, S. Influence of Cavitation in Common-Rail Diesel Nozzles on the Soot Formation Process through Measuring Soot Emissions. Energies 2021, 14, 6267. https://doi.org/10.3390/en14196267
López JJ, de la Garza OA, De la Morena J, Martínez-Martínez S. Influence of Cavitation in Common-Rail Diesel Nozzles on the Soot Formation Process through Measuring Soot Emissions. Energies. 2021; 14(19):6267. https://doi.org/10.3390/en14196267
Chicago/Turabian StyleLópez, José Javier, Oscar A. de la Garza, Joaquín De la Morena, and Simón Martínez-Martínez. 2021. "Influence of Cavitation in Common-Rail Diesel Nozzles on the Soot Formation Process through Measuring Soot Emissions" Energies 14, no. 19: 6267. https://doi.org/10.3390/en14196267
APA StyleLópez, J. J., de la Garza, O. A., De la Morena, J., & Martínez-Martínez, S. (2021). Influence of Cavitation in Common-Rail Diesel Nozzles on the Soot Formation Process through Measuring Soot Emissions. Energies, 14(19), 6267. https://doi.org/10.3390/en14196267