Abstract
Combustible aqueous foams and foamed emulsions represent prospective energy carriers. This paper is devoted to the overview of model assumptions required for numerical simulations of combustion and detonation processes in aqueous foams. The basic mathematical model is proposed and used for the analysis of the combustion development in the wet aqueous foam containing bubbles filled with reactive gas. The numerical results agree with the recent experimental data on combustion and detonation in aqueous foams containing premixed hydrogen–oxygen. The obtained results allowed for distinguishing the mechanisms of flame acceleration, transition to detonation, detonation propagation, and decay.
1. Introduction
The development of new technologies for efficient and clean energy is one of today’s topical challenges. Among the promising directions of development are: (1) the use of hydrogen, which represents one of the most promising renewable fuels due to its high energy density, low harmful emissions, and cost-efficiency [1,2]; (2) the improvement of fossil fuel combustion stability and efficiency via hydrogen addition [3]; and (3) fuel dilution with chemical inhibitors and inert heat carriers as a promising approach for reducing harmful emissions [4]. In the latter case, for example, water addition in the form of a spray [5] or within the emulsified fuel [6] defines the lower production of . In all the mentioned cases, one should deal with complex multiphase systems, and one needs precise instruments of experimental diagnostics and numerical analysis to obtain a clear understanding of the processes and methods of their control.
One of the most interesting combustible systems possessing all the above-mentioned features is aqueous foam, which can contain both liquid hydrocarbon fuels and/or gaseous fuels (such as hydrogen). Recently Kichatov et al. [7] introduced the foamed emulsion as a brand new type of complex fuel. Furthermore, Kichatov et al. considered the aqueous foam bubbled with a hydrogen–oxygen mixture [8] and the oil-in-water emulsion foamed with a hydrogen–oxygen mixture [9]. In the case of the hydrogen addition, the intense dynamic processes were registered and interpreted as detonation onset. Thus, in [8], the authors proposed an integral mechanism of flame acceleration based on the experimental data and traditional considerations about the positive feedback related to flame interaction with the flow induced by flame propagation through the foam. As a rule, such integral effects are determined by the local dynamics of the flame front. Thus, for example, in [10], the integral self-similar solution for the acceleration of the freely propagating flame is obtained based on the local dynamics of the flame subjected to the hydrodynamic instability. In a recent paper [11], the collective effect of water droplets suspended in a hydrogen–air mixture on the local flame dynamics and related flame intensification is studied. The local effects driving the evolution of the flame in the foamed emulsions and microfoams are still unresolved. Thus, it is of interest to investigate how the flame locally evolves and what physical mechanisms affect the flame dynamics in aqueous foams.
In the paper [8], the effect of energy focusing on the scales of a single bubble collapsing under compression was proposed as a mechanism driving the detonation propagation. These conclusions were also made based on an integral understanding of the process dynamics. However, the understanding of the local dynamics is of paramount importance here since the combustion arises and decays on the scales of individual gas bubbles. Generally speaking, similar features of the detonation evolution are observed in bubbly liquids and dry aqueous foams. In bubbly liquids [12], the bubbles are small, and the gas inside each bubble explodes as a whole, pushing the shock wave into the liquid. Subsequently, the shock wave compresses the neighboring bubbles causing explosions inside them, etc. In dry foams [13,14,15], the detonation wave decays when passing from one bubble to another due to the rupture of liquid films into fine water droplets inhibiting the reaction. As a result, the flame front enters the next bubble behind the shock wave, and the deflagration-to-detonation transition takes place on the scales of the single relatively large bubble, leading to the formation of a new detonation front. The local dynamics and particular mechanisms of flame acceleration, deflagration-to-detonation transition, and detonation propagation in wet foams are of interest and considered in this paper.
The paper is organized as follows. In Section 2, we propose a mathematical model describing the dynamic processes in combustible foams associated with flame propagation. In Section 3, the numerical results obtained with the use of the model formulated in Section 2 are discussed, and processes of flame acceleration and transition to detonation are interpreted on the basis of numerical analysis. We conclude in Section 4.
2. Mathematical Model and Problem Setup
The combustible wet foam considered recently in [8] represents a two-phase medium consisting of gas bubbles of ∼200 m diameter separated by thin films of an aqueous solution of a surfactant or oil-in-water emulsion [9]. The hydrogen–oxygen mixture is used as a foaming gas.
Let us consider the following model for the dynamic processes in combustible wet foam. The foam represents two interacting continuums whose dynamics is governed by a two-velocity, two-temperature model written in a conventional form similar to that proposed in [16]. The equation of state for the gas phase is in the same form as for the mixture of ideal gases [17]. The liquid phase is treated as incompressible and interacting with the gas phase via momentum and heat exchange. Heating of the liquid phase by hot gas defines the evaporation from the interface between the liquid and the gas according to the heat balance, as in [18]. Momentum exchange between phases is modeled via an empiric coefficient 1.0–10.0 in the same way as it was proposed in [16].
In the process of combustion wave propagation, the liquid phase of the foam decays into the droplets via two basic mechanisms. The first one is due to the expansion of the gas inside the bubble either as a result of the foaming gas heating or liquid phase evaporation. The second mechanism is the dynamic action leading to the rupture of the liquid films. According to this, here, the following criteria for the foam decay are applied: (1) at , (2) . Critical gas density corresponds to the gas volume fraction equal to 0.96, while the critical Weber number is chosen to be equal to 350, which is usually considered as a criterion for liquid droplet fragmentation (see, e.g., [19,20]).
After the foam decay, the two-phase medium is formed that represents an aerosol consisting of water droplets suspended in the hydrogen–oxygen gaseous mixture. The interaction between phases is now described via the same model but with different interaction source terms corresponding to the droplet–gas interaction. Herewith, the evaporation of droplets is modeled in the approximation of the thermal conductivity limit [21], while droplet fragmentation is described via the mechanism of fine droplets breaking away from the surface of the coarse droplets at We > 2700 [20]. According to [20], under such conditions, the diameter of fine droplets is estimated as m.
The hydrogen combustion kinetics is taken into account according to the detailed kinetic mechanism from [22]. The mechanism by Keromnes et al. is widely tested and provides very good performance in terms of reproduction of a wide range of experimental data on hydrogen–air combustion [23]. In [24], it was also shown that in a pressurized hydrogen-containing system, the considered mechanism from [22] provides results for the pressure range below 20 atm similar to those of another comprehensive detailed mechanism by Burke et al. [25].
2.1. Basic Two-Phase Model
The governing equations for gas phase in two-dimensions are written in the following way:
where is the gas density, is the i-th component of the gas velocity, is the evaporation rate of the water, is the mass fraction of the k-th specie, is the i-th diffusion velocity component of the k-th species, is the source of the k-th component due to chemical reaction, E is the specific total energy of the gaseous mixture, is the temperature of the gaseous mixture, p is the pressure of the gaseous mixture, is the thermal conductivity of the gaseous mixture, is the viscous stress tensor of the gaseous mixture, is the viscosity of the gaseous mixture, and is the enthalpy of formation of the k-th species. and are energy and momentum sources related to the interphase interactions:
where is the mass density of the aqueous phase, is the temperature of the aqueous phase, is the drag force, is the specific latent heat of the vaporization of water, is the characteristic time of heat exchange between liquid and gas phases, and is the isobaric specific heat capacity of water. For the droplets formed as a result of the foam decay, drag force is obtained from the conventional relation for spherical droplets:
where is the characteristic time of momentum exchange between liquid and gas phases.
For the foam phase, drag force is given by the semi-empirical relation [16]
with 1.0–10.0.
Characteristic time scales of the interphase momentum and heat exchange are
where is the mass of the water droplet, and is the Nusselt number.
For the liquid phase, governing equations are the following:
The presented form of the hydrodynamic model is close to that used previously in [26]. It is assumed that the behavior of the liquid phase is determined by the compression of gas and its motion inside the bubbles or between the scattered droplets, while the liquid itself is incompressible. The foam phase and aerosol produced as a result of foam decay are assumed to differ in terms of different relations for the Stokes force (see relations for above). Moreover, it is supposed that inner stresses within the liquid do not cause a significant effect on the flame propagation process. Here, it should be noted that such a model reproduces the dynamic processes in the foam quite well (see discussion in Section 2.2), in a way similar to the other models, which justifies the potential of its application. At the same time, such processes as the compaction of the liquid phase within the foam may play a significant role in the propagation of acoustic and shock waves in the foam [27]. Thus, one possible way to improve the model is to introduce compaction in the way it is implemented in, e.g., [28].
The main differences between the model presented here and one considered in [26] concern the models of heat transfer and momentum losses in the dispersed medium. In the gas-droplets region, the heating of the droplets is limited with the processes of phase transformation (evaporation). Here, the evaporation of the droplets is calculated in an approximation of evaporation limited by a heat transfer via the Spalding relation [21]:
where is the specific isochoric heat capacity of water.
The calculations are carried out using a conventional numerical technique called the “coarse particles method” and widely implemented for solving various problems in the field of gaseous and two-phase combustion (see [26], references within, and other papers by the authors). The numerical technique represents a finite-difference scheme with the second-order accuracy in space and first-order in time.
2.2. Dynamic Processes
It is of paramount importance to resolve the interactions between the gaseous and liquid phases of the foam to reproduce the dynamic processes in the aqueous foam accurately. According to the model formulation, there is a non-dimensional constant , which determines the foam resistance and can be chosen to fit the experimental data. Here we used the data of the blast wave test carried out in [29] for the aqueous foam with the same expansion ratio () and close bubbles size (50 m). The results of the fitting routine are presented in Figure 1, where the dependencies of blast wave arrival time (a) and maximal pressure behind the shock (b) on the foam layer thickness are shown. One can see that the formulated model with fits the experimental data with good agreement. Due to this, this value of is used in further calculations.
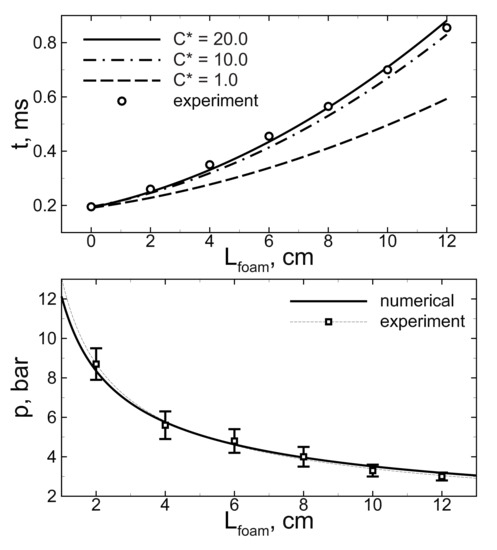
Figure 1.
Comparison between the numerical and experimental data [29] on the blast wave attenuation by the foam layers of different thicknesses. Time of blast wave arrival (top) and pressure registered behind the wave (bottom) are plotted.
2.3. Peculiarities of the Problem Setup Related to the Foam Structure
As already mentioned in the Introduction, a crucial role in flame and detonation development belongs to the local effects. This is why the structure of the foam needs to be taken into account. Here, it is proposed to set a non-uniform initial distribution of the liquid fraction as shown in Figure 2a. In gray regions, representing the films between the bubbles and the plateau borders (regions of film intersections), the density of the liquid phase () is maximal. In the white regions, the density of the liquid phase is minimal. It should be noted that here, the problem setup is two-dimensional, but there are no regions with zero liquid or gas fractions. This can be treated as a model representation of the two-dimensional projection of the real three-dimensional structure of the foam. The average value of corresponds to the expansion ratio and ∼98.6 wt.% of water content in the foam.
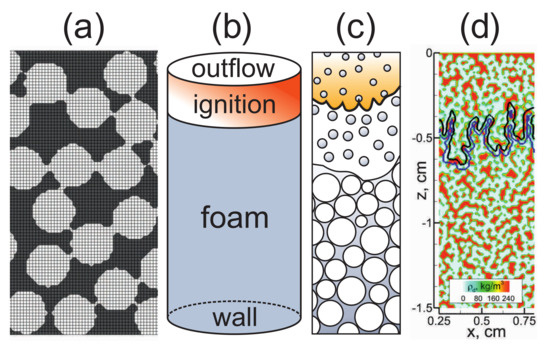
Figure 2.
(a) The structure of the foam model: gray regions contain greater amount of liquid, white regions contain greater amount of gas, and grid corresponds to the numerical grid. (b) The geometry of computational domain: gray region—the foam at 300 K temperature, red region—the heated layer ( K). The height of the channel is 14 cm, the width of the channel varies from cm to cm. (c) Schematic pattern of the downward flame propagation process in the foam (the same as was reported previously in [30]). (d) Calculated spatial distribution of liquid phase density ; black line—the position of the flame front at the considered time instant, blue line—foam surface; channel width is 1 cm.
The foam is ignited by a thin (1 mm) layer heated up to 3000 K at the top opened end of the channel where the outflow condition into air is imposed (Figure 2b). Solid wall conditions are imposed on the side walls and the bottom end of the channel. Walls are assumed to be isothermal ( K) and non-slip. The initial temperature and pressure in the foam are equal to 300 K and 1 atm, correspondingly. After ignition, the flame is formed and propagates downward through the foam (Figure 2c). The characteristic spatial distribution in the vicinity of the propagating flame is shown in Figure 2d.
Preliminary results of simulations for such a problem setup are presented in [30]. It is shown that the proposed model reproduces the experimentally obtained integral characteristics of the deflagration-to-detonation transition in stoichiometric hydrogen–oxygen microfoam such as pre-detonation length (), maximal detonation speed achieved in the process of DDT, and quasi-steady value of the wave speed at the final stage of the process development. Here, let us provide the results of the convergence test for this solution. Table 1 illustrates the convergence of the solution for the pre-detonation length. As one can see, even rather coarse numerical grids reproduce the process with high accuracy. This is due to the features of the problem setup where the distribution plays an important role and largely determines the development of the flame and detonation. The estimations of the exact solution and convergence order are calculated according to the standard routine proposed by Richardson [31]. The convergence rate is estimated as 1.87. Since the numerical scheme is of the first order, the solution is characterized by a super convergence that indicates a strong dependence of the solution on the features of the problem setup, including the non-uniform spatial distribution of .

Table 1.
Convergence test: numerical data on the cell size, , and error. Asymptotic value of and convergence order based on the estimation of is also given in the bottom row of the table.
In further numerical experiments, we used uniform meshes with the cell size m, providing an 8% error in determination of pre-detonation distance. The time step is chosen dynamically to satisfy the Courant–Friedrichs–Lewy condition , where is the speed of sound in the gaseous phase. In particular, the criterion is used.
3. Analysis of Flame Dynamics
3.1. Flame Acceleration
Let us consider the flame evolution in the process of propagation through the foam. Figure 3 shows the time history of the flame speed defined as the velocity of the flame front leading point. It can be seen that the flame, once ignited, propagates with acceleration. Herewith, the acceleration proceeds via the exponential law (flame accelerates almost exponentially before transition to detonation at ∼40–50 s, which is shown with a green dotted line). This indicates that there is a mechanism with positive feedback responsible for the flame acceleration. It should also be noted that the numerical results agree well with the experiment that substantiates the proposed mathematical model of the flame propagation through the foam. A close but less accurate comparison was presented recently in [30]. Here the experimental points from [8] are reprocessed, and two different models are used to visualize the effect of droplet fragmentation.

Figure 3.
Time history of the flame speed in the microfoam bubbled with stoichiometric hydrogen–oxygen mixture. Signs connected with dashed lines—experimental data from [8], solid lines—numerical results with (red) and without (blue) account of droplet fragmentation. Green thick line shows the exponential approximation , illustrating the self-sustained flame acceleration within time interval from 3 s to 40 s before transition to detonation. Horizontal dashed lines show the characteristic velocity scales for hydrogen–oxygen: —sonic speed in the fresh gas mixture, —sonic speed in the combustion products, —Chapman–Jouguet detonation speed.
The mechanism of flame acceleration is closely related to the flame–foam interaction. According to the proposed model and obtained numerical results, the flame–foam interaction proceeds via the following scenario. Under the thermal and dynamic action of the expanding combustion products on the foam, the foam decays into an aerosol consisting of droplets suspended in the hydrogen–oxygen mixture (Figure 1c). Figure 4 shows the multidimensional structure of the flame propagating into the foam. The red area represents the high-temperature combustion products, while the blue regions indicate the cold zone occupied by the foam and the suspension of gas and water droplets in the pre-flame area. Flame front structures in channels of different widths (3.7 cm, 1.0 cm, and 0.25 cm) are presented for the same time instant. Due to the initial non-uniform structure of the foam, there are zones in the pre-flame area with a larger and smaller volumetric content of droplets (Figure 1d). This means that the flame propagates through an array of droplets scattered in space with an average distance between them equal to the initial bubble size (). Herewith, the average diameter of droplets is equal to the size of the plateau borders, which are about .
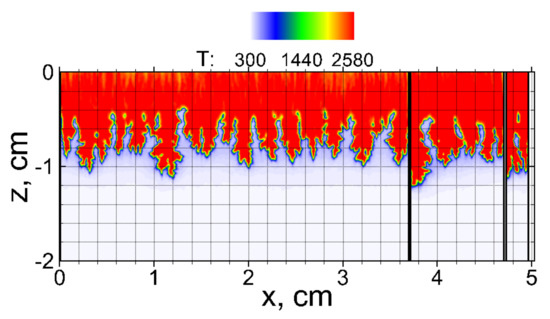
Figure 4.
Flame structure in the stoichiometric hydrogen–oxygen microfoam in the tubes of different widths (from left to right, cm, cm, and cm) at the same time instant.
Close conditions where the flame interacts with an array of equally spaced droplets were considered recently in [11]. In that paper, it was shown that the droplets affect the flame surface and cause excitation of the hydrodynamic instability development. As a result, the flame accelerates. Herewith, the most pronounced effect was observed in the case of rather coarse droplets (with diameter larger than m) scattered in space at the distance of the order of critical wavelength () corresponding to the highest rate of hydrodynamic instability growth () [32]. The same scenario is observed in the case of foam combustion. This exact mechanism plays the most important role in the process of flame acceleration in the hydrogen–oxygen microfoam. As Figure 4 clearly shows, the flame structure is almost independent of the channel width. Thus, it can be concluded that the momentum and heat losses to the walls play much less of a role in the flame acceleration compared with the effect of the flame–droplets interaction and instability development. Similar flame evolution patterns can be observed in obstructed spaces [33] or in porous media [34].
It is interesting to note that foam decay results in the formation of rather coarse droplets. Such droplets effectively excite perturbations on the flame surface due to high momentum losses, but the process of their evaporation is fairly slow, proceeds mainly in the combustion products area, and does not lead to flame quenching. In such a way, a natural separation between the combustion and evaporation zones is established. As a result, the foam with relatively high water content (∼90 wt.% and greater) remains combustible. Moreover, the combustion in such a foam develops in the form of an accelerating flame.
With the account of the mechanism of flame propagation through the foam described above, the basic description of the flame acceleration mechanism is as follows. Foam decays under the action of the flame. Herewith, the intensity of foam decay increases with the increase in the flame speed and the flame surface. Thus, the faster and more developed flame causes more intense foam decay. On the other hand, foam decay defines additional flame acceleration via the mechanism described above. The flame perturbation by droplets and instability growth determines both flame acceleration and the increase in its surface. In such a way, a positive feedback loop is established, and the flame accelerates exponentially.
3.2. Detonation
The process of flame acceleration is always associated with the compression of the combustible medium. The flame propagating inside the channel acts like a piston on the unreacted medium ahead of the flame. When flame acceleration takes place in gases, peculiarities of flame dynamics on different stages of its acceleration define distinct modes of compression [35]. Thus, at the stage of exponential acceleration, the compression leads to shock wave generation at a certain distance ahead of the flame front. At the stage of subexponential acceleration (according to the power law with an exponent less than unity), the formation of the shock wave takes place in the immediate vicinity of the flame front [36]. Due to this, there is a coupling between the reaction front and compression zone, so the compression rate increases at this stage. In such a way, the accumulative effect results in a strong shock formation on the scales of the reaction zone, which finally causes the detonation onset. A detailed analysis of the flow patterns obtained in [36,37] shows that in the case of gas combustion in channels, this effect is related to the momentum losses on the channel side walls. Such an accumulative mechanism is realized at the later stages of flame acceleration as well when the flame achieves the maximal speed of CJ deflagration, which is of the order of sonic speed in the combustion products [38]. At this stage (of so-called chocked flame), the compression on the scales of the reaction zone is related to the peculiarities of the behavior of compression waves emitted from the reaction zone propagating with a transonic speed [35]. Depending on the rate of chemical kinetics and on the burning rate variation with compression, which is much more important, a further increase in the compression rate can take place. This finally leads to the detonation onset.
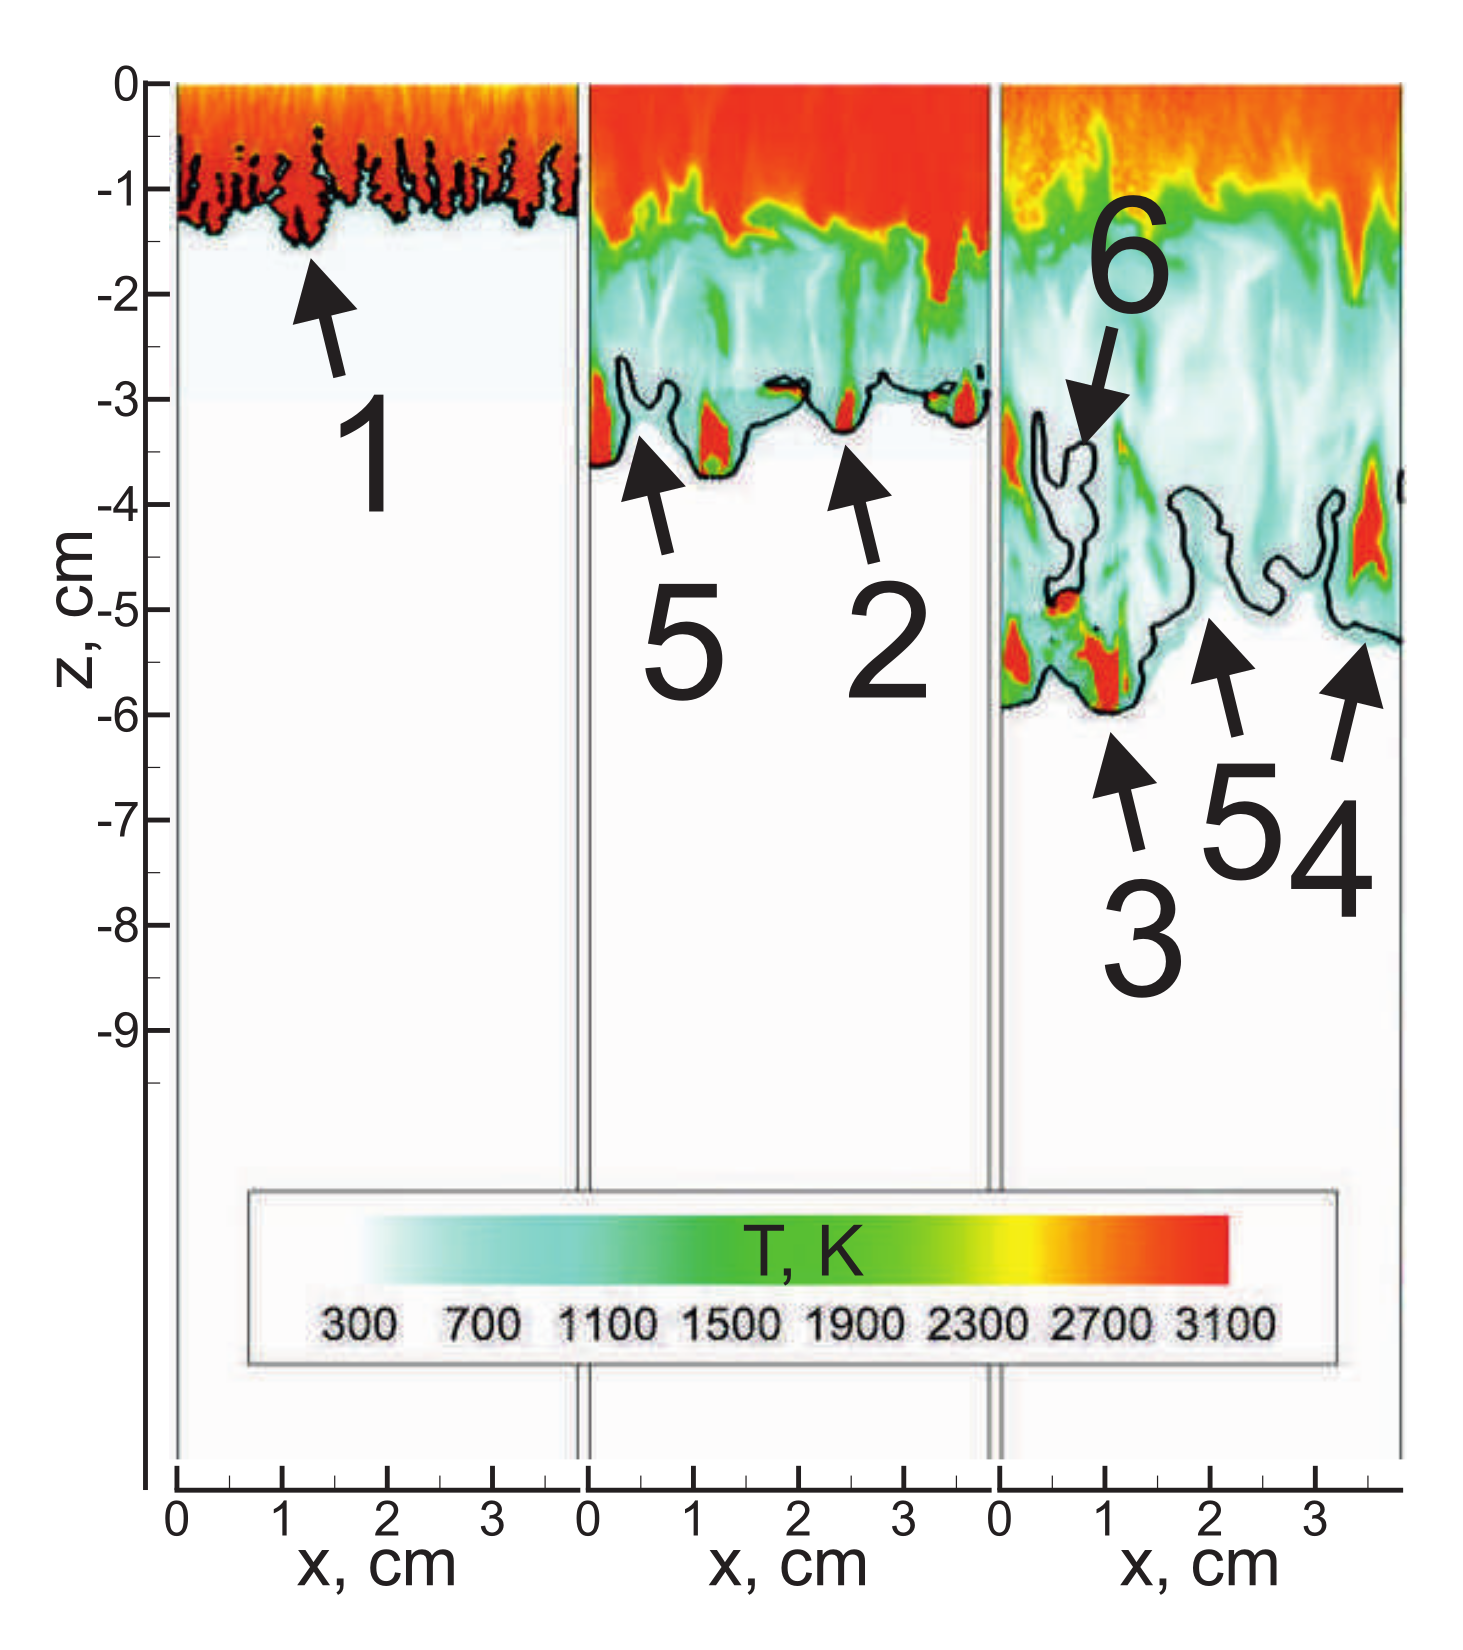
Let us now consider the peculiarities of the compression effect inherent to the process of the flame-accelerated propagation through the foam. The foam represents a two-phase medium in which the compression waves attenuate due to the momentum and heat losses. This feature of the foam, in particular, is widely used to suppress the dynamic loads on the solid constructions with foam barriers [29,39]. Due to this effect, the compression wave propagates through the foam with a lower speed that defines the same localization effect of the compression zone at a short distance ahead of the flame front (Figure 5), as discussed above. The coupling of the accelerating flame with a compression zone results in the intensification of the process, and the deflagration-to-detonation transition occurs via the mechanism proposed in [36]. Herewith, the foam decays in the pre-flame zone, and the detonation onset arises in the gas pockets between the droplets (Figure 6). Note that the temperature of the combustion product area behind the flame front is rather low. The evaporation of droplets located inside the combustion product area causes its cooling, but the temperature remains far beyond the temperature of water evaporation, so the expanding combustion products still can cause foam decay in the pre-flame zone. The boundary of the combustion products region propagates (solid black line in Figure 6) downwards together with the reaction front, which is scattered in space due to the heat and momentum losses in the process of detonation wave interaction with the foam.
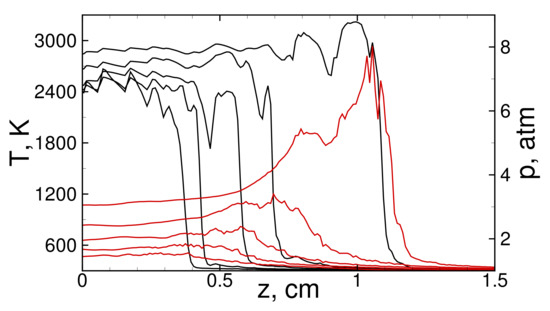
Figure 5.
Temperature (black) and pressure (red) profiles in the fixed cross section at subsequent time instants (20, 25, 30, 35, and 40 s).
Figure 6.
Numerically obtained flow pattern in the process of flame acceleration and detonation propagation in the foam bubbled with mixture in 37 mm channel. Time instants are: 40, 50, and 60 s. 1—flame front, 2—local explosion, 3—decaying stage of the local explosion, 4—quenched kernel, 5—jet of combustion products, 6—unreacted pocket behind the leading front. Black line indicates the boundary of combustion products region. Calculation with account of droplet fragmentation.
The blue curve in Figure 3 shows the numerical solution with the formation of a self-sustained detonation wave. The self-sustained detonation was also observed experimentally. However, it was rather difficult to measure the exact value of the detonation speed since strong illumination did not allow for accurate discerning of the flow pattern (see Figure 4 in [8]). Here, the uncertainty in the determination of the detonation speed is shown via the error bars. The obtained detonation speed (Figure 3) is lower than the detonation speed in pure gas ( m/s). Integrally, the shock wave driving the detonation loses its intensity when entering the foam, but locally, the process is more complex. The gas phase occurs as compressed even to a higher rate than in gaseous detonation. In the limit of the infinite thickness of the liquid films, the bubbles are collapsing, so extreme values of temperature and pressure can be achieved inside the bubble due to the energy focusing. In the case of the finite thickness of liquid films, they are also acting as soft shells on the gas inside, and their contraction also results in the gas compression limited by the time instant of the films’ rupture. Nevertheless, the gas inside the bubbles (or regions between droplets after films rupture) occurs as compressed up to higher compression rates compared to the shock-compression of the pure gas. As a result, the lower intensity of the leading shock wave is sufficient for self-sustained detonation wave propagation through the foam. Due to this, the steady-state detonation speed in the wet foam occurs as lower than the detonation speed in gases.
As soon as the detonation wave is formed, it interacts with the foam. In particular, the detonation wave propagates from one bubble to the neighboring one. In the process of the detonation wave interaction with a liquid film between the bubbles, the film decays into an aerosol. Moreover, the intense dynamic loads cause the fragmentation of droplets into smaller ones. These small droplets take a significant part of the momentum and heat from the flow that leads to the deceleration of the leading shock wave. Thus, in Figure 6, one can observe the local decay of the detonation wave. Moreover, the detonation wave can decay as a whole. The solution shown by the red curve in Figure 3 was obtained with an account of droplet fragmentation, and contrary to the case without accounting for this factor (blue line), here, one can observe detonation deceleration. Finally, the detonation decays with a total quenching of the combustion. However, the combustion products continue to expand intensively, causing dynamic action on the foam in the bottom part of the channel below the area of detonation decay. The jet-like flow of the combustion products is formed, which destroys the remaining foam. Herewith, the formed droplets evaporate in the combustion products, and in the end, no foam remains in the channel.
It should be noted that there is good agreement in the dynamics of the process in the final stage observed experimentally and that obtained numerically (Figure 3). The available experimental diagnostics were limited, and the main difficulty is related to the fact that the foam is not an optically transparent medium. It impedes acquiring a clear pattern of the flow. Error bars on the experimental data in Figure 3 are based on the thickness of the light zone and indicate the estimation from below. The numerically obtained maximal speed is quite close to the experimental one. The largest visible divergence is about 300 m/s (∼10% compared with the value of 3000 m/s). Given this, the representation of the process at this stage based on model assumptions and numerical results is quite plausible. The experimental diagnostics need to be improved to obtain a more thorough understanding of the process and, in particular, details of the detonation decay. In [8], only visible light was registered, while there are different possible reasons for illumination, including the luminosity of the collapsing bubbles.
4. Conclusions
In this paper, we propose a numerical model and present new results on flame acceleration and detonation onset, propagation, and decay in hydrogen–oxygen microfoam. It is demonstrated that the structure of the foam determines the features of deflagration and detonation waves propagating through the foam. In particular, it is shown that the leading role in flame propagation and acceleration belongs to the parameters of the aerosol formed as a result of foam decay. Rather coarse droplets of ∼140 m diameter are scattered in space with an average distance of ∼200 m, which corresponds to the regime of flame propagation under the permanent effect of excitation of the short-wavelength perturbations by droplets and intensification of the instability growth. The same phenomenon was recently described in detail in [11]. As a result, the flame acceleration proceeds in the same way, independent of the geometry of the reactor.
The detonation arises due to the compression wave localization directly ahead of the accelerated flame front. This localization takes place due to the high hydraulic resistance of the foam. As a result, the coupling of the reaction zone with the compression zone leads to an increased rate of flame acceleration as well as to a higher rate of compression on the scales of the reaction zone. Finally, this leads to the detonation wave formation. Herewith, it is initially formed in the aerosol and then propagates into the foam that leads to its deceleration. The detonation speed, as well as the magnitude of the leading shock wave, is lower in the foam compared with the pure gas. This can be explained by the structure of the reaction zone, representing the series of explosion kernels scattered in space behind the leading shock front. The positions of these kernels are associated with the bubbles in the foam, while the explosions are triggered by the shock wave focusing on the scales of each bubble due to the liquid shell collapse. Herewith, an important role belongs to the process of droplet fragmentation due to dynamic impact. Fine droplets formed in the zone of the detonation front cause both deceleration of the shock wave and quenching of the exothermic reaction. As a result, the detonation wave decays. The distinguished mechanisms of detonation onset, propagation, and decay widen the physical understanding of the detonation processes observed recently in [8].
The proposed model provides good qualitative results and allows the physical interpretation of the features of the flame-accelerated propagation and transition to detonation in hydrogen–oxygen microfoam. However, there is still room for improvement. The main strategy to enhance the performance of the elaborated model is to introduce an account of compaction phenomena in a way as it was implemented, e.g., by M.R. Baer and J.W. Nunziato in [28].
Author Contributions
Conceptualization, A.K.; methodology, A.K. and I.Y.; software, I.Y.; validation, A.K. and I.Y.; formal analysis, A.K. and I.Y.; investigation, A.K. and I.Y.; resources, A.K. and I.Y.; data curation, A.K. and I.Y.; writing—original draft preparation, A.K.; writing—review and editing, A.K. and I.Y.; visualization, A.K. and I.Y.; supervision, A.K.; project administration, A.K.; funding acquisition, A.K. All authors have read and agreed to the published version of the manuscript.
Funding
This research was supported by The Ministry of Science and Higher Education of the Russian Federation (Agreement with Joint Institute for High Temperatures RAS No 075-15-2020-785 dated 23 September 2020).
Institutional Review Board Statement
Not applicable.
Informed Consent Statement
Not applicable.
Data Availability Statement
The data are available upon request from the corresponding authors.
Acknowledgments
We are grateful to Boris Kichatov and Alexey Korshunov for fruitful discussions. We acknowledge high-performance computing support from the Joint Supercomputer Center of the Russian Academy of Sciences and Supercomputing Center of Lomonosov Moscow State University.
Conflicts of Interest
The authors declare no conflict of interest.
References
- Abe, J.; Popoola, A.; Ajenifuja, E.; Popoola, O. Hydrogen energy, economy and storage: Review and recommendation. Int. J. Hydrog. Energy 2019, 44, 15072–15086. [Google Scholar] [CrossRef]
- Verhelst, S. Recent progress in the use of hydrogen as a fuel for internal combustion engines. Int. J. Hydrog. Energy 2014, 39, 1071–1085. [Google Scholar] [CrossRef] [Green Version]
- Li, Y.; Bi, M.; Li, B.; Zhou, Y.; Gao, W. Effects of hydrogen and initial pressure on flame characteristics and explosion pressure of methane/hydrogen fuels. Fuel 2018, 233, 269–282. [Google Scholar] [CrossRef]
- Taghavifar, H.; Anvari, S.; Parvishi, A. Benchmarking of water injection in a hydrogen-fueled diesel engine to reduce emissions. Int. J. Hydrog. Energy 2017, 42, 11962–11975. [Google Scholar] [CrossRef]
- Anufriev, I.S.; Kopyev, E.P. Diesel fuel combustion by spraying in a superheated steam jet. Fuel Process. Technol. 2019, 192, 154–169. [Google Scholar] [CrossRef]
- Huo, M.; Lin, S.; Liu, H.; Lee, C.f.F. Study on the spray and combustion characteristics of water–emulsified diesel. Fuel 2014, 123, 218–229. [Google Scholar] [CrossRef] [Green Version]
- Kichatov, B.; Korshunov, A.; Kiverin, A.; Son, E. Foamed emulsion—Fuel on the base of water-saturated oils. Fuel 2017, 203, 261–268. [Google Scholar] [CrossRef]
- Kichatov, B.; Korshunov, A.; Kiverin, A.; Yakovenko, I.; Gubernov, V.; Khomik, S.V.; Medvedev, S.P. Detonation in the hydrogen-oxygen microfoam on the aqueous base. Int. J. Hydrog. Energy 2019, 44, 31567–31578. [Google Scholar] [CrossRef]
- Kichatov, B.; Korshunov, A.; Gubernov, V.; Kiverin, A.; Yakovenko, I. Combustion of heptane-in-water emulsion foamed with hydrogen-oxygen mixture. Fuel Process. Technol. 2020, 198, 106230. [Google Scholar] [CrossRef]
- Gostintsev, Y.A.; Istratov, A.G.; Shulenin, Y.V. Self-similar propagation of a free turbulent flame in mixed gas mixtures. Combust. Explos. Shock Waves 1988, 24, 563–569. [Google Scholar] [CrossRef]
- Yakovenko, I.; Kiverin, A. Intensification mechanisms of the lean hydrogen-air combustion via addition of suspended micro-droplets of water. Int. J. Hydrog. Energy 2021, 46, 1259–1272. [Google Scholar] [CrossRef]
- Sychev, A.; Pinaev, A. Self-sustaining detonation in liquids with bubbles of explosive gas. J. Appl. Mech. Tech. Phys. 1986, 27, 119–123. [Google Scholar] [CrossRef]
- Saint-Cloud, J.; Guerraud, C.; Moreau, M.; Manson, M. Experiences sur la propagation des detonations dans un milieu biphasique. Acta Astronaut. 1976, 3, 781–794. [Google Scholar] [CrossRef]
- Segev, G.; Hasson, A.; Siman, M.; Burcat, A. Detonation waves through foam. In Proceedings of the 22nd Symposium (International) on Combustion, Seattle, WA, USA, 14–19 August 1989; pp. 1751–1756. [Google Scholar]
- Subbotin, V.; Usol’tsev, S. Study of the mechanism of the transfer of gaseous detonation through films of liquid. Combust. Explos. Shock Waves 1984, 20, 224–230. [Google Scholar] [CrossRef]
- Faure, S.; Ghidaglia, J.M. Violent flows in aqueous foams I: Physical and numerical models. Eur. J. Mech. B/Fluids 2011, 30, 341–359. [Google Scholar] [CrossRef]
- Kuo, K.K.; Acharya, R. Fundamentals of Turbulent and Multiphase Combustion, 1st ed.; John Wiley & Sons Inc.: Hoboken, NJ, USA, 2012. [Google Scholar]
- Shinjo, J.; Xia, J.; Ganippa, L.C.; Megaritis, A. Physics of puffing and microexplosion of emulsion fuel droplets. Phys. Fluids 2014, 26. [Google Scholar] [CrossRef]
- Tonini, S.; Gavaises, M.; Theodorakakos, A. The role of droplet fragmentation in high-pressure evaporating diesel sprays. Int. J. Therm. Sci. 2009, 48, 554–572. [Google Scholar] [CrossRef]
- Boiko, V.M.; Poplavski, S.V. Experimental study of two types of stripping breakup of the drop in the flow behind the shock wave. Combust. Explos. Shock Waves 2012, 48, 440–445. [Google Scholar] [CrossRef]
- Spalding, D.B. Combustion and Mass Transfer, 1st ed.; Pergamon Press Inc.: Elmsford, NY, USA, 1979. [Google Scholar]
- Kéromnès, A.; Metcalfe, W.K.; Heufer, K.A.; Donohoe, N.; Das, A.K.; Sung, C.J.; Herzler, J.; Naumann, C.; Griebel, P.; Mathieu, O.; et al. An experimental and detailed chemical kinetic modeling study of hydrogen and syngas mixture oxidation at elevated pressures. Combust. Flame 2013, 160, 995–1011. [Google Scholar] [CrossRef] [Green Version]
- Olm, C.; Zsély, I.G.; Pálvölgyi, R.; Varga, T.; Nagy, T.; Curran, H.J.; Turányi, T. Comparison of the performance of several recent hydrogen combustion mechanisms. Combust. Flame 2014, 161, 2219–2234. [Google Scholar] [CrossRef] [Green Version]
- Ahmed, S.F.; Santner, J.; Dryer, F.L.; Padak, B.; Farouk, T.I. Computational Study of NOx Formation at Conditions Relevant to Gas Turbine Operation, Part 2: NOx in High Hydrogen Content Fuel Combustion at Elevated Pressure. Energy Fuels 2016, 30, 7691–7703. [Google Scholar] [CrossRef]
- Burke, M.P.; Chaos, M.; Ju, Y.; Dryer, F.L.; Klippenstein, S.J. Comprehensive H2/O2 kinetic model for high-pressure combustion. Int. J. Chem. Kinet. 2012, 44, 444–474. [Google Scholar] [CrossRef]
- Ivanov, M.F.; Kiverin, A.D.; Liberman, M.A. Ignition of deflagration and detonation ahead of the flame due to radiative preheating of suspended micro particles. Combust. Flame 2015, 162, 3612–3621. [Google Scholar] [CrossRef] [Green Version]
- Baer, M.R. A numerical study of shock wave reflections on low density foam. Shock Waves 1992, 2, 121–124. [Google Scholar] [CrossRef]
- Baer, M.R.; Nunziato, J.W. A two-phase mixture theory for the deflagration-to-detonation transition (ddt) in reactive granular materials. Int. J. Multiph. Flow 1986, 12, 861–889. [Google Scholar] [CrossRef]
- Sembian, S.; Liverts, M.; Apazidis, N. Attenuation of strong external blast by foam barriers. Phys. Fluids 2016, 28. [Google Scholar] [CrossRef]
- Kiverin, A.D.; Yakovenko, I.S.; Kichatov, B.V.; Korshunov, A.M. Cumulative effect in foams and mechanism of detonation development. J. Phys. Conf. Ser. 2020, 1686, 012079. [Google Scholar] [CrossRef]
- Roache, P.J. Perspective: A Method for Uniform Reporting of Grid Refinement Studies. J. Fluids Eng. 1994, 116, 405. [Google Scholar] [CrossRef]
- Landau, L.D.; Lifshitz, E.M. Fluid Mechanics, 2nd ed.; Butterworth-Heinemann: Burlington, MA, USA, 1987; Volume 6. [Google Scholar]
- Ogawa, T.; Gamezo, V.N.; Oran, E.S. Flame acceleration and transition to detonation in an array of square obstacles. J. Loss Prev. Process Ind. 2013, 26, 355–362. [Google Scholar] [CrossRef]
- Babkin, V.S. Filtrational combustion of gases. Present state of affairs and prospects. Pure Appl. Chem. 1993, 65, 335–344. [Google Scholar] [CrossRef]
- Kiverin, A.; Yakovenko, I.; Ivanov, M. On the structure and stability of supersonic hydrogen flames in channels. Int. J. Hydrog. Energy 2016, 41, 22465–22478. [Google Scholar] [CrossRef]
- Ivanov, M.F.; Kiverin, A.D.; Liberman, M.A.; Fortov, V.E. The flame-acceleration mechanism and transition to detonation of a hydrogen-oxygen mixture in a channel. Dokl. Phys. 2010, 55, 480–484. [Google Scholar] [CrossRef]
- Ivanov, M.; Kiverin, A.; Liberman, M.A. Flame acceleration and DDT of hydrogen–oxygen gaseous mixtures in channels with no-slip walls. Int. J. Hydrog. Energy 2011, 36, 7714–7727. [Google Scholar] [CrossRef]
- Saif, M.; Wang, W.; Pekalski, A.; Levin, M.; Radulescu, M.I. Chapman–Jouguet deflagrations and their transition to detonation. Proc. Combust. Inst. 2016, S1540748916303807. [Google Scholar] [CrossRef] [Green Version]
- Britan, A.; Shapiro, H.; Liverts, M.; Ben-Dor, G. Macro-mechanical modeling of blast-wave mitigation in foams. Part III: Verification of the models. Shock Waves 2014, 24, 241–256. [Google Scholar] [CrossRef]


Publisher’s Note: MDPI stays neutral with regard to jurisdictional claims in published maps and institutional affiliations. |
© 2021 by the authors. Licensee MDPI, Basel, Switzerland. This article is an open access article distributed under the terms and conditions of the Creative Commons Attribution (CC BY) license (https://creativecommons.org/licenses/by/4.0/).