Article

Exergetic Performance of a PEM Fuel Cell with Laser-Induced Graphene as the Microporous Layer

by
Viorel Ionescu
1,
Adriana Elena Balan
2,*,
Alexandra Maria Isabel Trefilov
3,* and
Ioan Stamatin
2
1
Department of Physics and Electronics, Ovidius University of Constanța, 900527 Constanța, Romania
2
3NanoSAE Research Center, Faculty of Physics, University of Bucharest, 077125 Măgurele, Romania
3
National Institute for Laser, Plasma and Radiation Physics (INFLPR), 077125 Măgurele, Romania
*
Authors to whom correspondence should be addressed.
Energies 2021, 14(19), 6232; https://doi.org/10.3390/en14196232
Submission received: 7 September 2021 / Revised: 22 September 2021 / Accepted: 23 September 2021 / Published: 30 September 2021

Abstract

:
The microporous layer (MPL) constitutes a critical component of the gas diffusion layer within the membrane electrode assembly (MEA) of a proton exchange membrane fuel cell (PEM FC). The MPL plays a fundamental role in various processes during FC operation: control of membrane humidification, heat distribution throughout the MEA, excess water removal from the cathode, and transportation of fuel to the reaction sites. Previously, we investigated the performance of a fuel cell unit employing an MPL based on laser-induced graphene (LIG) produced by the laser pyrolysis of polymeric (polyimide) substrates. The prototype LIG-based unit was tested over the typical range of relative humidity and temperature conditions. The polarization curves observed in that study displayed broad ohmic loss regions and high stability along the concentration loss regions, an interesting electrical behavior that justified developing the present voltage-current density study for the same FC prototype compared to one bearing a commercial pyrolytic carbon black MPL. The same operating conditions as in the first study were applied, in order to properly compare the performance efficiencies between the two systems; these are evaluated by considering the thermodynamic losses influence on the exergy efficiency, to exceed any limitations inherent in the classical energy efficiency analysis.

1. Introduction

Proton Exchange Membrane Fuel Cells (PEM FCs) using hydrogen as the fuel source are currently considered as attractive options for clean energy production for automotive applications, among other possible uses [1,2,3]. PEM FCs, with their high power densities, low operating temperatures, and quick start-up times, lend themselves as the heart of hybrid Fuel Cell Electrical Vehicles (FCEVs) having energy conversion systems based on PEM FC stacks and battery-supercapacitor storage units [4,5]. However, the wide-spread commercial penetration of PEM FCs was not yet been attained due to the high cost of cell components, reduced electrical performances at high current densities, and durability limitations [6,7]. A recent study reported that the cost of delivering hydrogen fuel using liquid-distribution pathways may vary from $4.3 to $8.0 per kg in the USA and China by 2030, assuming large-scale penetration [8]. Thus, extensive research has been devoted to overcoming the aforementioned limitations, focusing on reducing the platinum catalyst loading down to 0.125 mg cm–2 and on securing a prolonged lifetime of 5000 to 8000 h for FC systems for light-duty vehicles [9].
Thorough understanding of the effects of operating conditions, pertaining to a wide range of RH and temperatures, is considered imperative for optimizing FC performance. For example, water balance across the membrane is critical for reaching the optimal electrolyte conductivity while avoiding electrode flooding. One of the main research targets is to secure improved performance over a high number of cycles at a low relative humidity (RH) of reactant gases, while knowing that humidification of the reactant feed streams incurs additional costs and parasitic losses [10,11,12]. Still, RH values below 50 to 60% for the reactant fluxes may generate significant losses in oxygen reduction reaction (ORR) kinetics, attributed to reduced protonic and water activities via protons sequestering at low RH and hydration of the membrane’s acidic groups [13]. On the other hand, temperature increase has been associated with enhancing the overall cell performance by affecting open circuit voltages (OCV), as well as electrode kinetics, membrane conductivity, hydrogen crossover, and mass transfer processes [14]. Recently, it was reported that the main reason for carbon corrosion on the electrodes of the membrane-electrode assembly (MEA) is the increased operating temperature and water flooding at high current densities, which translate to accelerated carbon corrosion rates and reduced FC lifetimes [15].
Cost and performance issues are both associated with the materials and efficiency of the MEA, consisting of a proton-conducting membrane and a catalyst-supporting gas-diffusion layer (GDL). The latter is responsible for balancing gas-water flows, maintaining the membrane’s hydration levels so that high protonic conductivity is retained without electrode flooding or gas-flow impedance during operation. The GDL is partitioned into two distinct layers: a macroporous support layer (typical materials being carbon paper or carbon cloth) and a microporous layer (MPL), composed of carbonic materials mixed with a hydrophobic polymeric binder. The MPL essentially manages the humidification of the membrane and the removal of excess water from the cathode, fuel transportation to the catalyst layer, temperature control, and the minimization of contact resistances [16,17,18,19].
Extensive research has been dedicated towards optimized carbon-based MPLs and catalyst supports through the development of materials offering beneficial advantages: corrosion resistance, environmental friendliness, high electrical and thermal conductivities, low production costs, and mechanical robustness [18,19]. Examples start from the traditional pyrolytic carbons and range to state-of-the-art options: carbon aerogels or xerogels, carbon nanotubes, and graphene [20,21,22,23,24,25,26,27,28,29,30,31]. Joo et al. [32] reported in a research study that after incorporating tricyanofuran-functionalized chromophore (TCFP) groups in graphene layers increase the molecular dipole moment, shifting the energy levels in the electronic bandgap of molecules. So, an enhanced electrical conductivity of the graphene-based GDL layers in the fuel cells can conduct this way to a more efficient electron transport to and from catalyst layers. The manipulation of the MPL carbon fibre arrangement can generate a gradient pore size in GDL, establishing an improved mass- transfer of the MEA in the fuel cells [33]. Studies on graphene as MPL or catalyst support have demonstrated its considerable advantages; however, issues pertaining to its elevated manufacturing costs and long-term susceptibility to degradation have not as yet been fully mitigated [23,24,25,26,27,28,29,30,31] .
In our recent work [34], aiming for the production of low-cost but high-performance carbonic materials for use as FC components, we employed laser pyrolysis for generating graphenic films. Laser pyrolysis has been historically established as a method employed for the bulk production of fine powders with controllable particle size distributions and morphologies, by the application of high-powered CO2 lasers to homogeneous gas-phase media [35]. The laser-induced graphene (LIG) technology with CO2 based laser offer in the fuel cell application area some great flexibility with designable patterning and distinctive 3D porous networks, controllable morphology of the microporous layers for GDL. Still, other types of lasers, like UV laser, visible laser or ultra-short pulse laser, must be tested to fabricate MPL layers through LIG technology to establish the optimal method for designing interconnected graphene-based foam layers.
Recent developments have seen the replacement of gaseous precursors by solid ones—initially implemented as the (non-pyrolytic) laser-driven thermal reduction of graphite oxide [36]—culminating in the laser pyrolysis of polymeric substrates, i.e., the laser-induced graphene (LIG) method [37,38,39]. The latter employs low-cost industrial CO2 laser engravers for pyrolyzing commercial polymeric precursors into graphenic foams with 3D porous networks. The LIG technology paves the way for streamlining fuel cell manufacturing exclusively by laser methods, due to the possibility to tailor the LIG characteristics according to the requirements of the MPL. It involves accessible precursors and affordable hardware in a facile, rapid, and cost-efficient manufacturing process that can be readily scaled-up for industrial production [34]. However, the LIG technology applied is still young, and has been tested in the last years just at laboratory level in a few research centers around the globe. Thus, this technology can find a path to move from the lab to the commercial market only after precisely evaluating the overall production cost and competitiveness against other well-established technologies.
In that seminal implementation of LIG as an FC component material, we employed a polyimide film supported on a copper backing layer to generate a uniform and mechanically robust graphenic foam; its surface was patterned by laser processing to convey hydrophobic properties. The film was then transferred onto an activated perfluorinated sulfonic acid (PFSA) membrane by low-temperature decal transfer, to assemble a MEA comprised of twin LIG-based MPLs supported on carbon paper GDLs. The performance of the LIG-based prototype was gauged against a PEM FC unit bearing commercial carbon black (CB) MPLs (all other components being the same) over a wide range of operating conditions and displayed exemplarily higher performance scores [34].
In this work, we take a closer look at the performance of the LIG-based FC prototype, again in direct comparison to the CB-based model, with the following main contributions:
-
The exergy analysis is employed to gain insight on the thermodynamical factors that drive the notable contrast in performance between the two models. Exergy analysis has been introduced as a remedy to limitations inherent in the classical energy efficiency analysis, which does not identify the generating factors of thermodynamical losses within systems nor quantify deviations from ideality. Within the analytical framework of exergy, thermodynamical imperfections are quantified in the concept of exergy destructions, representing losses in energy quality or usability. Shifting the focal point from the 1st to the 2nd Law of Thermodynamics, exergetic analysis monitors the thermodynamic irreversibility in FC energy conversion processes (i.e., from chemical to electrical) and tracks all associated losses, which are proportional to the production of enthalpy.
-
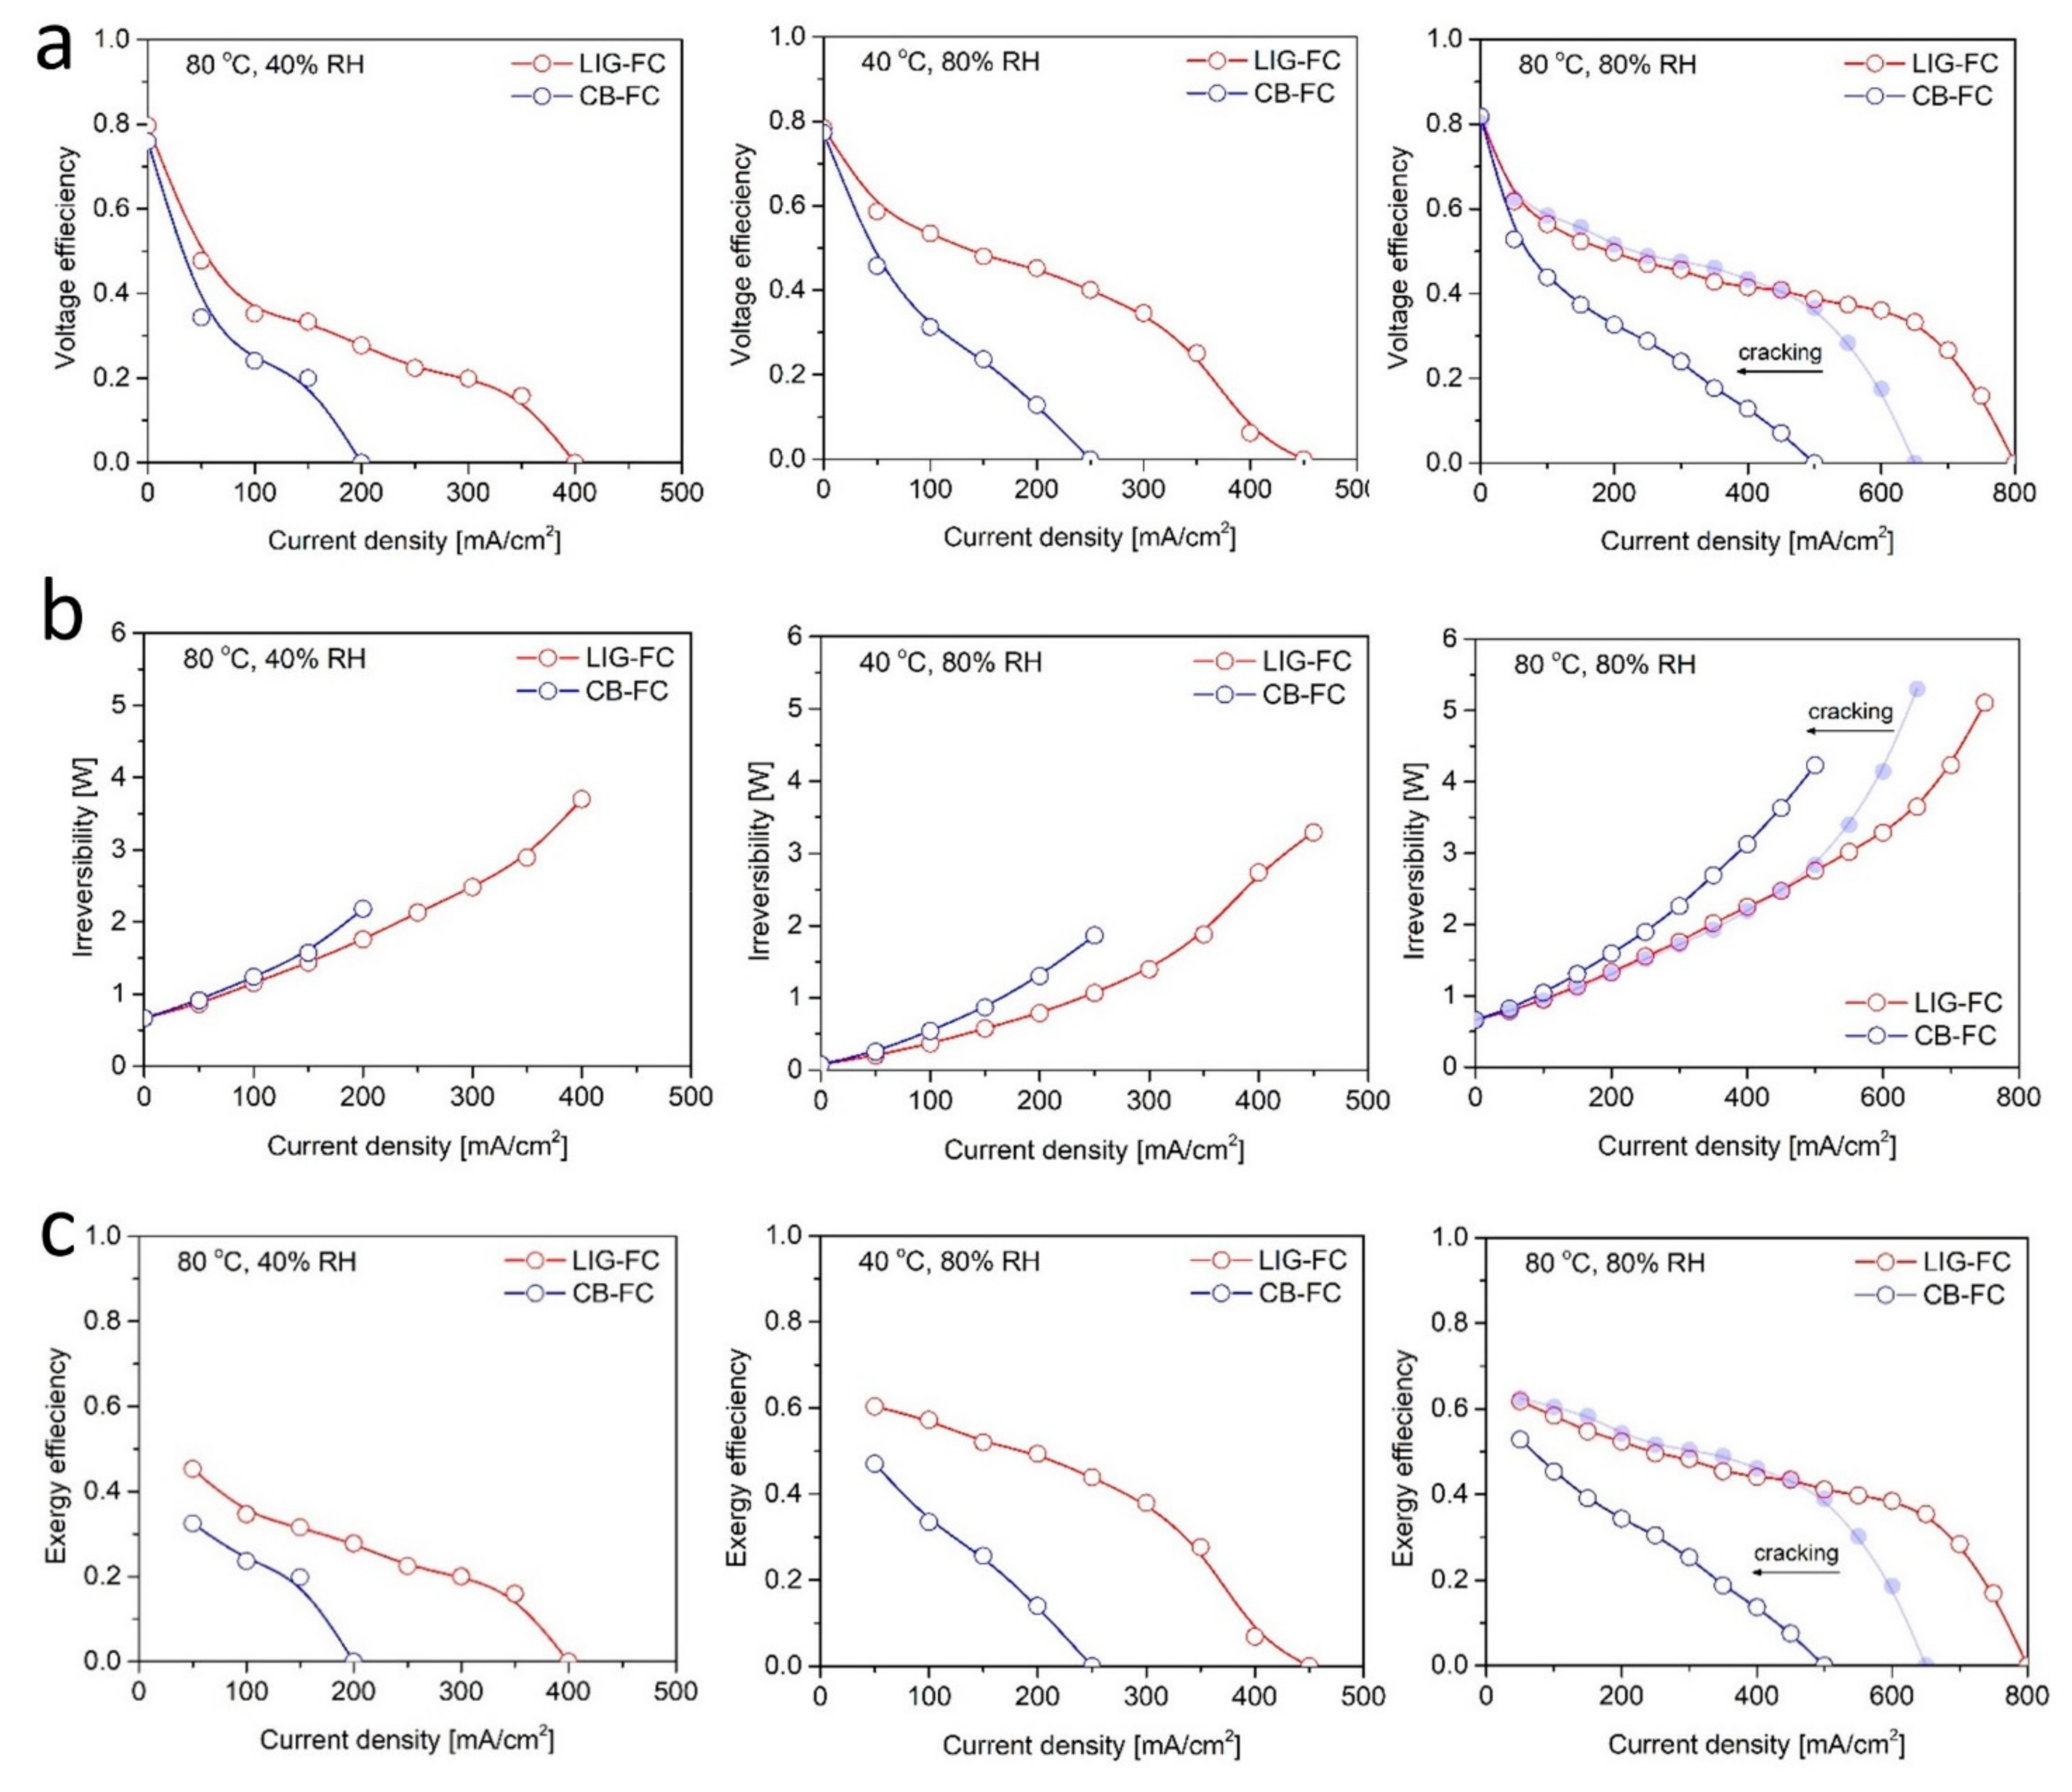
The exergetic analytical tools are reinforced by voltage efficiency monitoring as a direct metric of FC efficiency, which registers the correspondence between measured voltage and theoretical OCV and provides a strong indicator of the degree of reversibility in FC energy conversion processes by comparing the actual work against the maximum work potential [40,41,42,43,44].
-
The flow rate of water used to humidify the inlet gas streams was considered here for the general exergy balance of the fuel cell system. The effect of relative humidity on the standard chemical exergy values of the gas mixture species during an exergy study of a PEMFC was reported here for the first time.
For continuity and brevity, exergetic analysis is performed on the original LIG-FC used in our past work, which may be consulted for information on all other analyses not presented here (i.e., material and electrochemical characterization) [32]. For more information on exergy and its associated theoretical background, the reader is kindly directed to the corresponding Appendices at the end of the article.

2. Materials and Methods

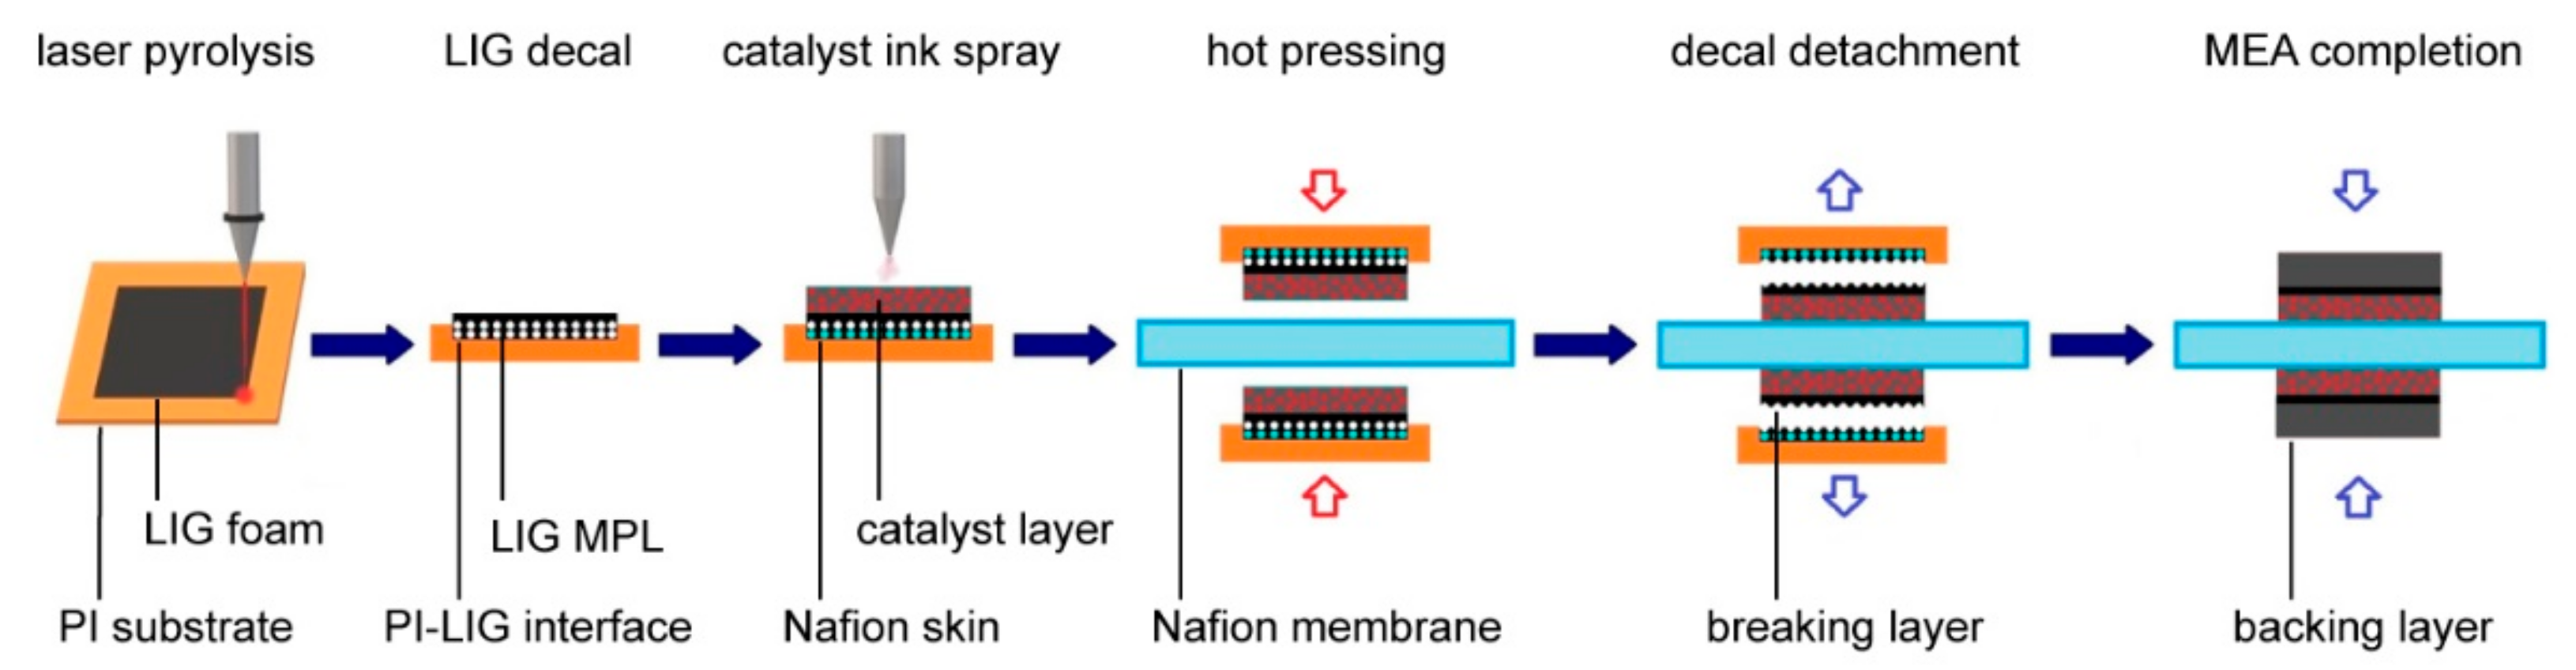
2.1. Overview of Laser Pyrolysis and Fuel Cell Assembly Procedures

The process for preparing the graphene-based microporous layer (MPL) employed a Kapton® film (127 μm thickness) laminated on copper foil (Pyralux® LF9150R, DuPont™, Wilmington, DE, USA, 13 μm thickness) as a substrate, to secure minimal deformation at the high temperatures of laser pyrolysis [39]. Kapton corresponds to the polyimide (PI) precursor PMDA-ODA, (C22H10N2O5)n, poly(4-4′-oxydiphenylene-pyromellitimide) [38,39]. In brief, laser pyrolysis according to the LIG method refers to the photothermal conversion of sp3 carbon atoms of a polymeric precursor to sp2 carbons by pulsed CO2 laser irradiation, resulting in the rapid growth of an interconnected graphene-based foam layer over the substrate [37,38,39]. Pyrolysis was performed on a SLG-3020 laser engraving CNC system (Jinan Artsign Co. Ltd., Jinan, Shandong, China), equipped with a 40 W IR laser source producing a 10.6 μm wavelength laser with 14 μs pulse duration and 200 μm spot diameter. Operating parameters (laser fluence of 2.15 J mm−2, line spacing of 50 μm) were selected to induce hydrophobic properties by surface patterning [38]. This eliminated the requirement of impregnation with a hydrophobic binder, since the LIG layer retains its mechanical robustness when attached to a substrate. Finally, a catalyst ink based on the commercial HiSPEC™ 9100 catalyst (JMFC, Alfa Aesar™, Thermo Fisher Scientific, Kandel, Germany) was uniformly spray-coated on the LIG MPL and then dried, to produce a catalytic layer (CL) with fixed platinum loadings of 0.3 mg cm−2 at the anode and 0.6 mg cm−2 at the cathode.
The membrane-electrode assembly (MEA) for the LIG FC prototype was realized by a low temperature decal transfer process, where twin LIG-based (with Pt catalyst loadings corresponding to the anodic and cathodic components) were sandwiched against a PFSA (perfluorinated sulfonic acid) membrane (Nafion® 1110, H+ form, Chemours|DuPont™, FuelCellStore, College Station, TX, USA), and hot-pressed in a hydraulic lamination press at 133 °C and 0.8 kN cm−2 for 15 min. The copper claddings served as sacrificial layers and were detached after hot-pressing; carbon paper (Toray TGP-H-120, Teflon-treated carbon fiber, 370 μm thickness, Fuel Cell Earth, Woburn, MA, USA) backing layers were mechanically attached by clamping to complete the assembly, bearing LIG MPLs at ~0.8 mg cm−2 [34]. The overall process is depicted in schematic form in Figure 1.
The MPL based on carbon black (CB) used for comparison was composed of 90wt.% commercial plasma-pyrolyzed carbon black (PL-CB13, 550 m2 g−1, 13 nm average particle size, PlasmaChem GmbH, Berlin, Germany) and 10 wt.% PTFE (Teflon PTFE DISP 30, Chemours|DuPont™, FuelCellStore, College Station, TX, USA), corresponding to the minimum PTFE loading needed to balance power performance and water flow management [21,45]. The carbon black and PTFE resin were dispersed in isopropanol and uniformly spray-coated on the carbon paper backing layer, then dried at the low temperature of 75 °C for 24 h. Solvent evaporation was followed by catalyst ink spraying as in the LIG procedure, for creating MPLs and CLs with the same catalytic content for anodic and cathodic components. Finally, hot-pressing against the activated PFSA membrane at 133 °C and 0.8 kN cm−2 pressure for 15 min was applied to complete the CB-based MEA [21].

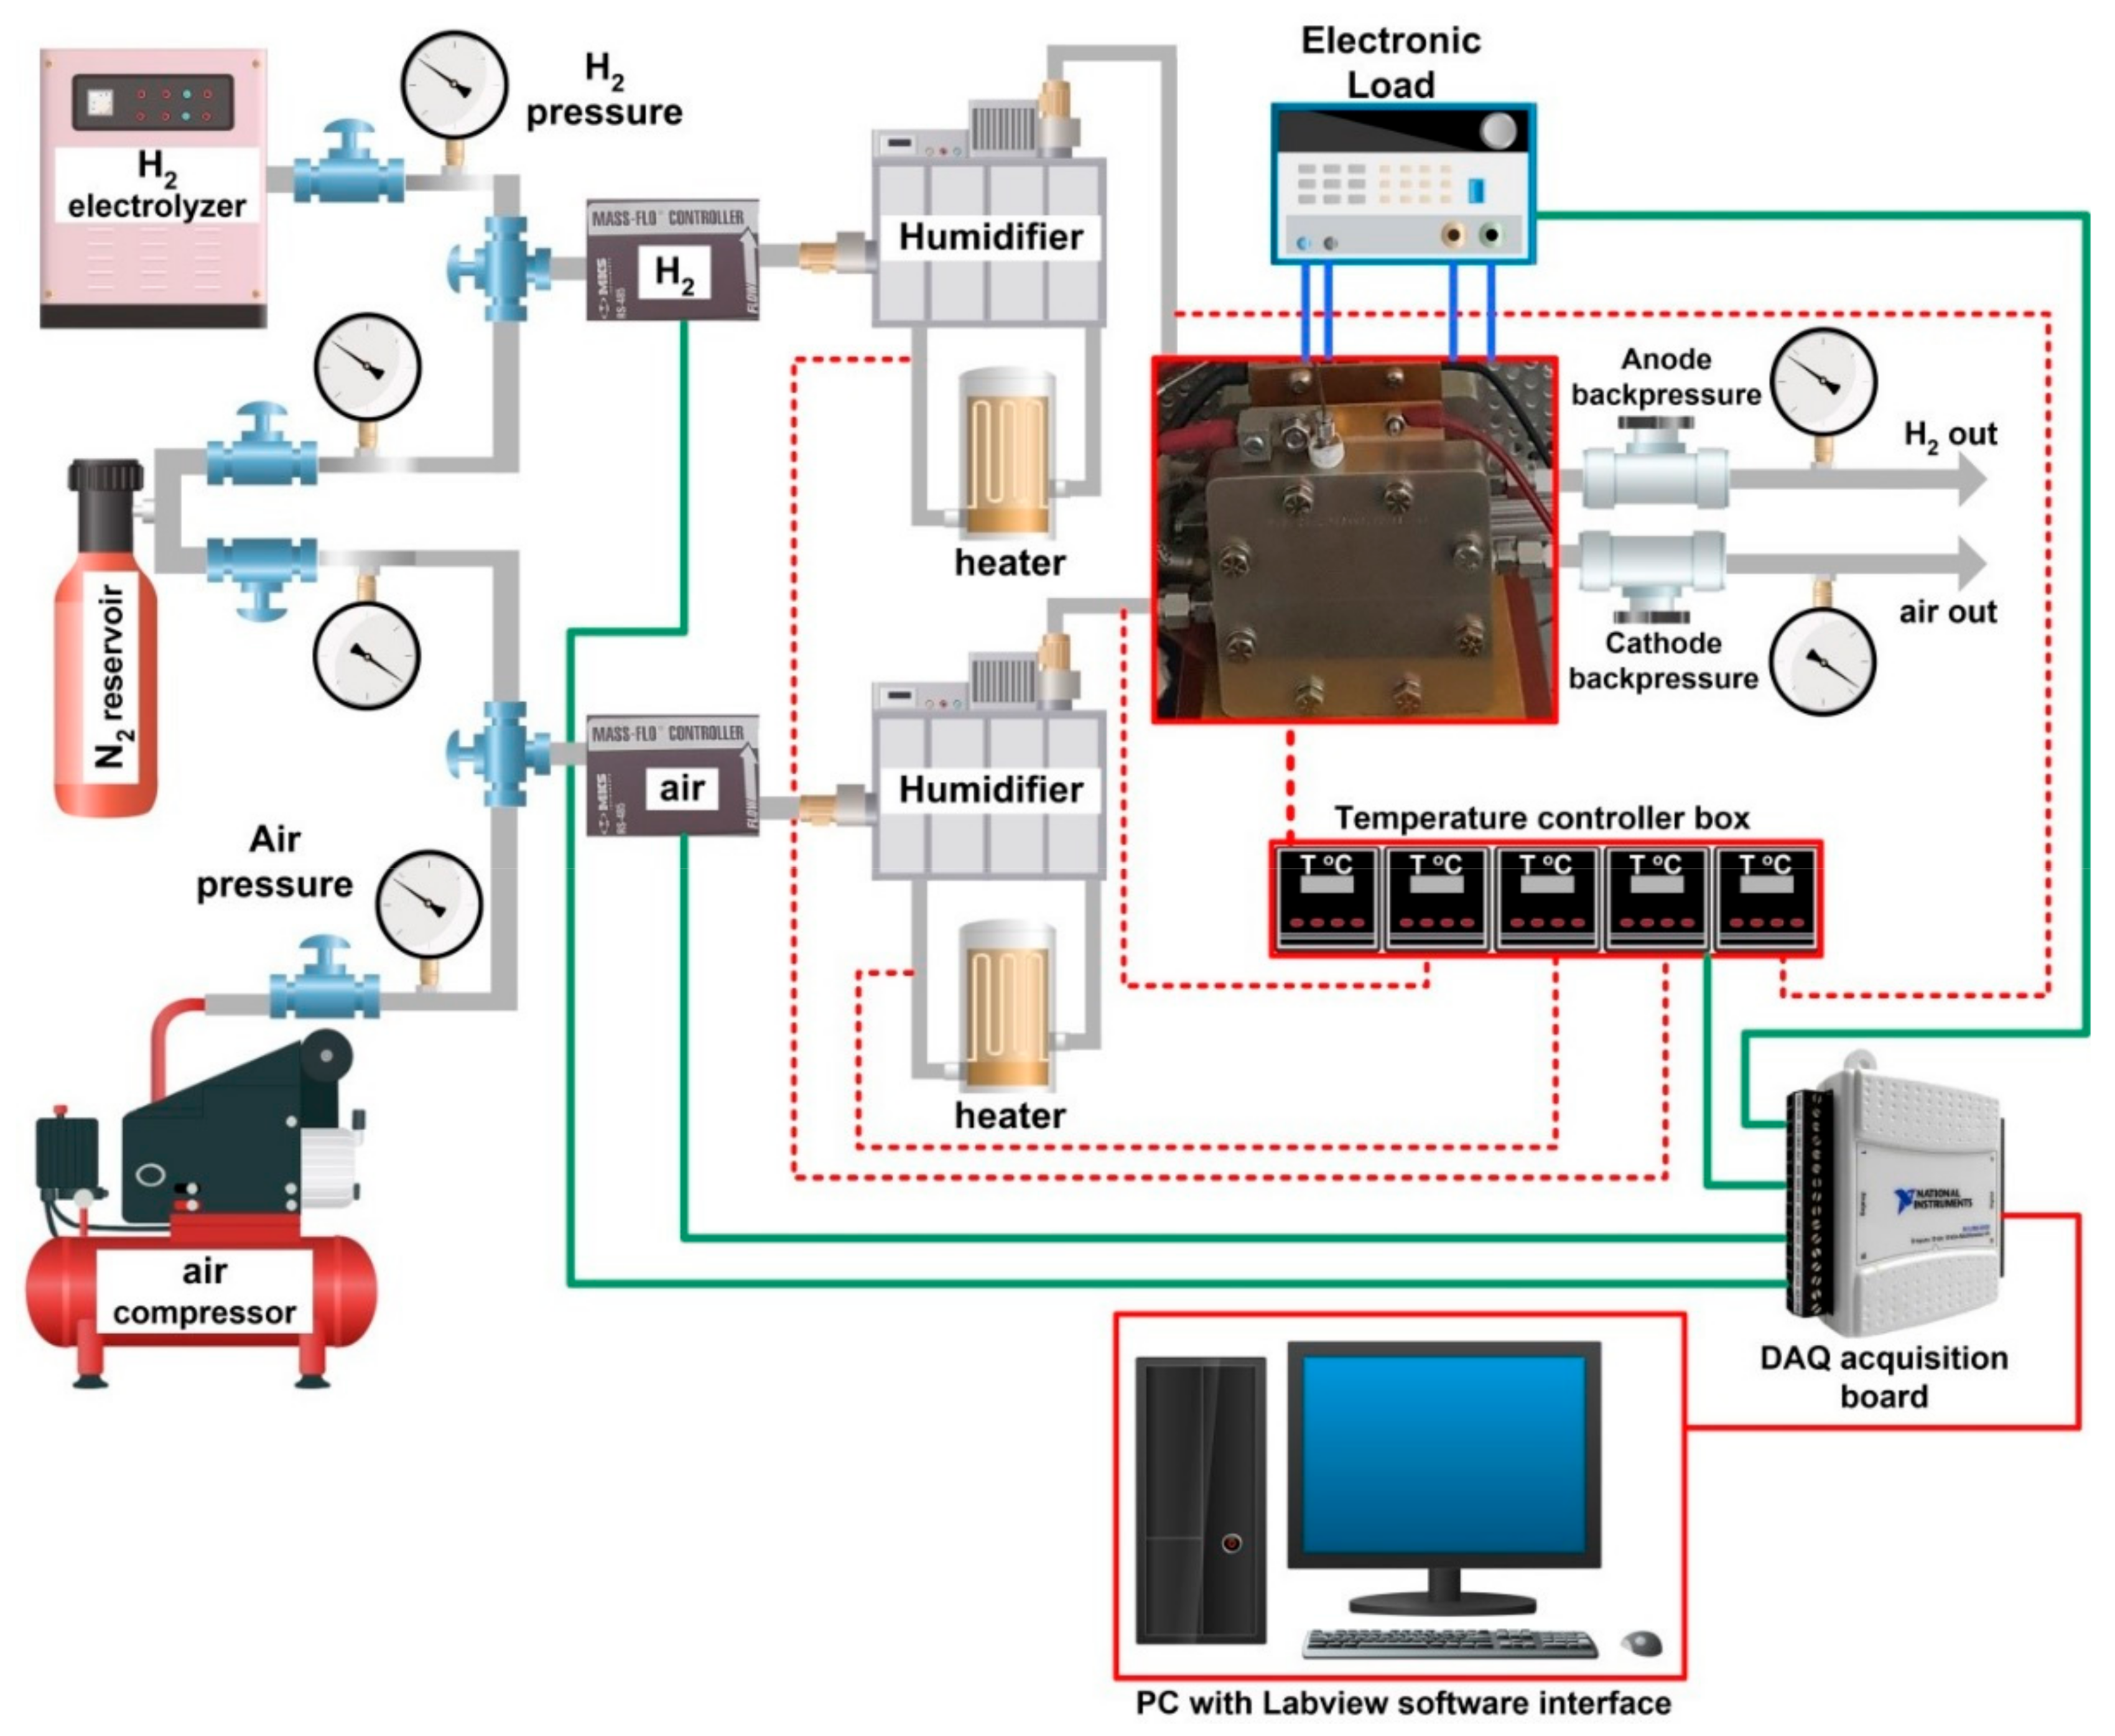
2.2. Instrumentation and Experimental Measurement Protocols

Experimental tests for the FC MEAs (bearing the LIG and the CB MPLs, respectively) were performed on a BekkTech BT-552 PEMFC testing station. All MEAs were tethered on bipolar plates bearing single serpentine channels. The testing station is comprised of the following primary systems: an Agilent 6060B 300 W DC electronic load, twin HPS® Series 937A mass flow controllers with RS-485 communication modules (MKS Instruments Inc., Andover, MA, USA), inlet and outlet pressure manometers (H2, N2 and air flows), twin heated and insulated gas lines, temperature controllers, and twin back pressure regulators. System purging before activation is performed with the nitrogen supply circuit, used to render inert possible flammable gas mixtures inside the ducts. Hydrogen used as the anodic flux was produced by electrolysis of distilled water using a PGH2-500 Plus electrolyzer (LNI Smidlin AG, Neuheim, Switzerland), which allows for producing 99.99% pure gas. An air compressor was used on the cathode side of the system. Reactant gases were humidified by the humidification subsystem based on dual temperature controllers, including output gas line heaters and on/off bypass valves. Relative humidity was controlled by adjusting the dew point temperature on the inlet flow. The overall cell temperature was measured by thermocouples installed within the end plates, which were in contact with control heaters—all connected to a central temperature control system. A control and data acquisition system built on LabVIEW (National Instruments) was used for interfacing, i.e., monitoring and control of all experimental parameters: temperature, flow rates, relative humidity of supplied gases, stoichiometry, cell voltage, and current load. The Piping and Instrumentation Diagram (P&ID) of the experimental set-up is outlined in Figure 2.
For all measurements, fuel cell performance evaluation was conducted in accordance with the overall guidelines issued by the European Union in 2015 for harmonized protocols for PEMFC MEA testing in single cell configuration for automotive applications [46]. In the final stages of testing, constant incremental current load steps of 50 mA cm−2 were applied, starting with the current density of 50 mA cm−2 until voltage reaches its 0 V limit value; each current step was maintained for a duration of 10 min for the cell to reach steady state.
Fuel cell performance testing for both LIG-based and CB-based MEAs was conducted at two temperature (T) levels of the fuel cell and two relative humidity (RH) levels of the inlet gas mixtures. The following combinations of parameters T and RH were applied: 80 °C at 40%, 40 °C at 80%, and 80 °C at 80%.
Preliminary measurements were performed during a cycle of three days for each MEA assembly type, maintaining the above-mentioned T/RH testing order. This particular procedure was considered here to investigate the evolution of PEM fuel efficiency under the normal wear and ageing of MEAs, in similar conditions as we can find in a natural automotive PEMFC system. Furthermore, due to a specific surface morphology of GDL constructed with CB based MPL, another test at 80 °C and 80% RH was considered for a fresh CB-based MEA. This way, it was developed here a comparative study of the fuel cell performance with CB-based MEAs after the preliminary test of three days (ageing CB) and after a single testing day (fresh CB) for optimum T/RH operating conditions.
During fuel cell operation, anodic and cathodic inlet pressures were established at 3.95 atm and 1.97 atm respectively, while outlet pressures (back-pressures) were fixed at 0.69 atm and 0.49 atm respectively. However, for all analytical purposes, the average pressure between inlets and outlets was considered in order to describe the operating pressure of the FCs [3]. H2, O2, and H2O partial pressures, which are dependent on the saturation pressure of water vapor, have been calculated according to a procedure described in detail elsewhere [14].

2.3. Physicomathematical Model for Fuel Cell Preformance Analysis

2.3.1. Voltage Efficiency Analysis

The 2nd law efficiency, a.k.a. voltage efficiency, was used to evaluate the efficiency of FCs as energy conversion devices by comparing the actual work to the maximum work potential [40]. The voltage efficiency η V = V / E corresponds to the ratio between the actual cell operating voltage V and the thermodynamic cell voltage E, defined according to the Gibbs free energy and the Nernst equation as [40,47]:
E = E ° R T n F ln H 2 O H 2 O 2 1 / 2
where E [V] stands for the thermodynamic voltage under prevailing conditions, [V] is the thermodynamic voltage under standard conditions, R is the gas constant (8.314 J K−1 mole−1), T [K] is the temperature, n is the number of transferred electrons (2 in this case), F is the Faraday constant (96,485 C mole−1), and the [ ] operator denotes the thermodynamic activity of the reactants and products, which can be approximated by the partial pressure for gases. Thus, E will be evaluated considering the average form of the partial pressures for reactant gases (see Appendix A and Appendix B, Table A1 and Table A2) based on the following calculation:
E = 1.229 0.000486 T 298.15 + 2.303 R T 2 F ln P ¯ H 2 P ¯ O 2 P ¯ H 2 O

2.3.2. Exergy Analysis

Exergy analysis has been based on the following assumptions:
  • All reactant gases behave as ideal gases;
  • Steady, incompressible, laminar flow for all reactant gases;
  • Potential and kinetic exergies can be neglected;
  • Dead state temperature and pressure are 298.15 K and 1 atm, respectively.
The general exergy balance for a thermodynamic system is expressed as [48]:
E ˙ x i n = E ˙ x o u t + I R
where E ˙ x i n and E ˙ x o u t are the inlet and outlet exergy transfers in the system respectively, and IR corresponds to the irreversibility measure of the system. Considering that exergy is transferred by mass, work, and heat in the PEM FC system, the exergy balance can be expanded as follows [48]:
E ˙ x m a s s , i n = E ˙ x m a s s , o u t E ˙ x h e a t + E ˙ x w o r k + I R
If RH remains near ambient conditions, the exergy contribution of the humidification water vapor has a negligible impact on the global exergy balance [48]. However, due to non-ambient humidity and temperature operating conditions in the experimental set-up considered here, the exergetic influence of water vapor in the inlet streams needs to be included in Equation (4), thus modifying the total exergy transfer rates:
E ˙ x m a s s , i n = E ˙ x H 2 , i n + E ˙ x H 2 O , i n a n + E ˙ x a i r , i n + E ˙ x H 2 O , i n c a t = m ˙ × e x H 2 , i n + m ˙ × e x a i r , i n + m ˙ × e x H 2 O , i n E ˙ x m a s s , o u t = E ˙ x H 2 , o u t + E ˙ x a i r , o u t + E ˙ x H 2 O , o u t c a t = m ˙ × e x H 2 , o u t + m ˙ × e x a i r , o u t + m ˙ × e x H 2 O , o u t
where m ˙ [kg s−1] is the mass flow rate, and ex [kJ kg−1] stands for the specific exergy of the denoted species ( × refers to the simple multiplication sign used here for clarity, and not to the cross product operator). The final terms of Equation (5) (denoting the water vapor species) integrate the contributions of both anodic and cathodic water vapor flow rates.
The total exergy balance defined in Equation (4) can be rewritten in terms of thermodynamic irreversibility IR [46]:
I R = 1 T 0 T Q ˙ W ˙ + m ˙ × e x H 2 , i n + m ˙ × e x a i r , i n + m ˙ × e x H 2 O , i n m ˙ × e x H 2 , o u t m ˙ × e x a i r , o u t m ˙ × e x H 2 O , o u t
where Q ˙ and W ˙ denote heat and work transfer rates respectively, and T0 corresponds to the standard temperature (298.15 K).
Finally, the exergetic efficiency ηex is defined as the ratio between the net generated electrical power W and the exergy difference between reactants and products, as defined in Equation (5) above [48,49,50,51]:
η e x = W E ˙ x m a s s , i n E ˙ x m a s s , o u t

3. Results and Discussion

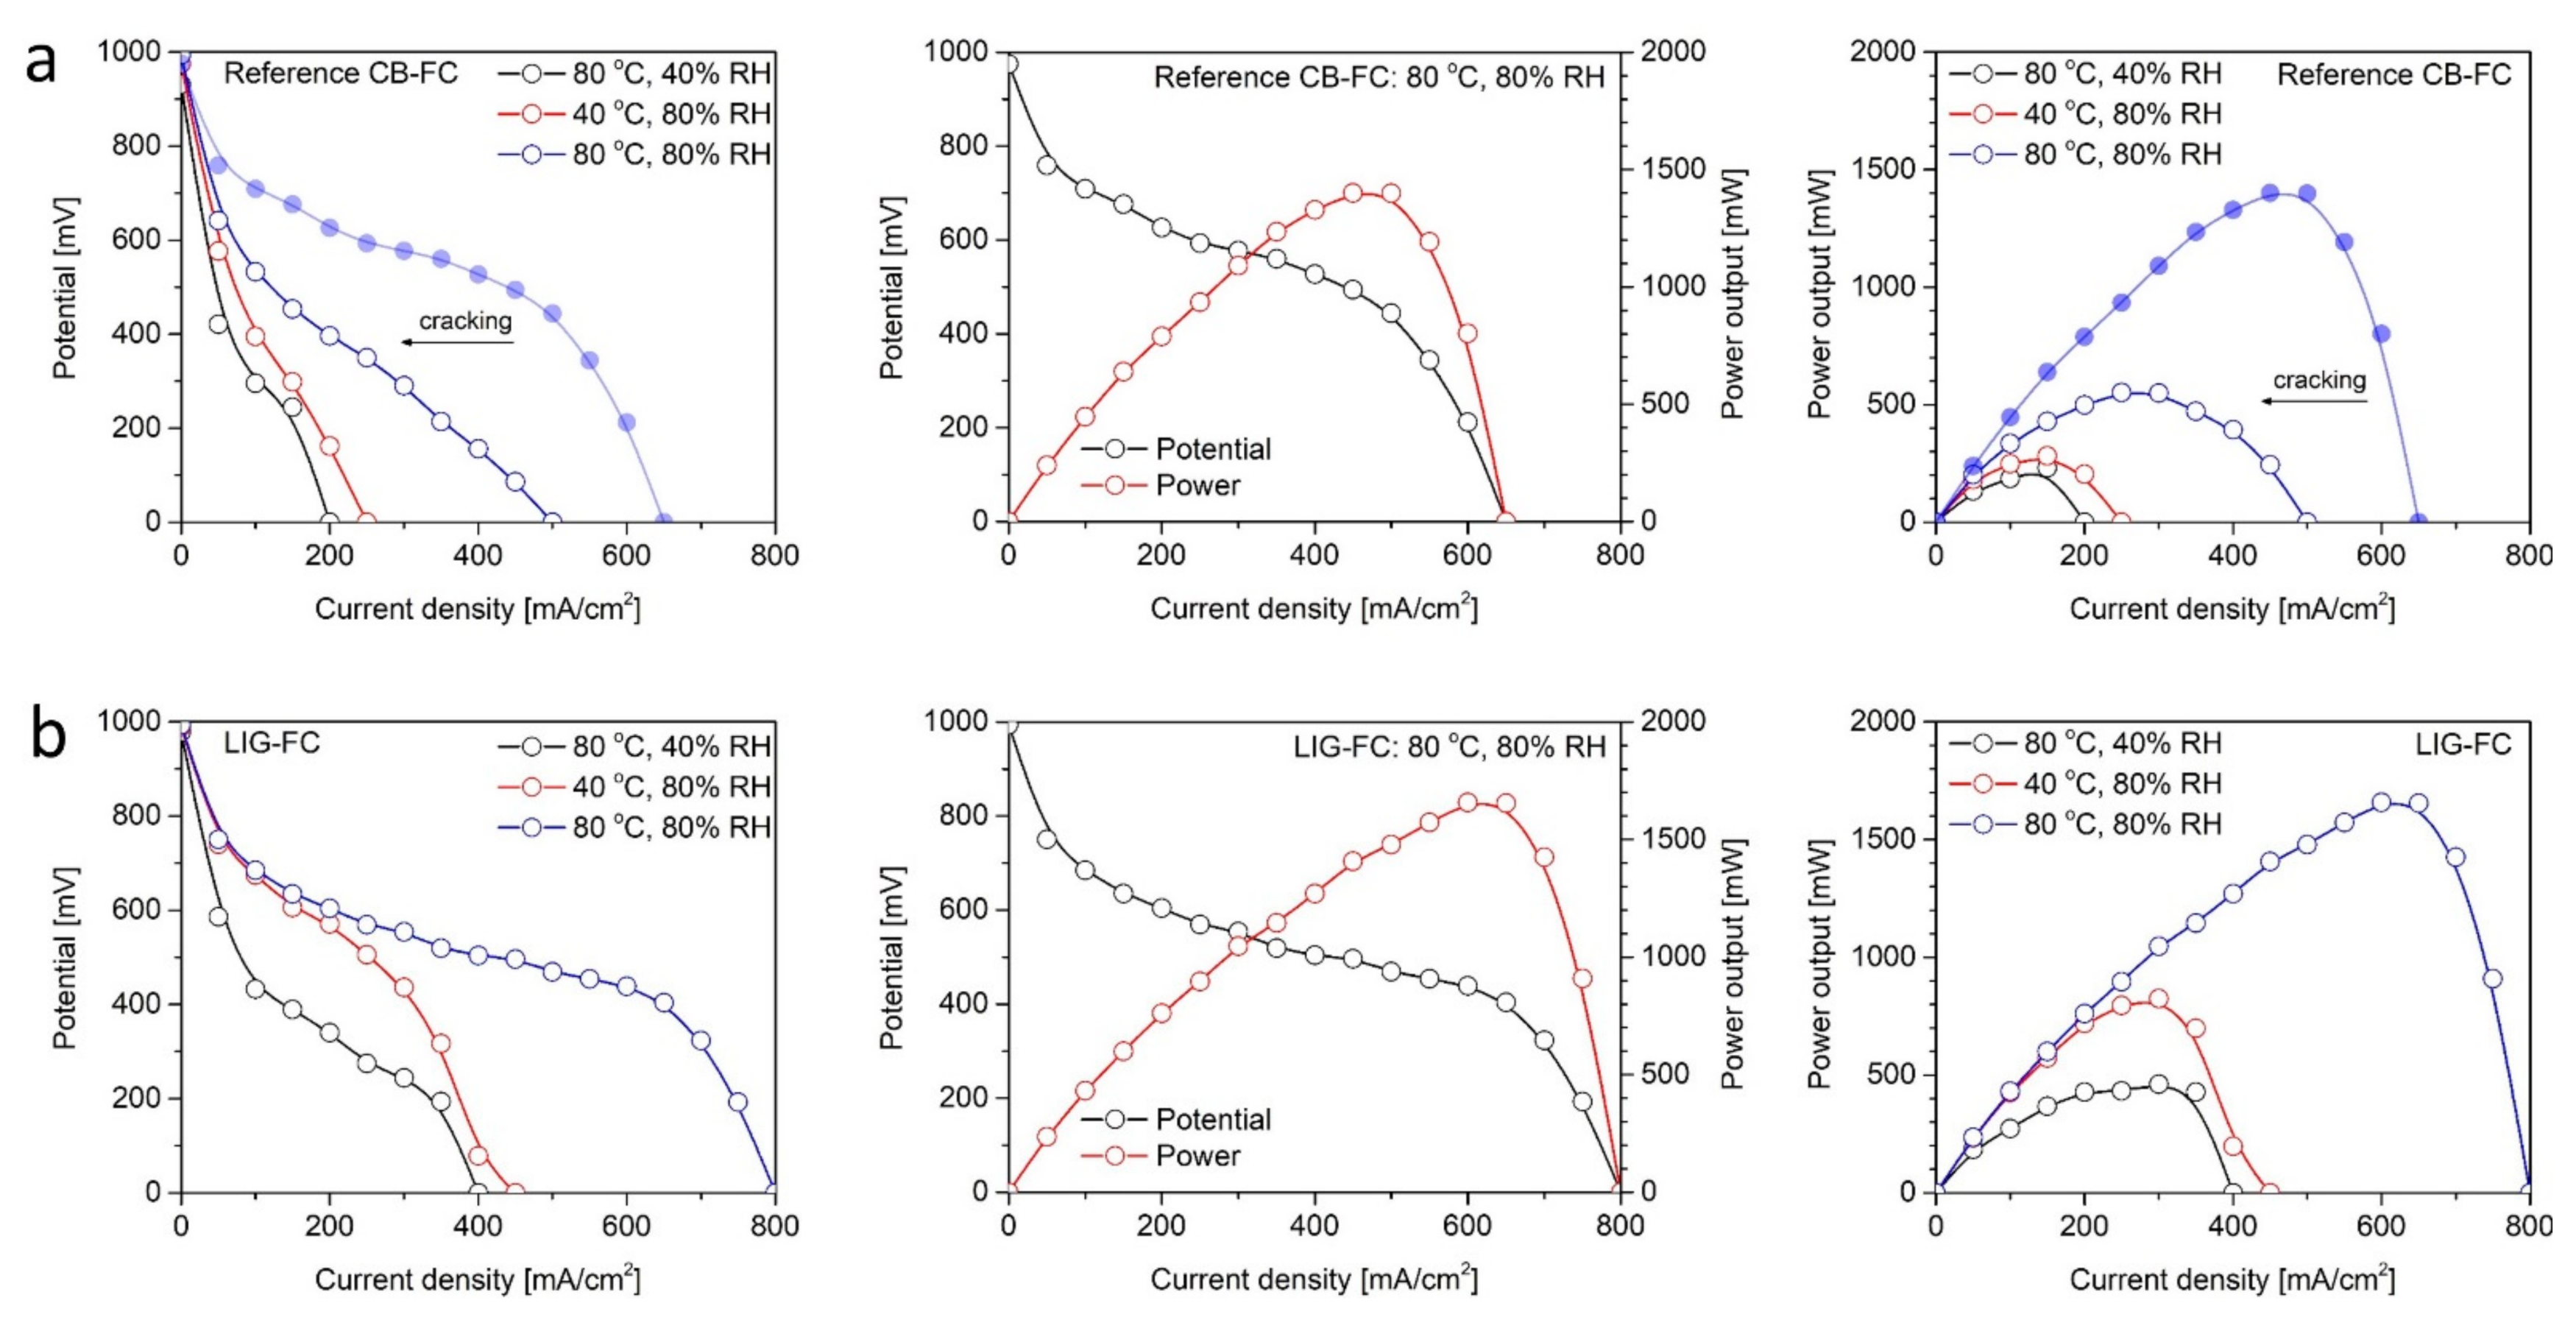
Polarization Profiles and Overall Power Performance

Experimental polarization curves and the net output power variations for the PEM fuel cell with MEAs based on laser-induced graphene MPL (LIG-FC) and carbon black MPL (Reference CB-FC) are presented in Figure 3. As we can see in Figure 3a, in the case of CB based MEA, fuel cell registered a very high activation losses and a quick flooding since the voltage suddenly dropped from 0.25 V to 0 V when the current density was increased from 150 to 200 mA/cm2. This phenomenon (produced at 40 °C and 80% RH) can be associated with a high amount of water, generated very fast at cathode catalyst layer (CCL) reaction sites, which accesses easily into GDL through the CB layer cracks and promotes its occlusion [31]. In contrast, CB MPL seem to conduct to a severe membrane dehydration at low humidity conditions of 40% RH under the fast voltage decreasing across the activation and mass transport regions of the polarization curve (see Figure 3b). An explanation on this behavior can be related again with the cracked surface morphology of GDL constructed with CB based MPL [31,52]. Most probably, for this CB MEA test performed at 80 °C and 40% RH, and also for the test developed at 80 °C and 80% RH (see Figure 3), the membrane failed to maintain a proper hydration level for efficient proton conduction. The reason should be a rapid water removal from the CCL/membrane interface regions through the wide and continuous network of cracks from CB MPL.
In the case of the test developed at 80 °C and 80% RH for the fuel cell employing LIG based MEA, a fast initiation of the electrochemical reactions and a broad ohmic loss region was observed on the polarization curve (see Figure 3b). A potential drop of only 196 mV was registered here across a current load domain between 150 mA/cm2 and 600 mA/cm2.
When the temperature is increased from 40 °C to 80 °C (at the same RH of 80%), the peak power output of the cell has doubled its value for both types of MEAs. After an RH increasing from 40% RH to 80% RH (at TFC = 80 °C), LIG-FC presented a peak power output 3.6 times higher. Instead, Reference CB-FC showed a peak net power only 2.4 times higher for the same operating conditions (see Figure 3a).
The difference between the theoretical open circuit voltage (OCV), E, calculated with Equation (2) and experimental OCV, U exp O C V , is considered to be caused by two different drops in potential [53,54,55]. A first voltage drop, Δ U P t O 2 O C V , is associated with the Pt─O2 reaction mechanism at the cathode electrode in an oxygen saturated acidic solution. When a PEM fuel cell starts from 0 V to OCV, an increase from 0% to 70% of the platinum surface fraction covered by PtO will be registered [54]. The second potential drop, Δ U H 2 x o v e r O C V , is caused by H2 crossover from the anode to cathode, where it reacts with O2 and decreases the concentration of oxygen at the catalyst layer surface.
Experimental OCV and total OCV drop values registered in our study are presented in Table 1. A semi-empirical OCV model derived by Z. Hu et al. [54] correlated directly Δ U H 2 x o v e r O C V and Δ U P t O 2 O C V with the electrochemically active surface area of Pt catalyst ECSA (m2/g) in such a way that an ECSA increasing will produce a decreasing of the two above mentioned voltage drops. The cyclic voltammetry investigations performed on the LIG-based MEA and CB-based MEA with results reported in a previous work [34] revealed an 18% and 25% increasing of the ECSA values for Test 1 and Test 3 operating conditions of the fuel cell containing LIG MEA. Those ECSA results confirmed this way the differences between Δ U O C V values for the two MEA types presented in Table 1. The highest Δ U O C V variation registered here for Test 2 can be associated with a much higher H2 crossover flux (three times higher) measured for Reference CB- FC at 80 °C and 40% RH [34], by comparing with the corresponding values registered for LIG-FC. This enhanced H2 crossover flux is directly reflected in a higher Δ U H 2 x o v e r O C V component of the total OCV drop.
The voltage efficiency analysis results of the fuel cell are presented in Figure 4 for both types of MEA at the specific testing conditions. At optimum operating conditions of 80 °C and 80% RH for LIG-FC, between 51.3% and 42.5% of the available energy was converted into electricity when the current density varied in the range 150–400 mA/cm2 (see Figure 4b). As we can also observe in Figure 4a, in the same current load domain, the voltage efficiency of the Reference CB-FC was between 28.6% and 69% lower than for LIG-FC.
This voltage efficiency investigation can offer some useful information regarding the efficiency of the fuel cell as an electrical generator, converting directly the chemical energy of a fuel into electrical energy. Still, this type of electrical efficiency is only accounting for just one fundamental process in which the exergy losses can occur, related with the main voltage losses inside the current-voltage curve of the cell: activation, ohmic and concentration (mass transport) losses. Four other processes were distinguished, with similar effect on the exergy losses in the PEM fuel cell system: heat transfer, friction, mixing and chemical reactions [34].
A true measure of a PEM fuel cell electrical performance can be obtained only through the ratio between the electrical output and maximum possible work output in the form of exergy analysis [49], dealing with both quality and quantity of energy. The exergy consumption is quantified through the thermodynamic irreversibility losses, evaluated in this study along with exergy efficiency for the PEM fuel cell unit containing LIG and CB based MEA, as we can see in Figure 5.
The main source of the differences between IR and η e x e r g y values registered for LIG and CB based MEAs under similar TFC and RH testing conditions was due to the different cell power output, WFC, values (see Figure 3).
At first, it was considered a comparative study between the IR and η e x e r g y values registered under Test 3 for the fuel cell with CB MEA and LIG MEA (see Figure 5). Irreversibility IR percentage decreased from 4% to 32% and the exergy efficiency η e x e r g y was enhanced from 9% to 36% at current densities between 50 mA/cm2 and 450 mA/cm2 in the case of the LIG based MEA test (see Figure 5b,c).
Under the direct effect of the voltage losses due to oxygen mass transfer at the reaction sites, a rapid exponential increase/decrease of the IR/ η e x e r g y values could be observed in Figure 5 for the LIG-based MEA fuel cell at current densities over 300 mA/cm2 and 600 mA/cm2, respectively. For those current domains, the O2 reaches electrochemical reaction sites more slowly, and in consequence the liquid water was removed more slowly from the catalyst area, generating this way higher concentration overpotential.
After comparing the fresh CB and ageing CB test results at 80 °C—80%RH, we could observe in Figure 5 that voltage efficiency decreased from 0.43 to 0.13, irreversibility increased from 2.19 W to 3.12 W and exergy efficiency decreased from 0.46 to 0.14 at a current density value of 400 mA/cm2.
After comparing IR values between Test 2 and Test 3 for LIG based MEA (see Figure 5b,c), registered at different RH, we could observe during Test 3 a percentage decreasing of IR from 10% to 43% at current densities between 50 mA/cm2 and 350 mA/cm2. For the same comparative study, exergy efficiency increased with values between 9% and 27% (see Figure 5). This η e x e r g y improvement is associated with a lower difference between the total exergies of reactants and products. A main secondary source of the IR reduction is considered to be the decreasing with about 6% of the difference between the total hydrogen exergies at inlet and outlet E ˙ x H 2 , i n E ˙ x H 2 , o u t under the different standard chemical exergy values for H2 at 40% RH and 80% RH (see Table A3 in Appendix B).
The difference between the IR values registered during Test 1 and Test 3 for LIG based MEA (see Figure 5) at current densities between 0 and 350 mA/cm2 was mainly correlated with the difference between the total heat generated during cell operation Q ˙ F C . An increasing with 3.1 W for the Q ˙ F C during Test 3 generated here an IR increasing with values between 0.59 W and 0.14 W. At higher IR values of 400 mA/cm2 and 450 mA/cm2, irreversibility started to decrease during Test 3 with 0.49 W and 0.82 W, respectively. The much higher WFC values registered here (comparing with Test 1) will compensate this Q ˙ F C increasing, according to Equation (6).

4. Conclusions

At optimum operating conditions of 80 °C and 80% RH, PEM fuel cell with LIG based MPL presented the highest OCV value of 0.993 V, voltage efficiency between 61.8% and 42.5%, exergy efficiency between 61.8% and 44.1% and irreversibility losses between 0.78 W and 2.25 W while the current density changed from 50 to 400 mA/cm2.
Even after two-day testing in harsh conditions (at low humidity of 40% RH and low temperature of 40 °C), on the third day of the measurements (at 80 °C and 80% RH), the LIG based FC entered more slowly in the mass concentration loss region than the fresh CB based FC after one only one day of testing. We associated this behavior with a higher hydration level of the LIG based PEM membrane.
The polarization curve results revealed a good electrical stability of the PEMFC with LIG MPL at 80 °C and 40% RH across a current load domain from 100 to 350 mA/cm2 (ohmic loss region). Here, the exergy efficiency was lower with values from 10.7% to 2.8% than in the case of the fuel cell test performed at 80oC and 80% RH with CB based MPL. This efficiency behavior after LIG based MPL test was obtained under much reduced irreversibility losses, with values between 0.14 W and 1.76 W in the above-mentioned current load region.
Very promising exergy efficiency values, between 60.3% and 37.9%, were registered during LIG based MPL investigation performed at 40 °C and 80%RH at current densities between 50 and 300 mA/cm2. Instead, the fuel cell test developed at 80 °C and 80%RH for CB based MPL MEA indicated a reduced exergy efficiency, from 7.5% to 12.6%, under increased irreversibility losses values between 0.62 W and 0.86 W.

Author Contributions

Conceptualization, V.I. and A.E.B.; methodology, V.I., A.M.I.T. and A.E.B.; software, V.I. and A.E.B.; validation, I.S.; formal analysis, V.I.; investigation, V.I., A.M.I.T. and A.E.B.; resources, V.I., I.S. and A.E.B.; data curation, V.I. and A.E.B.; writing—original draft preparation, V.I.; writing—review and editing, A.E.B.; visualization, V.I.; supervision, A.E.B.; project administration, A.E.B. and I.S.; funding acquisition, A.E.B. and I.S. All authors have read and agreed to the published version of the manuscript.

Funding

This research was funded by the Romanian Ministry of Research, Innovation and Digitization, CNCS/CCCDI–UEFISCDI, project no. TE 205/2021 within PNCDI III (A.E.B.); and project PN-III-P1-1.1-PD-2019-0684 with contract no. PD106/2020 (A.M.I.T.).

Institutional Review Board Statement

Not applicable.

Informed Consent Statement

Not applicable.

Data Availability Statement

The data presented in this study are available on request from the corresponding authors.

Acknowledgments

The authors would like to thank Athanasios Tiliakos of the National R&D Institute for Laser, Plasma and Radiation Physics (INFLPR) and the National R&D Institute for Cryogenic and Isotopic Technologies (ICSI) for his suggestions regarding the LIG FC prototype. The concept and manufacturing process of the LIG FC have been registered at the Romanian State Office for Inventions and Trademarks according to the A/00853/03.12.2019 patent application: A. Tiliakos, F. Dumitrache: “Fuel cells based on nanostructured graphenic films with controllable properties produced by laser pyrolysis, and procedure for scaled-up industrial manufacturing”, licensed to the National R&D Institute for Laser, Plasma and Radiation Physics (INFLPR).

Conflicts of Interest

The authors declare no conflict of interest.

Appendix A

Theoretical background of the voltage efficiency analysis and thermodynamics of gas mixtures are extensively presented in Appendix A.
Voltage efficiency analysis A simple and accurate formula was used for the evaluation of this saturation vapor pressure, which varies with the temperature of the gas mixture inside the cell (T = TFC) [56]:
P H 2 O 0 ( T ) = exp 34.494 4924.99 T + 237.1 ( T + 105 ) 1.57 , T > 0   ° C
The partial pressure results are presented in Table A1. Here, the water vapor partial pressure is P ¯ H 2 O = R H P H 2 O 0 ( T ) . The average pressures at anode and cathode and anode were PA = 2.32 atm and PC = 1.23 atm.
Table A1. Anodic and cathodic partial pressures of the reactant gasses in the fuel cell.
Experiment P ¯ H 2   ( atm ) P ¯ O 2   ( atm ) P ¯ H 2 O   ( atm )
Test 12.260.2460.058
Test 22.130.2190.187
Test 31.940.1790.374
Thermodynamic voltage (theoretical open-circuit voltage) for a H2 and air PEM fuel cell, can be derived starting from the general equation [57]:
U t h e o r O C V = E O 2 / H 2 O 0 E H 2 / H + 0 + 2.303 R T 2 F log P H 2 P O 2 1 / 2 P H 2 O
where R is the universal gas constant (8.3145 J/molK), F is the Faradays constant (96,485 C/mol) and is the electrode potential of the H2/H+ redox couple, equal to zero under standard conditions (1 atm, 25 °C). The electrode potential of the O2/H2O redox couple, E O 2 / H 2 O 0 , has been reported as dependent of the temperature through the relation [57]:
E O 2 / H 2 O 0 = 1.229 0.000486 T 298.15
Thermodynamics of gas mixtures. Humid air from the cathode is a mixture of dry air and water vapor, so the average dry air partial pressure is P ¯ C , a i r = P ¯ C P ¯ H 2 O . The humid air ratio will be defined here as the ratio between moisture mass flow and dry air mass flow at standard environmental conditions (P0 = 1 atm, T0 = 25 °C) [58,59]:
ω = M v M a P ¯ H 2 O P ¯ C , a i r = 0.622 P ¯ H 2 O P ¯ C P ¯ H 2 O
Considering the dry air molar mass Ma = 28.85 Kg/Kmol and water vapor molar mass Mv = 18 Kg/Kmol.
In the case of pure H2 humidified flux at anode, the humidity ratio will be expressed as [59]:
ω = 9 P ¯ H 2 O P ¯ A P ¯ H 2 O
Dry air and hydrogen flows are humidified before entering the cell by injecting water into the inlet streams inside the humidifier system. During experimental tests, fixed mass flow rates were settled at anode and cathode inlets: m ˙ a i r , i n = 1.716·10−5 Kg/s and m ˙ H 2 , i n = 2.975·10−7 Kg/s, respectively.
The relation between the dry air flow rate and total mass flow rate of humid air will be [58]:
m ˙ a i r , i n = 1 1 + ω m ˙ c a t , i n
Therefore, the flow rate of water vapor at cathode is [7]:
m ˙ H 2 O , i n c a t = m ˙ c a t , i n m ˙ a i r , i n
The inlet mass flow rate for the anodic water vapor is directly calculated as [59]:
m ˙ H 2 O , i n a n = 9 P ¯ H 2 O P ¯ A P ¯ H 2 O m ˙ H 2 , i n
For a constant molar fraction of dry air, composed by O2 and N2 ( X N 2 d r y = 0.79 and X O 2 d r y = 0.21), local atmospheric molar fraction of gases (other than water) in the humid air is defined as [44]:
X i h = 1 X H 2 O h X i d r y
Molar fraction of the water vapor in the humid air at standard environmental conditions is calculated as [44]:
X H 2 O h = R H P H 2 O 0 P 0
The calculated inlet mass flow rates of water vapor, along with molar fraction of reactant gases in the humid inlet fluxes are presented in Table A2. From this table we could see that the flow rate of water used to humidify the air and hydrogen streams is much smaller than the dry H2 and air flow rates at anode and cathode.
Table A2. Water vapor mass flow rates and molar fraction of reactant gases in the humid inlet fluxes along experimental tests.
Experiment m ˙ H 2 O , i n a n ( Kg / s ) m ˙ H 2 O , i n c a t ( Kg / s ) X H 2 h X N 2 h X O 2 h
Test 12.948·10−82.215·10−70.989220.773940.20573
Test 21.458·10−81.096·10−70.994610.781970.20787
Test 32.948·10−82.215·10−70.989220.773940.20573

Appendix B

Appendix B provides the theoretical background of the exergy efficiency analysis Classical fuel cell equations reported by Larmine and Dicks [60] for the H2 and O2 usage mass flow rates, respectively for the water production at cathode (all expressed in Kg/s) have been considered here:
m ˙ O 2 , u s a g e = 8.29 10 8 I F C
m ˙ H 2 , u s a g e = 1.05 10 8 I F C
m ˙ H 2 O , p r o d u c t = 9.34 10 8 I F C
were IFC (A) is the fuel cell current measured at the external load, being the product between the current density JFC (A/cm2) and the electrochemically active area of the cell AFC = 6.3 cm2.
Therefore, the outlet mass flow rates of H2, air and water are [61]:
m ˙ H 2 , o u t = m ˙ H 2 , i n 1.05 10 8 I F C
m ˙ a i r , o u t = m ˙ a i r , i n 8.29 10 8 I F C
m ˙ H 2 O , o u t = m ˙ H 2 O , i n + 9.34 10 8 I F C
Total exergy transfer by work will be [48]:
E x w o r k = W F C
with WFC = UFC·IFC (W) as the net generated electrical power by the PEMFC unit cell.
Total exergy transfer by heat is expressed as [11]:
E x h e a t = 1 T 0 T F C r H L Q ˙ F C
were rHL = 0.2 represents the heat loss ratio, meaning that 20% from the total heat evacuated from the cell is dissipated through convection and radiation [48].
In Equation (A18), Q ˙ F C is the total heat generated during fuel cell operation. This heat will be lost in the environment due to the air flux circulation through two heat transfer processes: radiation and convection, being defined as [61]:
Q ˙ F C = Q ˙ n c + Q ˙ r a d
The heat loss via natural convection is [15]:
Q ˙ n c = h n c A t o t ( T F C T 0 )
with hnc = 5W/m2K as the natural convective heat transfer coefficient [62] and Atot = 57.8 cm2 as the total heat transfer area of the fuel cell unit.
The heat loss through radiation is [62]:
Q ˙ r a d = ε σ T F C 4 T 0 4
In Equation (A21), ε is the surface emissivity, assumed to be 1 [62] and σ is the Stefan—Boltzmann constant (5.67·10−8 W/m2K4).
The last part of this energetic study was reserved to a detailed analysis of the specific exergy of each component from the anodic and cathodic fluid stream. Total specific exergy of the species involved in the electrochemical reactions can be expressed as the sum of the physical (exPH) and chemical (exCH) exergies [48,61]:
e x = e x P H + e x C H
The physical exergy is the maximum useful work obtained by passing the unit of mass of a substance from the generic state (T, P) to the environmental state (T0, P0) through purely physical processes [63]. Chemical exergy is the maximum amount of useful work that can be achieved when a system is placed at a temperature of T0 and pressure P0 to achieve a chemical equilibrium with the environment [64].
The physical exergies of H2, O2, N2 and water vapor, characterized by constant specific heat Cp and specific heat ratios k were calculated with the following expression [49,61]:
e x P H = C P T 0 T F C T 0 1 ln T F C T 0 + ln P P 0 k 1 k
were CP and k vales for each component of the gas mixtures were taken from the literature [65].
Chemical exergy of the cell input and output species has been evaluated with the following relation [49,66]:
e x C H = X n e n C H + R T 0 X n ln X n
were Xn and e n C H are the mole fraction of a single chemical species n (H2, N2, O2 and H2O) and its specific chemical exergy (kJ/Kmol).
I. Dincer and M.A. Rosen reported that the water vapor has a significant role in the chemical exergy variation of the atmospheric gas species [44]. This deviation from a standard value is generated by the variation of the saturation pressure of water at different relative humidity’s in the moist air. This exergy variation phenomenon was firstly investigated by I. S. Ertesvag at RH between 10% and 100% [67]. Variations of the standard chemical exergy values for H2, N2, O2 and H2O, measured initially at reference conditions of 25 °C, 1 atm and 70% RH have been quantified through relative deviations RD (%) [67]. The chemical exergy values registered for RH = 40% and RH = 80%, along with standard 70% RH values, are presented in Table A3. One can note that the relative humidity affects in a highest degree the chemical exergy of water vapor and nitrogen.
Table A3. Standard chemical exergy values of the gas mixture species at different moisture content [44,67].
Species Standard   Chemical   Exergy   e n C H   ( KJ / mol )
RH = 70%RH = 40%RH = 80%
H2236.098237.467235.649
N23.93053.7903.977
O20.66810.66390.6694
H2O9.47410.7639.050

References

  1. Kocha, S.S. Polymer Electrolyte Membrane (PEM) Fuel Cells: Automotive Applications. In Fuel Cells and Hydrogen Production; Lipman, T., Weber, A., Eds.; Springer: New York, NY, USA, 2019; pp. 135–171. [Google Scholar] [CrossRef]
  2. Pollet, B.G.; Kocha, S.S.; Staffell, I. Current status of automotive fuel cells for sustainable transport. Curr. Opin. Electrochem. 2019, 16, 90–95. [Google Scholar] [CrossRef]
  3. Gómez, J.C.; Serra, M.; Husar, A. Controller design for polymer electrolyte membrane fuel cell systems for automotive applications. Int. J. Hydrog. Energy. 2021, 46, 23263–23278. [Google Scholar] [CrossRef]
  4. Fathabadi, H. Novel fuel cell/battery/supercapacitor hybrid power source for fuel cell hybrid electric vehicles. Energy 2018, 143, 467–477. [Google Scholar] [CrossRef]
  5. Das, H.S.; Tan, C.W.; Yatim, A.H.M. Fuel cell hybrid electric vehicles: A review on power conditioning units and topologies. Renew. Sust. Energ. Rev. 2017, 76, 268–291. [Google Scholar] [CrossRef]
  6. Migliardini, F.; Veneri, O.; Corbo, P. Hydrogen and proton exchange membrane fuel cells for clean road transportation. J. Ind. Eng. Chem. 2011, 17, 633–641. [Google Scholar] [CrossRef]
  7. Wang, Y.; Chen, K.S.; Mishler, J.; Cho, S.C.; Adroher, X.C. A review of polymer electrolyte membrane fuel cells: Technology, applications, and needs on fundamental research. Appl. Energy 2011, 88, 981–1007. [Google Scholar] [CrossRef] [Green Version]
  8. Li, X.J.; Allen, J.D.; Stager, J.A.; Ku, A.Y. Paths to low-cost hydrogen energy at a scale for transportation applications in the USA and China via liquid-hydrogen distribution networks. Clean Energy 2020, 4, 26–47. [Google Scholar] [CrossRef] [Green Version]
  9. Ahluwalia, R.K.; Wang, X.; Peng, J.; Konduru, V.; Arisetty, S.; Ramaswamy, N.; Kumaraguru, S. Achieving 5000-h and 8000-h low-PGM electrode durability on automotive drive cycles. J. Electrochem. Soc. 2021, 168, 044518. [Google Scholar] [CrossRef]
  10. Kitahara, T.; Nakajima, H.; Inamoto, M.; Shinto, K. Triple microporous layer coated gas diffusion layer for performance enhancement of polymer electrolyte fuel cells under both low and high humidity conditions. J. Power Sources 2014, 248, 1256–1263. [Google Scholar] [CrossRef]
  11. Hou, S.; Su, H.; Zou, H.; Dang, D.; Song, H.; Li, X.; Liao, S. Enhanced low-humidity performance in a proton exchange membrane fuel cell by the insertion of microcrystalline cellulose between the gas diffusion layer and the anode catalyst layer. Int. J. Hydrog. Energy 2015, 40, 15613–15621. [Google Scholar] [CrossRef]
  12. Blanco, M.; Wilkinson, D.P.; Wang, H. Application of water barrier layers in a proton exchange membrane fuel cell for improved water management at low humidity conditions. Int. J. Hydrog. Energy 2011, 36, 3635–3648. [Google Scholar] [CrossRef]
  13. Neyerlin, K.C.; Gasteiger, H.A.; Mittelsteadt, C.K.; Jorne, J.; Gu, W. Effect of relative humidity on oxygen reduction kinetics in a PEMFC. J. Electrochem. Soc. 2005, 152, A1073. [Google Scholar] [CrossRef]
  14. Zhang, J.; Song, C.; Zhang, J.; Baker, R.; Zhang, L. Understanding the effects of backpressure on PEM fuel cell reactions and performance. J. Electroanal. Chem. 2013, 688, 130–136. [Google Scholar] [CrossRef]
  15. Zhao, J.; Huang, X.; Chang, H.; Chan, S.H.; Tu, Z. Effects of operating temperature on the carbon corrosion in a Proton Exchange Membrane Fuel Cell under high current density. Energy Convers. Manag. X 2021, 10, 100087. [Google Scholar] [CrossRef]
  16. Dai, W.; Wang, H.; Yuan, X.Z.; Martin, J.J.; Yang, D.; Qiao, J.; Ma, J. A review on water balance in the membrane electrode assembly of proton exchange membrane fuel cells. Int. J. Hydrog. Energy 2009, 34, 9461–9478. [Google Scholar] [CrossRef]
  17. Yousfi-Steiner, N.; Moçotéguy, P.; Candusso, D.; Hissel, D.; Hernandez, A.; Aslanides, A. A review on PEM voltage degradation associated with water management: Impacts, influent factors and characterization. J. Power Sources 2008, 183, 260–274. [Google Scholar] [CrossRef]
  18. Park, J.; Oh, H.; Ha, T.; Lee, Y.I.; Min, K. A review of the gas diffusion layer in proton exchange membrane fuel cells: Durability and degradation. Appl. Energy 2015, 155, 866–880. [Google Scholar] [CrossRef]
  19. Cho, J.; Oh, H.; Park, J.; Min, K.; Lee, E.; Jyoung, J.Y. Effect of the microporous layer design on the dynamic performance of a proton exchange membrane fuel cell. Int. J. Hydrog. Energy 2014, 39, 459–468. [Google Scholar] [CrossRef]
  20. Smirnova, A.; Dong, X.; Hara, H.; Vasiliev, A.; Sammes, N. Novel carbon aerogel-supported catalysts for PEM fuel cell application. Int. J. Hydrog. Energy 2015, 30, 149–158. [Google Scholar] [CrossRef]
  21. Trefilov, A.M.I.; Tiliakos, A.; Serban, E.C.; Ceaus, C.; Iordache, S.M.; Voinea, S.; Balan, A. Carbon xerogel as gas diffusion layer in PEM fuel cells. Int. J. Hydrog. Energy 2017, 42, 10448–10454. [Google Scholar] [CrossRef]
  22. Xie, Z.; Chen, G.; Yu, X.; Hou, M.; Shao, Z.; Hong, S.; Mu, C. Carbon nanotubes grown in situ on carbon paper as a microporous layer for proton exchange membrane fuel cells. Int. J. Hydrog. Energy 2015, 40, 8958–8965. [Google Scholar] [CrossRef]
  23. Liu, J.; Takeshi, D.; Sasaki, K.; Lyth, S.M. Defective graphene foam: A platinum catalyst support for PEMFCs. J. Electrochem. Soc. 2014, 161, 838–844. [Google Scholar] [CrossRef]
  24. Liu, J.; Takeshi, D.; Sasaki, K.; Lyth, S.M. Platinum-decorated nitrogen-doped graphene foam electrocatalysts. Fuel Cells 2014, 14, 728–734. [Google Scholar] [CrossRef]
  25. Marinoiu, A.; Teodorescu, C.; Carcadea, E.; Raceanu, M.; Varlam, M.; Cobzaru, C.; Stefanescu, I. Graphene-based materials used as the catalyst support for PEMFC applications. Mater. Today Proc. 2015, 2, 3797–37805. [Google Scholar] [CrossRef]
  26. Marinoiu, A.; Andrulevicius, M.; Tamuleviciene, A.; Tamulevicius, T.; Raceanu, M.; Varlam, M. Synthesis of well dispersed gold nanoparticles on reduced graphene oxide and application in PEM fuel cells. Appl. Surf. Sci. 2020, 504, 144511. [Google Scholar] [CrossRef]
  27. Marinoiu, A.; Carcadea, E.; Sacca, A.; Carbone, A.; Sisu, C.; Dogaru, A.; Raceanu, M.; Varlam, M. One-step synthesis of graphene supported platinum nanoparticles as electrocatalyst for PEM fuel cells. Int. J. Hydrog. Energy 2021, 46, 12242–12253. [Google Scholar] [CrossRef]
  28. Najafabadi, A.T.; Leeuwner, M.J.; Wilkinson, D.P.; Gyenge, E.L. Electrochemically produced graphene for microporous layers in fuel cells. ChemSusChem 2016, 9, 1689–1697. [Google Scholar] [CrossRef] [PubMed]
  29. Leeuwner, M.J.; Wilkinson, D.P.; Gyenge, E.L. Novel graphene foam microporous layers for PEM fuel cells: Interfacial characteristics and comparative performance. Fuel Cells 2015, 15, 790–801. [Google Scholar] [CrossRef]
  30. Leeuwner, M.J.; Patra, A.; Wilkinson, D.P.; Gyenge, E.L. Graphene and reduced graphene oxide based microporous layers for high performance proton-exchange membrane fuel cells under varied humidity operation. J. Power Sources 2019, 423, 192–202. [Google Scholar] [CrossRef]
  31. Latorrata, S.; Mariani, M.; Stampino, P.G.; Cristiani, C.; Dotelli, G. Graphene-based microporous layers for enhanced performance in PEM fuel cells. Mater. Today Proc. 2020, 31, 426–432. [Google Scholar] [CrossRef]
  32. Joo, Y.; Kim, M.; Kanimozhi, C.; Huang, P.; Wong, B.M.; Roy, S.S.; Arnold, M.S.; Gopalan, P. Effect of Dipolar Molecule Structure on the Mechanism of Graphene- Enhanced Raman Scattering. J. Phys. Chem. C 2016, 120, 13815–13824. [Google Scholar] [CrossRef]
  33. Jiao, K.; Xuan, J.; Du, Q.; Bao, Z.; Xie, B.; Wang, B.; Zhao, Y.; Fan, L.; Wang, H.; Hou, Z.; et al. Designing the next generation of proton-exchange membrane fuel cells. Nature 2021, 595, 361–369. [Google Scholar] [CrossRef]
  34. Tiliakos, A.; Trefilov, A.M.I.; Tanasă, E.; Balan, A.; Stamatin, I. Laser-induced graphene as the microporous layer in proton exchange membrane fuel cells. Appl. Surf. Sci. 2019, 504, 144096. [Google Scholar] [CrossRef]
  35. Morjan, I.; Voicu, I.; Dumitrache, F.; Sandu, I.; Soare, I.; Alexandrescu, R.; Vasile, E.; Pasuk, I.; Brydson, R.M.; Daniels, H. Carbon nanopowders from the continuous-wave CO2 laser-induced pyrolysis of ethylene. Carbon 2003, 41, 2913–2921. [Google Scholar] [CrossRef]
  36. Gao, W.; Singh, N.; Song, L.; Liu, Z.; Reddy, A.L.M.; Ci, L.; Vajtai, R.; Zhang, Q.; Wei, B.; Ajayan, P.M. Direct laser writing of micro-supercapacitors on hydrated graphite oxide films. Nat. Nanotechnol. 2011, 6, 496–500. [Google Scholar] [CrossRef] [PubMed]
  37. Lin, J.; Peng, Z.; Liu, Y.; Ruiz-Zepeda, F.; Ye, R.; Samuel, E.L.; Yacaman, M.J.; Yakobson, B.I.; Tour, J.M. Laser-induced porous graphene films from commercial polymers. Nat. Commun. 2014, 5, 5714. [Google Scholar] [CrossRef]
  38. Tiliakos, A.; Ceaus, C.; Iordache, S.M.; Vasile, E.; Stamatin, I. Morphic transitions of nanocarbons via laser pyrolysis of polyimide films. J. Anal. Appl. Pyrolysis 2016, 121, 275–286. [Google Scholar] [CrossRef]
  39. Tiliakos, A.; Trefilov, A.M.I.; Tanasă, E.; Balan, A.; Stamatin, I. Space-filling supercapacitor carpets: Highly scalable fractal architecture for energy storage. J. Power Sources 2018, 384, 145–155. [Google Scholar] [CrossRef]
  40. Hoogers, G. Fuel Cell Technology Handbook, 1st ed.; CRC Press: Boca Raton, FL, USA, 2002. [Google Scholar] [CrossRef]
  41. Miansari, M.; Sedighi, K.; Amidpour, M.; Alizadeh, E.; Miansari, M.O. Experimental and thermodynamic approach on proton exchange membrane fuel cell performance. J. Power Sources 2009, 190, 356–361. [Google Scholar] [CrossRef]
  42. Ionescu, V.; Buzbuchi, N.; Andronie, A.; Stamatin, I.; Gîrleanu, V. Exergy analysis of a PEM fuel cell system with different bipolar plate flow fields. In Proceedings of the 11th International Symposium on Advanced Topics in Electrical Engineering (ATEE), Bucharest, Romania, 28–30 March 2019; IEEE: New York, NY, USA, 2019; pp. 1–6. [Google Scholar] [CrossRef]
  43. Arshad, A.; Ali, H.M.; Habib, A.; Bashir, M.A.; Jabbal, M.; Yan, Y. Energy and exergy analysis of fuel cells: A review. Therm. Sci. Eng. Prog. 2019, 9, 308–321. [Google Scholar] [CrossRef]
  44. Dincer, I.; Rosen, M.A. Chapter 3. Chemical Exergy. In Exergy: Energy, Environment and Sustainable Development, 3rd ed.; Elsevier Science: Amsterdam, The Netherlands, 2021; p. 44. ISBN 9780128243725. [Google Scholar] [CrossRef]
  45. Wu, Q.X.; Zhao, T.S.; Chen, R.; Yang, W.W. Effects of anode microporous layers made of carbon powder and nanotubes on water transport in direct methanol fuel cells. J. Power Sources 2009, 191, 304–311. [Google Scholar] [CrossRef]
  46. Tsotridis, G.; Pilenga, A.; de Marco, G.; Malkow, T. EU Harmonised Test protocols for PEMFC MEA testing in single cell configuration for automotive applications. JRC Sci. Policy Rep. 2015, EUR 27632 EN. Available online: https://publications.jrc.ec.europa.eu/repository/handle/JRC99115 (accessed on 25 September 2021). [CrossRef]
  47. Harrison, K.W.; Remick, R.; Hoskin, A.; Martin, G.D. Hydrogen Production: Fundamentals and Case Study Summaries; (No. NREL/CP-550-47302); National Renewable Energy Lab. (NREL): Golden, CO, USA, 2010. [Google Scholar]
  48. Ay, M.; Midilli, A.; Dincer, I. Exergetic performance analysis of a PEM fuel cell. Int. J. Energy Res. 2006, 30, 307–321. [Google Scholar] [CrossRef]
  49. Kazim, A. Exergy analysis of a PEM fuel cell at variable operating conditions. Energy Convers. Manag. 2004, 45, 1949–1961. [Google Scholar] [CrossRef]
  50. Özgür, T.; Yakaryilmaz, A.C. Thermodynamic analysis of a proton exchange membrane fuel cell. Int. J. Hydrog. Energy 2018, 43, 18007–18013. [Google Scholar] [CrossRef]
  51. Taner, T. Energy and exergy analyze of PEM fuel cell: A case study of modeling and simulations. Energy 2018, 143, 284–294. [Google Scholar] [CrossRef]
  52. Ozden, A.; Shahgaldi, S.; Zhao, J.; Li, X.; Hamdullahpur, F. Assessment of graphene as an alternative microporous layer material for proton exchange membrane fuel cells. Fuel 2018, 215, 726–734. [Google Scholar] [CrossRef]
  53. Vilekar, S.A.; Datta, R. The effect of hydrogen crossover on open-circuit voltage in polymer electrolyte membrane fuel cells. J. Power Sources 2010, 195, 2241–2247. [Google Scholar] [CrossRef]
  54. Hu, Z.; Xu, L.; Song, Z.; Li, J.; Ouyang, M. A semiempirical dynamic model of reversible open circuit voltage drop in a PEM fuel cell. Int. J. Energy Res. 2019, 43, 2550–2561. [Google Scholar] [CrossRef]
  55. Zhang, J.; Tang, Y.; Song, C.; Zhang, J.; Wang, H. PEM fuel cell open circuit voltage (OCV) in the temperature range of 23 °C to 120 °C. J. Power Sources 2006, 163, 532–537. [Google Scholar] [CrossRef]
  56. Huang, J. A Simple Accurate Formula for Calculating Saturation Vapor Pressure of Water and Ice. J. Appl. Meteorol. Climatol. 2018, 57, 1265–1272. [Google Scholar] [CrossRef]
  57. Zhang, J.; Zhang, H.; Wu, J.; Zhang, J. Chapter 4—The Effects of Temperature on PEM Fuel Cell Kinetics and Performance. In PEM Fuel Cell Testing and Diagnosis; Zhang, J., Zhang, H., Wu, J., Zhang, J., Eds.; Elsevier: Amsterdam, The Netherlands, 2013; pp. 121–141. ISBN 9780444536884. [Google Scholar] [CrossRef]
  58. Pukrushpan, J.T.; Peng, H.; Stefanopoulou, A.G. Control-Oriented Modeling and Analysis for Automotive Fuel Cell Systems. J. Dyn. Sys., Meas. Control. 2004, 126, 14–25. [Google Scholar] [CrossRef]
  59. Mench, M.M. Chapter 3—Thermodynamics of Fuel Cell Systems. In Fuel Cell Engines; John Wiley & Sons: New Jersey, NJ, USA, 2008; pp. 62–120. [Google Scholar] [CrossRef]
  60. Larminie, J.; Dicks, A. Appendix 2—Useful Fuel Cell Equations. In Fuel Cell Systems Explained, 2nd ed.; John Wiley & Sons: New York, NY, USA, 2003; pp. 395–399. [Google Scholar] [CrossRef]
  61. Khazaee, I.; Ghazikhani, M.; Mohammadiun, M. Experimental and thermodynamic investigation of a triangular channel geometry PEM fuel cell at different operating conditions. Sci. Iran. 2012, 19, 585–593. [Google Scholar] [CrossRef] [Green Version]
  62. Yilanci, A.; Dincer, I.; Ozturk, H.K. Performance analysis of a PEM fuel cell unit in a solar–hydrogen system. Int. J. Hydrogen. Energ. 2008, 33, 7538–7552. [Google Scholar] [CrossRef]
  63. Valero, A. Exergy accounting: Capabilities and drawbacks. Energy 2006, 31, 164–180. [Google Scholar] [CrossRef]
  64. Amidpour, J.; Manesh, M.H.K. Chapter 5—Exergy And Thermoeconomic Evaluation of Cogeneration and Polygeneration Systems in Cogeneration and Polygeneration Systems; Academic Press: Cambridge, MA, USA, 2021; p. 62. [Google Scholar] [CrossRef]
  65. Lemmon, E.W.; McLinden, M.O.; Friend, D.G. Thermophysical Properties of Fluid Systems in NIST Chemistry WebBook, NIST Standard Reference Database Number 69; Linstrom, P.J., Mallard, W.G., Eds.; National Institute of Standards and Technology: Gaithersburg, MD, USA, 2021; pp. 263–267. [Google Scholar] [CrossRef]
  66. Barelli, L.; Bidini, G.; Gallorini, F.; Ottaviano, A. An energetic–exergetic analysis of a residential CHP system based on PEM fuel cell. Appl. Energy 2011, 88, 4334–4342. [Google Scholar] [CrossRef]
  67. Ertesvag, I.S. Sensitivity of chemical exergy for atmospheric gases and gaseous fuels to variations in ambient conditions. Energy Convers. Manag. 2007, 48, 1983–1995. [Google Scholar] [CrossRef]
Figure 1. Graphic illustration of the stages of the LIG FC assembly procedure, including (left to right): laser pyrolysis of PI substrates for preparing the graphenic MPLs, catalyst ink spraying for preparing the CLs, hot pressing on a Nafion membrane, detachment of the sacrificial layers, and finally attachment of the backing layers. Reproduced with permission from [34].
Energies 14 06232 g001
Figure 2. Graphic illustration of the P&ID outlining the experimental set-up for FC measurements.
Energies 14 06232 g002
Figure 3. IV, polarization, and power performance curves (left, middle, right) for the: (a) the Reference CB-based FC; and (b) the LIG-based FC. Measurements were conducted over three sets of testing conditions, ranging from 40 °C to 80 °C and from 40% to 80% RH; In the case of the fresh and ageing CB based FC tested at 80 °C and 80% RH, IV and power performance profiles mark the sharp difference in output before and after cracking of the CL and the resulting flooding of the GDL.
Energies 14 06232 g003
Figure 4. Voltage efficiency, irreversibility, and exergy analysis for Reference CB-FC (a) and LIG-FC (b) under specific testing conditions: Test 1—40 °C–80%RH, Test 2—80 °C–40%RH and Test 3—80 °C–80%RH (fresh CB–FC).
Energies 14 06232 g004
Figure 5. Variations of voltage efficiency (a), thermodynamic irreversibility (b) and of exergy efficiency (c) versus current density for the fuel cell with LIG-based MEA and CB-based MEA at: 40 °C–80%RH, 80 °C–40%RH and 80 °C–80%RH (fresh CB–FC).
Energies 14 06232 g005
Table 1. Experimental OCV values and total OCV drop values during experiments.
MEA SamplesPotentials (mV)Test 1
40 °C—80%RH
Test 2
80 °C—40%RH
Test 3
80 °C—80%RH
Reference CB-FC U exp O C V 975932984
Δ U O C V 287296230
LIG-FC U exp O C V 989978993
Δ U O C V 272249221
Publisher’s Note: MDPI stays neutral with regard to jurisdictional claims in published maps and institutional affiliations.

