Abstract
The present work involves a new and novel upgrading design to the classical solar chimney power plant (SCPP) structure. The SCPP design was modified by adding a co-centric secondary external chimney to the SCPP structure to enhance energy production. In the new improved design, named the solar double-chimney power plant (SDCPP), the internal chimney, operates like a traditional SCPP to produce electricity during the daytime whereas the secondary external chimney operates as 10 cooling towers (CT) in a series. Each CT is equipped with a turbine and water sprinklers for further energy production. The new design offers the operation of the SCPP during the day and the continuous operation of the CT (day-and-night). A mathematical model that includes the energy and mass balance equations of the system was built using MATLAB. The SDCPP system produced up to 993 MWh of electrical energy, which is 2.6 times higher than the traditional SCPP (377 MWh). The new design configuration achieved a percentage of thermal efficiency (%ηth) of 1.6%, which is 200 times greater than the SCPP. The economic assessment of the new system revealed a 50% reduction in the localized cost of energy (LCOE) compared with traditional SCPP. The key advantage of the new design is related to the use of low-cost material in constructing the secondary chimney to reduce the fixed capital cost and prompt the economic feasibility of the system. Overall, the proposed SDCPP offers a feasible and economic solution to produce electricity and to potentially reduce greenhouse gas emissions.
1. Introduction
The solar chimney power plant (SCPP) is one of the most promising technologies, with a simple design and low-cost advantages for power and desalination production [1,2]. The SCPP is the best solution to tackle the challenges of clean energy demand and freshwater shortage. It was a conceptual model until it was piloted and tested successfully in Spain during the 1980s when Schlaich built his optimized design that can produce electrical power in the range of 100–200 MW [3]. The basic design of the SCPP consists of three essential modules: a solar collector, a power mechanical conversion unit, and a very long chimney. The solar radiation coming from sunlight heats the air between the solar collector and the ground. This will decrease the air’s density and increase the pressure, which in turn will significantly increase the air’s velocity. The change in air physical properties drives it to move upward through the chimney with very high kinetic and thermal energies. The air mass flow with high-energy content passes through the blades of the turbine, producing electrical energy.
The main challenges of the SCPP are: large land requirement, high localized cost of energy (LCOE), low %ηth, and the requirements for very long chimney [4,5,6]. Most of the SCPP studies and developments during the last decades followed two main improvement pathways: improving mathematical modeling processes, and improving design configuration.
The first pathway has little impact on the improvement of the SCPP performance and focuses on just validating and improving the process mathematical modeling. On the other hand, improvement and innovations are opened in the second pathway. Zuo et al. [7] proposed a new design that integrated the operation of the SCPP with a desalination unit. Kiwan et al. [6,8] developed two designs, where the first one maximizes electricity and freshwater production, while the second offers an integrated design with a photovoltaic (PV) system for maximum electricity generation. Zandian and Ashjaee [9] integrated the SCPP with a cooling tower in a 250 MW power plant that has resulted in improving the %η to 0.37%. Miqdam and Hussein [10] investigated the effect of replacing the collecter’s glass cover with three different transparent plastic as well as the base materials: concrete, black concrete, and black pebbles. Their results displayed that the efficiency was highest—by about 49.7%—with a pebble base. On the other hand, Chantawong et al. [11] investigated the thermal performance of glazed with double-glass panes with an air layer SCPP under the tropical climatic conditions of Thailand. The results showed that the system is economical and very suitable for hot regions. Koonsrisuk and Chitsomboon [12] modeled mathematically a SCPP to predict the performance characteristics of commercial-size solar chimneys. They found that an SCPP with a height of 400 m and a collector radius of 200 m was the most suitable for the region of the study. Zuo et al. [13] studied experimentally the performance of an integrated SCPP and seawater desalination. It was concluded that the utilization efficiency of the solar irradiance of the integrated system was higher than the SCPP alone. However, the maximum achievable utilization efficiency of 25% was significantly lower than the estimated efficiency of large-scale systems (i.e., 55%). Li et al. [14] investigated a novel combination of an SCPP with a tornado-type wind tower mounted at the exit of the chimney. The novel system produced much more power than the SCPP. For instance, at a wind speed of 15 m/s, the novel system produced 2.21 times more power than an SCPP with a chimney height of 290 m, which is equivalent to the power produced from an SCPP with a chimney height of 772 m. Other researchers also proposed to install wind capture devices at the top of the chimney to harvest extra wind power [7,14,15]. Nasraoui et al. [16] introduced a novel collector design for improving the SCPP power production.
The previous literature review revealed that the improvements of the SCPP design to achieve high thermal efficiency under low land usage and reduced LCOE are crucial. The integration of the SCPP with other renewable and sustainable energy resources is highly recommended. There is a high opportunity to propose a new design that can maximize electrical power production under low fixed capital and operating cost. Besides, there is a gap in the literature regarding the impact of installing an energy integration system within the SCPP on the process performance and feasibility. Moreover, the techno-economic aspect of any new design in terms of performance and cost requires further investigation. Accordingly, a novel design of the solar double-chimney power plant (SDCPP) is proposed in this work. The research work is carried out by first proposing a new improved design consists of two co-centric chimneys operated in conjunction with the collector, turbine, and 10 cooling towers (CT) channels; each equipped with a turbine for further energy production. A mathematical model of the proposed design is then presented based on energy balance equations. The proposed system is then assessed for electricity production using a full year’s worth of weather data. The results are compared with traditional SCPP to show performance enhancement. Finally, the economic feasibility of the proposed system is then presented along with its environmental impact.
2. Materials and Methods
2.1. Design and Configuration
The structure of the SDCPP is presented in Figure 1. The structure consists of two co-centric chimneys, internal chimney (IC) and external chimney (EC), collector, turbine, and base. The traditional components of the SCPP are intended to produce electricity. The EC, along with the turbines installed at the bottom of each channel, operates as a CT. The top view of the structure (Figure 1b) shows that the overlap area between the IC and EC was divided into 10 identical, symmetrical, and independent channels operating as CTs. To sustain the process and harness kinetic energy, sprinklers and turbines were installed at the top and bottom of each channel, respectively. The outline of the EC is a polygon so that it is optimally matched to the sweep area of the turbine.
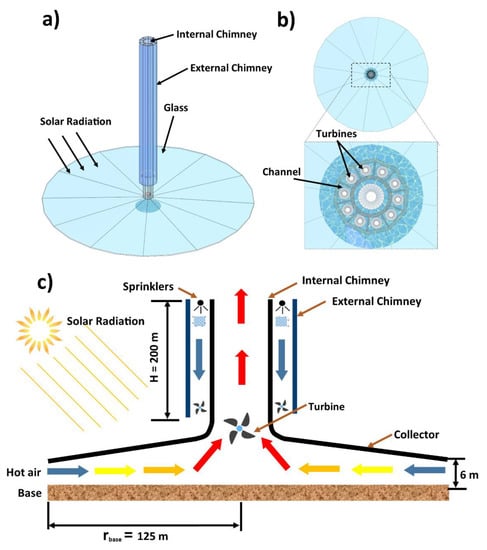
Figure 1.
Diagram of the proposed solar double-chimney power plant design: (a) a three-dimensional view, (b) view from the top section, (c) cross-sectional view.
2.2. Solar Chimney Power Plant Mode
The SDCPP operates in two modes: SCPP mode and CT mode. The SCPP mode begins when the solar irradiation heats the air under the collector. As the air temperature rises, it expands under the collector, creating a temperature gradient that extends from the entrance of the collector to the bottom of the IC. As shown in Figure 1c, the changes in the temperature profile of the cold air (blue lines) to hot air (red lines) result in the movement of air through the collector. Due to the temperature and pressure difference between the bottom and the top of the IC the hot air moves up to the top of the chimney and exits to the surroundings. The velocity of the air exiting the IC is dependent on the temperature difference between the air inside the IC and the air outside the IC. The movement of the hot air within the chimney allows for energy transfer with the turbine blades at the bottom of the chimney (i.e., the air’s kinetic energy transfers to mechanical energy and then to electrical energy).
2.3. Cooling Tower Mode
Although the operation of the SDCPP depends on solar irradiation during the day, it still operates as a CT during the night, allowing 24 h operation. Its operation is based on spraying a haze of water near the top section of the CT channel where the hot and dry air flows. The air at the top of the CT is influenced by the hot air flowing out from the IC during the daytime. However, during the nighttime, it depends on the ambient air as the solar chimney mode is off. When the hot air absorbs the water from the mist, it becomes instantaneously cooler and heavier. Consequently, the airdrops towards the bottom of the 10 channels by gravity operating the system as natural drafting CT. The air accelerates towards the turbine at the bottom of the channel and exists outside the channel, crossing the turbine blades to produce electricity. The velocity of the air exiting the channel is dependent on the temperature difference between the air inside the channel and the air outside the channel. The 10 channels of the EC are identical. Hence, they operate under the same conditions and produce the same amount of electricity. Therefore, cumulative electricity production is the sum of electricity produced in the IC and EC. A water pump was used to provide the sprinklers at the top of the CT channels with water from a nearby reservoir, as the size of the nozzle would directly affect the size of the water droplets and the corresponding evaporation rate and energy requirements. In this work, calculations were performed assuming the average droplet size of 300 m and spraying rate of 8 gwater/kgair, as recommended by Zaslavsky [17].
2.4. Mathematical Model
A mathematical model was developed to assess the performance and predict the behavior of the proposed SDCPP system. The mathematical model includes energy and mass balance equations presented in this section. These equations are also presented in the diagram in Figure 2. The diagram shows the two zones of the SCPP mode: solar heating, and chimney. The diagram also shows the zone for the CT mode. A computer program written in MATLAB R2018 was developed based on MATLAB built-in functions that use genetic algorithm methods to solve the equations numerically. The program reads an input file, which contains weather data, including solar radiation, wind velocity, air temperature, and relative humidity. The input file contains 8760 data points corresponding to 8760 h (one year); the weather data is sampled hourly. The program assumes the ambient temperature for the collector, absorber, air under the collector, and air inside the chimney as an initial condition. The program then calculates the temperature values for the glass, air under the collector, absorber, air inside the IC, and the air inside the EC. To process 1-year’s worth of data, the program took about 6 h. A computer with the following specifications was used: CPU Intel i7-9700K 3.6 GHz, GPU Nvidia RTX 2070 SUPER 8 GB GDDR6, and RAM T-Force Delta RGB 16 GB (8 GB × 2) 3000 MHz. The design details of the SDCPP such as the height of the chimney and the width of the collector that was included in the model are shown in Table 1. Additionally, the properties of the different parts of the SDCPP are shown in Table 2.
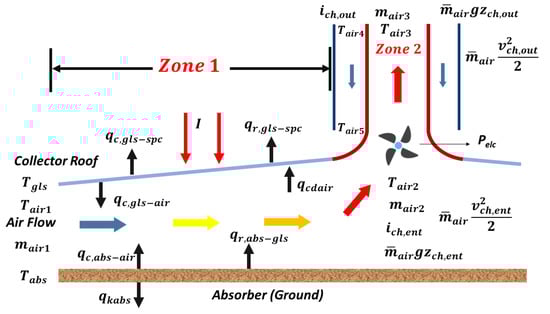
Figure 2.
Illustrations of the energy balance equations of the SDCPP. Zone 1 is the solar air heating, and Zone 2 is the solar chimney and cooling tower (CT).

Table 1.
Dimensions of the SDCPP model.
Table 2.
Relevant properties of the SDCPP parts.
The energy balance equations for the different zones of the SDCPP are shown in the next sections. The detailed equations used in the model can be found in the supplemental material.
2.4.1. Zone 1: Solar Air Heating
The energy balance equations are as follows:
Airflow:
Collector to air and absorber to air convective heat transfer rates are as follows:
where , from air mass balance equation.
Absorber:
Collector:
The convective heat transfer rate between the collector and the air flowing inside it is as follows:
The convective heat transfer rate between the base and the air under the collector is as follows:
The radiative heat transfer rate between the absorber and the solar collector is given as follows:
The convective heat transfer rate between the collector and the outside environment is as follows:
The convective heat transfer coefficient ( is given by:
where is the wind speed above the horizontal glass of the collector.
The sky temperature is given by:
The radiation heat transfer rate between the collector and the outside environment is as follows:
2.4.2. Zone 2: Solar Chimney
The mass balance equation for the air in and out of the chimney is as follows:
For the IC zone, the energy balance equations when the SDCPP is operating in SCPP mode are as follows:
To calculate the enthalpy [18] of the air entering the IC ():
To calculate the velocity of the air as it enters the IC, the following equation was used [19]:
The output power produced by the turbine at the bottom of the IC was calculated as follows [19]:
where is the turbine efficiency, set at 0.42.
To calculate the system efficiency for electricity production, the following was used:
2.5. Model Validation
To validate our mathematical model, we compared our results with the results obtained by Zou et al. [19]. Figure 3 shows the temperature profile from our model and that of Zou et al. [19]. The temperature profile under the collector starts at the center of the chimney (origin point on the figure) and moving outwards towards the entrance of the collector. One can see that the temperature profile increases as you move from the ingress of the collector towards the center of the IC. Figure 3 shows that our results and the results obtained by Zou et al. [19] are almost identical. To gauge the difference between results from our model and the reference model, one-way analysis of variance (ANOVA) was used, at a significant level of 5%. The determination coefficient (R2) and the root mean square (RMS) was calculated as follows:
where is the calculated temperature and the values for were based on [19].
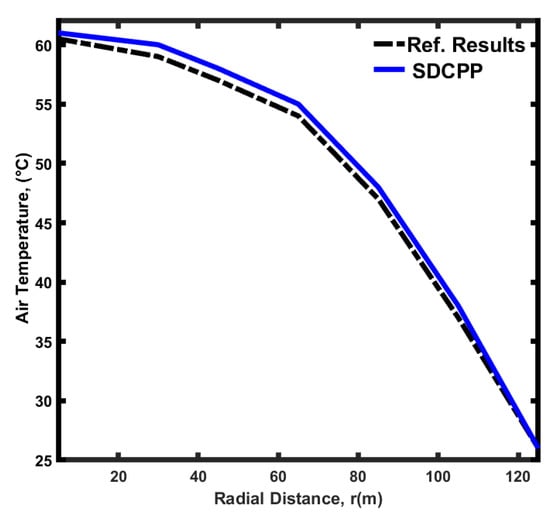
Figure 3.
The performance results of the SDCPP validated against the results were reported by Zou et al. [19]. The temperature profile under the collector is shown; the origin point (0, 0) is the center of the chimney, while the entrance of the collector is at 125 m.
The calculation showed that the R2 and RMS of the error were 0.98%, 0.089%, respectively. This confirms that the SDCPP model can closely forecast the performance of a traditional SCCP.
3. Results and Discussion
3.1. Review of Weather Trend
The annual weather data for the studied location, Aqaba, Jordan (29°31036.01″ N/35°00028.01″ E), was collected on an hourly basis and used to determine the cumulative electricity production.
3.1.1. Solar Irradiation
Table 3 presents representative values of the weather data for a regular summer day in July. The recorded results show that solar irradiation starts at 06:00 with an intensity of 256 W/m2 and ends at 17:00 with an intensity of 141 W/m2. The average daily solar irradiation is 5.53 kW/m2 in the winter and 7.61 kW/m2 in the summer. Figure 4a illustrates the minimum and maximum solar irradiation intensity in Aqaba all year. The average solar irradiation ranged from 4900 to 8050 W/m2, with the maximum value observed in June. There was a noticeable difference between the minimum and maximum solar irradiation in winter. The maximum difference in the winter was 6000 W/m2; the maximum difference in the summer was 1500 W/m2. This intensive solar irradiation in Aqaba represents promising renewable energy to produce electricity using the proposed SDCPP.
Table 3.
The 24 h weather data on 30 July 2014 in the city of Aqaba, Jordan.
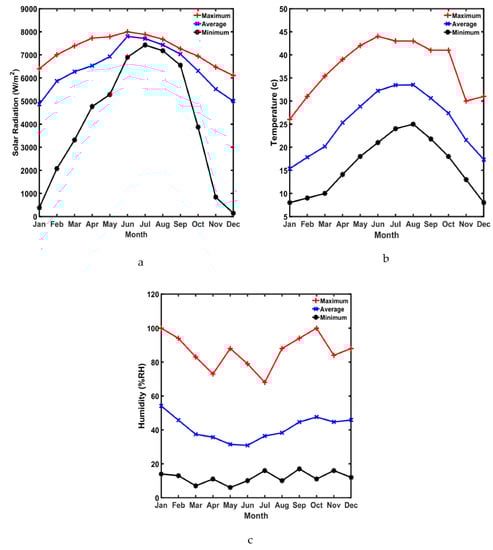
Figure 4.
Monthly weather data (maximum, minimum and average) profiles for: (a) solar Irradiation, (b) temperature, and (c) humidity.
3.1.2. Temperature Profile
The temperature profile of the studied location (Figure 4b) revealed a summer temperature profile in the range of 32.8 °C to 43.0 °C during the day and 30.0 to 36.3 °C during the night. A similar temperature profile was observed in winter with a temperature profile in the range 8 °C to 35.4 °C and temperature range from 21 °C to 44 °C during the summer.
3.1.3. Wind Speed Profile
The wind speed and percentage relative humidity (%RH) were also measured all year round. The general trends showed that the wind speed during the day ranged from 4.1 to 6.2 m/s and at night from 2.6 to 6.2 m/s. The wind speed represents a key operational parameter of the proposed design, as it will make a direct contribution to the dynamic movement of the turbines, and thus the production of electrical power. The wind speed directly affects the airflow inside the chimney, and hence affects the temperature profile under the collector as shown in Equation (1).
3.1.4. Humidity Profile
The %RH plays a major role in the performance of the SDCPP operated in CT mode. Measured weather data (Figure 4c) showed that the %RH ranged from 25% to 47% during the day, and 32% to 42% at night. The contribution of both wind speed and %RH to power generation will be discussed in the coming sections. The proposed design takes advantage of the weather data profile by utilizing solar irradiation when operating in the SCPP mode. However, during the night, the design works using the CT mode, thus contributing to 24 h energy production. Previous studies proposed using airbags to provide heating below the collector at night to maintain SCPP operation. However, the efficiency and the produced electricity were very low and not feasible [1].
3.2. Operation and Performance of the Solar Chimney Mode
The electrical power production, as well as the solar light intensity during the 24 h operation of the SDCPP as SCPP and CT, is presented in Figure 5a. The system is characterized by a continuous generation of electricity throughout 24 h period. The electricity production from the SCPP mode starts at 05:00 and increases during the day reaching a maximum value of 138 kW from 09:00 to 15:00, and decreases back to zero at 19:00, producing a daily average cumulative electrical power of 1168 kW during the summer, and 866 kW during the winter. The observed trend can be related to the variation in the intercepted solar irradiation. As shown the solar irradiation is at lowest in the morning leading to operating the system as CT and results in higher electrical power production. Once the solar intensity increases, the system works as an SCPP to produce additional electrical power. Operating the SDCPP as a CT after sunset produces a constant electrical power of 225 ± 5 kW for the entire day. Thus, the cumulative power produced from the operation of the SDCPP as CT is 1.63 times higher than the maximum power generated from the traditional SCPP. While the operation of the SDCPP as a CT was proposed to occur at nighttime (see Figure 5b), the addition of the external chimney with 10 turbines extends the CT operation and significantly increases the produced electrical power.
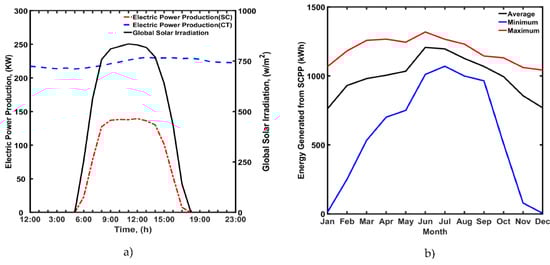
Figure 5.
Daily performance of the SDCPP: (a) electricity production profile from SCPP and CT modes, (b) daily cumulative average energy produced by the SCPP mode. The data presented were taken on 30 July.
3.2.1. Performance Comparison with Other Proposed SCPP Designs
The cumulative annual electricity production from this system was determined to be 993 MWh, which is 2.6 times higher than the classical SCPP (377 MWh) [19], and 1.9 orders of magnitude higher than the hybrid solar chimney power plant (528 MWh) [20]. The electrical power generated in the modified structure is significantly higher than the values reported in the literature under similar solar irradiation intensity. Tingzhen et al. [21] reported the generation of only 35 kW technical work under solar radiation intensity of 800 W/m2 using a four-blade turbine. Larbi et al. [22] showed the traditional SCPP produced electricity in the range 140 and 200 kW under solar irradiation in the range 400 to 600 W/m2 and ambient temperature in the range 20 to 38 °C.
3.2.2. Justification for High Performance
The structure of the SDCPP is the main reason for the significant electrical power production. In such a design, the solar chimney was operated on parallel SCPP and CT modes; the SCPP mode during the daytime, while the external chimney with an additional 10-turbine was operated as CT contributing to the cumulative electrical power generation. The outline of the second chimney was designed in a polygon shape to take advantage of the maximum sweep area, enhance the gas flow within the chimney, and reduce the amount of wasted energy. The SCPP mode utilized the intercepted solar irradiation during the day to heat the air under the collector. The absorbed heat increases the air temperature, decreases its density, and creates a streamline velocity over the seawater pool. The streamline velocity moves the hot and moist air up the chimney allowing the ambient outside temperature to enter the chimney and sustain continuous airflow. The temperature and pressure difference created between the inside and outside of the chimney moves up the hot air through the chimney, where the kinetic energy is transferred to mechanical energy producing electricity. Sangi et al. [23] showed that the air velocity profile through the collector increased by decreasing the radius and it increases sharply at the base of the chimney. The temperature gradient between the inside and outside of the chimney creates an accelerated natural air draft towards the turbine at the bottom of the chimney, moving the turbines and producing electricity. The output power can be correlated to the developed pressure gradient in the SC and the pressure drop across the turbine is insignificant to affect the mass flow rate of the air and decrease its fluid velocity. At the same time, the outlet temperature of the chimney changes slightly because the collector radius is large enough to let the air absorb heat energy inside [21]. Sakonidou et al. [24] showed that the air velocity profile of the outlet air from the SC exhibits non-interacting boundary layers with local maxima at the center of the chimney. It was indicated that the air velocity increased significantly due to the high-pressure head and a higher difference between inside and ambient air temperature. Arce et al. [25] confirmed that the airflow rate through the SC is caused by thermal gradients between the absorber plate and the air adjacent to it. The same study highlights the importance of the wind velocity at the upper side of the chimney in creating a draft to enhance the airflow velocity.
The SCPP operates during the daytime, while the CT operates in continuous mode. These results in significant system utilization and continuous production of electricity compared with traditional SCPP. The economic advantage of the secondary chimney can be improved by using low-cost material in constructing this chimney.
3.3. Operation and Performance of the Cooling Tower Mode
The impact of ambient temperature and the %RH on the performance of the SDCPP was noticed during the operation as CT (see Figure 6a). The observed trends show an indirect relationship between the output power generation and the ambient temperature and/or the %RH. During the night, specifically from 24:00 to 05:00, the temperature decreased from 35 °C to 29 °C and %RH increased from 38% to 46%, leading to a decrease in the electrical power generation from 218 to 213 kW. After the sunrise, the %RH decreased from 46% at 05:00 to 27% at 18:00, and the temperature increased from 29 °C to 43 °C, increasing the electrical power generation from 213 to 232 kW. After the sunset, the %RH increased from 27% to 37% and the temperature decreased (43 to 33 °C) leading to a slight decrease in the power generation from 230 to 223 kW. This observed pattern is related to the effect of the temperature gradient between the air inside and outside the chimney. Increasing this temperature gradient increases the differential pressure, leading to an increase in the velocity of the air inside the chimney and creating more dynamic power to operate the turbine. Thus, the output energy is increased. In the same manner, as the %RH of the outside air increases, the amount of water that can be evaporated to achieve the required cooling effect decreases, leading to lower power generation. The observed pattern also highlights the impact of wind speed and its hydrodynamics on the performance of the system. Any possible changes in the direction and the speed of the wind can increase the kinetic energy of the air inside the chimney and enhance the power output.
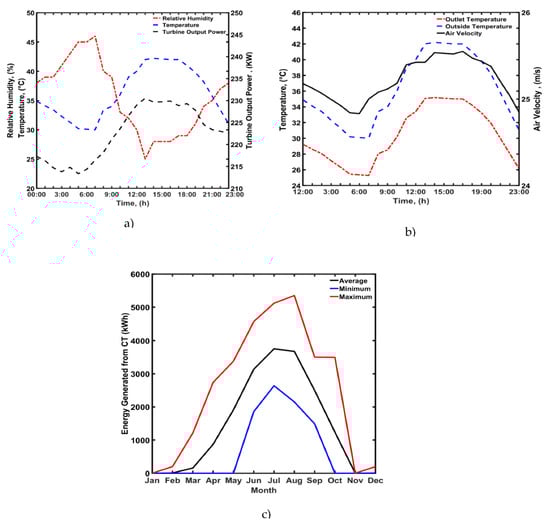
Figure 6.
(a) Effect of the outside temperature profiles, relative humidity on the performance of the CT, (b) the temperature profiles of the outside and the velocity of the water vapor during the CT mode, (c) The average daily cumulative energy produced by the CT mode. The data presented were taken on 30 July.
Figure 6b shows the evaluation of the air velocity within the chimney in correlation to the inlet and outlet temperatures. The air velocity profile is directly proportional and exhibited similar trends as the outlet temperature. The air average velocity from the chimney decreased by decreasing the outlet temperature during the night and increased when the outlet temperature increased during the day. The average air velocity can be directly correlated to the rotational speed of the turbine, which is considered the key operational parameter for power generation.
The temperature profiles of the ambient air and the air leaving the lower part of the SDCPP under CT mode are presented in Figure 6b. Both temperature profiles attained similar patterns with a 7 °C degree difference between air vapor and ambient temperature because of the cooling effect. The attained temperature profile suggests that the operation of the SDCPP under CT mode follows the character of the natural draft cooling profile. In addition, the heat exchange due to the evaporation of water droplets creates a dynamic flow inside the CT channels. Hence, maintaining the continuous movement of the turbine and thus contributes to the generated electrical energy. Sangi et al. [23] observed that the average velocity of the air in the outlet of the chimney decreases significantly, while the average temperature increases, and then the turbine rotational speed increases. It was indicated that under stable environmental parameters and constant solar radiation, the resistant force created by the blades leads to a decrease in the mass flow rate of air. Hence, the outlet air velocity would decrease accordingly. Moreover, the reduction in the air velocity might increase the chance for energy absorption from the system, leading to a sudden increase in the average temperature of the chimney outlet.
3.4. Total System Performance
The monthly production of electrical power from the proposed design for one full year is presented in Table 4. The winter season (November to February) marked the lowest monthly electrical power (23,618 to 26,253 kWh) production. This was due to the low intercepted solar irradiation during these months. On the other hand, the summer months marked a significant improvement in the produced electrical power (up to 153,365 kWh). The production of electricity increases gradually by increasing the solar irradiation intensity and ambient temperature, which are favorable conditions for better SCPP operation. The results obtained suggest that the SDCPP produced 2.6-fold higher electrical power than the traditional SCPP. The significant improvement in the power generation can be related to the contribution of the 10 turbines in the secondary chimney. The table also showed that the power production from the CT is at its lowest in winter due to the low-temperature gradient and high humidity during the wintertime. The annual cumulative electricity (993 MWh) from the new proposed design is higher than the conventional SCPP (377 MWh).
Table 4.
Monthly electrical power production from the SDCPP.
3.5. Performance Comparison with Other Proposed Systems in the Literature
Table 5 provides a summary of the electrical power generation from SCPP in different SCPP design parameters reported in the literature. The data shows that the annual power production from the SDCPP in Aqaba is higher than the values reported in the literature except for the study reported by Guo et al. [26]. This is due to the big difference in the collector diameter proposed in the study, compared to the SDCPP collector diameter. Furthermore, the annual electricity production reported in the present study is 2.6 times higher than the classical SCPP (377 MWh) as reported by Zuo et al. [19], and 1.9 orders of magnitude higher than the hybrid solar chimney power plant (528 MWh) reported by Abdelsalam et al. [20].
Table 5.
Summary of the power generation from SCPP for different SCPP design parameters.
The key explanation for the substantial production of electrical power is the design arrangement of the SDCPP. The system was operated in parallel as SCPP mode during the daytime, while operating in CT mode day and night, providing 24 h production of electricity.
3.6. System Limitations
Although the performance of the SDCPP showed substantial improvement over relevant design proposals, it does suffer from some limitations:
- The CT performance is strongly influenced by the weather conditions, specifically high humidity. The productivity is almost zero in the winter and autumn months of the year.
- The CT function is dependent on bringing in water from a nearby water reservoir. The CT also uses electricity to pump the water to the top of the chimney.
- The size of the external chimney is dependent on the size of the inner chimney from a structural standpoint.
- The system produces electricity, but lacks the capacity to produce distilled water compared to our previous proposed systems.
- The hot air exiting the inner chimney is not being fully utilized back into the cooling tower to improve system efficiency.
3.7. System Metrics and Scalability
To gauge the performance of the system, an efficiency calculation was performed. System efficiency is defined as the ratio of the annually produced electricity to the total solar irradiation received by the collector surface annually, as shown in Equation (16). To gauge the relative performance of a baseline traditional SCPP, the efficiency of the SDCPP is divided by the efficiency of the traditional SCPP. Figure 7a shows the monthly system efficiency ratio between the proposed SDCPP system and the traditional SCPP. The results show that the system efficiency ratio is 1 during the winter months (November to February), that is because the CT does not operate in these months due to low temperatures and high humidity. Hence, the SDCPP operates in the SCPP mode which gives the results of a traditional SCPP. However, the efficiency ratio increases gradually every month after the winter months in favor of the SDCPP system, reaching a maximum efficiency ratio of almost 4.5 times higher than the traditional SCPP in August. These results were anticipated, because during these months the CT mode works day and night as the weather conditions are favorable, while the SCPP mode works during the daytime. Therefore, a higher efficiency factor is achieved. The yearly electrical energy production as a function of chimney height and diameter are shown in Figure 7b,c, respectively. It is evident from the figure that the electrical production increased with the increase of both the height and diameter. As the height increases at constant solar irradiation, the airflow rate, the air velocity, and the pressure difference across the turbine increase, hence the power generated by the turbine increases. As the chimney height increased from 200 to 1500 m, the electrical energy production increased from 1 GWh to slightly higher than 18 GWh. The theoretical energy produced by an SCPP is directly proportional to the chimney height. However, the heat loss and potential energy cause the temperature of the air inside the chimney to decrease much faster than that of the air outside the chimney. Hence, it reduces the potency of the buoyancy force. Moreover, the fraction losses also increase as the chimney height increases [36]. Hence, it is anticipated to have an optimal chimney height. It seems that this optimal height is considerably higher than the range of heights investigated in this study. Furthermore, the electrical energy production of an SCPP is directly proportional to the square of the collector diameter. Any increase in collector diameter would cause a rapid increase in the energy produced. The energy produced would decrease with the increase in the collector diameter and would reach almost a constant value when the diameter exceeds a certain value (e.g., several hundred). However, these values are much higher than the values considered in this study [36]. As shown in Figure 7c, as the chimney diameter increased from 5 to 37 m the energy production increased from around 2 GWh to around 50 GWh.
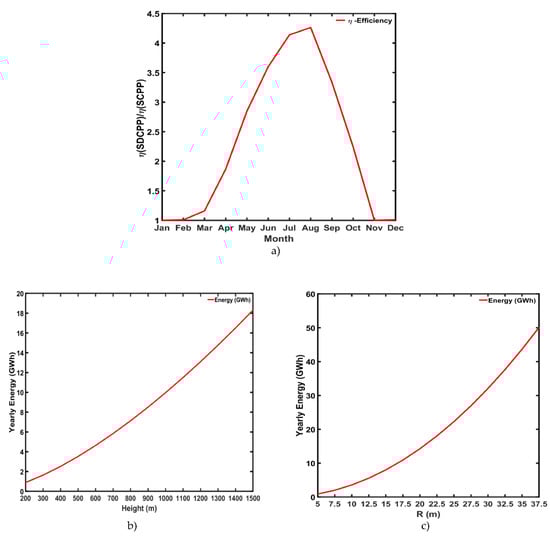
Figure 7.
System metrics: (a) system efficiency ratio of the proposed SDCPP vs. the traditional SCPP, (b) yearly electrical energy production as a function of chimney height, (c) yearly electrical energy production as a function of chimney diameter.
4. Economic Analysis
In the present work, we propose a conceptual design and justified economics. However, it is important to mention that the calculated cost is a relative cost value and not an absolute. Therefore, our economic analysis is based on comparing a base case design of the traditional SCPP with the SDCPP following Equation (19). The results of the cost analysis for both designs are presented in Table 6. The cost constants values were adapted from the cost analysis of the SCPP, ‘Cost A’, developed by Fluri et al. [37], while the ‘Cost B’ is the target cost of the SCPP and SDCPP in the present work. ‘Size A’ in Equation (19) represents the annual electricity production of the SCPP proposed by Fluri et al., whereas ‘Size B’ is the annual electricity production of any other SCPP design. The exponent n was taken as 0.6 as it is the most used exponent for many types of thermodynamic process, regularly recognized as the “Six-Tenths Rule”. In addition, it is well-known that the cost of equipment varies in terms of size in a non-linear manner, the use of the six-tenths rule would give a rough estimation of total design cost with ±2.5% marginal error.
Table 6.
Cost analysis of the traditional SCPP and the SDCPP configurations.
According to Fluri et al. [37], the cost of the SCPP is itemized as the summation of several components costs that made the entire design structure, including collector cost (Cc) $134.8 m, chimney cost (Cch) $68.2 m, turbine unit cost (Ct) $79.8 m, roads, buildings, workshops (Crbw) $2.0 m, infrastructure (Cin) $4.3 m, planning, site management (Cp&m) $2.9 m, rounding (Cr) $8 m. Following Equation (20), the overall investment of SCCP with an annual electricity production of 305.2 GWh is $300 m ($1.2 = 1 EUR). Correction for weather data and design components costs revealed an estimated cost for the SCCP of $5.40 m. This cost is in agreement with Abdelsalam et al. [34] since it is made in the same geographical location, but it differs from other costs [38,39,40] due to the differences in components and labor costs.
In the present work, it was decided to use in the construction of the external chimney a light robust material to exhibit less burden on the foundation of the main chimney of the SDCPP. Table 7 shows that there are several materials available on the market and the selection can be based on light, robustness, and durable thermal insulation. In the present design, aluminum honeycomb panel materials were selected due to their durability, low weight, and good thermal insulation properties (thermal conductivity 0.12 W/m.k) (see Table 7). The uniqueness of this hybrid design can maximize the energy output, reduce the initial cost, and provide an environmentally friendly design that is easy to dismantle and reinstall. The new SDCPP produces 2.6 times higher energy than the traditional SCPP, with no more than a 7.6% increase in the fixed capital cost.
Table 7.
Cost of different alternatives for the EC structure. * Average cost and weight per square meter, as calculated from different worldwide suppliers.
The LCOE of the newly developed design was compared with the work by Abdelsalam et al. [39] using the same cost analysis procedure. The LCOE is used to compare the economic performance of several renewable technologies, such as PV and water desalination [44]. However, the target of the present design is to be installed in remote areas where no special infrastructure is required for power transformation. Remote areas in developing countries lack grid infrastructure to transport electricity and would require huge investment, and it is hard to obtain approval for such a project. Therefore, the benefits of the energy supply to the remote area would satisfy the high cost for both the capital and LCOE of the SCPP. The LCOE (0.85 $/kWh) for the SDCPP design is very low since it utilizes the same operational cost as for the SCPP design. The extra operational cost for the proposed maintenance is estimated to be 2% of the LCOE. This would decrease the LCOE of the SDCPP deign to 0.85 $/kWh, compared to the reference case of 1.86 $/kWh (Table 6). The decrease of LCOE is more than 50%, due to huge cost savings in the new design.
The annual revenue generated from selling the electricity produced can be calculated as shown below:
Revenue = US $0.367 × 992,586 = US $364,279.062
The price of electricity in Jordan is US $0.367/kWh [6].
5. Environmental Impact
The SDCPP is a carbon-free facility compared to other energy sources such as coal-fired power plants. The standard coal-fired power plant with a capacity of 3000 kWh of electricity produces 2.66–2.72 tons of carbon dioxide or 0.90 kg/kW [45]. Therefore, the saved carbon footprint corresponds to 801 tons annually and will contribute to a decrease in Jordan’s GHG emissions, according to Equation (22):
According to the International Energy Association (IEA), since 1990 the carbon footprint in Jordan increased from 9.17 to 24.02 Mt CO2 in 2014. However, the emissions decreased slightly to 22.99 Mt CO2 in 2018. This is mainly due to the rapid increase of 1441 TWh energy supply from the PV systems in 2018. Before 2014, the renewable energy in Jordan was mainly wind turbines and the PV was introduced in 2015 with a capacity of 2 GWh. If Jordan continues to rely on PV in its energy mix, the impact of CO2 emissions would continue to decrease since the environmental impact of PV systems on air quality and climate change is significantly lower than the traditional power generation system [46]. The benefits of carbon decrease would increase Jordan’s portion of carbon credit. Eventually, this would have an impact on the health and wellbeing of the country.
6. Conclusions
A novel design of an SDCPP system was proposed in this study. The system showed superior performance in producing electricity compared to relevant proposed designs by Zuo et al. [19], and Kiwan et al. [6]. From an applications standpoint, the SDCPP is best suited for remote and desert areas where access to electricity is difficult. Also, it is suited as a complementary system to power plants to make use of the excess heat generated from the plants. The longevity of the system can be sustained through scheduled maintenance of the turbines, removal of any excess water and mineral deposits. However, despite the excellent performance of the system compared with relevant design proposals, it suffers from limitations, such as poor performance of the CT in rainy seasons due to high humidity. Limitations are also due to the dependency of the CT function on a nearby water reservoir. The size of the external chimney is dependent on the size of the inner chimney from a structural standpoint. Furthermore, it was observed that the present system is not able to produce high volumes of distilled water compared to our previous proposed system. Future work will focus on improving the design, by upgrading the inner chimney to run as a cooling tower during the nighttime to boost performance. The hot air exiting the inner chimney can be fed back into the cooling tower to improve system efficiency. The system can be integrated with other renewable energy such as photovoltaic. Design and optimal size for the external chimney can be determined from a structural standpoint. Furthermore, building a mini-prototype system is currently in progress, to validate the current design and enhance future ones.
Author Contributions
Conceptualization, E.A., F.K., M.A.; methodology, E.A., F.K., S.K. and A.K.; validation, E.A., F.K., M.A. and F.A.; formal analysis, E.A., F.K., F.A. and M.A.; investigation, E.A., F.K., S.K., A.K. and D.I.; writing—original draft preparation, E.A., F.K., M.A., F.A. and M.T.; writing—review and editing, E.A., F.K., M.A., F.A. and M.T.; visualization, S.K., A.K. and D.I.; supervision E.A. and F.K. All authors have read and agreed to the published version of the manuscript.
Funding
This research received no external funding.
Acknowledgments
The authors extend their appreciation to the ERG lab (www.htu.edu.jo/merg (accessed on 25 September 2021)) for their support in providing data and guidance. We also extend our appreciation to Luz A. Gonzalez for her support in proofreading and editing the manuscript. We also acknowledge Dareen Habash for helping in generating some of the visuals. The authors acknowledge the support provided by Qatar University.
Conflicts of Interest
The authors declare no conflict of interest.
Patents
Provisional patent application (63205318) has been filed with the USPTO.
Nomenclature
| A | Area (m2) |
| H | Height (m) |
| Pelc | Electrical Power (W) |
| qc | Convictive heat transfer rate (W m−2) |
| qr | Radiative heat transfer rate (W m−2) |
| h | Heat transfer coefficient (W m−2 K−1) |
| dh | Hydraulic diameter (m) |
| rw | Seawater pool radius (m) |
| Mass flow rate (kg s−1) | |
| g | Gravity acceleration (m s−2) |
| D | Diameter (m) |
| I | Intensity of solar irradiation (W m−2) |
| k | Thermal conductivity of air |
| T | Temperature (K) |
| Pr | Prandlt number |
| cp | Specific heat capacity (J kg−1 K−1) |
| r | Radius (m) |
| PV | Photovoltaic |
| i | Enthalpy |
| f | Friction factor |
| Vch | Air velocity entering the chimney, (m s−1) |
| E | The net mechanical energy, (Pa) |
| F | Energy loss coefficient |
| Cf | Turbine Efficiency, 0.42 |
| $ | US dollar |
| m | Million |
| Greek Symbols | |
| Transmissivity | |
| Absorptivity | |
| Density (kg m−3) | |
| Relative Humidity | |
th | System efficiency Percentage thermal efficiency |
| Subscripts | |
| c | Convective heat transfer |
| gls | Glass |
| wtr | Water |
| ch | Chimney |
| cd | Condensed water |
| e | Evaporation |
| col | Collector |
| ent | Entrance |
| out | Outside |
| r | Radiative heat transfer |
| sky | Sky |
| abs | Absorber |
| air | Airflow |
| vap | The humid air resulted from spraying water on the dry air in the case of CT |
| Net | Net |
References
- Zhou, X.; Wang, F.; Ochieng, R.M. A review of solar chimney power technology. Renew. Sustain. Energy Rev. 2010, 14, 2315–2338. [Google Scholar] [CrossRef]
- Dhahri, A.; Omri, A. A review of solar chimney power generation technology. Int. J. Eng. Adv. Technol. 2013, 2, 1–17. [Google Scholar]
- Schlaich, J. The solar chimney: Electricity from the sun, Edition Axel Menges, Stuttgart, Germany, 1995. [2] ROBERT R. Span. Sol. Chimney Complet. MPS Rev. 1981, 6, 21–23. [Google Scholar]
- Xu, Y.; Zhou, X. Performance of a modified solar chimney power plant for power generation and vegetation. Energy 2019, 171, 502–509. [Google Scholar] [CrossRef]
- Khan, M.A.; Rehman, S.; Al-Sulaiman, F.A. A hybrid renewable energy system as a potential energy source for water desalination using reverse osmosis: A review. Renew. Sustain. Energy Rev. 2018, 97, 456–477. [Google Scholar] [CrossRef]
- Kiwan, S.; Al-Nimr, M.; Salam, Q.I.A. Solar chimney power-water distillation plant (SCPWDP). Desalination 2018, 445, 105–114. [Google Scholar] [CrossRef]
- Zuo, L.; Ding, L.; Chen, J.; Zhou, X.; Xu, B.; Liu, Z. Comprehensive study of wind supercharged solar chimney power plant combined with seawater desalination. Sol. Energy 2018, 166, 59–70. [Google Scholar] [CrossRef]
- Kiwan, S.; Al-Nimr, M.; Salim, I. A hybrid solar chimney/photovoltaic thermal system for direct electric power production and water distillation. Sustain. Energy Technol. Assess. 2020, 38, 100680. [Google Scholar] [CrossRef]
- Zandian, A.; Ashjaee, M. The thermal efficiency improvement of a steam Rankine cycle by innovative design of a hybrid cooling tower and a solar chimney concept. Renew. Energy 2013, 51, 465–473. [Google Scholar] [CrossRef]
- Miqdam, T.C.; Hussein, A.K. Basement kind effects on air temperature of a solar chimney in Baghdad-Iraq weather. Int. J. Appl. Sci. 2011, 2, 12–20. [Google Scholar] [CrossRef]
- Chantawong, P.; Hirunlabh, J.; Zeghmati, B.; Khedari, J.; Teekasap, S.; Win, M.M. Investigation on thermal performance of glazed solar chimney walls. Sol. Energy 2006, 80, 288–297. [Google Scholar] [CrossRef]
- Koonsrisuk, A.; Chitsomboon, T. Mathematical modeling of solar chimney power plants. Energy 2013, 51, 314–322. [Google Scholar] [CrossRef]
- Zuo, L.; Yuan, Y.; Li, Z.; Zheng, Y. Experimental research on solar chimneys integrated with seawater desalination under practical weather condition. Desalination 2012, 298, 22–33. [Google Scholar] [CrossRef]
- Li, J.-Y.; Guo, P.; Wang, Y. Preliminary investigation of a novel solar and wind energy extraction system. Proc. Inst. Mech. Eng. Part A J. Power Energy 2011, 226, 73–85. [Google Scholar] [CrossRef]
- Guo, P.; Li, T.; Xu, B.; Xu, X.; Li, J. Questions and current understanding about solar chimney power plant: A review. Energy Convers. Manag. 2019, 182, 21–33. [Google Scholar] [CrossRef]
- Nasraoui, H.; Driss, Z.; Kchaou, H. Novel collector design for enhancing the performance of solar chimney power plant. Renew. Energy 2020, 145, 1658–1671. [Google Scholar] [CrossRef]
- Zaslavsky, D. “Energy towers” For Producing Electricity and Desalinated Water without a Collector. In Proceedings of the 1999 ISES Solar World Congress, Jerusalem, Israel, 4–9 July 1999; pp. 79–91. [Google Scholar]
- Nizetic, S.; Ninic, N.; Klarin, B. Analysis and feasibility of implementing solar chimney power plants in the Mediterranean region. Energy 2008, 33, 1680–1690. [Google Scholar] [CrossRef]
- Zuo, L.; Zheng, Y.; Li, Z.; Sha, Y. Solar chimneys integrated with sea water desalination. Desalination 2011, 276, 207–213. [Google Scholar] [CrossRef]
- Abdelsalam, E.; Kafiah, F.; Tawalbeh, M.; Almomani, F.; Azzam, A.; Alzoubi, I.; Alkasrawi, M. Performance analysis of hybrid solar chimney–power plant for power production and seawater desalination: A sustainable approach. Int. J. Energy Res. 2021, 45, 17327–17341. [Google Scholar] [CrossRef]
- Tingzhen, M.; Wei, L.; Guoling, X.; Yanbin, X.; Xuhu, G.; Yuan, P. Numerical simulation of the solar chimney power plant systems coupled with turbine. Renew. Energy 2008, 33, 897–905. [Google Scholar] [CrossRef]
- Larbi, S.; Bouhdjar, A.; Chergui, T. Performance analysis of a solar chimney power plant in the southwestern region of Algeria. Renew. Sustain. Energy Rev. 2010, 14, 470–477. [Google Scholar] [CrossRef]
- Sangi, R.; Amidpour, M.; Hosseinizadeh, B. Modeling and numerical simulation of solar chimney power plants. Sol. Energy 2011, 85, 829–838. [Google Scholar] [CrossRef]
- Sakonidou, E.; Karapantsios, T.; Balouktsis, A.; Chassapis, D. Modeling of the optimum tilt of a solar chimney for maximum air flow. Sol. Energy 2008, 82, 80–94. [Google Scholar] [CrossRef]
- Arce, J.; Jiménez, M.; Guzmán, J.D.D.; Heras, M.; Alvarez, G.; Xamán, J. Experimental study for natural ventilation on a solar chimney. Renew. Energy 2009, 34, 2928–2934. [Google Scholar] [CrossRef]
- Guo, P.-H.; Li, J.-Y.; Wang, Y. Annual performance analysis of the solar chimney power plant in Sinkiang, China. Energy Convers. Manag. 2014, 87, 392–399. [Google Scholar] [CrossRef]
- Hamdan, M.O. Analysis of a solar chimney power plant in the Arabian Gulf region. Renew. Energy 2011, 36, 2593–2598. [Google Scholar] [CrossRef]
- Sangi, R. Performance evaluation of solar chimney power plants in Iran. Renew. Sustain. Energy Rev. 2012, 16, 704–710. [Google Scholar] [CrossRef]
- Asnaghi, A.; Ladjevardi, S. Solar chimney power plant performance in Iran. Renew. Sustain. Energy Rev. 2012, 16, 3383–3390. [Google Scholar] [CrossRef]
- Abdelmohimen, M.A.; Algarni, S.A. Numerical investigation of solar chimney power plants performance for Saudi Arabia weather conditions. Sustain. Cities Soc. 2018, 38, 1–8. [Google Scholar] [CrossRef]
- Okoye, C.O.; Taylan, O. Performance analysis of a solar chimney power plant for rural areas in Nigeria. Renew. Energy 2017, 104, 96–108. [Google Scholar] [CrossRef]
- El-Haroun, A.A. Performance Evaluation of Solar Chimney Power Plants in Egypt. 2012. Available online: www.ijopaasat.in (accessed on 26 November 2020).
- Ahmed, M.R.; Patel, S.K. Computational and experimental studies on solar chimney power plants for power generation in Pacific Island countries. Energy Convers. Manag. 2017, 149, 61–78. [Google Scholar] [CrossRef]
- Abdelsalam, E.; Kafiah, F.; Alkasrawi, M.; Al-Hinti, I.; Azzam, A. Economic Study of Solar Chimney Power-Water Distillation Plant (SCPWDP). Energies 2020, 13, 2789. [Google Scholar] [CrossRef]
- Okoye, C.O.; Atikol, U. A parametric study on the feasibility of solar chimney power plants in North Cyprus conditions. Energy Convers. Manag. 2014, 80, 178–187. [Google Scholar] [CrossRef]
- Li, J.-Y.; Guo, P.; Wang, Y. Effects of collector radius and chimney height on power output of a solar chimney power plant with turbines. Renew. Energy 2012, 47, 21–28. [Google Scholar] [CrossRef]
- Fluri, T.; Pretorius, J.; Van Dyk, C.; Von Backström, T.; Kröger, D.; van Zijl, G. Cost analysis of solar chimney power plants. Sol. Energy 2009, 83, 246–256. [Google Scholar] [CrossRef]
- Al-Dabbas, A.M. A performance analysis of solar chimney thermal power systems. Therm. Sci. 2011, 15, 619–642. [Google Scholar] [CrossRef]
- Dehghani, S.; Mohammadi, A.H. Optimum dimension of geometric parameters of solar chimney power plants—A multi-objective optimization approach. Sol. Energy 2014, 105, 603–612. [Google Scholar] [CrossRef]
- Cao, F.; Ma, Q.; Zhao, L.; Guo, L. Design and simulation of a novel geothermal solar combined chimney power plant. In Proceedings of the 26th International Conference on Efficiency, Cost, Optimization, Simulation and Environmental Impact of Energy Systems (ECOS 2013), Guilin, China, 15–19 July 2013; Volume 84, pp. 186–195. [Google Scholar]
- Koju, S.M. Thermal behaviour of expanded polystyrene based lightweight concrete sandwich panel at various temperatures. J. Sci. Eng. 2017, 4, 47–52. [Google Scholar] [CrossRef][Green Version]
- Mukherjee, G.S.; Saraf, M.N. Studies on a fiber reinforced plastics honeycomb structure. Polym. Compos. 1994, 15, 217–222. [Google Scholar] [CrossRef]
- Lai, C.-M.; Hokoi, S. Thermal performance of an aluminum honeycomb wallboard incorporating microencapsulated PCM. Energy Build. 2014, 73, 37–47. [Google Scholar] [CrossRef]
- Salameh, T.; Ghenai, C.; Merabet, A.; Alkasrawi, M. Techno-economical optimization of an integrated stand-alone hybrid solar PV tracking and diesel generator power system in Khorfakkan, United Arab Emirates. Energy 2020, 190, 116475. [Google Scholar] [CrossRef]
- Li, W.; Wei, P.; Zhou, X. A cost-benefit analysis of power generation from commercial reinforced concrete solar chimney power plant. Energy Convers. Manag. 2014, 79, 104–113. [Google Scholar] [CrossRef]
- Tawalbeh, M.; Al-Othman, A.; Kafiah, F.; Abdelsalam, E.; Almomani, F.; Alkasrawi, M. Environmental impacts of solar photovoltaic systems: A critical review of recent progress and future outlook. Sci. Total Environ. 2021, 759, 143528. [Google Scholar] [CrossRef] [PubMed]
Publisher’s Note: MDPI stays neutral with regard to jurisdictional claims in published maps and institutional affiliations. |
© 2021 by the authors. Licensee MDPI, Basel, Switzerland. This article is an open access article distributed under the terms and conditions of the Creative Commons Attribution (CC BY) license (https://creativecommons.org/licenses/by/4.0/).