Article

Electric Vehicles Charging Management Using Machine Learning Considering Fast Charging and Vehicle-to-Grid Operation

1
Department of Electrical Engineering, Qatar University, Doha 2713, Qatar
2
Department of Computer Science and Engineering, Qatar University, Doha 2713, Qatar
*
Author to whom correspondence should be addressed.
Energies 2021, 14(19), 6199; https://doi.org/10.3390/en14196199
Submission received: 21 August 2021 / Revised: 12 September 2021 / Accepted: 22 September 2021 / Published: 28 September 2021
(This article belongs to the Section E: Electric Vehicles)

Abstract

:
Electric vehicles (EVs) have gained in popularity over the years. The charging of a high number of EVs harms the distribution system. As a result, increased transformer overloads, power losses, and voltage fluctuations may occur. Thus, management of EVs is required to address these challenges. An EV charging management system based on machine learning (ML) is utilized to route EVs to charging stations to minimize the load variance, power losses, voltage fluctuations, and charging cost whilst considering conventional charging, fast charging, and vehicle-to-grid (V2G) technologies. A number of ML algorithms are contrasted in terms of their performances in optimization since ML has the ability to create accurate future decisions based on historical data, which are Decision Tree (DT), Random Forest (RF), Support Vector Machine (SVM), K-Nearest Neighbours (KNN), Long Short-Term Memory (LSTM) and Deep Neural Networks (DNN). The results verify the reliability of the use of LSTM for the management of EVs to ensure high accuracy. The LSTM model successfully minimizes power losses and voltage fluctuations and achieves peak shaving by flattening the load curve. Furthermore, the charging cost is minimized. Additionally, the efficiency of the management system proved to be robust against the uncertainty of the load data that is used as an input to the ML system.

1. Introduction

Electric vehicles (EVs) have become an integral part of the automobile industry. EV sales reached 2.1 million in 2019, continuing the mean 40% yearly increase in EV sales [1]. Furthermore, EV chargers have become a part of the global infrastructure, with 7.3 million chargers worldwide in 2019 and a 60% increase in the number of public charging stations in 2019 compared to 2018 [1]. In addition, global EV sales are expected to reach 43 million by 2030, making up 30% of all vehicles, excluding two-wheeled vehicles [2], which can be attributed to the development of technologies for fast charging, such as improved DC-DC converters [3,4]. Due to the high momentum of electrification of vehicles, the proper management of EVs is imminently required to protect the distribution grid from transformer overloads, voltage fluctuations and power losses, especially due to the high operating costs of EVs with the current infrastructure compared to regular internal combustion engine vehicles [5].
The large demand on the use of EVs causes substantial strain of the distribution grid due to the large power demands during the charging process of such vehicles. Additionally, such demand is expected to increase, with the increasing use of EVs as more methods of decreasing operating costs for users are explored through different driving techniques [6]. The increase in EVs’ penetration leads to an increase in the power utilized during the charging of EVs. Higher EV penetration shifts the load curve upwards, which increases the power load on the components of the distribution grid such as the transformer. Thus, a powerful and effective management solution is needed to allow the distribution grid to deliver power with high efficiency and reliability. Apple Inc. has released an EV routing solution that takes into consideration the battery’s requirement to be charged only and routes the EV to the nearest charging station accordingly [7]. However, the requirements of the distribution grid and the negative effect of charging the EV on the grid are not taken into consideration.
In this paper, an EV managing and routing solution is presented for optimizing the operation of the distribution grid, considering conventional charging, fast charging and vehicle-to-grid (V2G) technologies. A variety of machine learning (ML) algorithms are assessed and the highest performing ML algorithm is used in the creation of the system that optimizes the performance of the power grid. The system aims to minimize voltage fluctuations, power losses and transformer loading. Further, the system will work on minimizing the charging cost. Different ML techniques were utilized to compare their performances and reliability for the optimization of the distribution grid and the charging cost. The ML techniques used in this paper are Decision Tree (DT), Random Forest (RF), Support Vector Machine (SVM), K-Nearest Neighbours (KNN), Deep Neural Networks (DNN) and Long Short-Term Memory (LSTM).
Moreover, this paper provides a ML-based solution for the managing and routing of a fleet of EVs. The major contributions of the paper are:
  • We present an EV charging management system that considers the use of conventional charging, fast charging and V2G technologies, with a high degree of robustness against the load data uncertainty that may occur with the input data of the ML system to ensure reliability and effectiveness.
  • We conduct a performance assessment on the use of different ML techniques for managing the charging and routing of a fleet of EVs and utilize the highest performing ML algorithm as an optimization technique, as well as minimize load variance, power losses, voltage fluctuations and charging cost.
Section 2 reviews the past literature. Section 3 explores the different ML algorithms. Section 4 formulates the optimization problem and investigates the model of the system and its parameters. Section 5 discusses the use of ML for the management of EVs. Section 6, Section 7 and Section 8 present the results. Next, Section 9 and Section 10 conclude the paper and present prospective future work, respectively. Finally, Nomenclature lists the nomenclature and symbols used in the paper.

2. Related Work

This paper is connected to two main research categories, namely the managed charging of EVs and ML techniques, which are reviewed in the upcoming subsections.

2.1. Managed Charging of Electric Vehicles

Many studies have been conducted showing the negative impact of the uncoordinated charging of EVs on the distribution grid. Clement-Nyns et al. [8] and Karmaker et al. [9] studied the impact of charging EVs on the grid. It is seen that the instant charging of EVs, without coordination, at large scales causes large voltage deviations and power losses. In addition, Clement-Nyns et al. [8] demonstrate that such effects can be more adverse when EV penetration levels increase. Karmaker et al. [9] also reveal that despite the possible use of renewable energy to mitigate such disadvantages, problems still occur when no proper regulation of power quality takes place.
Yilmaz and Krein [10] and Habib et al. [11] reviewed the use of V2G technologies to mitigate the risk of charging EVs on the distribution grid. It is signified that the V2G technologies can help in improving the efficiency, stability and reliability of the grid. Additionally, according to Yilmaz and Krein [10], the advantages of V2G technologies include the regulation of power, load balancing and current harmonics filtering. However, V2G technologies can cause the deep discharging of EVs. This comes at a cost in the form of battery degradation in EVs, which decreases the battery’s lifetime and, in turn, decreases customer satisfaction. As a result, it is not considered as the most ideal solution as only the power grid is taken into consideration, without examining the user’s point of view.
Moreover, Lunz et al. [12] reviewed the impact of different charging strategies on the costs of charging and battery degradation. Different charging strategies were tested, including uncoordinated charging, unidirectional charging and bidirectional charging. It was seen that the use of intelligent charging strategies can greatly increase battery lifetime and decrease charging and battery degradation costs simultaneously, especially with the use of time of use electricity pricing strategies.
Clairand et al. [13] researched the coordinated charging of EVs taking into consideration the user. The optimization model aims to minimize the cost with constraints for the power system’s limitations. The system’s benefits become more prominent as EV penetration levels increase and the charging cost differences can reach up to 50%, compared to the uncoordinated charging of EVs. However, the system needs the installation of smart meters to be able to collect real-time data regarding the charging of EVs and fast charging is not considered.
In addition, Clairand et al. [14] investigated the charging of EVs with the high penetration of renewable energy, which can pose great challenges due to the high energy requirements for charging of EVs and possible instability of renewable energy generation. The results of the charging scheme showed significantly decreased costs, with up to 8% decreases compared to the uncoordinated charging case. Furthermore, carbon dioxide emissions are greatly decreased, providing a more environmentally friendly solution to EV charging.
Similar to Clairand et al. [14], Fanti et al. [15] researched the use of renewable energy, energy storage systems and electric vehicles to synthesize an optimal energy management system. The authors utilized a linear programming problem to maximize the use of the day ahead purchased energy and to minimize the real-time additional costs. The case study performed on three buildings using the proposed system successfully decreased the energy costs and increased the reliability of the grid. Another home energy management system was proposed by Amer et al. [16], where a multiobjective optimization problem was formulated for the optimization of the scheduling of a number of loads and supplies based on different pricing schemes. The results showed that the system can minimize energy costs and meet customer demand, as well as minimize the loss of life of the transformer for the utility operator.
Much research has been conducted on the utilization of a number of optimization techniques such as quadratic programming and dynamic programming. Sortomme et al. [17] worked on minimizing distribution system losses using heuristic or sequential methods. The developed method showed that the minimization of the load variance is more practical than the minimization of the losses as it provides the same overall result in a smaller time period. Additionally, it is independent of the system topology used and can be utilized for all distribution grids.
Similar to Sortomme et al. [17], Deilami et al. [18] studied the minimization of power losses and the improvement of the voltage profile in a real-time coordination system, which was built upon the minimization of the total cost of energy generation and power losses. The algorithm used the maximum sensitivities selection optimization technique and assumes the random plugging in of EVs. The real-time system is able to improve the efficiency of the distribution grid and reduces the system overload.
Similarly, Jian et al. [19] researched the optimization of the load variance in a single household microgrid. Quadratic programming is used to minimize the load variance in a single household microgrid. The system is seen to have a positive impact on the overall distribution grid as the load variance of every household is minimized, which, in turn, minimizes the load variance of the distribution grid. However, some parameters were considered to be known, such as the load curve, which might not be realistic in real-life applications and slightly reduces the effectiveness of the system.
Furthermore, Masoum et al. [20] also proposed an EV coordinated charging method based on peak shaving to minimize power losses and enhance the voltage profile. The system also considered the preferred charging time for users through a priority selection scheme. The system was able to achieve a reduced peak demand and increased the efficiency of the power grid.
Ma et al. [21] considered the coordinated charging of a large number of EVs in a decentralized topology system. The proposed system is based on non-cooperative games. The system works on minimizing the cost of generating electricity by filling the valley in a load curve and decreasing the peak-to-valley difference. The main benefit of such a system is that the constant communication between EVs and centralized control cannot be achieved. Nevertheless, the formulated optimization problem minimizes electricity costs and fully charges EVs, and factors such as power losses and voltage fluctuations are not examined. Additionally, the system considers other loads, not EVs, to be predictable, which might not be the case in real-life situations.
Another solution to the coordination of EVs is the use of scheduling algorithms. Iacobucci et al. [22] researched the scheduled charging of EVs using two parallel control optimization algorithms. The first algorithm wa utilized over long time scales to minimize wait times and charging costs. The second algorithm optimizes the routing of EVs over short time scales to minimize wait times. A case study was run to test the model, where it decreased charging costs significantly, whilst having little effect on wait times. Additionally, the model can provide higher cost savings in cases of high price variance. Nevertheless, EVs are assumed to be able to charge as soon as they arrive and it is assumed that a charger will always be available, which might not always be the case in terms of public charging stations.
Additionally, Liu et al. [23] considered the utilization of an aggregative game model for scheduling the charging of EVs. The game model was used to model the impact of EV charging demands on the electricity price, and quadratic programming was employed to find the equilibrium of the game model. A Nash equilibrium was proved to exist and the day ahead EV charging schedule was successfully created. Additionally, the model is shown to be able to cope with the random nature of EV charging. Nevertheless, the model assumes a constant charging rate and the use of V2G technologies is not examined.
Rezaei et al. [24] studied the energy management of hybrid EV batteries through the minimization of the energy consumption using the catch energy saving opportunity method. In addition, the system considers both charging and discharging for EV batteries. However, such a method provides a solution for the user requirements but fails to take into consideration the requirements of the distribution grid and its constraints.
Wei et al. [25] examined the use of a park and charge system with the main objective of minimizing the battery degradation cost. Moreover, the system is modelled with constraints pertaining to the user and the charging company as well. Firstly, the battery degradation cost is minimized, and then the charging cost is minimized, which were both seen to be achieved in the results obtained from the system. The main drawback of the system is the assumption of a maximum capacity of eight EVs, which can be considered a small number of EVs for a commercial charging station.
To add to this, Chaudhari et al. [26] proposed the prediction of electricity usage using an agent-based model, based on parameters such as initial and final states of charge, charging duration, charging station location, etc., to coordinate the charging of EVs. Several whole day simulations were used to test the model and provided reliable results, which can be attributed to the consideration of the influence of human behavior on the charging demand of EVs. The system uses charging stations that have both fast and slow charging options, but the use of V2G is not examined.
Moreover, Azizipanah-Abarghooee et al. [27] studied the enhancement of power flow in a distribution grid using EVs. The system uses a fuzzy logic controller for the charging and discharging of EVs. In order to optimize the operation cost, a new algorithm is created. The algorithm proves its usefulness in minimizing charging costs with high efficiency. However, single charging rates are studied; therefore, the utilization of fast and conventional charging concurrently is not examined.
Zhang et al. [28] showed the coordination of EVs for single output multiple charging spots. Stochastic programming is used to minimize the annual costs and probabilistically simulate the coordinated charging of the EVs to check the influence of the charging on the charging station. The system improves the operating costs of EVs and profitability of charging stations. Furthermore, the system considers the need for a few emergency fast charging sockets in the case of users needing to leave before the calculated departure time. Nonetheless, the method does not review factors such as power losses and voltage fluctuations.
In addition, Wang et al. [29] investigated the massive EV charging, with the utilization of renewable energy. A two-stage method is formulated which predicts future energy requests, and the charging rate of EVs is coordinated and has an algorithm to reduce the complexity of finding the solution. The system was able to reduce energy costs and the peak-to-valley difference. Additionally, the fluctuating power produced by renewable energy sources does not significantly impact the system’s performance. However, like the work conducted by Zhang et al. [29], the minimization of power losses and voltage fluctuations is not examined.
The major disadvantage of the aforementioned research is the utilization of optimization techniques such as dynamic programming, quadratic programming, etc., for optimizing the operation of the power grid and the user requirements. The use of such techniques requires careful and time-consuming problem formulation and solving procedures. In this paper, ML is used as an optimization technique, which is less complex in its usage. ML only requires having an appropriate dataset and then ML algorithms function automatically, with the exception of tuning hyperparameters, which is based on heuristics and trial and error. Therefore, the formulation of complex equations and optimization constraints is not needed. In addition, transfer learning can be utilized for transferring ML models for different applications to be used for the desired application with a few modifications.
The proposed system in this paper focuses on managing the charging of EVs by optimizing the voltage profile, the power losses, the transformer loading and the charging cost using ML, which will, in turn, reduce power overloads in the grid and enhance the voltage profile of the grid. Thus, the system takes into consideration both the distribution system constraints and the satisfaction of the user.
Essentially, the distinction between the method in this paper and previous research is that it uses ML as an optimization technique to manage the charging of a fleet of EVs, while considering both the distribution grid and user demands and utilizing conventional charging, fast charging and V2G technologies.

2.2. Machine Learning Techniques

The use of ML algorithms has been studied extensively for lots of applications in the literature. Mayoraz and Alpaydin [30] assessed the use of SVM for multiclass classification problems. Different normalization techniques were utilized to be able to scale up the algorithm to work well for problems with more than two classes. The work showed the possibility of scaling the algorithm with different normalization methods and its high overall accuracy for multiclass classification.
Moreover, Murthy et al. [31] examined the use of DNN for multiclass image classification. The proposed algorithm was generic and is not limited to specific applications. A DNN was able to ensure improved performance in identifying classes, including hard to identify and confusing classes, which are usually not correctly classified using other ML techniques.
Furthermore, Ma et al. [32] studied the use of the LSTM algorithm for predicting traffic speed. LSTM was able to achieve the best regressive predictions in both accuracy and stability when compared to other algorithms that were tested. As a result, it is verified that LSTM is one of the leading algorithms for regression, especially when related to time series. Additionally, LSTM can be further advanced to be used for classification problems by setting classes based on specific numeric intervals.
Deligiannis et al. [33] investigated the use of RF for the prediction of energy consumption and power demand. RF was highly accurate and easy to use. The energy consumption prediction had a low mean absolute percentage error with a value of 16%, which was significantly better than the autoregressive model.
For the management of a fleet of EVs, a multiclass classification problem was created. Therefore, a number of ML techniques that offered the highest accuracies for similar classification problems in the past literature were utilized. Subsequently, the accuracies of every model was found to examine the performance of the different models and their validity for optimizing the functioning of the distribution network.

3. Machine Learning Techniques Theory

In this paper, six ML algorithms are utilized, which are DT, RF, DNN, KNN, SVM and LSTM. An outline of each algorithm is given in the following subsections. The different ML algorithms are compared in terms of performance and capability to be used as an optimization technique for the management of EV charging. Table 1 provides a summary of the pros and cons of each technique.

3.1. Decision Tree

The DT algorithm works on finding a tree with branches and leaves, where the branches represent features and leaves represent the final output. In the training phase, the dataset is split into subsets that are used in the creation of the tree [34]. DT can work with categorical and numeric data; thus, it can be utilized for regression and classification problems. It is known to be highly valuable when values are missing in a dataset so it is commonly used for a number of applications.
The function for the decision tree is produced through the recursive branching of nodes during the training process to create decision nodes, which have the most precise and pure nodes for finding the output. The input decides the branches that are going to be used for finding the output or the final prediction.

3.2. Random Forest

RF is a ML algorithm that is based on DT. Therefore, like DT, it can be utilized for both regression and classification. RF works by finding a number of DTs, instead of a single DT. Thus, RF creates a number of classifiers or regressors, which have a tree structure [35].
For regression, the final output is based on the mean of the output of all the singular trees, while, for classification, the final output is the mode of the output of all the singular trees. Consequently, RF works by voting or averaging the most appropriate class predicted by the distinct trees.

3.3. Support Vector Machine

During the training phase, SVM calculates a line or a hyperplane. The line or the hyperplane separates points of distinct classes. SVM works on finding the most appropriate optimal line or hyperplane [34].
SVM utilizes support vectors, which are points nearest to the line or the hyperplane to find the margin, which is the Euclidean distance between the support vectors and the line or hyperplane, and aims to maximize it to calculate the optimal line or hyperplane. Thus, the SVM algorithm can be described as an optimal margin classifiers problem. As a result, the line or hyperplane is a boundary between the distinct classes. The output is based on which class area the input point is in.
A higher dimension is added if data are not linearly separable such that the data become linearly separable. After that, with the use of mathematical transformations, the decision boundary is transformed back into the original dimension [34].

3.4. K-Nearest Neighbors

KNN supposes that similar things are in close proximity to each other, meaning that the output depends on how close the input is to data used in the training of the model. It has the ability to deal with categorical and numeric data so it can be used for both regression and classification.
In classification, the output is the modal class of the K points nearest to the input. In regression, the output is the average of the values of the K points nearest to the input [34].

3.5. Deep Neural Networks

DNN is a type of extreme learning machine technique. It is based on deep learning, which is an ML procedure that trains a model made from different layers. The number of layers used in a model is determined by the developer and as the number of layers increases, it is said to be a deeper model.
There are three distinct types of layers that are known as the input layer, the hidden layers and the output layer. The input layer is made of the input data and the output layer is made of the output data or the class. The hidden layers perform different non-linear mathematical operations that determine how to proceed from one layer to the next. Every layer contains a set of neurons that connect each layer to the next [31,33].
Weights are assigned to the connections between neurons, which regulate the importance of every connection. As a result, the weight determines the influence of the output of each neuron on the input of the next neuron [34].
Furthermore, an activation function is created for every neuron. The activation function should be non-linear, to evaluate complex functions, and differentiable, to allow back propagation. The process becomes iterative until the output layer is reached and a specific class is predicted. Finally, the final output of the model is given [36].

3.6. Long Short-Term Memory

In LSTM, the output is put into the neural network until a final output is reached. LSTM has the same types of layers. The input is placed in the neural network and goes through the network until the final output is found. Then, the output is placed back into the network. Therefore, this is utilized for the modelling of time-dependent data [34].
LSTM can be used to deal with the vanishing gradient issue found in recurrent neural networks. This is achieved by decreasing the number of times gradients below zero are multiplied, which makes it extremely helpful for applications involving long-term memory. An internal memory state is integrated alongside the processed input, which reduces the influence of the product of small gradients. Additionally, a forget gate is utilized to choose some states to be recalled, while others are annulled. As a result, the influences of preceding inputs and time dependence are regulated. In addition, input gates and output gates are used in LSTM cells [34].

4. Problem Formulation

The management of a fleet of EVs to optimize the performance of the distribution system and the user’s experience can be achieved through the minimization of the load variance, the power losses, the voltage fluctuations and the charging cost. As a result, the optimization problem can be set in mathematical terms. In the optimization problem, the whole day is split into T time intervals, and every time interval is represented as Δ t . In addition, every EV is assumed to connect and disconnect in distinct time intervals.

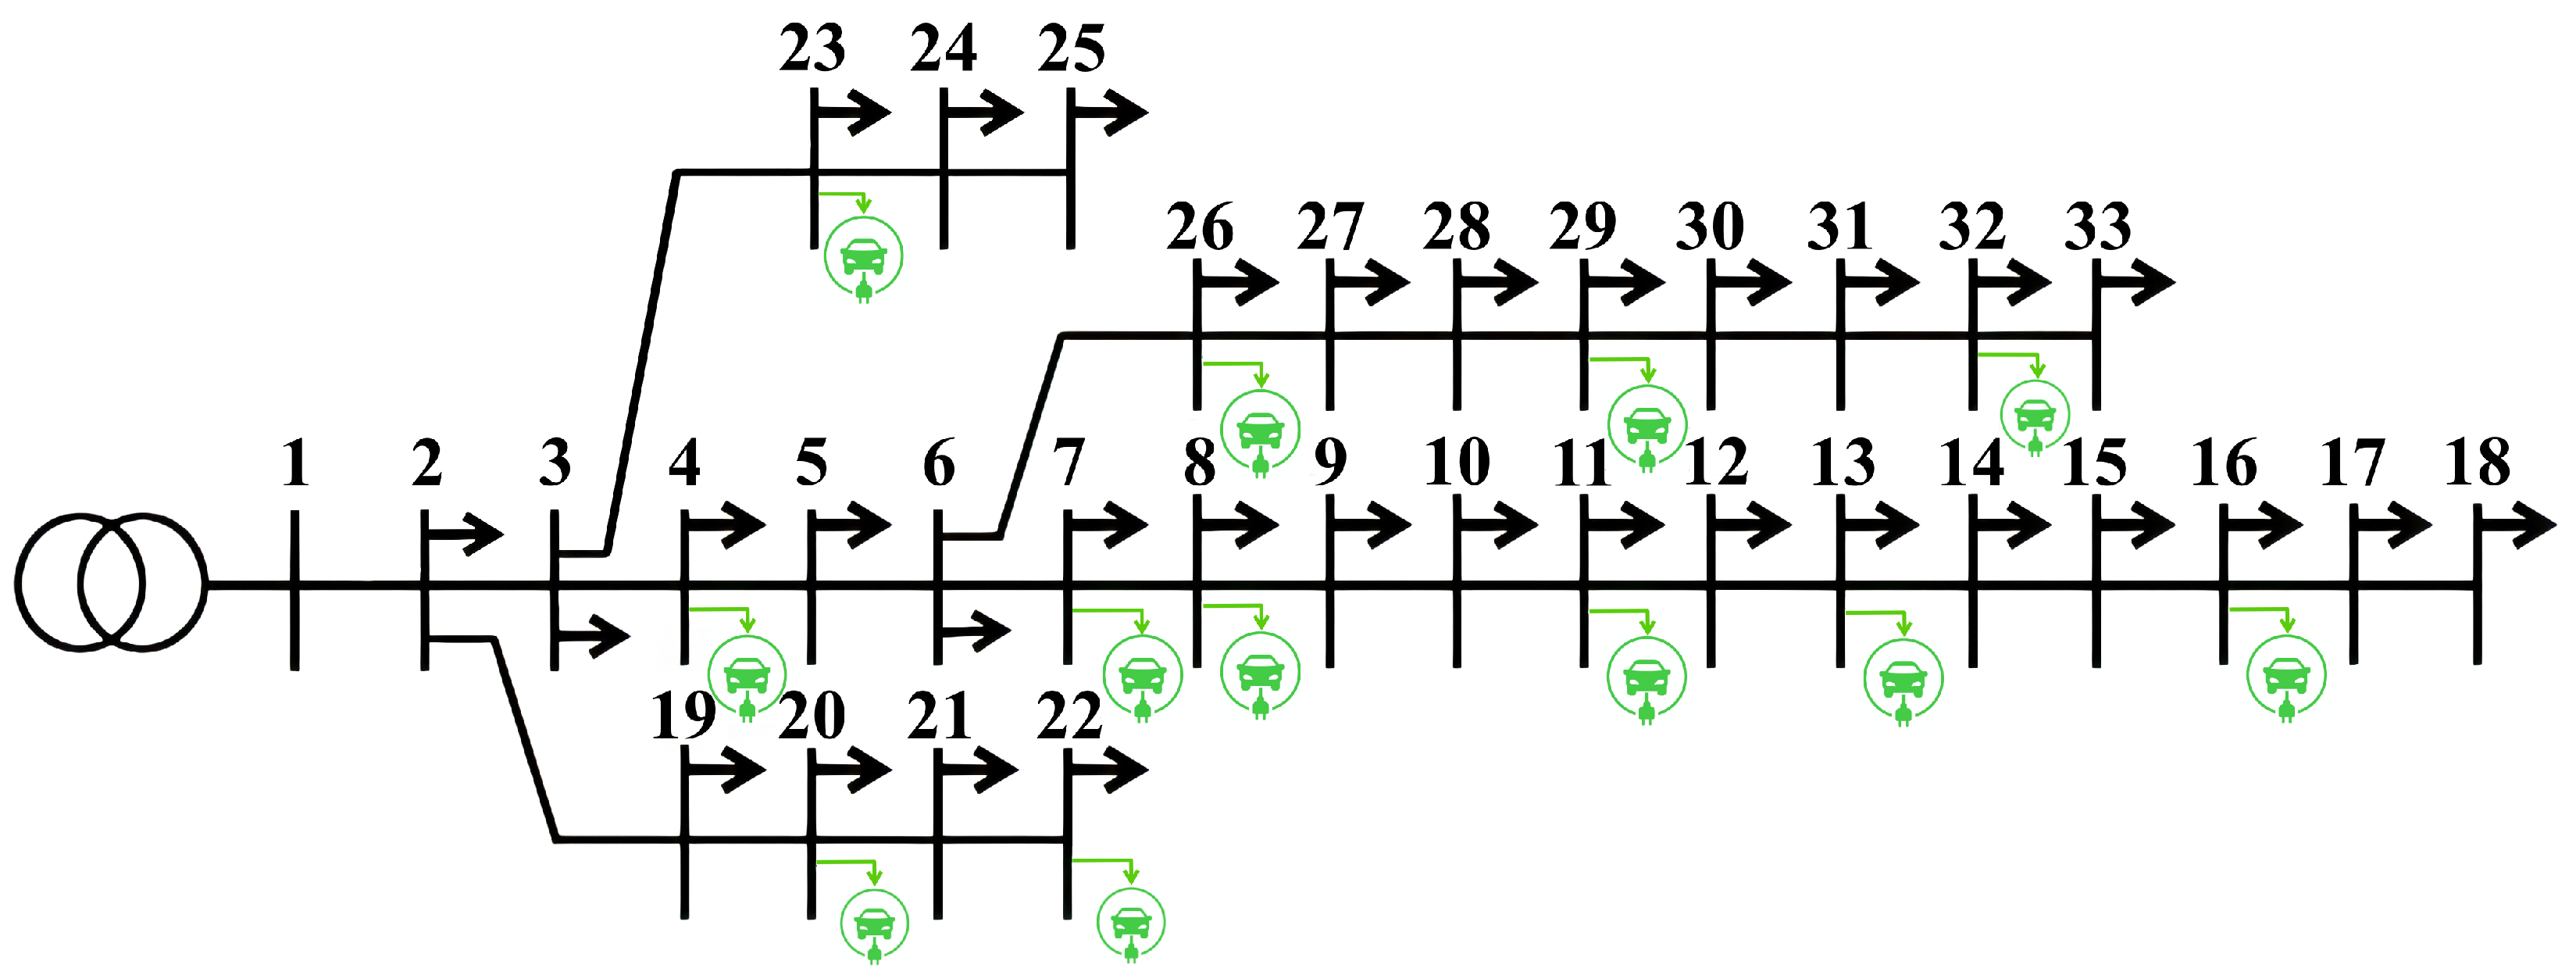
4.1. System Model and Parameters

Figure 1 reveals the employed modified IEEE 33-bus distribution system for the system model.
The model is made from a 33-bus network connected to a power substation. Additionally, some buses have a commercial charging station for EVs. Each charging station has a maximum capacity of 35 EVs. The charging power for conventional charging is 7 kW and the charging power for fast charging is 22 kW. Baran and Wu [37] display the line data of the employed IEEE 33-bus distribution system.

4.2. Optimization of Load Variance

The minimization of the load variance causes the flattening of the load curve. This leads to the increase in power quality and the decrease in voltage fluctuations. Further, the distribution system will not have overloads and the substation transformer would be preserved.
The minimization of the load variance can be described in mathematical terms as an objective function, as seen in (1).
m i n 1 T t = 1 T P t B + n = 1 N e = 1 E P n , t C μ T D 2
In order to stabilize the distribution grid and ensure overloads are not occurring, the total power demand should always be below the total power that can be supplied by the main transformer, as seen in (2). Additionally, the power needed to operate any charging station should always be below the maximum power that can be provided by that charging station and the state of charge of any EV should be between its minimum and maximum allowed state of charge, as seen in (3) and (4). Thus, the optimization problem is constrained by (2)–(4).
P t B + n = 1 N e = 1 E P n , t C P m a x , t D ( t = 1 T )
P m a x , n , t C P n , t C P m a x , n , t C ( t = ι e , n i ι e , n f ; n = 1 N ; e = 1 E )
S o C m i n , e , n S o C e , n , t S o C m a x , e , n ( t = ι e , n i ι e , n f ; n = 1 N ; e = 1 E )
Equation (5) defines the function for the sign of the charging power.
s n n , t = 1 P n , t C 0 1 P n , t C < 0 ( t = ι e , n i ι e , n f ; n = 1 N ; e = 1 E )
Equations (6) and (7) show how the energy provided for each EV is calculated and describe how the mean operation power of the distribution system is calculated, respectively. Equation (8) is utilized for the calculation of the states of charge of the EVs.
t = ι e , n i ι e , n f ( η n C ) t , e , n s n P n , t C Δ t = Δ W e , n = W e , n f W e , n i ( n = 1 N ; e = 1 E )
μ T D = 1 T t = 1 T P t B + n = 1 N e = 1 E P n , t C
S o C e , n , t   =   W e , n i + P n , t C ( η n C ) t , e , n s n Δ t Q e , n t = ι e , n i S o C e , n , t 1 + P n , t C ( η n C ) t , e , n s n Δ t Q e , n t = ι e , n i + 1 , . . . , ι e , n f ( n = 1 N ; e = 1 E )

4.3. Optimization of Power Losses and Voltage Profile

Additionally, in order to improve power quality and improve the voltage profile, the power losses in the distribution system should be minimized. The objective function for the minimization of power losses is illustrated in (9).
m i n b = 1 B ( I b , b + 1 , t ) 2 R b , b + 1
The solution for finding the currents in each line can be found automatically using MATLAB as a load flow problem for a radial distribution system.
Power losses are directly associated with the voltage profile. Consequently, the minimization of power losses will, accordingly, improve the voltage profile and minimize voltage fluctuations.

4.4. Optimization of Charging Cost

To fully manage the charging of EVs, both the distribution system and user requirements should be taken into consideration. Thus, to enhance the experience of the user, the charging cost should be minimized. Equation (10) describes the objective function for minimizing the charging cost. It should be noted that the charging cost is minimized in relation to the optimization of the load variance and power losses, in the case where the user follows the suggested charging scheme.
m i n ι e , n i ι e , n f C ( t ) Δ W e , n d t
Figure 2 illustrates the cost function curve for a day [38].

5. Machine Learning for Electric Vehicles Fleet Management

The presented system in this paper uses ML as an optimization technique to route EVs to be charged at suitable charging stations with suitable charging speeds (conventional charging, fast charging or discharging), in order to optimize the distribution network operation. Therefore, it is utilized to minimize load variance, power losses and voltage fluctuations. Additionally, the system considers the user’s requirements by minimizing the charging cost as well.
Depending on the time and load usage of the different buses in the network, ML accurately routes EVs to available charging stations and finds the most appropriate charging speed to optimize the performance of the distribution grid. Additionally, it also provides the minimum charging cost for the user.

5.1. Limitations of Machine Learning

The stochasticity of ML is the main limitation of the system. Every time ML algorithms are run, accuracy results may fluctuate slightly and their accuracy cannot be predicted with high precision. However, in order to mitigate this limitation, the algorithms are run ten times and cross validation is used to ensure that the techniques have a high enough accuracy with a small standard deviation.
Another limitation of utilizing ML is based on the accuracy of the dataset used when training the different ML models. The values in the dataset should be accurate to ensure that the ML model is trained effectively to create a precise and potent model. Furthermore, the size of the dataset should be large and comprehensive to have enough data entries to train the ML technique reliably and to test the model for its accuracy.

5.2. Dataset Description

The load data dataset [39] utilized in training contains 52,560 data entries, derived from a dataset of power usage of a residential area in the United States [40]. Each datum contains the date and time (as four attributes: month, day, hour and minute), power load of buses with charging stations and the total power load of the distribution system, which are the inputs of the ML model. In addition, each datum also includes the charging station class and the power class, which are the outputs of the model. The time step between consecutive data entries is 10 min for a year.

5.3. Machine Learning Model Parameters

The independent variables in the model, which are the inputs, are the date and time, power load of the buses with charging stations and total power usage and the dependent variables, which are the outputs, are the charging station classification and the power classification.
The model consists of 19 parameters for every data record. The description of every parameter is as follows:
  • Month: A numeric integer between 1 and 12, depending on the month.
  • Day: A numeric integer between 1 and 31, depending on the day of the month.
  • Hour: A numeric integer between 0 and 23. A 24 h clock format is used.
  • Minute: A numeric integer between 0 and 50. Values in the dataset are multiples of 10 as the time step is 10 min.
  • Bus power Load: 12 parameters containing numeric values reflecting the power loads of every bus with a charging station in kW.
  • Total power load: A numeric value of the power load of all the buses in kW.
  • Charging station: A categorical data attribute, which is a class output of the model. Values are the numbers of the buses with charging stations.
  • Charging speed: A categorical data attribute, which is a class output of the model. Values are high, normal and low.

6. Machine Learning Models: Results and Discussion

To evaluate the presented approach in this paper, a modified IEEE 33-bus distribution system was utilized, as seen in Figure 1, with the aforementioned power load dataset [39]. JupyterLab was utilized to create and train the different ML models and test their classification accuracies. MATLAB was used to simulate the distribution network and calculate the power losses and the voltages of the different buses throughout one day.
The results for charging stations and speed classification give an idea on how well the ML models perform their respective functions. For the classification problems, the confusion matrices of the ML models are used for finding the accuracy of the different ML models classifying the unlabelled data.

6.1. Charging Station Classification Results

The charging station classification consists of twelve classes, which represent the different charging stations in the distribution system. Table 2 represents the accuracies of the different models for routing EVs to the most appropriate charging stations to optimize the performance of the distribution network and the charging cost.
As seen in Table 2, SVM and KNN provide extremely low accuracy values, which shows the impracticality of using such model for the routing of EVs. Additionally, the most accurate models are RF and LSTM, with an equal accuracy of 95%. DT is closely on par with RF and LSTM with an accuracy result of 94%. Finally, DNN provides a moderate accuracy value of 78%. However, its results may be enhanced by increasing the size of the datasets and tuning its hyperparameters, such as the number of layers and the number of nodes per layer. These results can be attributed to the known high performance of RF and LSTM for multiclass classification problems, compared to other algorithms such as SVM and KNN.

6.2. Charging Speed Classification Results

The charging speed classification is made up of three classes, which are the different charging options in the charging stations (fast charging, conventional charging and V2G). Table 3 shows the accuracies of the ML models for predicting the most appropriate charging speed.
Table 3 shows that only SVM provides extremely low-accuracy results. DT, KNN and DNN show moderate accuracies of 84%, 84% and 85%, respectively. The models which supply the most accurate results are RF and LSTM. However, LSTM predicts the most appropriate charging speeds, with a higher accuracy compared to RF, with a difference of 4%.
Generally, the ML model that provides the highest accuracy results for the classification of the charging station and speed is LSTM. It achieves the highest accuracy for both classification problems, which makes it a notable model for managing a fleet of EVs. Its high accuracy can be attributed to its capability for detecting time-dependent trends that are present in the power load dataset.

7. Effect of Managed Charging of Electric Vehicles

As the LSTM model provided the most accurate classification, it was utilized for the creation of the system for managing a fleet of EVs and the routing of EVs to the most appropriate charging station to achieve the objectives of the system, which are the minimization of load variance, power losses, voltage fluctuations and charging cost. LSTM yielded similar results to other studies, such as [17,23,41]. However, such studies use regular optimization methods, such as dynamic programming, which require complicated problem formulation and high computational power. ML provides a less computationally intensive solution, which allows the system to be used more conveniently and gives it the ability to be used with a modern IoT-architecture infrastructure through the cloud. Additionally, since most distribution grids’ power usages follow a similar pattern, it is expected that the ML model will provide similar results for different distribution systems.

7.1. Effect of LSTM Model on Load Curve

The LSTM model was used to choose the most appropriate charging speed in the charging stations in order to minimize the load variance to achieve peak shaving and flatten the load curve. Figure 3 shows the different load curves for the different scenarios. The black curve is the normal load curve with no EV penetration. The red curve is the uncoordinated EV penetration, considering only conventional charging, and the green curve is the managed charging of EVs provided by the LSTM model, which considers fast charging, conventional charging and V2G.
Figure 3 shows the positive effect of the managed charging of EVs using LSTM. The red curve, showing the uncoordinated charging of EVs, is an upward shift of the black normal load curve. This is the worst case scenario as every EV is allowed to charge with no coordination system. Thus, the load curve exceeds the maximum supported power by the transformer. Such a scenario can be made even worse with the introduction of uncoordinated fast charging, because the load demand would increase and the load curve’s upward shift would increase. Both scenarios may cause disadvantages such as high power losses, large voltage fluctuations and power outages due to the overload on the transformer. Consequently, the power demand would not be met and the power quality would decrease substantially.
The green load curve reveals the coordinated load curve caused by the managed charging of EVs obtained from the LSTM model. The model successfully achieves peak shaving and the power demand throughout the day is always below the maximum supported power by the transformer. Additionally, different charging modes (fast charging, conventional charging and V2G) are utilized throughout the day, depending on the power demand and time of charging. As a result, the load variance is minimized and power overloads do not occur, which increases power quality.

7.2. Effect of LSTM Model on Power Losses

LSTM was utilized for minimizing the power losses of the distribution grid, with EV penetration, by managing the charging speed of the charging stations. Figure 4 displays the percentage efficiency of the distribution system throughout a whole day. The black bars represent the normal power loss efficiency, the red bars represent the power loss efficiency during uncoordinated conventional EV charging and the green bars represent the power loss efficiency for the managed EV charging provided by the LSTM model.
The mean percentage efficiency for the whole day for the normal power losses, the uncoordinated conventional EV charging and the managed Es charging are 97%, 89% and 94%, respectively.
Figure 4 depicts the beneficial effect of the management of EVs on power losses in the distribution system. At the start and end of the day, the difference between the efficiency for the uncoordinated conventional charging of EVs and the managed EV charging is small. However, the efficiency is still increased with the managed EV charging. As the hour of the day progresses and the peak load is reached, the difference increases significantly, which shows the successful minimization of power losses by the model and its importance for maintaining the efficiency of the distribution system.
Furthermore, the fluctuation in the efficiency of the managed EV charging is significantly lower in comparison to the other two scenarios. Moreover, during the peak load hour, the efficiency for the managed EV charging becomes slightly higher than the normal efficiency, due to the use of V2G technologies and decreasing the power demand on the transformer and ensuring no power overloads occur.

7.3. Effect of LSTM Model on Voltage Profile

The voltage profile is closely linked to the power losses in a distribution system. Thus, the minimization of the power losses, in turn, improves the voltage profile and minimizes voltage fluctuations. Figure 5 reveals the maximum voltage fluctuations for the different simulated scenarios over a day.
Figure 5 shows the minimal voltage fluctuations that occur when managing the charging of EVs compared to the uncoordinated charging of EVs. The uncoordinated charging of EVs causes a drastic linear increase in the voltage fluctuations of the distribution grid. On the contrary, the improved voltage profile caused by the use of the LSTM increases power quality. Additionally, as the load variance and power losses are minimized, the voltage profile throughout the day is nearly the same, which, in turn, maintains the power quality of the grid at a high value during the whole day.

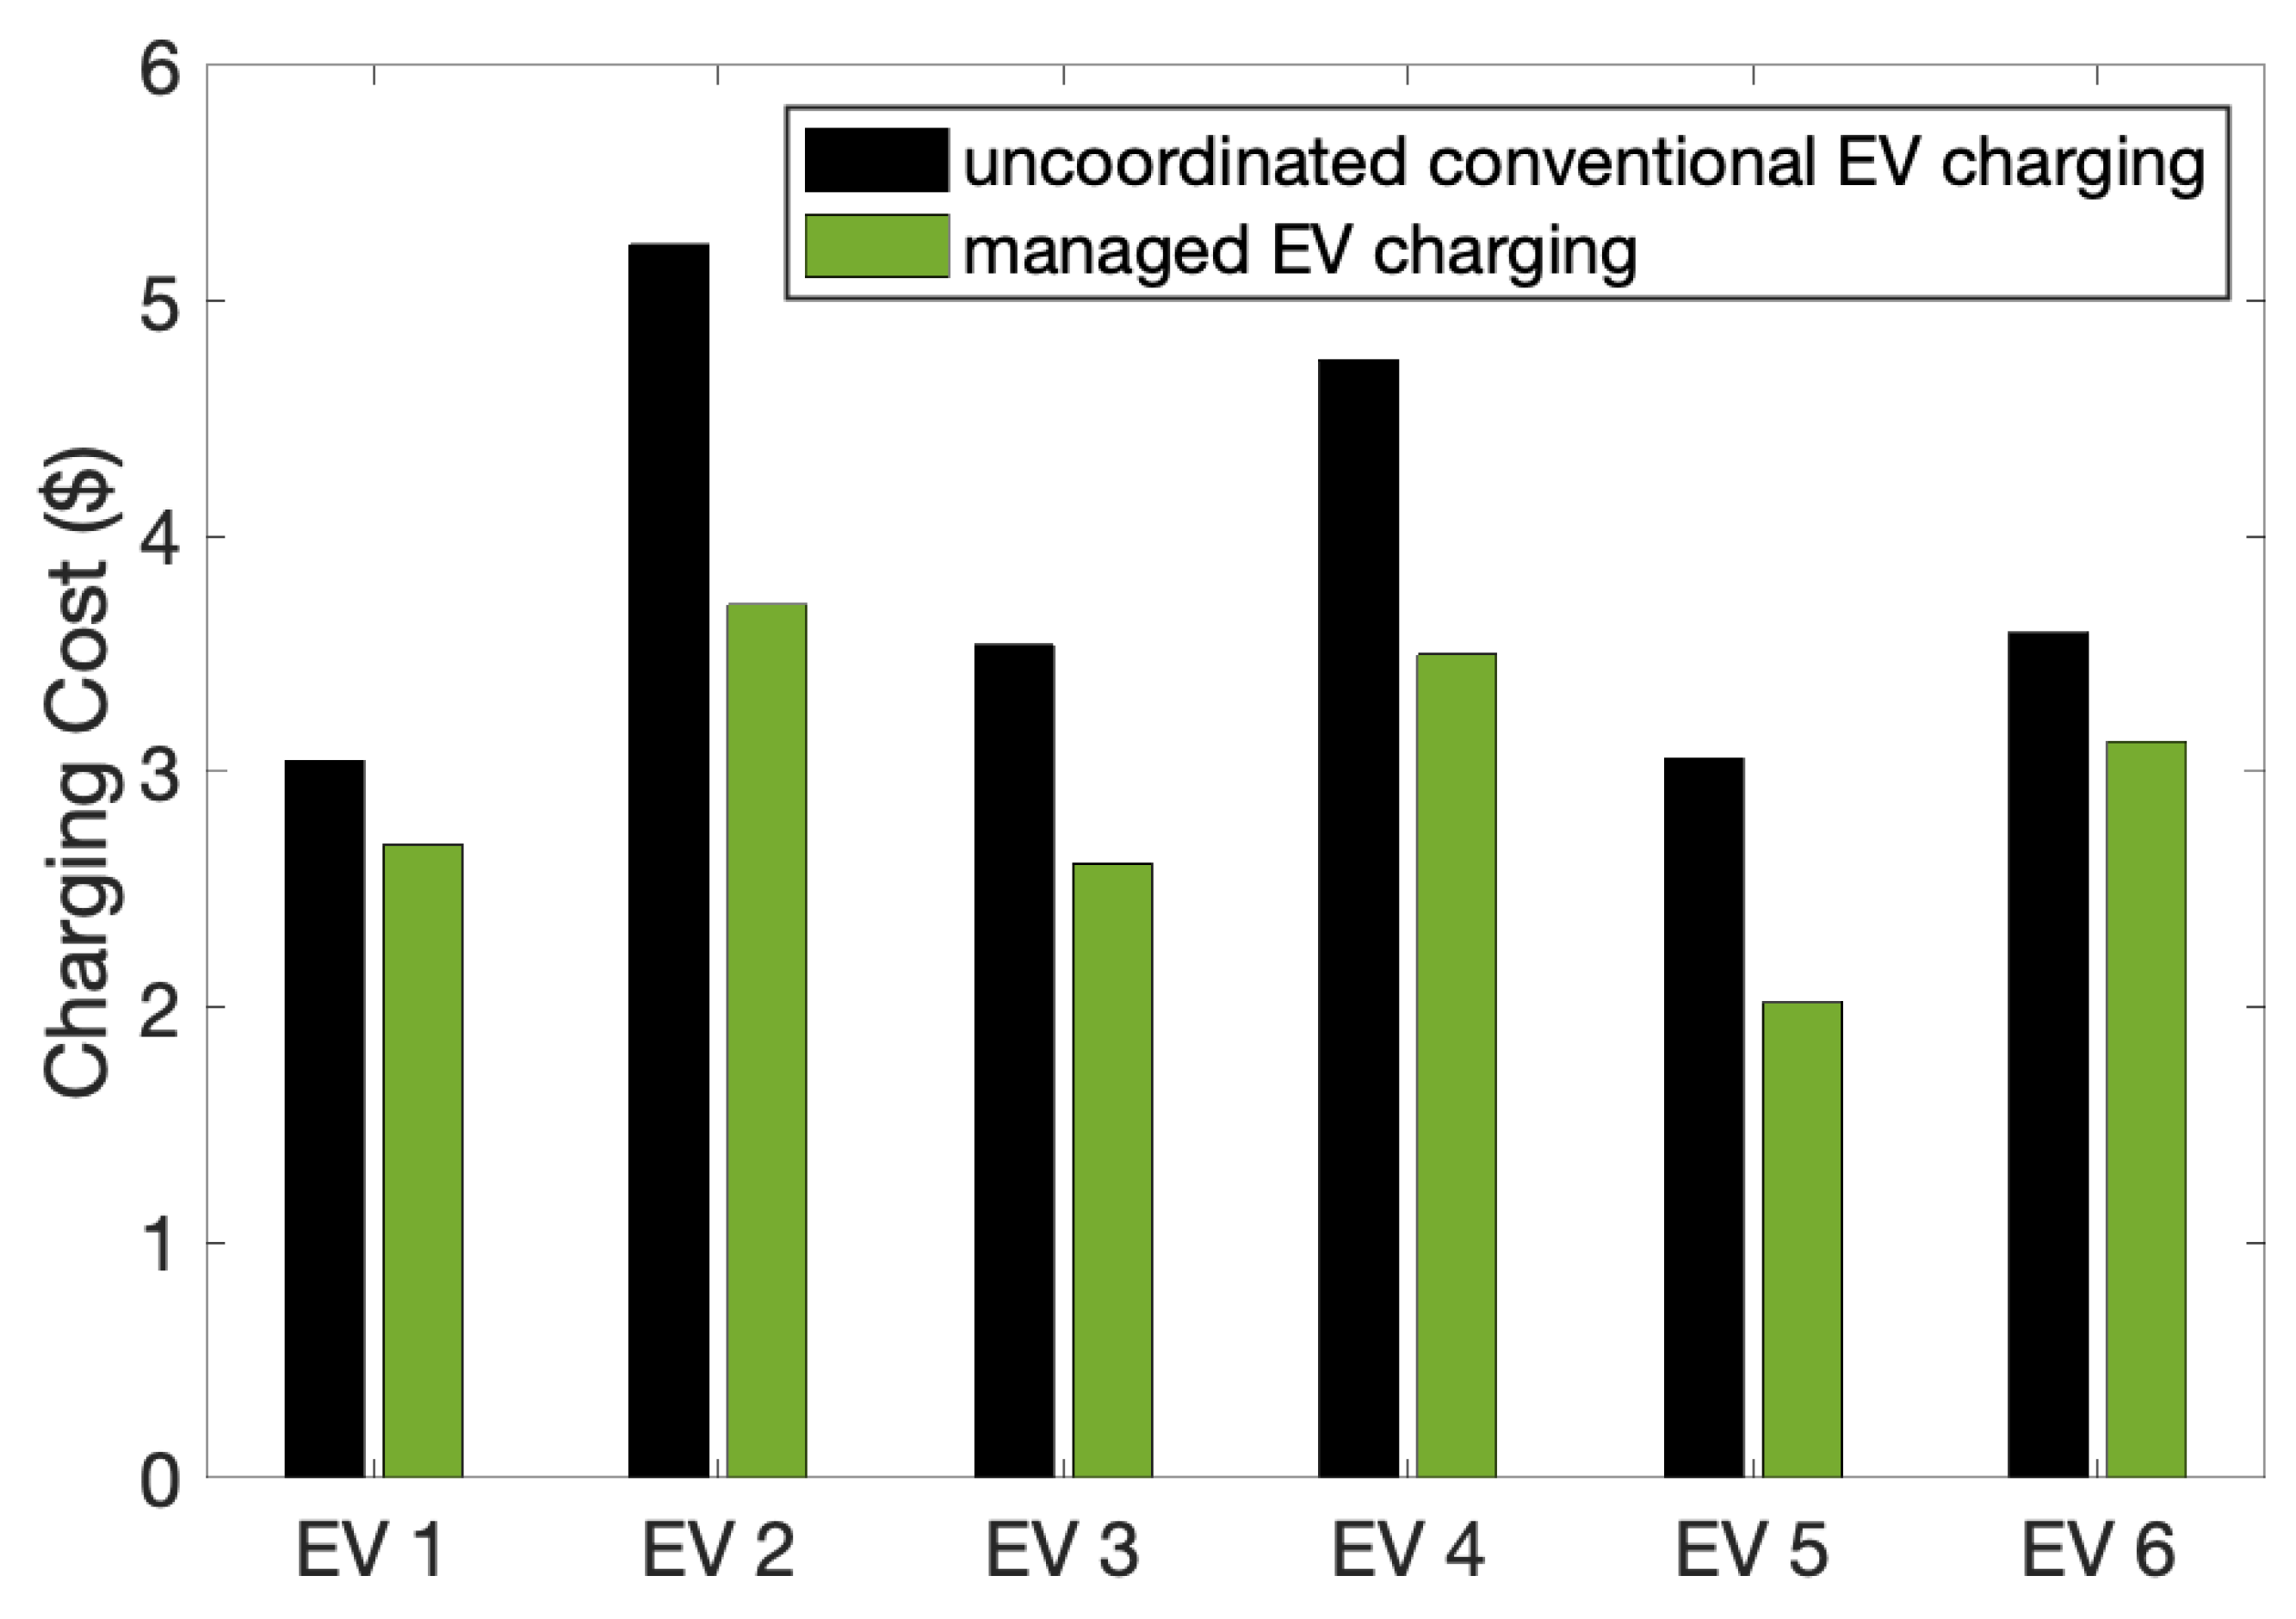
7.4. Effect of LSTM Model on Charging Cost

The minimization of the charging cost is the last objective of the system. Thus, the user’s preference was taken into consideration after the requirements of the utility were optimized. Figure 6 and Figure 7 reveal the charging and discharging times of EVs over 4 days and their respective charging costs for different scenarios. Each EV is considered to have a battery capacity of 65 kWh and an initial SoC of 10%.
Figure 6 shows the times EVs arrive and depart the stations over an interval of 4 days. Additionally, the electricity tariff is also shown over the 4-day interval. The first and second EVs fully charge (65 kWh). The third and fifth EVs charge 44 kWh of their batteries. The fourth EV charges 58 kWh of its battery and the sixth EV charges 50 kWh of its battery. The charging speed used and the time spent by each EV is distinguished in Figure 6.
Moreover, Figure 7 shows the charging cost of each EV in Figure 6. The black bars consider the utilization of uncoordinated conventional charging to charge the same capacity of the battery and starting at the same time as in Figure 6. The green bars show the charging cost of each EV using the presented model. As seen in Figure 7, the system lowers the charging cost of the user. It is worth noting that the use of fast charging contributes to the lowering of the cost as a higher percentage of the battery can be charged at low price times compared to the use of conventional charging. In addition, V2G technology decreases the cost as it allows the user to discharge at peak cost times to gain money, which decreases the total charging cost paid.

8. Effect of Load Data Uncertainty on the EV Management System

Different ranges of Gaussian white noise (GWN) are introduced to the load data in order to apply different degrees of uncertainty to simulate the partially random nature of load data. The different ML techniques, which previously provided adequate results, are tested for their robustness and accuracy to the introduced uncertainty. Consequently, the effect of the uncertainty on the system, particularly the effect on the load curves and the power losses, is examined.

8.1. Effect of Load Data Uncertainty on ML Accuracies

Table 4 shows the accuracy changes of the ML techniques after the introduction of the uncertainty to the load data for charging station classification. The accuracy change is the difference between the new accuracy after the introduction of the uncertainty and the accuracy before the uncertainty. DT suffers greatly due to the uncertainty and its accuracy drops to 77%. Additionally, the accuracy of RF falls to 86%; however, it is not as affected as DT. The highest performing model, which is LSTM, was not highly affected by the uncertainty and maintains an accuracy of 95%.
Furthermore, Table 5 reveals the accuracy changes of the ML algorithms after the introduction of the uncertainty to the load data for charging speed classification. The accuracy of RF is reduced by 1% and the accuracy of DNN is reduced by 2%. DT, KNN and LSTM have the same accuracies as they did before the addition of GWN. Thus, the performance of LSTM before and after the introduction of an uncertainty is noteworthy and the results show its robustness despite the presence of GWN in the load data.

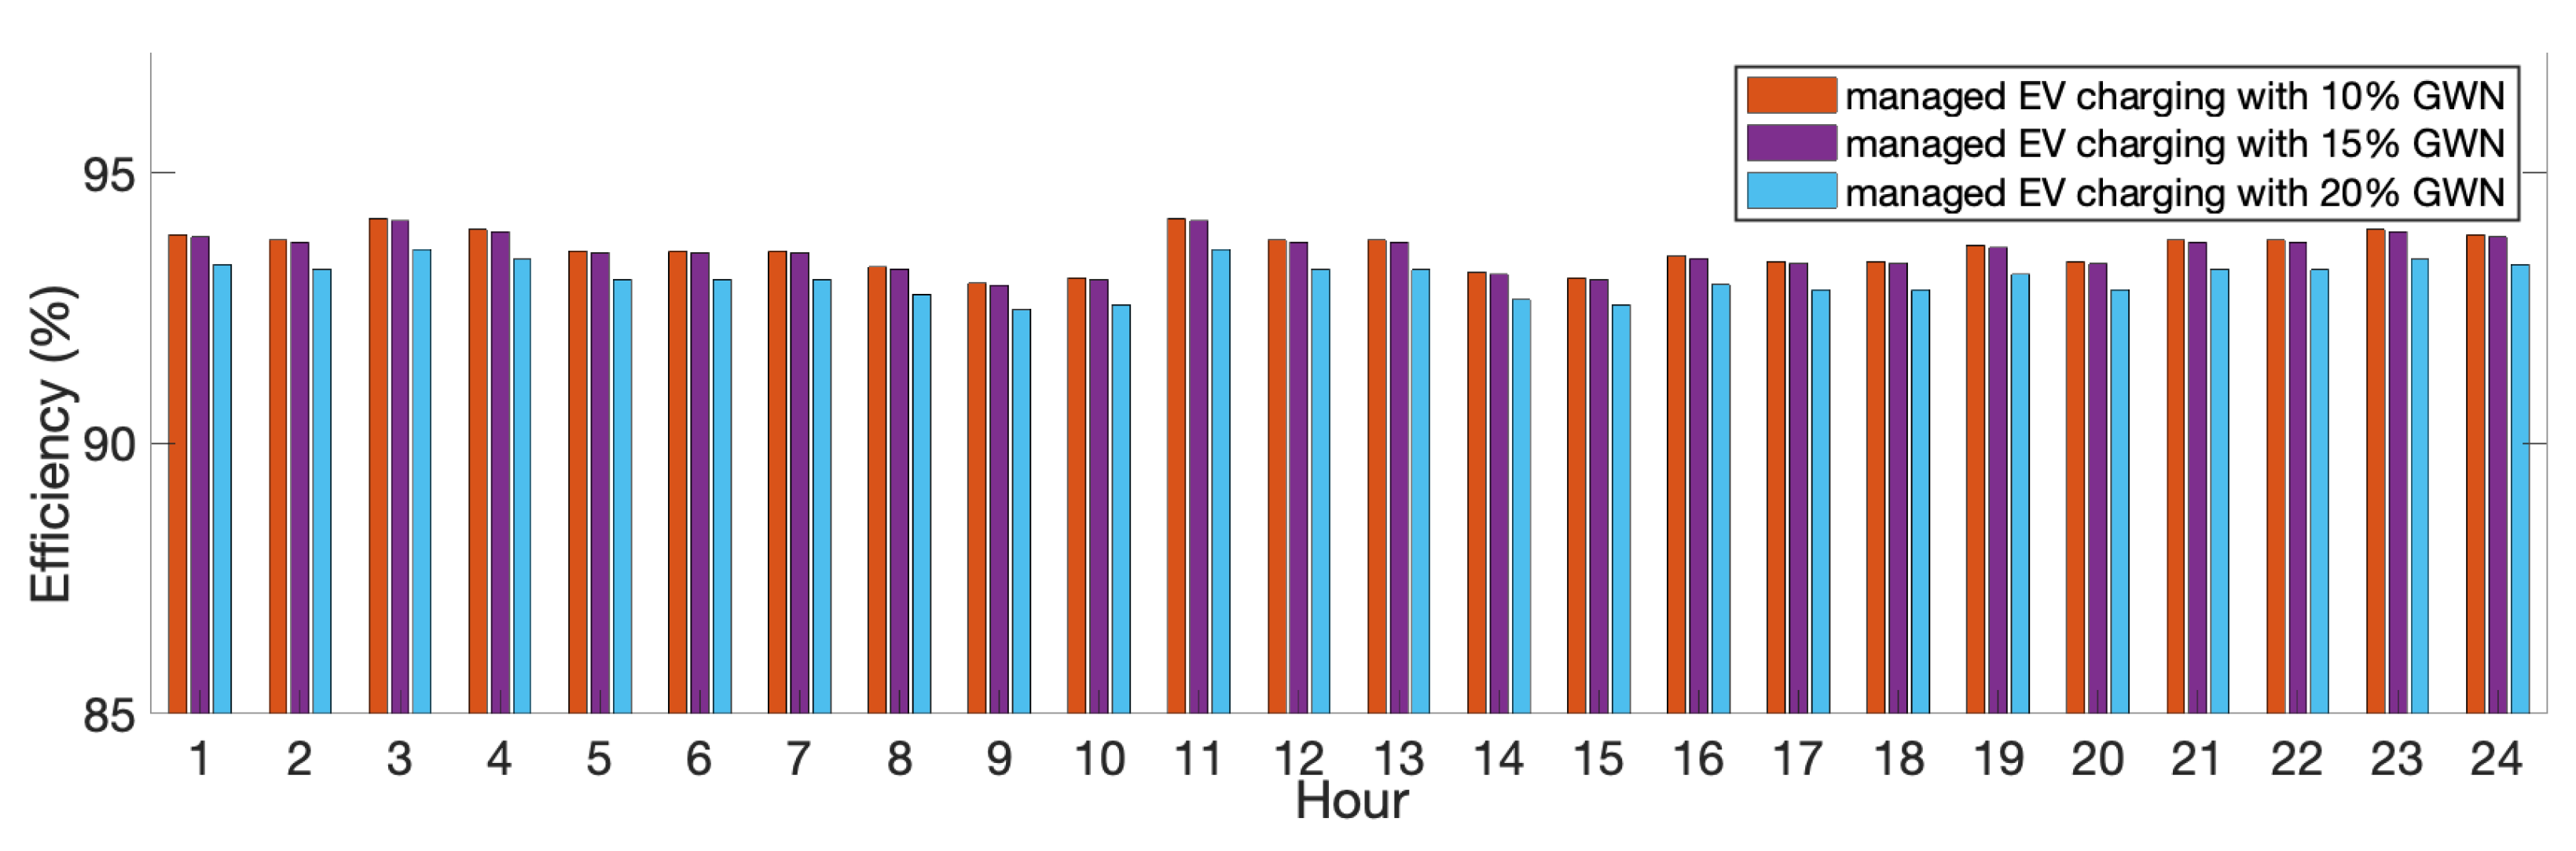
8.2. Effect of Load Data Uncertainty on Power System

Figure 8 presents the normal and the managed EV charging load curves of the distribution system after adding uncertainty to the load data. As seen in Figure 8, the introduction of an uncertainty has a minimal effect on the performance of the system. The load curve for the managed EV charging is still flattened and is always below the maximum supported power of the transformer. The constant performance of the system can be attributed to the unaffected predictive ability of the LSTM model after the addition of GWN.
Moreover, Figure 9 reveals the performance of the system for minimizing the load variance with different percentages of GWN introduced into the load data. The results given by the introduction of 15% noise are similar to the results of that with 10% noise, which emphasizes the ability of ML to classify data with up to 15% uncertainty. When 20% of GWN is added to the load data, the results slightly change and the load curve for the managed charging of EVs increases and becomes higher than the load curve for the managed charging for EVs with 10% and 15% noise. However, load curve flattening is still achieved and the load is below the transformer maximum supported power.
Figure 10 depicts the normal and coordinated efficiency of the distribution grid with GWN introduced to the load data. Similar to the effect on the load curves, the inclusion of uncertainty to the load data has little effect on the efficiency of the distribution system and provides the same trend as seen in Figure 4. The managed charging of EVs successfully keeps the efficiency over 90% at all times during the day despite adding uncertainty to the load data.
In addition, Figure 11 shows the system’s performance for minimizing power losses with different percentages of GWN added to the load data. As seen in Figure 9, the load curves for the managed EV charging for 10% and 15% GWN are similar. Subsequently, the efficiency values of the distribution system after introducing 10% and 15% noise are similar as well. The efficiency of the distribution grid with 20% GWN is slightly lower compared to the managed EV charging with 10% and 15% GWN. However, the efficiency is still above 90% throughout the day.

9. Conclusions

In conclusion, a performance assessment conducted on the different ML algorithms verified that the most appropriate ML algorithm for classifying charging speed and charging station is LSTM, with a mean accuracy of 95%. An LSTM-based management system, which is robust against load data uncertainty, for the charging of a fleet of EVs is presented by routing EVs to the most suitable charging stations. The system uses ML as an optimization technique to minimize load variance, power losses, and voltage fluctuations. As a result, power overloads in the transformer do not occur, which decreases power outages. In addition, the decreased power losses and voltage fluctuations increase the power quality of the distribution network. Further, the user’s satisfaction is considered by the system as it also minimizes the charging cost.
Simulations were utilized to test the management system on a modified 33-bus distribution system. Twelve charging stations were placed randomly at different buses in the network, considering fast charging, conventional charging and V2G technologies. The ML-based system was able to flatten the load curve and avoid power overloads throughout the day. Additionally, power losses and voltage fluctuations were minimized and the mean power efficiency of a day was decreased by 3.1%, in comparison with the base efficiency with no EV penetration. In addition to the optimization for the utility, the charging cost was regarded by the system to be minimized for the users. The results showed that charging cost was lowered compared to the charging cost provided by the uncoordinated conventional charging. Users were given the ability to discharge EVs at peakload hours to benefit from negative pricing and use fast charging at off peakload hours to decrease their wait times in the charging stations.
Moreover, different percentages of GWN were utilized to simulate the partially random nature of the load curves and to test the model for its performance with the introduction of uncertainty to the load data. The results show the minimal effect the different uncertainty values have on the performance of the system and the high predictive accuracy of the utilized LSTM model despite the uncertainty. Therefore, the management system’s robustness towards load data uncertainty was verified.
Therefore, the most prominent conclusions from the results found in the paper can be summarized as follows:
  • LSTM provides the highest accuracy (95%) for classifying charging speed and charging station and is the most robust to load data uncertainty with no change in its accuracy after introducing the load data uncertainty.
  • The system successfully increases the power quality of the grid by minimizing the load variance and flattening the load curve, in addition to minimizing power losses and voltage fluctuations.
  • The system decreases the mean power efficiency of the grid by only 3.1% compared to the base efficiency with no EV penetration.

10. Future Work

As for future work, the possible use of other types of artificial intelligence optimization techniques, such as reinforcement learning, can be used to evaluate the system performance, especially with a lack of historical data. Additionally, the system can be re-assessed with priority given to the user’s requirements, instead of the utility’s requirements, to explore and compare the results of the different systems with different weights for the objective functions.
Finally, the system can be tested with real-life practical data from the grid to evaluate the performance of the system using on-site data, which would further assist in proving the reliability of the presented system.

Author Contributions

Conceptualization, M.S., L.I. and A.M.; methodology, M.S., L.I. and A.M.; writing—original draft preparation, M.S.; writing—review and editing, L.I. and A.M.; project administration, L.I. and A.M.; funding acquisition, A.M. All authors have read and agreed to the published version of the manuscript.

Funding

This research received no external funding.

Institutional Review Board Statement

Not applicable.

Informed Consent Statement

Not applicable.

Data Availability Statement

Not applicable.

Acknowledgments

This publication was made possible by NPRP grant NPRP (10-0130-170286) from the Qatar National Research Fund (a member of Qatar Foundation). The statements made herein are solely the responsibility of the authors.

Conflicts of Interest

The authors declare no conflict of interest.

Nomenclature

Δ t time interval in seconds
Ttotal number of time intervals in a day
Nnumber of charging stations
Bnumber of buses
E n number of EVs in the n-th charging station
ι e , n i time interval when the e-th EV is plugged into the n-th charging station
ι e , n f time interval when the e-th EV is unplugged from the n-th charging station
P t B load of all the buses, excluding charging station loads, at the t-th time interval in kW
P n , t C operating power of the n-th charging station at the t-th time interval in kW function
s n n , t that determines the sign of P n , t C
P m a x , t D maximum operating power of the distribution network at the t-th time interval in kW
P m a x , n , t C maximum power of operation of the n-th charging station at the t-th time interval in kW
η n C efficiency of the n-th charging station
μ T D average power of distribution network in one day in kW
Δ W e , n energy required for charging the e-th EV
plugged into the n-th charging station in kWh
W e , n i initial energy of the battery when the e-th EV is plugged into the n-th charging station
in kWh
W e , n f final energy of the battery when the e-th EV is unplugged from the n-th charging
station in kWh
S o C m i n , e , n minimum state of charge that is permitted for the e-th EV plugged into the n-th
charging station
S o C m a x , e , n maximum state of charge that is permitted for the e-th EV plugged into the n-th
charging station
Q e , n battery capacity of the e-th EV plugged into the n-th charging station in kWh
I b , b + 1 , t current in the line between the b-th and ( b + 1 )-th buses at the t-th time interval
R b , b + 1 resistance in the line between the b-th and ( b + 1 )-th buses
C ( t ) electricity cost at the t-th time interval per kWh

References

  1. Global EV Outlook 2020. International Energy Agency (IEA). 2020. Available online: https://www.iea.org/reports/global-ev-outlook-2020 (accessed on 14 July 2020).
  2. The Global Electric Vehicle Market In 2019—Virta. Virta.global. 2020. Available online: https://www.virta.global/global-electric-vehicle-market (accessed on 31 May 2020).
  3. ElMenshawy, M.; Massoud, A. Modular Isolated DC-DC Converters for Ultra-Fast EV Chargers: A Generalized Modeling and Control Approach. Energies 2020, 13, 2540. [Google Scholar] [CrossRef]
  4. ElMenshawy, M.; Massoud, A. Hybrid Multimodule DC-DC Converters for Ultrafast Electric Vehicle Chargers. Energies 2020, 13, 4949. [Google Scholar] [CrossRef]
  5. Wróblewski, P.; Drożdż, W.; Lewicki, W.; Miązek, P. Methodology for Assessing the Impact of Aperiodic Phenomena on the Energy Balance of Propulsion Engines in Vehicle Electromobility Systems for Given Areas. Energies 2021, 14, 2314. [Google Scholar] [CrossRef]
  6. Wróblewski, P.; Kupiec, J.; Drożdż, W.; Lewicki, W.; Jaworski, J. The Economic Aspect of Using Different Plug-in Hybrid Driving Techniques in Urban Conditions. Energies 2021, 14, 3543. [Google Scholar] [CrossRef]
  7. Korosec, K. Apple Maps Gets Electric Vehicle Routing to Find EV Chargers. Techcrunch.com. 2020. Available online: https://techcrunch.com/2020/06/22/apple-maps-gets-electric-vehicle-routing-to-find-ev-chargers (accessed on 25 June 2020).
  8. Clement-Nyns, K.; Haesen, E.; Driesen, J. The Impact of Charging Plug-In Hybrid Electric Vehicles on a Residential Distribution Grid. IEEE Trans. Power Syst. 2010, 25, 371–380. [Google Scholar] [CrossRef] [Green Version]
  9. Karmaker, A.K.; Roy, S.; Ahmed, M.R. Analysis of the Impact of Electric Vehicle Charging Station on Power Quality Issues. In Proceedings of the 2019 International Conference on Electrical, Computer and Communication Engineering (ECCE), Cox’s Bazar, Bangladesh, 7–9 February 2019; pp. 1–6. [Google Scholar] [CrossRef]
  10. Yilmaz, M.; Krein, P.T. Review of the Impact of Vehicle-to-Grid Technologies on Distribution Systems and Utility Interfaces. IEEE Trans. Power Electron. 2013, 28, 5673–5689. [Google Scholar] [CrossRef]
  11. Habib, S.; Kamran, M.; Rashid, U. Impact analysis of vehicle-to-grid technology and charging strategies of electric vehicles on distribution networks—A review. J. Power Sources 2014, 277, 205–214. [Google Scholar] [CrossRef]
  12. Lunz, B.; Yan, Z.; Gerschler, J.; Sauer, D. Influence of plug-in hybrid electric vehicle charging strategies on charging and battery degradation costs. Energy Policy 2012, 46, 511–519. [Google Scholar] [CrossRef]
  13. Clairand, J.; Rodríguez-García, J.; Álvarez-Bel, C. Smart Charging for Electric Vehicle Aggregators Considering Users’ Preferences. IEEE Access 2018, 6, 54624–54635. [Google Scholar] [CrossRef]
  14. Clairand, J.; Rodríguez-García, J.; Álvarez-Bel, C. Electric Vehicle Charging Strategy for Isolated Systems with High Penetration of Renewable Generation. Energies 2018, 11, 3188. [Google Scholar] [CrossRef] [Green Version]
  15. Fanti, M.P.; Mangini, A.M.; Roccotelli, M.; Ukovich, W. Optimal energy management integrating renewable energy, energy storage systems and electric vehicles. In Proceedings of the 2017 IEEE 14th International Conference on Networking, Sensing and Control (ICNSC), Calabria, Italy, 16–18 May 2017; pp. 519–524. [Google Scholar] [CrossRef]
  16. Amer, A.; Shaban, K.; Gaouda, A.; Massoud, A. Home Energy Management System Embedded with a Multi-Objective Demand Response Optimization Model to Benefit Customers and Operators. Energies 2021, 14, 257. [Google Scholar] [CrossRef]
  17. Sortomme, E.; Hindi, M.M.; MacPherson, S.D.J.; Venkata, S.S. Coordinated Charging of Plug-In Hybrid Electric Vehicles to Minimize Distribution System Losses. IEEE Trans. Smart Grid 2011, 2, 198–205. [Google Scholar] [CrossRef]
  18. Deilami, S.; Masoum, A.S.; Moses, P.S.; Masoum, M.A.S. Real-Time Coordination of Plug-In Electric Vehicle Charging in Smart Grids to Minimize Power Losses and Improve Voltage Profile. IEEE Trans. Smart Grid 2011, 2, 456–467. [Google Scholar] [CrossRef]
  19. Jian, L.; Xue, H.; Xu, G.; Zhu, X.; Zhao, D.; Shao, Z.Y. Regulated Charging of Plug-in Hybrid Electric Vehicles for Minimizing Load Variance in Household Smart Microgrid. IEEE Trans. Ind. Electron. 2013, 60, 3218–3226. [Google Scholar] [CrossRef]
  20. Masoum, A.S.; Deilami, S.; Moses, P.S.; Masoum, M.A.S.; Abu-Siada, A. Smart load management of plug-in electric vehicles in distribution and residential networks with charging stations for peak shaving and loss minimisation considering voltage regulation. IET Gener. Transm. Distrib. 2011, 5, 877–888. [Google Scholar] [CrossRef]
  21. Ma, Z.; Callaway, D.S.; Hiskens, I.A. Decentralized Charging Control of Large Populations of Plug-in Electric Vehicles. IEEE Trans. Control. Syst. Technol. 2013, 21, 67–78. [Google Scholar] [CrossRef]
  22. Iacobucci, R.; McLellan, B.; Tezuka, T. Optimization of shared autonomous electric vehicles operations with charge scheduling and vehicle-to-grid. Transp. Res. Part C Emerg. Technol. 2019, 100, 34–52. [Google Scholar] [CrossRef]
  23. Liu, Z.; Wu, Q.; Huang, S.; Wang, L.; Shahidehpour, M.; Xue, Y. Optimal Day-Ahead Charging Scheduling of Electric Vehicles Through an Aggregative Game Model. IEEE Trans. Smart Grid 2018, 9, 5173–5184. [Google Scholar] [CrossRef] [Green Version]
  24. Rezaei, A.; Burl, J.B.; Rezaei, M.; Zhou, B. Catch Energy Saving Opportunity in Charge-Depletion Mode, a Real-Time Controller for Plug-In Hybrid Electric Vehicles. IEEE Trans. Veh. Technol. 2018, 67, 11234–11237. [Google Scholar] [CrossRef]
  25. Wei, Z.; Li, Y.; Cai, L. Electric Vehicle Charging Scheme for a Park-and-Charge System Considering Battery Degradation Costs. IEEE Trans. Intell. Veh. 2018, 3, 361–373. [Google Scholar] [CrossRef]
  26. Chaudhari, K.; Kandasamy, N.K.; Krishnan, A.; Ukil, A.; Gooi, H.B. Agent-Based Aggregated Behavior Modeling for Electric Vehicle Charging Load. IEEE Trans. Ind. Inform. 2019, 15, 856–868. [Google Scholar] [CrossRef]
  27. Azizipanah-Abarghooee, R.; Terzija, V.; Golestaneh, F.; Roosta, A. Multiobjective Dynamic Optimal Power Flow Considering Fuzzy-Based Smart Utilization of Mobile Electric Vehicles. IEEE Trans. Ind. Inform. 2016, 12, 503–514. [Google Scholar] [CrossRef]
  28. Zhang, H.; Hu, Z.; Xu, Z.; Song, Y. Optimal Planning of PEV Charging Station With Single Output Multiple Cables Charging Spots. IEEE Trans. Smart Grid 2017, 8, 2119–2128. [Google Scholar] [CrossRef]
  29. Wang, R.; Wang, P.; Xiao, G. Two-Stage Mechanism for Massive Electric Vehicle Charging Involving Renewable Energy. IEEE Trans. Veh. Technol. 2016, 65, 4159–4171. [Google Scholar] [CrossRef]
  30. Mayoraz, E.; Alpaydin, E. Support vector machines for multi-class classification. In Lecture Notes in Computer Science; Springer: Berlin/Heidelberg, Germany, 1999; pp. 833–842. [Google Scholar] [CrossRef] [Green Version]
  31. Murthy, V.N.; Singh, V.; Chen, T.; Manmatha, R.; Comaniciu, D. Deep Decision Network for Multi-class Image Classification. In Proceedings of the 2016 IEEE Conference on Computer Vision and Pattern Recognition (CVPR), Las Vegas, NV, USA, 27–30 June 2016; pp. 2240–2248. [Google Scholar] [CrossRef]
  32. Ma, X.; Tao, Z.; Wang, Y.; Yu, G.; Wang, Y. Long short-term memory neural network for traffic speed prediction using remote microwave sensor data. Transp. Res. Part C Emerg. Technol. 2015, 54, 187–197. [Google Scholar] [CrossRef]
  33. Deligiannis, P.; Koutroubinas, S.; Koronias, G. Predicting Energy Consumption Through Machine Learning Using a Smart-Metering Architecture. IEEE Potentials 2019, 38, 29–34. [Google Scholar] [CrossRef]
  34. Géron, A. Hands-On Machine Learning with Scikit-Learn and TensorFlow; O’Reilly Media: Newton, MA, USA, 2017. [Google Scholar]
  35. Ho, T.K. The random subspace method for constructing decision forests. IEEE Trans. Pattern Anal. Mach. Intell. 1998, 20, 832–844. [Google Scholar]
  36. Nielsen, M. Neural Networks and Deep Learning. California. 2019. Available online: http://neuralnetworksanddeeplearning.com/ (accessed on 14 July 2020).
  37. Baran, M.E.; Wu, F.F. Network reconfiguration in distribution systems for loss reduction and load balancing. IEEE Trans. Power Deliv. 1989, 4, 1401–1407. [Google Scholar] [CrossRef]
  38. Carlson, M. Now Is the Time for Time-of-Use Pricing. Cubillinois.wordpress.com. 2015. Available online: https://cubillinois.wordpress.com/2015/02/13/now-is-the-time-for-time-of-use-pricing/ (accessed on 7 July 2020).
  39. Shibl, M. Bus Load Data. Kaggle.com. 2020. Available online: https://www.kaggle.com/mostafashibl/bus-load-data (accessed on 14 July 2020).
  40. Muratori, M. Impact of Uncoordinated Plug-In Electric Vehicle Charging on Residential Power Demand. Nat. Energy 2018, 3, 193–201. [Google Scholar] [CrossRef]
  41. Zhang, P.; Qian, K.; Zhou, C.; Stewart, B.G.; Hepburn, D.M. A Methodology for Optimization of Power Systems Demand Due to Electric Vehicle Charging Load. IEEE Trans. Power Syst. 2012, 27, 1628–1636. [Google Scholar] [CrossRef]
Figure 1. Employed modified IEEE 33-bus distribution system.
Energies 14 06199 g001
Figure 2. Cost function definition.
Energies 14 06199 g002
Figure 3. Comparison of load curves of different situations.
Energies 14 06199 g003
Figure 4. Comparison of distribution system efficiency of different situations.
Energies 14 06199 g004
Figure 5. Comparison of maximum voltage fluctuations of different situations.
Energies 14 06199 g005
Figure 6. Charging and discharging times of EVs over 4 days.
Energies 14 06199 g006
Figure 7. Comparison of charging costs of different situations.
Energies 14 06199 g007
Figure 8. Comparison of load curves of different situations with 10% GWN.
Energies 14 06199 g008
Figure 9. Comparison of load curves of different situations with different percentages of GWN.
Energies 14 06199 g009
Figure 10. Comparison of distribution system efficiency of different situations with 10% GWN.
Energies 14 06199 g010
Figure 11. Comparison of distribution system efficiency of different scenarios with different percentages of GWN.
Energies 14 06199 g011
Table 1. Summary of ML algorithms.
ML ModelAdvantagesDisadvantages
Decision Tree (DT)
  • Does not require data normalization and scaling
  • Can be used for classification and regression
  • Generally has a high predictive accuracy
  • Small changes in the dataset can cause significant changes in the created tree
  • Generally has a long training time
Random Forest (RF)
  • Can be used for classification and regression
  • Can handle large datasets with a large number of inputs
  • Can handle uncertainty as the mean or mode result from multiple decision trees is outputted
  • Increased complexity due to the large number of trees created
  • Generally has a long training time
Support Vector Machine (SVM)
  • Can be used for classification and regression
  • Has a low risk of overfitting
  • Has a long training time for large datasets
  • Low performance when classes overlap
  • Low performance when number of features is greater than number of training samples
K-Nearest Neighbors
  • Can be used for classification and regression
  • Short training periods
  • Easy to implement
  • Low performance with large datasets
  • Low performance with a large number of inputs
  • Low performance with imbalanced datasets
Deep Neural Network (DNN)
  • Can be used for classification and regression
  • Same model can be used for different applications
  • Requires large datasets
  • Highly prone to overfitting
  • No theory for optimal width and depth selection
Long Short Term Memory (LSTM)
  • Can be used for classification and regression
  • Can detect time series
  • High predictive accuracy
  • No theory for optimal width and depth selection
  • No theory for optimal hyper parameters selection
Table 2. Accuracies of ML classifiers for charging station classification.
ML ModelAccuracy
Decision Tree (DT)94%
Random Forest (RF)95%
Support Vector Machine (SVM)30%
K-Nearest Neighbors (KNN)42%
Deep Neural Network (DNN)78%
Long Short Term Memory (LSTM)95%
Table 3. Accuracies of ML classifiers for charging speed classification.
ML ModelAccuracy
Decision Tree (DT)84%
Random Forest (RF)90%
Support Vector Machine (SVM)57%
K-Nearest Neighbors (KNN)84%
Deep Neural Network (DNN)85%
Long Short Term Memory (LSTM)94%
Table 4. Accuracies of ML classifiers for charging station classification with 10% GWN.
ML ModelAccuracyAccuracy Change
Decision Tree (DT)77%−17%
Random Forest (RF)86%−9%
Long Short Term Memory (LSTM)95%0%
Table 5. Accuracies of ML classifiers for charging speed classification with 10% GWN.
ML ModelAccuracyAccuracy Change
Decision Tree (DT)84%0%
Random Forest (RF)89%−1%
K-Nearest Neighbors (KNN)84%0%
Deep Neural Network (DNN)83%−2%
Long Short Term Memory (LSTM)94%0%
Publisher’s Note: MDPI stays neutral with regard to jurisdictional claims in published maps and institutional affiliations.

