1. Introduction
The frost-free refrigerator is widely utilized nowadays because of its large capacity, automatic defrosting and multi-temperature compartments, i.e., refrigerating, variable-temperature and freezing ones. To meet the requirement of −18 °C temperature in the freezing compartment, the evaporation temperature should be even lower. Therefore, frost forms on the evaporator surface when the return air with higher temperature and humidity flows across. A frost layer will increase the thermal resistance and reduce the air flowrate of the evaporator, deteriorating the system’s performance [
1].
Much experimental work has been conducted on the frosting characteristics of evaporators and their influencing factors. These factors can be classified into three categories: (1) environment conditions such as the outdoor fan characteristics and the temperature & humidity of the frontal airflow. Kim et al. [
2] used a slit fin bundle for the simulation of the heat exchanger in the air-source heat pumps (ASHPs) and experimentally explored the effects of cooling block temperature, air humidity and air velocity on its frosting characteristics. Zhang et al. [
3] carried out the comparative study on the airside performance under different outdoor air fan control modes of ASHPs experimentally. (2) Geometrical parameters such as the fin types, the fin pitch and the surface treatment of fins. Huang et al. [
4] experimentally studied effects of three fin types—flat, wavy and louver fins—on the periodic frosting and defrosting performance of evaporators in ASHPs. Wang and Lee [
5,
6] investigated the effect of different surface characteristics on frosting and defrosting behaviors of ASHPs. Liu et al. [
7] experimentally studied the enhancement of airside heat transfer performance by using perforated fins for heat exchangers under frosting conditions. Dogan et al. [
8] experimentally compared louver-fin-flat-tube heat exchangers with different number of fin rows between tubes. (3) Frost growth, frost morphology and frost mass distribution. Guo et al. [
9] investigated the effect of frost morphology on the ASHP performance experimentally and obtained the correlation between the micromorphology of frost layer and the evaporator performance. Li et al. [
10] proposed a defrosting method for equal-fin-spacing evaporators by controlling frost distribution to match defrosting heat distribution and improved the defrosting efficiency by 29.8%.
Numerical studies have also been performed on the frosting characteristics with two types of surface: for the finned-tube evaporator and for the cold plate. For the first type, Da Silva et al. [
11] proposed a model of frosting performance for equal-fin-spacing evaporators, to determine how the operating conditions affected the cooling capacity; the effects of the frost morphology were also investigated. Morales-Fuentes et al. [
12] studied a fin-and-tube heat exchanger under several heat-transfer area distributions by simulation. Results showed that a heat exchanger that allows even flow distribution along the operation time is less sensitive to thermohydraulic deterioration. Knabben et al. [
13] put forward a 2D model to predict the evaporator blocking and carried out an assessment of the impact of fin distribution and defrost strategy on the evaporator performance. In their study, the total fin number of the evaporator is not constant. Breque et al. [
14] and Rasheed et al. [
15] also proposed simulation model of heat pump system and validated the model using experimental data. Allymehr et al. [
16] used two separately developed simulation codes to calculate the efficiency of two heat pump systems. For the second type, Breque et al. [
17] compared different assumptions and correction equations of frosting models on a cold flat plate in the literature and made recommendations to select proper assumptions. Wu et al. [
18] developed a 2D phase change mass transfer model in FLUENT to predict the frost layer growth and the densification on a cold surface. Kim et al. [
19] defined the concept of frost formation resistance and used a multi-phase Eulerian method to model the frost formation on a cold plate.
Seen from the above-mentioned articles, much research has been conducted on the frosting performance of finned-tube exchangers in ASHPs. However, little has been devoted to that designed for frost-free refrigerators. Compared with ASHP evaporators, the evaporator in frost-free refrigerators has certain particular features such as fewer windward columns, a greater number of tube rows along the airflow direction, lower evaporation temperature and wide utilization of separate fins. Moreover, due to the gradual decrease in moisture content in the airflow, the frost thickness of upstream area is much higher than that of downstream area [
20]. Hence, uneven fin distribution is commonly used among vertical rows for the evaporator in refrigerators to mitigate the frost maldistribution. However, most models and experiments in the open literature focus on the equal fin-pitch type of evaporators.
Therefore, this article is to explore the optimization method for non-uniform fin distribution of the multi-row frosting evaporator in frost-free refrigerators. A quasi-static 3-1-1 model has been established in our previous work, and frosting evaporator performance has been compared between uniform and non-uniform temperature & humidity of the frontal airflow [
21]. This article, as a follow-up study, adapts the same model and proposes a row-by-row fin distribution optimization method to achieve better frosting evaporator performance under uniform temperature & humidity conditions. Then, the robustness of the optimization method is validated under wider temperature and humidity operating conditions, and also under non-uniform temperature and humidity conditions. To reduce the complexity of calculating the whole frosting process and improve the feasibility of optimization method, an equivalent implementation only based on the initial no-frost evaporator hydraulic characteristics is also proposed.
2. Methods
The frosting model of the evaporator is described in detail in our previous work [
21]. The frost growth process is assumed as a quasi-static phenomenon and adopts the Lewis analogy for calculations of mass transfer process. The water vapor is assumed to be saturated on the surface of the cold wall and the frost. The model is divided into three sub-models, namely, the geometric model, the heat and mass transfer model and the airflow model. The first divides the evaporator into many elements, the second calculates the heat and mass transfer both in the airside and inside the frost layer in every element and the third model connects each independent element by setting the rules of the air distribution and mixing.
2.1. Geometric Model
The evaporator studied in this research consists of 14 tubes spaced in 2 columns, as illustrated in
Figure 1. The fins are separately mounted with free gaps between adjacent tube rows. The fin number generally increases from bottom to top tube rows (except for the top row) to mitigate the frost maldistribution caused by the leading-edge effect [
20]. In this model, the evaporator is divided into elements based on the fin distribution. The internal element is composed of two adjacent fins and the flow channel between them, while the lateral element is only a half of the internal one.
2.2. Heat and Mass Transfer Model
The frosting process during humid air flowing over the cold surface is illustrated in
Figure 2 with heat and mass transfer indicated. The heat transfer includes two parts: the sensible part
and the latent part
. The former accounts for the airflow being cooled by the cold evaporator or frost, while the latter comes from the desublimation of water vapor (into frost) contained in the humid air. Moreover, the mass transfer also plays two roles in frost growth. One part of the water vapor
enters the inside of the frost layer and increases its density and the other part
desublimates on the surface of the frost layer to increase its height.
In the airside, convective heat and mass transfer between the airstream and the frost layer is mainly considered. The differential equations are as following, respectively.
where index
refers to humid air,
refers to frost surface,
refers to dry air,
is the density,
is the airflow rate,
is the specific heat,
is temperature,
is the airside heat transfer coefficient,
is the total fin efficiency,
refers to the frost surface area,
is humidity ratio and
is the Lewis number.
Within the frost layer, by contrast, the heat transfer process is regarded as the heat conduction with an internal heat source, which is the latent heat of vapor desublimation. The differential equations of energy and mass conservation are as following, respectively.
with the following boundary conditions:
where the index
refers to the wall surface of evaporator tubes,
is the latent heat of vapor into frost,
is the increase rate of frost density and
is the thermal conductivity of frost. More information about the model and the physical properties of air and frost is provided in [
21].
2.3. Air Flow Model
The heat and mass transfer process in each element is calculated individually first by the model above, and then connected together with the following rules of air distribution and mixing.
- (1)
The air distribution rule: the air pressure drop across all elements in the same row is equal to satisfy the conservation of momentum. This rule can be used to connect the elements situated in the same row.
- (2)
The air mix rule: the element number varies in different rows and fins are separate along the air flow direction. Therefore, the air flow from different upstream elements mixes before entering the downstream ones. The air mixing process needs to meet the law of energy conservation and composition conservation. This rule establishes the coupling of rows along the air flow direction.
It is noteworthy that in many existing publications, the airflow rate through a frosted evaporator is considered constant, which hardly conforms to the practical truth. Frost deposition increases the flow resistance of the finned-tube evaporator, and will inevitably reduce the airflow rate of the axial fan at constant power input. Therefore, the flowrate-pressure curve is fitted based on the experimental tests of the axial fan in this article and is expressed as a 5th order polynomial fit equation to reproduce the actual air flowrate variation in the tested refrigerator.
The characteristic curves of the small axial fan are similar. With the increase of air pressure drop, airflow rate decreases first gradually and then sharply. Due to the long period of frosting in the refrigerator, most of fans will enter the stall area where the airflow rate decreases sharply with slight increase of air pressure drop.
2.4. Initial Conditions and Boundary Conditions
In the real household refrigerator, the return air from different compartments is supposed to have different temperature and humidity conditions. The air stream from the refrigerating compartment is warm and humid, flowing through the left part of the evaporator, while that from the variable-temperature compartment flows through the right part of the evaporator as shown in
Figure 1. By contrast, the return air from the freezing compartment is cold and dry, covering the whole frontal area of the evaporator. In this study, the temperature and humidity of the return air at the beginning of a stable on-cycle of refrigerators are taken as reference values as shown in
Table 1.
The main objective of this article is to investigate the influence of row-by-row fin distribution on the performance of the evaporator, so the effect of non-uniform return air is scarcely considered. Therefore, it is assumed that the return air is uniformly mixed at the bottom of the evaporator and the proportion is 1:1:2 for refrigerating, variable temperature and freezing return airflow, respectively, informed by the manufacturers. The parameters of return air after mixing are displayed in
Table 2. The evaporating temperature varies in a frosting period and the value at the beginning of a stable on-cycle of refrigerators is taken as the simulated setting condition. The initial transient phase of the evaporating temperature is neglected due to the short time and small capacity.
The initial frost thickness and frost density is set as 2 × 10⁻⁵ m and 25 kg·m−3, respectively. The initial frost surface temperature is equal to the evaporating temperature. The initial air flowrate is set as 0.0225 m3·s−1 according to the fan characteristic curve. The time step is set as 1 s.
2.5. Solution Scheme
A flow chart describing the implementation of the frosting evaporator model in this paper is shown in
Figure 3.
2.6. Model Validation
The model is validated by comparing simulation results with experimental data in open literature in our previous work [
21] as shown in
Figure 4. The test conditions are displayed in
Table 3. The maximum deviation is less than 15%. Smaller air velocity in Test 1 leads to greater deviation, but the air velocity is close to 1.2 m/s in the following simulation process. The maximum deviation of Test 2 is less than 4% and the model is valid.
Then, the model is utilized to study the effect of row-by-row fin distribution on frosting evaporator performance and a fin distribution design method of frost-free refrigerator evaporators is proposed based on the numerical results.
3. Results and Discussion
3.1. Case Study
3.1.1. Setup of Different Fin Distribution Schemes
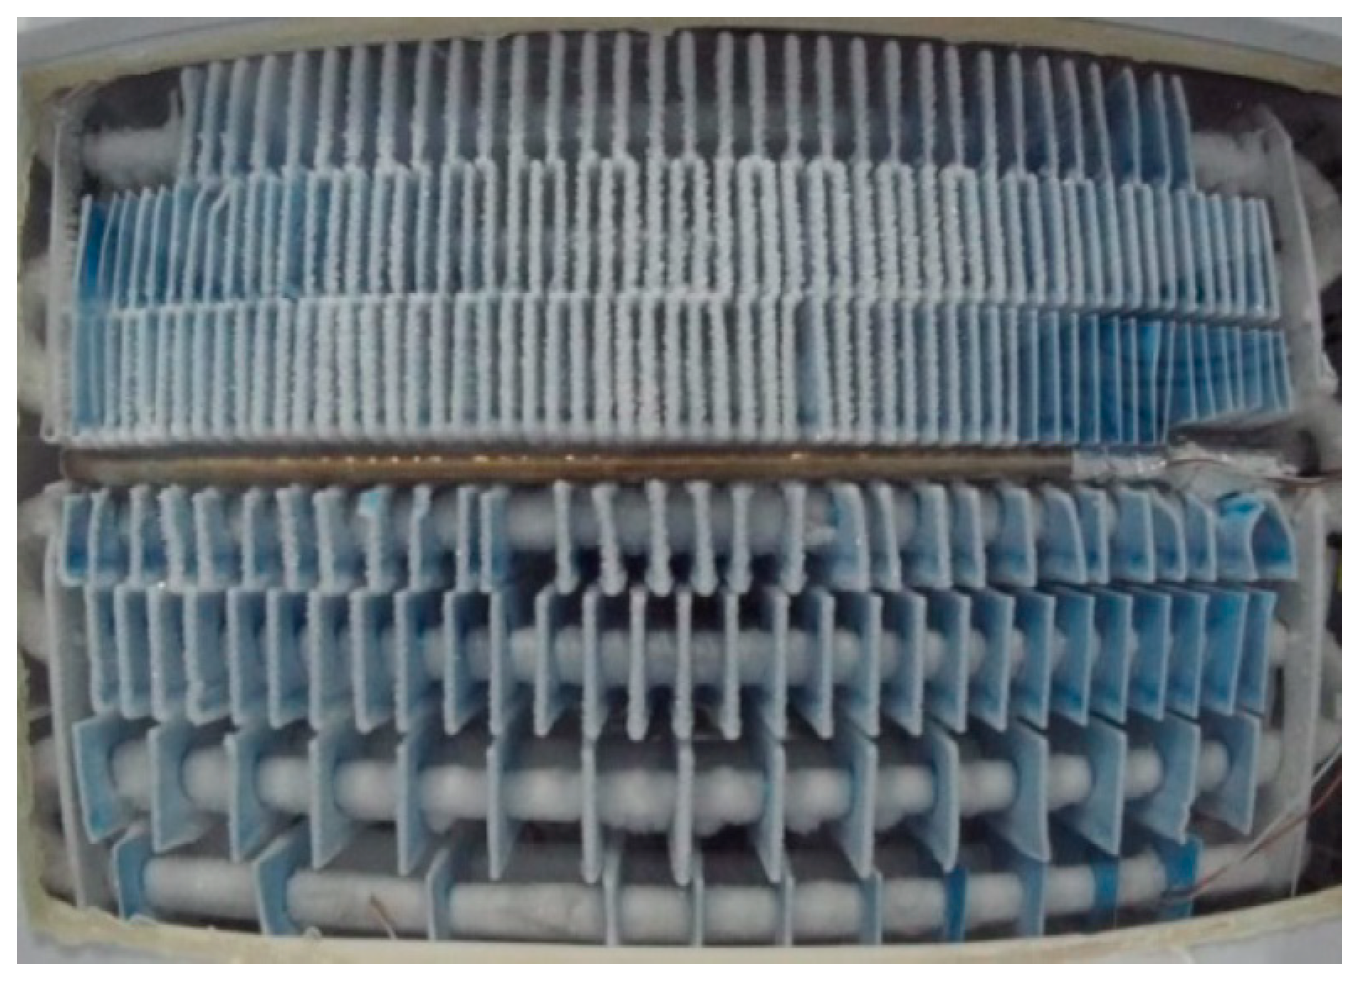
To match the reduced frost formation in the vertical direction due to the leading-edge effect [
20], the fin density is generally thinner in the upstream rows but denser downstream on the evaporator (except Row 7, considering the refrigerant migration during the starting stage of the compressor). However, too many fins in downstream tube rows can also cause severe frost blockage there, as shown in
Figure 5.
Based on the original fin distribution, other three different fin distribution schemes are proposed for the evaporator, as shown in
Table 4. The total fin numbers for these schemes are the same so that the heat transfer area can be the same when there is no frost. For the original scheme, the fin numbers of the Row 5 and Row 6 are the greatest and there is a high possibility that frost will block the airflow channel there. Therefore, some of the fins on downstream tube rows are moved to upstream tube rows in other three schemes to tackle this problem. Particularly, Scheme 2 is optimized based on the method of keeping the almost equal increase rate of the row-by-row air pressure drop.
3.1.2. Comparison of Heat Transfer Performance among Different Fin Schemes
The heat transfer performance of the frosting evaporator is numerically studied under the four schemes for the time duration of 400 min, and the results are comparatively analyzed.
Figure 6 comparatively illustrates the variations of the evaporator capacity with frosting time among the four schemes. The evaporator capacity for all schemes decreases first gradually and then rapidly. The turning points of the decrease rate occurs in the sequence of the original scheme, Scheme 1, Scheme 3, and Scheme 2 at 286 min, 321 min, 323 min and 337 min, respectively. Moreover, the optimized Scheme 2 has the highest evaporator capacity, followed by the Scheme 3, Scheme 1 and the original scheme. The difference between the highest and the smallest evaporator capacity gradually increases with frosting time. The maximum difference occurs at the end of frosting process when the evaporator capacity of the optimized Scheme 2 is 248 W, 24% higher than 200 W of the original scheme.
The fact that the evaporator capacity for the optimized scheme is higher than for other three schemes is mainly owing to its greater air flowrate. Similar to the evaporator capacity curves in
Figure 6, the air flowrate through the evaporator decreases gradually at first, and rapidly then as shown in
Figure 7. The air flowrate of the optimized Scheme 2 is greatest, which accords with that of the evaporator capacity. At the end of frosting process, the air flowrate of the optimized Scheme 2 is 0.0146 m
3·s
−1, which is 35% higher than that of the original scheme.
For all cases, both evaporator capacity and air flowrate exhibit a gradual decrease period at first and a sharp decrease one then. The turning point occurs when the axial fan enters the stall area where the airflow rate decreases sharply with slight increase of air pressure drop. In general, the optimized Scheme 2 has the greatest air flowrate and the latest stall point of the axial fan, leading to its highest evaporator capacity and the latest turning point. Therefore, the optimized Scheme 2 shows the highest time-averaged evaporator capacity, 4.6% higher than the original fin scheme.
The difference in the air flowrate among four schemes is induced by that in the overall pressure drop of the evaporator. The increase of pressure drop will decrease fan air flowrate according to the flow characteristics of the fan. When the pressure drop reaches 16 Pa, the fan stall occurs. As shown in
Figure 8, the pressure drop of the optimized Scheme 2 is smallest among the three cases. At 400 min, the air pressure drop of the optimized Scheme 2 is 17.3 Pa, which is 9.6% lower than 19.1 Pa of the original scheme.
3.1.3. Comparison of Hydraulic Characteristics among Different Fin Schemes
The original scheme and Scheme 2 are specially investigated for further study due to their largest difference in overall pressure drop. The hydraulic performance of the frosting evaporator under these two fin distribution schemes is comparatively studied.
The row-by-row pressure drop of the evaporator between the two schemes is compared in
Figure 9.
Figure 9 shows that the initial value of the pressure drop in the 5th and 6th rows in the original scheme is relatively large and increases rapidly due to the larger number of fins. At the end of the frosting process, the pressure drop of these two rows is 10.3 Pa and 4.85 Pa respectively, accounting for 80% of the overall pressure drop through the evaporator. However, the pressure drop for the 1st row is 0.34 Pa, which is only 3% of that for the 5th row. This extremely uneven distribution of row-by-row pressure drop for the original scheme leads to its highest overall pressure drop. By contrast, the single-row pressure drop in the optimized scheme increases gradually and uniformly. At 400 min, the difference between the highest and the smallest pressure drop is only 0.3 Pa. Therefore, it can be inferred that the total pressure drop will be the smallest when pressure drop of each row increases uniformly.
As frosting progresses, the frost layer gradually blocks the flow channel between adjacent fins, and leads to the increase in local pressure drop. Hence, the single-row pressure drop depends mainly on the blockage ratio defined by Equation (8).
where
is the length of elements,
is the width of t evaporator,
is the height of fin,
is the thickness of fin,
is the thickness of frost,
is the external tube diameter.
As shown in
Figure 10, the blockage ratio of each tube row differs remarkably in the original scheme. The 5th and 6th rows have the highest blockage ratio, which explains their maximum single-row pressure drop. The blockage ratio of the 5th row is the largest, 29.5% higher than that of the 7th row which is the smallest. In the optimized scheme, however, the blockage ratio is uniformly distributed among the seven tube rows with very small difference. The blockage ratio of the 1st row is the largest and that of the 7th row is the smallest, which is 62.8% and 55.8% at 400 min, respectively, with a difference of only 7%. This leads to a more uniform distribution of single-row pressure drop in
Figure 9.
The blockage ratio between adjacent fins is influenced mainly by two factors: fin spacing and frost thickness. The frost layer thickness of each row for the original scheme and the optimized scheme is compared in
Figure 11. Results show that the frost layer thickness of both two schemes decreases along the direction of air flow due to the leading-edge effect [
18]. Hence, in order to prevent frost layer from completely blocking the airflow passage of upstream rows, the fin density is generally thinner in the upstream rows but denser in the downstream rows on the evaporator. In the original scheme, however, fins in the 5th and 6th tube rows seem to be over-dense and cause local blockage there. In the optimized scheme, by contrast, the fin spacing and frost thickness reached the condition that makes the blockage ratio of all tube rows similar.
From the above discussion, it can be concluded that the optimization method of equal increase rate in row-by-row air pressure drop works by reaching a good match between the frost and fin distribution. Here the increase rate means the evolution in time of the pressure drop during a frosting process. Consequently, the overall air pressure drop of the evaporator can be smaller, leading to higher air flowrate and evaporator capacity.
3.2. Proposal of the Optimization Method
In
Section 3.1.2, by comparing the heat transfer performance among different fin schemes, it can be concluded that when the air pressure drop of each row increases in equal rate over time, the overall air pressure drop of the evaporator can be smaller, leading to higher air flowrate and evaporator capacity.
In
Section 3.1.3, by comparing the hydraulic characteristics among different fin schemes, it can be concluded that the optimization method of equal increase rate in row-by-row air pressure drop works by reaching a good match between the airflow humidity and fin distribution.
The logical frame is displayed in
Figure 12. The fin scheme with an equal increase rate in the air pressure drop of each row is the optimized scheme with best evaporator capacity.
3.3. Robustness Analysis of the Optimization Method under Wide Operating Conditions
In a real household refrigerator, the temperature and humidity of the airflow vary with the operating conditions. Thus, it is necessary to test the robustness of the optimization method under wide operating conditions.
The refrigerator studied in this research consists of refrigerating, variable-temperature and freezing compartments with a single evaporator. The return air from the freezing compartment always flows across the evaporator during the operation of the compressor and covers the whole frontal area of the evaporator. On the other hand, the return air from the refrigerating and variable-temperature compartments must first pass through the corresponding dampers which are controlled by the temperature sensor in the compartments. When the temperature of the compartments reaches the set value, the damper closes. Thus, based on the system control strategies above and port locations of the return air shown in
Figure 1, the possible return air composition conditions are listed in
Table 5.
The optimized fin distribution based on the method of keeping the almost equal increase rate of the row-by-row air pressure drop is calculated under different temperature & humidity conditions and the results are displayed in
Figure 13. The difference among optimized fin distributions under different conditions is small. The maximum deviation of fin numbers in each row is less than 2. This shows the optimized fin distribution is adaptable to wide operating conditions and the optimization method proposed in this research has good robustness. By comparing condition #1 and #4, it is also proved that whether the return air is evenly mixed or not has little influence on the optimized fin distribution.
3.4. Equivalent Implementation of the Optimization Method under Initial No-Frost Condition
The optimization method proposed in this paper needs to obtain the row-by-row pressure drop data after the refrigerator has been operating for a while and then make fin distribution adjustment accordingly. However, it is difficult to do these operation experiments and adjustments in the actual evaporator design process. Thus, this paper also proposes an equivalent implementation method to provide predictive reference for evaporator design.
From the above discussion in
Section 3.1, it can be concluded that the optimization method works by reaching a good match between the frost and fin distribution. Frost blockage ratio can be an index to evaluate the matching degree.
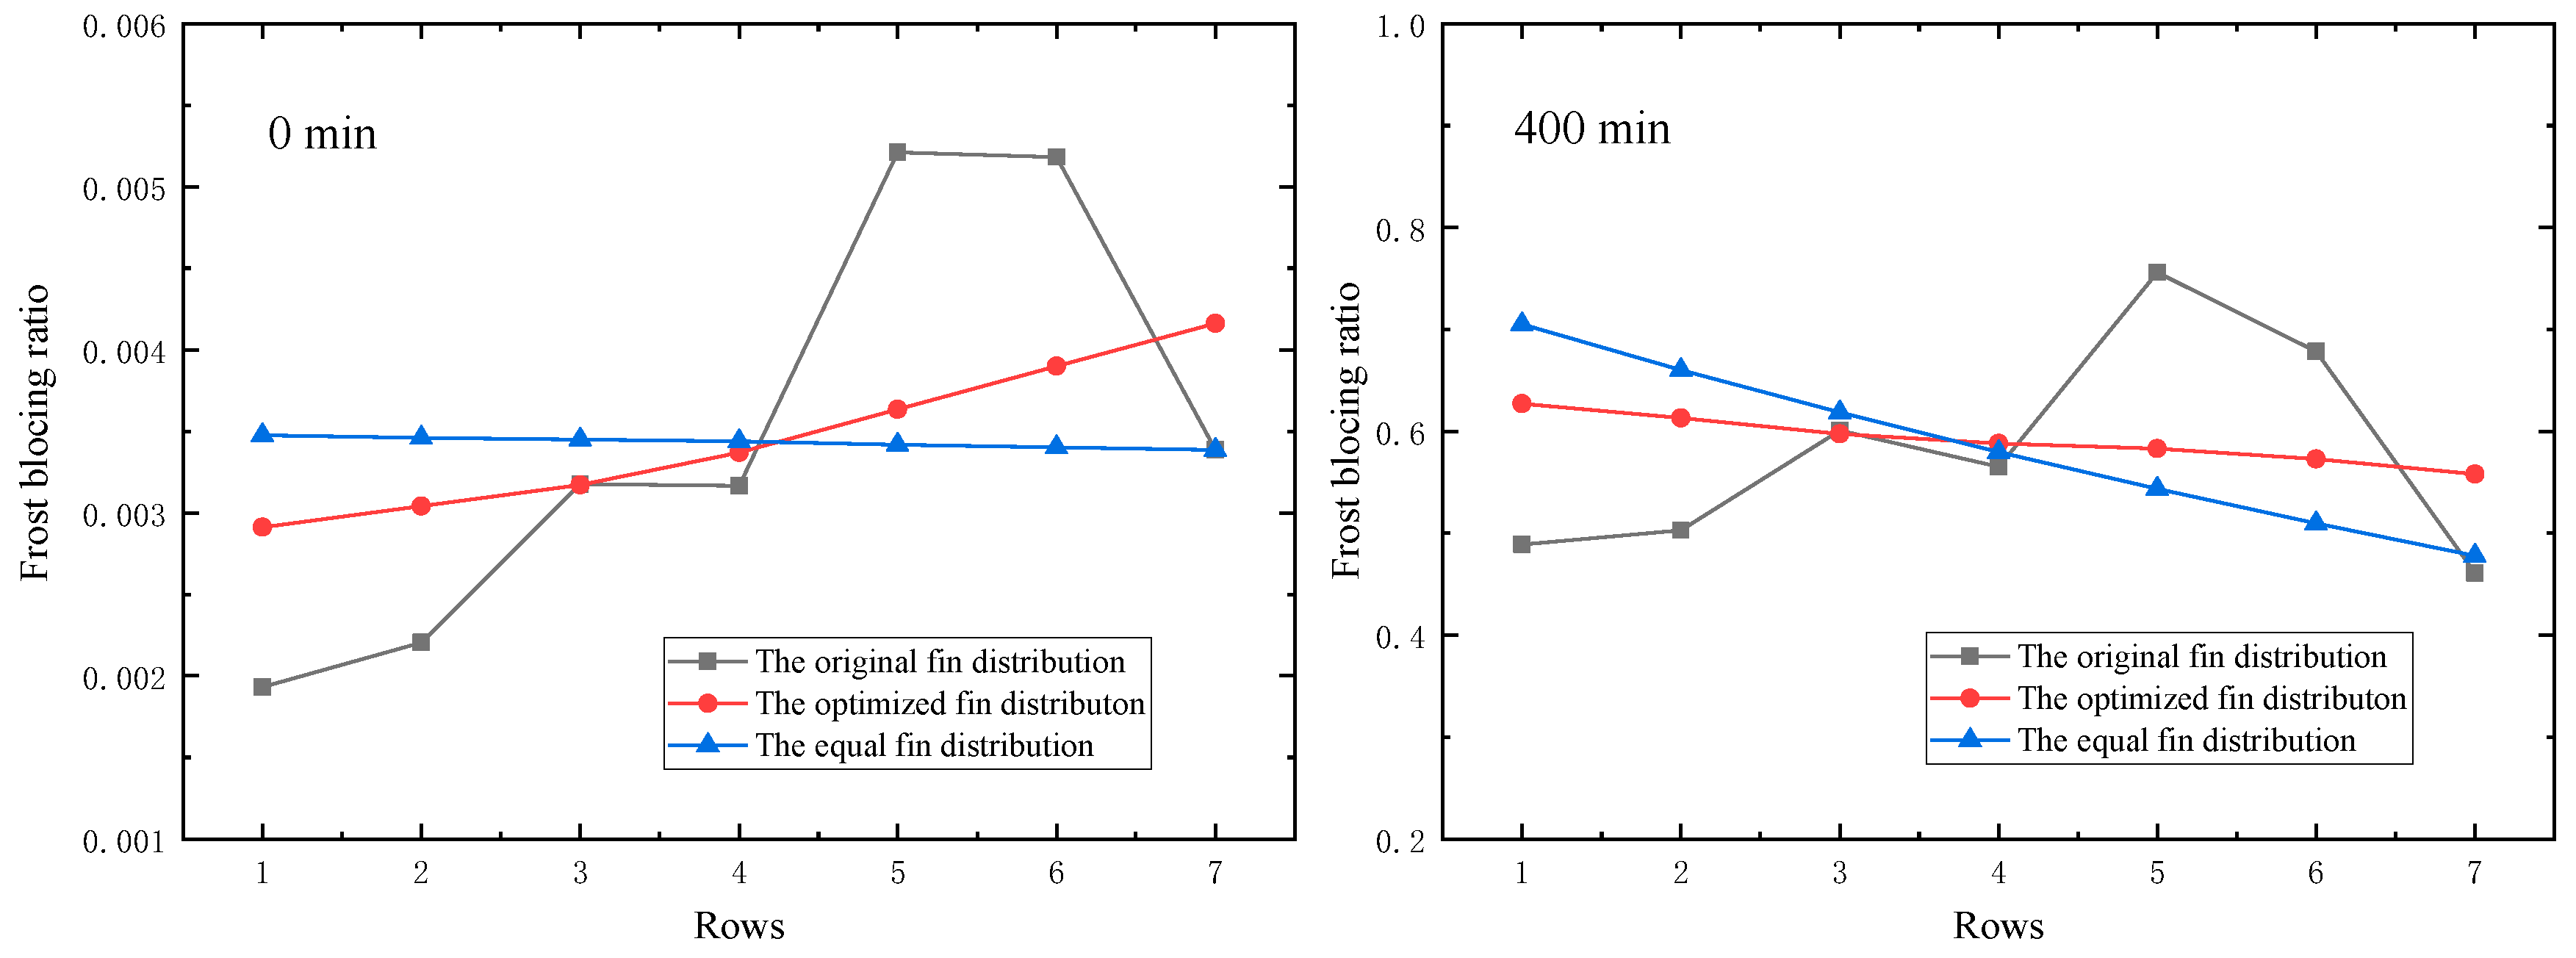
Figure 14 comparatively illustrates the frost blockage ratio of three fin distribution at 0 min and 400 min.
For the equal fin distribution, the frost blockage ratio is only influenced by the airflow humidity distribution (i.e., the leading-edge effect) and is the same in all tube rows at 0 min. With the frost growth, the frost blockage ratio gradually increases and at 400 min, it reduces along the airflow direction. On the other hand, the blockage ratio of each row is almost the same for the optimized fin distribution at 400 min. This is because the fin density in the optimized scheme is well coupled with the airflow humidity distribution.
The effects of airflow humidity distribution and the fin distribution are analyzed separately below. At 400 min, the relative slope factor of the blockage ratio for the equal fin distribution
is calculated by the Equation (9) below and it can be taken as the influence factor of the humidity distribution (i.e., the leading-edge effect). The relative slope factor of the blockage ratio for the optimized fin distribution
is also calculated and this factor is the required parameter in engineering applications. Results show that it meets the following criterion (10): the relative slope factor of the blockage ratio for the equal fin distribution at 400 min plus that for the optimized fin distribution at 0 min is equal to 0.
where index
refers to average,
refers to the airflow humidity distribution,
refers to fin distribution,
is the relative slope factor and
is the blockage ratio of the row.
In this research, the influence factor of the leading-edge effect is −0.06 as a reference. The optimized fin distribution can be then calculated by the factor based on the Equation (10). This equivalent implementation method allows the optimization calculation to proceed with initial parameters only. It greatly simplifies the calculation process and improves feasibility for evaporator design.
3.5. Limits of the Optimization Method
The number of fins in each row is an integer. Thus, when the method is used to calculate the optimized scheme, the fin number must be rounded. The adjustment of fin distribution is not stepless. Apart from that, the total fin numbers of the schemes studied in this paper are the same so that the heat transfer area can be the same when there is no frost. That means that this method is only based on the fixed total heat transfer area of the evaporator. However, the evaporator heat transfer area itself is set inappropriately in some cases. Such cases will be considered in our future work.


