Article

Study on the Motion Characteristics of 10 MW Superconducting Floating Offshore Wind Turbine Considering 2nd Order Wave Effect

1
Department of Floating Offshore Wind Energy System, University of Ulsan, Ulsan 44610, Korea
2
Institute of Theoretical and Applied Research, Duy Tan University, Hanoi 100000, Vietnam
3
Faculty of Natural Sciences, Duy Tan University, Da Nang 550000, Vietnam
*
Author to whom correspondence should be addressed.
Energies 2021, 14(19), 6070; https://doi.org/10.3390/en14196070
Submission received: 8 July 2021 / Revised: 17 September 2021 / Accepted: 20 September 2021 / Published: 23 September 2021
(This article belongs to the Section F: Electrical Engineering)

Abstract

:
Recently, several countries have made commitments to move to a net-zero emission by the year 2050 in a response to climate change. Among various renewable energy systems to realize the target, wind energy system has been gaining much attention as a favorable alternative source to fossil fuel energy. In particular, many floating offshore wind turbines (FOWT) are expected to be installed because of vast installation resources without water depth limit conditions, stable and strong wind resources, relatively low constraints on noise emission, and space restriction compared to onshore wind turbines. In this study, a 10 MW superconducting floating offshore wind turbine was modeled with a 1/90 scale ratio and was experimentally tested at the Ocean Engineering Widetank of the University of Ulsan. The model calibration of the scaled model was performed with free decay test and showed a good correlation with simulation results calculated from FAST V8 of NREL. The motion characteristics of the 10 MW superconducting FOWT semi-submersible type platform was investigated under regular waves and irregular waves through the comparison of model test data and simulation results. The study on the motion characteristics of the model showed that the simulation considering the 2nd order wave effects to hydrodynamic forces and moments provided better accuracy close to the model test data.

Graphical Abstract

1. Introduction

The world is currently moving toward a carbon zero-emission and wind energy is one of the renewable energies that is gaining attention as an alternative energy source to existing coal-fired power energy. Wind power generation systems are becoming larger in size in order to be more efficient and to generate more power, and their installation area is moving to offshore areas with better wind quality and relatively low restriction on noise than onshore areas. In line with this trend, wind turbine manufacturers are developing a giant offshore wind energy system beyond 10 MW capacity, even near 15 MW [1]. The size of the generator increases as the capacity of the wind turbine increases, so the application of a superconducting generator has been researched to reduce the overall weight of the wind turbine generator. The 3.6 MW class superconducting wind power generation system was developed and demonstrated as the EU Eco-swing project in 2019 [2], and the US Department of Energy has also planned that it will develop a 15 MW superconducting wind power system [3]. For utilizing the vast wind resource and overcoming site limitations, a floating offshore wind energy system has been studied and is becoming a reality recently. Equinor constructed a commercial floating offshore wind farm from the Hywind-Scotland project in 2019, and MHI Vestas launched the Kincardine project to install a huge 9.6 MW class floating offshore wind power system [4]. The conventional wind turbine generators, including DFIG and direct-driven generators, have some drawbacks such as low capacity and low economy. To resolve the drawback recently, there have been a few types of research on superconducting wind turbine generators [5,6,7]. Unlike traditional horizontal wind turbine generators, superconducting wind turbine generators have advantages at zero resistance, smaller size, and lighter weight. Based on the size and weight perspective, it is expected for the superconducting wind turbine to become the main trend in the future. However, up to date, there is little paper on the experimental model test and its validation directly related to S-FOWT. According to the official plan announced by the Korean government, a 200 MW floating offshore wind farm will be constructed in the East Sea beginning in 2024 [8]. The east coast of Korea is a site where the water level gradually deepens more than 50 m, even though it is just 2~3 km away, therefore a floating offshore wind power system turned to be more suitable. In this study, the test of a scaled 10 MW S-FOWT(Superconducting Floating Offshore Wind Turbine) model was conducted using the environmental conditions of the East Sea of Korea, and the FAST analysis tool developed by the NREL (National Renewable Energy Laboratory) was utilized for the numerical analysis, which was used for the validation of the test result. The model test was carried out at the Ocean Engineering Widetank in the University of Ulsan. For the preliminary design of a 10 MW S-FOWT model, a 5 MW class OC4 Semi-submersible platform and DTU RWT 10 MW model was referred to as a base. As a representative validation study of the floating offshore wind power system, there is a study applying a 5 MW class DeepCwind semi-submersible platform [9]. Afterward, a paper considering the effect of second-order wave load in the numerical analysis verification of the semi-submersible platform was published through the Offshore Code Comparison Collaboration Continuation (OC4) project [10]. Based on these reference papers, this study conducted a validation of the 10 MW class S-FOWT model test considering the second-order wave load. The second-order wave load was calculated using UOU in-house code, and this process was validated by the co-author’s research on the numerical analysis and experiment result of the 5 MW class FOWT [11]. This paper also contains findings from a KEPCO (Korea Electric Power Corporation, Naju-si, Korea) project about the development of a 10 MW class S-FOWT.

2. Model Description

2.1. Wind Turbine

A model test on a 10 MW S-FOWT was carried out in this study, in accordance with the trend of larger offshore wind power generators. The technical specifications of the system were referred to from the project of the superconducting 10 MW class floating offshore wind power system development supported by KEPCO (Korean Electric Power Corporation) [12]. Although superconducting generators have not yet been commercialized in wind power generators, they are being studied as an alternative to reduce the weight of the nacelle, which is becoming increasingly important as wind turbines become larger. The power scale ratio was used to extend the blade, and the overhang length was determined by checking the deflection of the extended blade tip to secure tower clearance. Table 1 summarizes the detailed specifications of the 10 MW class superconducting generator used in this model test, together with the parameters of the DTU RWT 10 MW class for a comparison [13].

2.2. Floating Platform

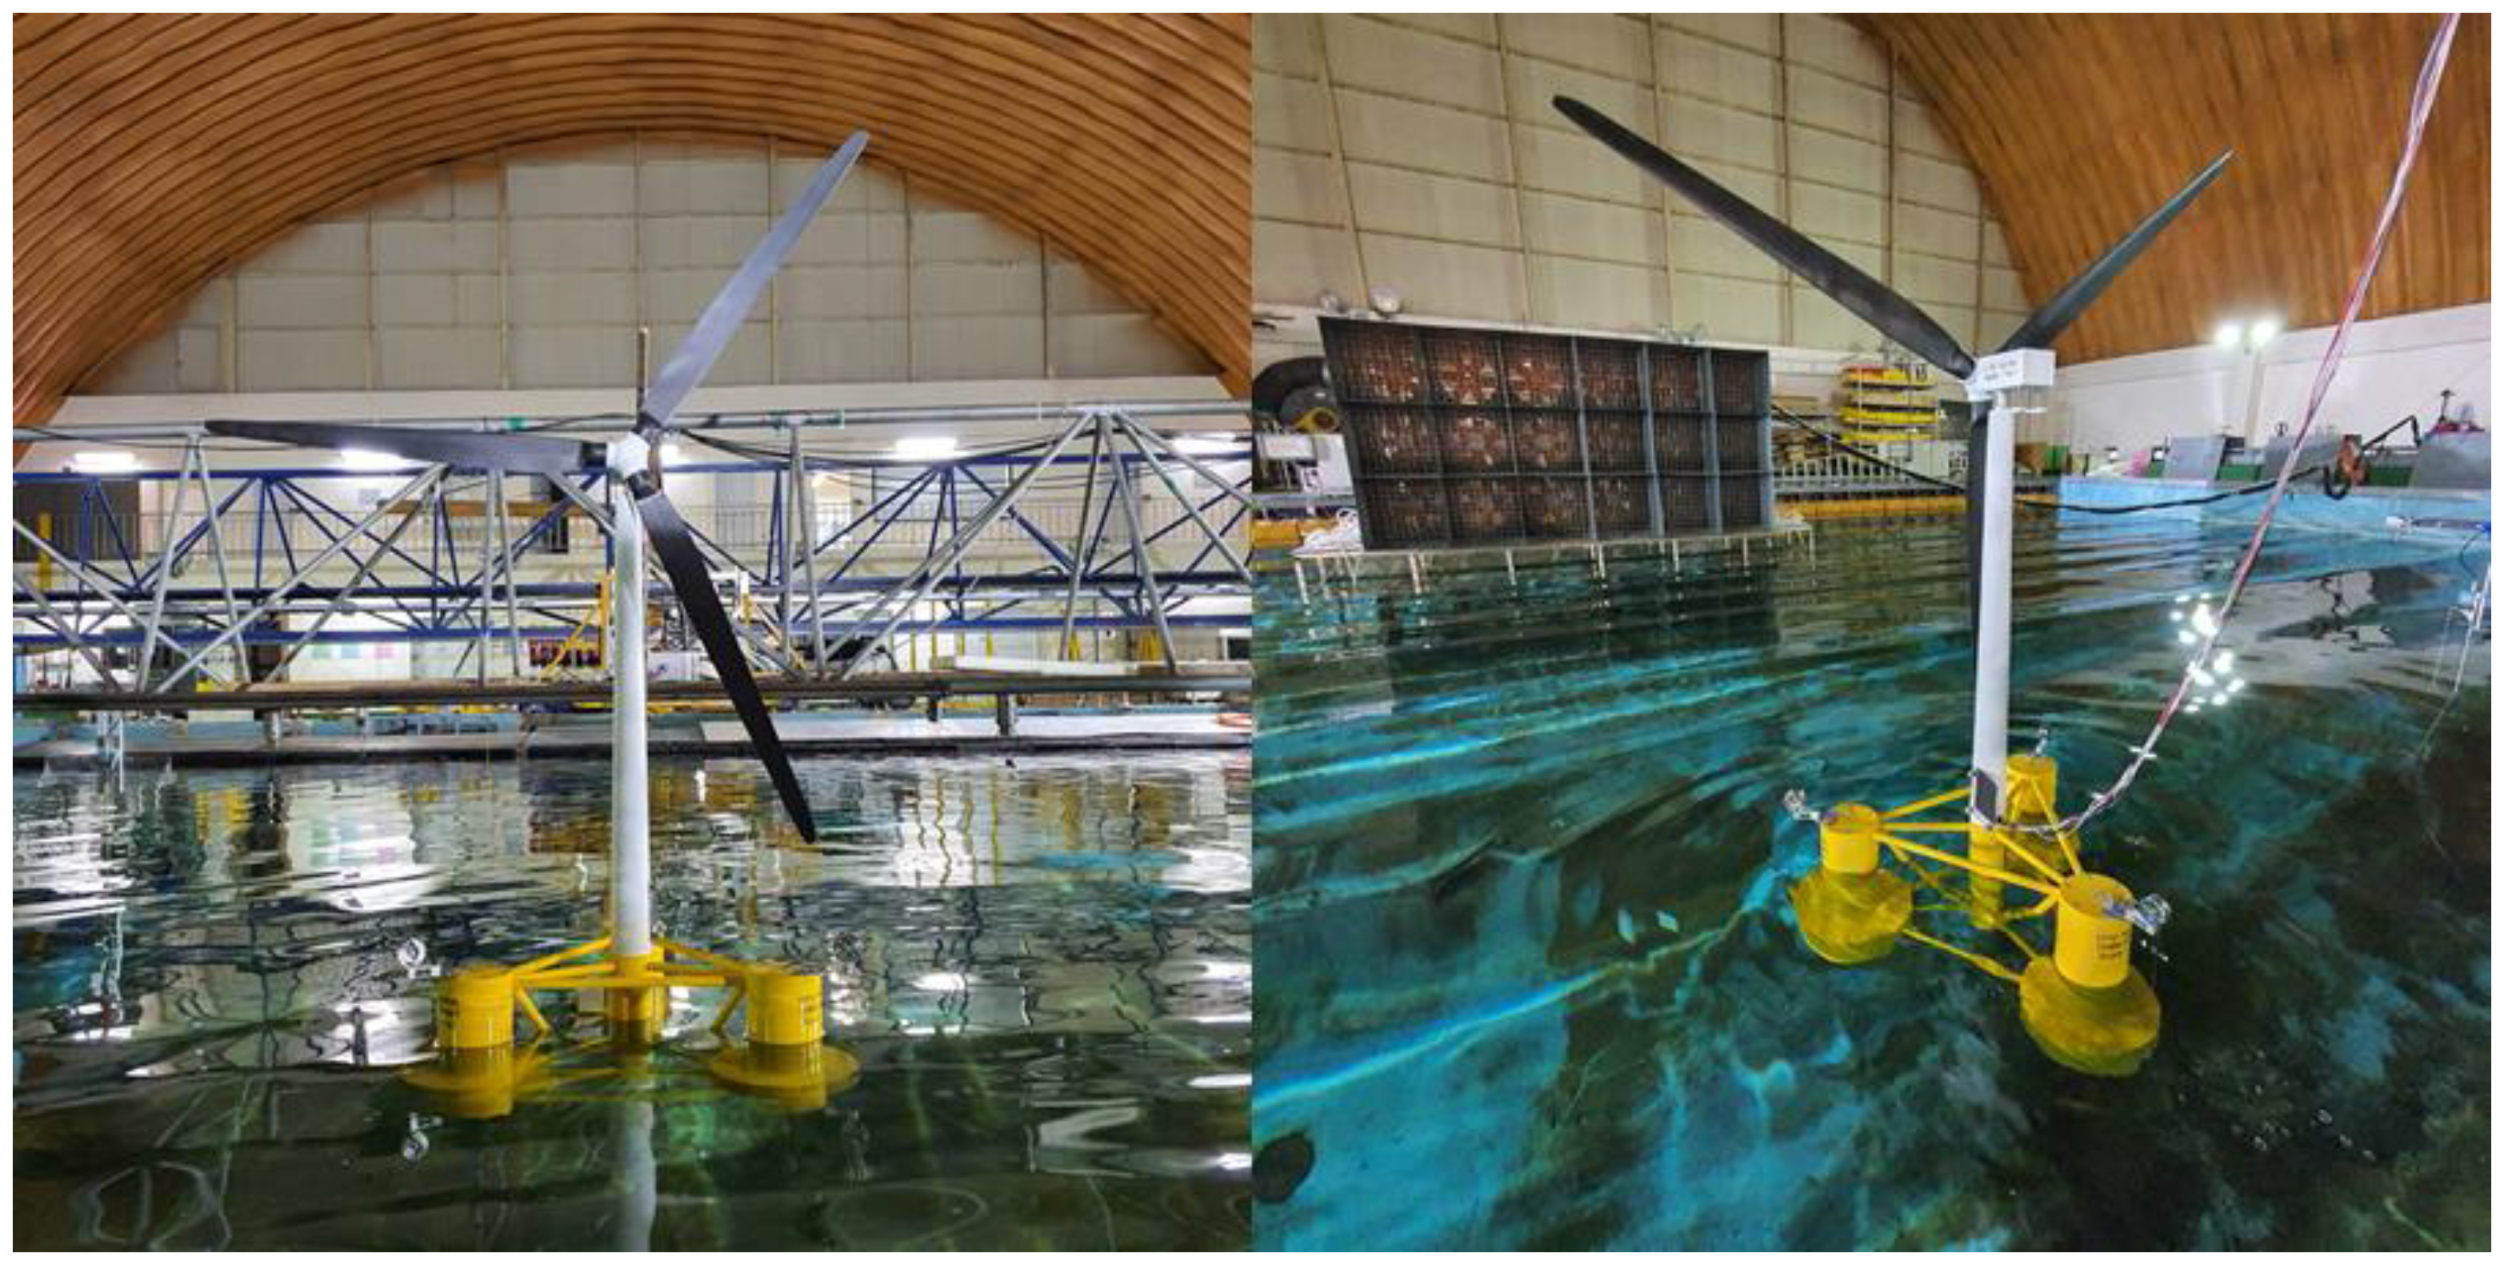
The floating platform was designed based on the OC4 semi-submersible type [14], and the scale-up ratio was calculated using the upper structure’s weight ratio. Table 2 summarizes the platform’s detailed specifications. The mooring system was redesigned to the depth of 150 m in the East Sea of Ulsan, and the design specifications are summarized in Table 3. In a previous study, the University of Ulsan has conducted similar experiments on a 10 MW class floating platform [15], and in this study, a new experiment including an irregular wave condition was conducted on with different dimensions of floaters. Figure 1 shows the general arrangement of the 10 MW floating offshore wind power system.

2.3. Scale Model (1:90)

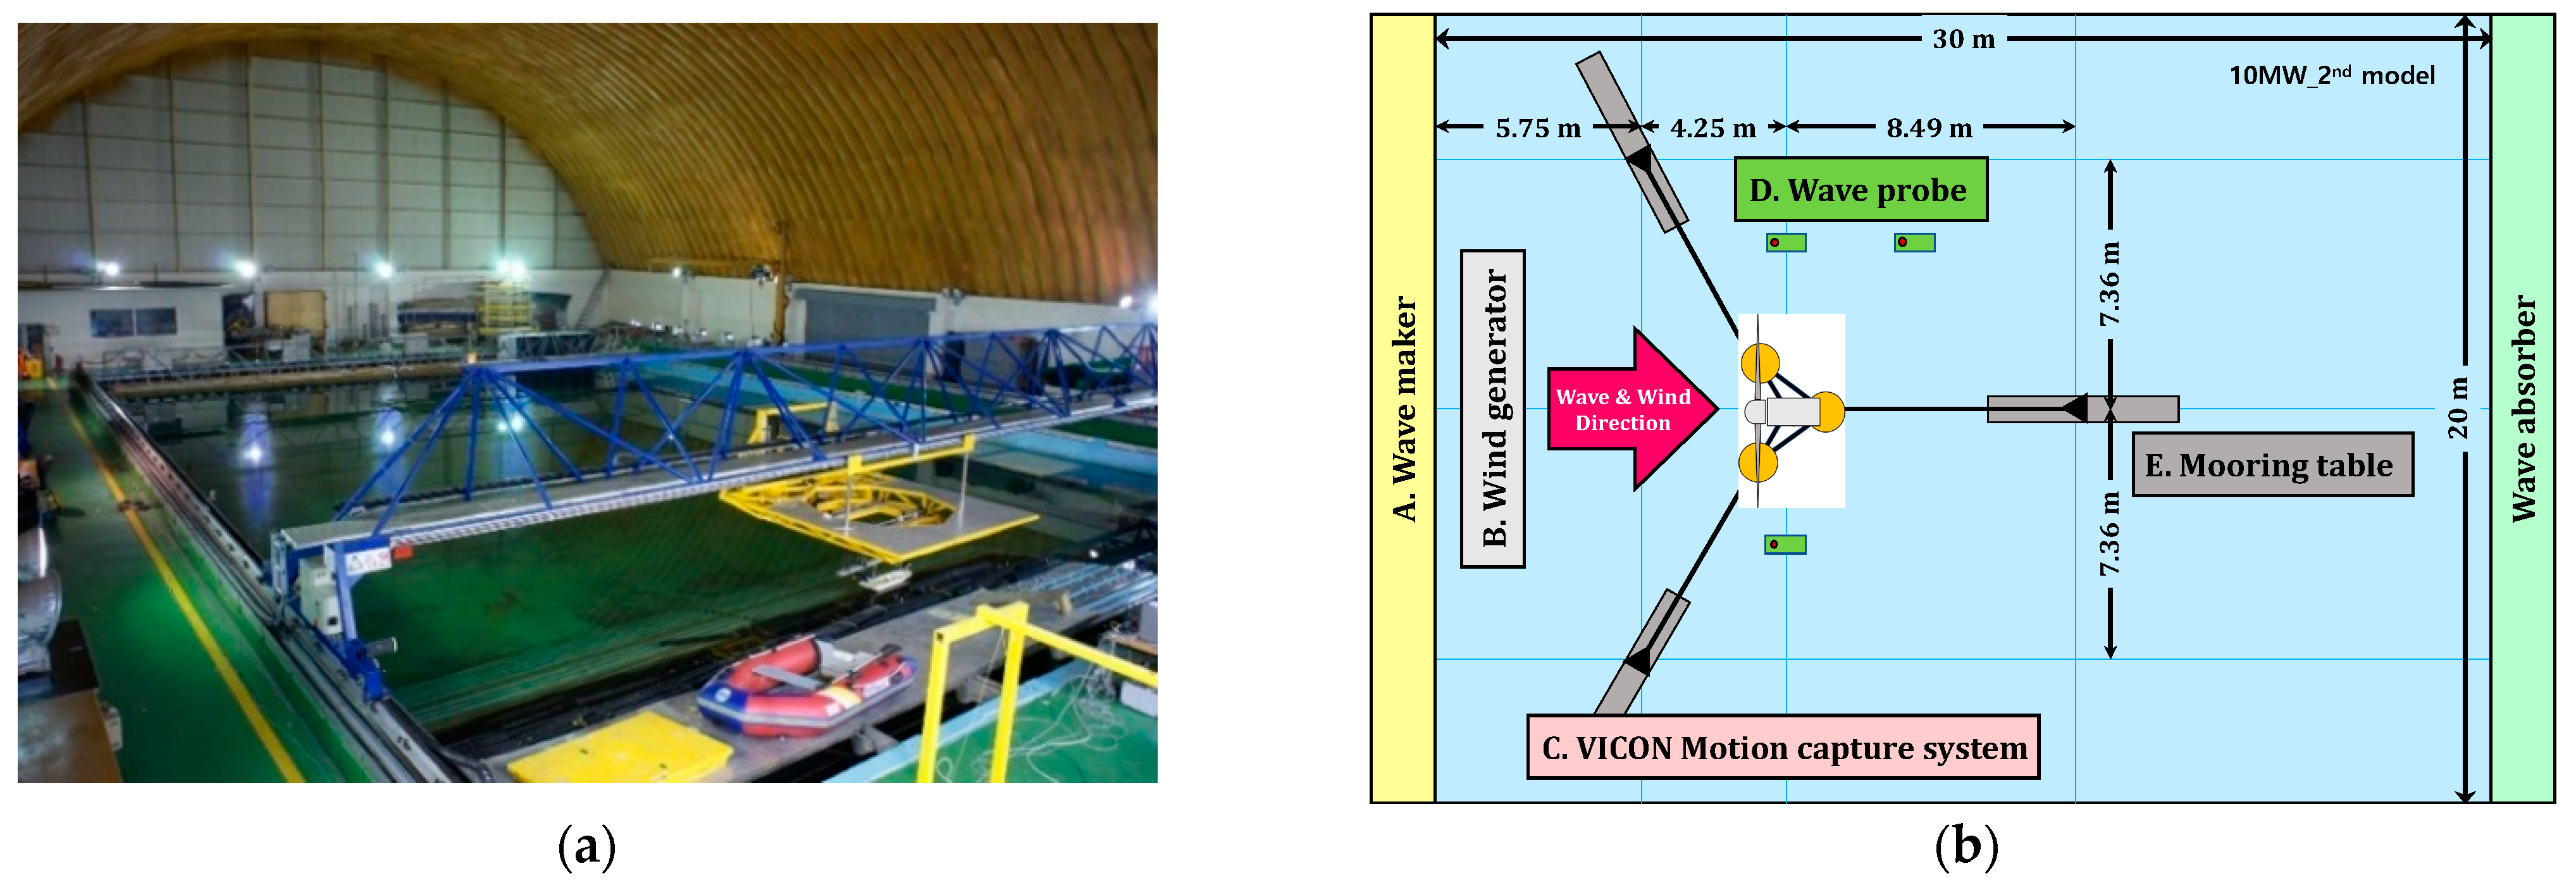
The scale model test of 10 MW S-FOWT was conducted in Ocean Engineering Widetank at the University of Ulsan. Widetank is a testing facility with 30 m in width, 20 m in length, and 2.5 m in depth. The model’s scale ratio was chosen to be 1:90 based on the maximum mooring line length that can be installed in the width of the Widetank. As it is difficult to satisfy both the Froude and Reynolds numbers properly to construct scale models for the experiment, the scale model similarity in this study was derived based on the Froude number. Table 4 compares the values of the ideal scale model and the values of the actual manufactured model. When comparing different rates between the ideal model and the actual manufactured model, most items had a deviation of less than 5%. A weight made of aluminum was used to rearrange the center of mass and inertia of the actual manufactured model. Figure 2 shows the installation view of the test model, and the flow field generated around the floating platform by the waves can be observed.

3. Model Test

3.1. Model Test Facilities

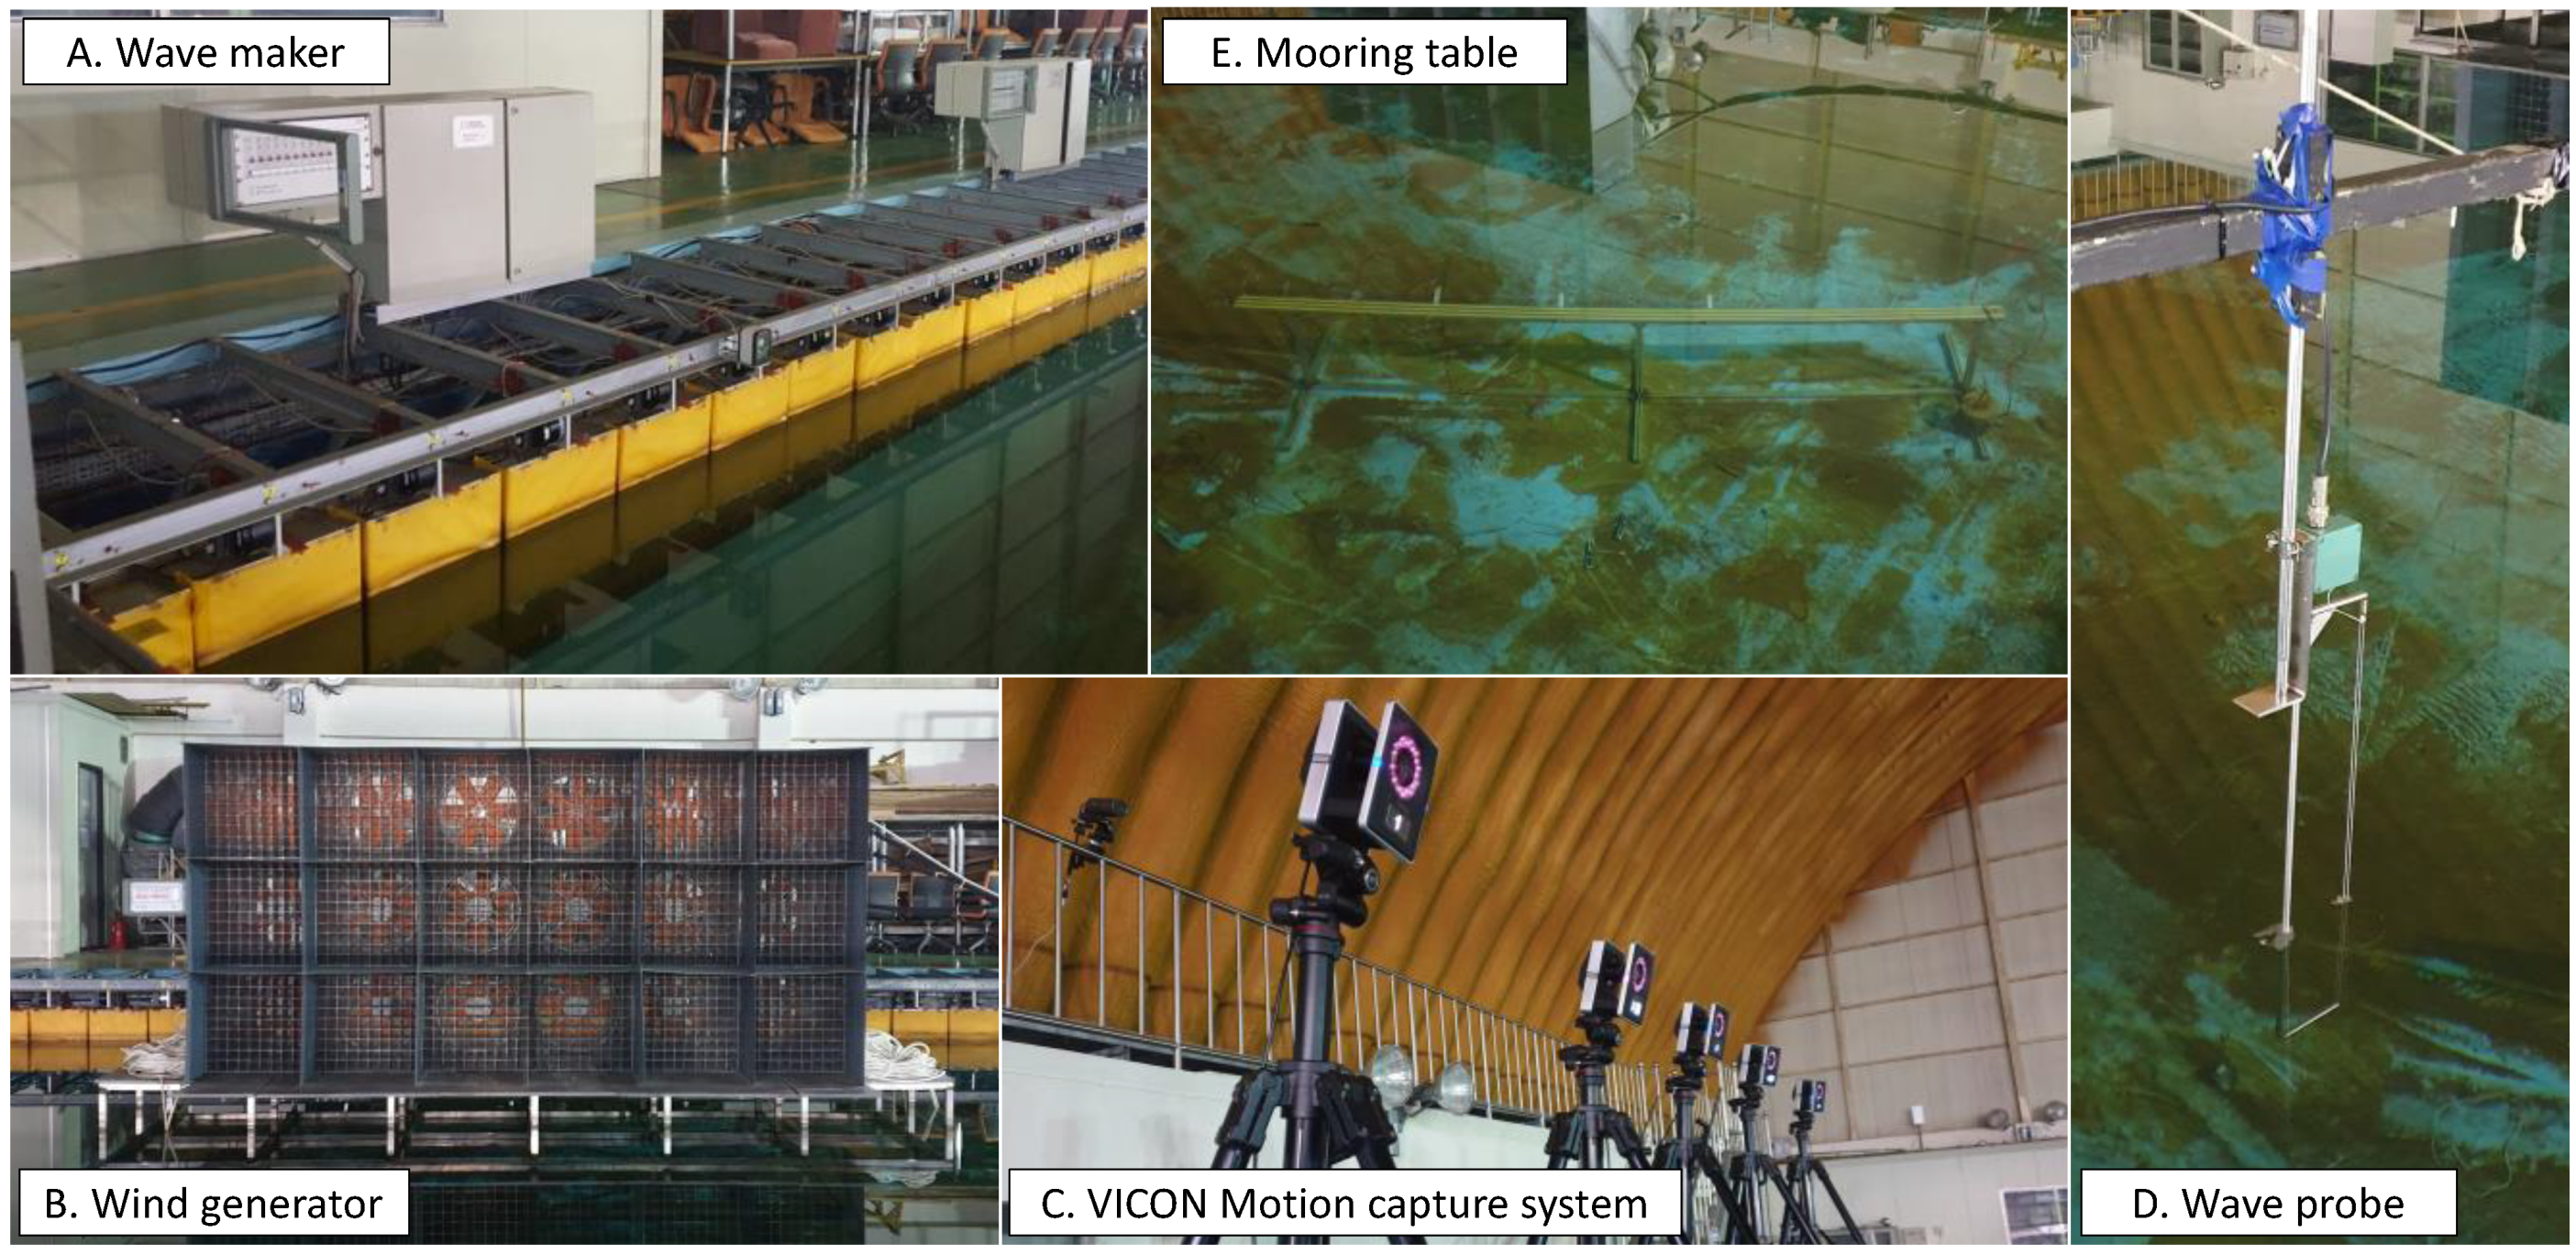
Figure 3 depicts the model’s installation configuration as well as the layout of the Widetank test facilities. Two mooring lines are arranged in the direction of the incoming wave and wind, and to reduce the effect of reflected waves, a wave absorber was installed where the wave converges. Figure 4 shows the model test equipment and sensor. The wavemaker in Figure 4A is made up of 40 paddles and can generate waves up to 0.2 m in height. The wind generator in Figure 4B consists of 18 fans and a grid is installed to create a uniform wind field. The width is 4.2 m, and the height is 2.1 m, which covers the rotating blade area. The VICON motion capture system in Figure 4C was installed on the model’s left wall to record the S-FOWT model’s six-degrees of freedom motion response. The VICON camera was set to frame rate 50 Hz, and it has a resolution of 16 million pixels. The origin point of the global coordinate in the numerical analysis is placed on the MSL (Mean Sea Level) of the model center column, two wave probes in Figure 4D were mounted on each side of the model center column. The wave probe has a data response of 10 Hz and has a high accuracy of linearity error ± 0.3 % . Since this study is considering a water depth of 150 m, anchors should be installed at a depth of 1.67 m in the 1:90 scale model experiment. Therefore, a mooring table in Figure 4E was built to match the depth of the anchor point’s water, and a mooring line was laid the length of the touchdown.

3.2. Model Test Condition

The S-FOWT model was tested under three different conditions: free-decay, regular wave, and irregular wave. The regular wave is a condition for verifying RAO, which is the motion response characteristic of a FOWT among constant waves, and the irregular wave is a condition for verifying the response of a FOWT in a nonlinear wave to which second-order wave force is applied. Irregular waves can reflect complex environmental conditions similar to the real sea. Table 5 summarizes the model test conditions. For wind conditions, the rated wind speed was applied, and through this, the response when the thrust generated in the rotor is maximized can be confirmed.
From the scale model test, it is difficult to match the aerodynamic characteristics between the wind speed and thrust force. Therefore, the blade shape of the scale model was redesigned to match the thrust near the rated rotor speed, and the wind speed in the model test was reduced. Table 6 shows that the deviation in wind speed is around 16%, but the deviation in thrust generated by model testing is less than 1%.

3.3. Model Calibration: Free-Decay Test

A free-decaying test was performed to confirm the natural period of the S-FOWT motion response. The equation of motion of the floating offshore platform is represented in Equation (1) [16]. Where M is the mass matrix, A is the frequency-dependent added-mass matrix, D is the damping matrix, f is the vector function, K is the nonlinear restoring matrix, h is the retardation function, x ,   x ˙ ,   x ¨ represent the position, velocity, and acceleration vectors of the platform, F is the excitation force vector including first-order and second-order wave forces, t is time. And the viscous drag force is proportional to the square of relative velocity between the fluid and the structure and is scaled using the coefficient of drag Cd which is represented in Equation (2) [17].
( M + A ) x ¨ + D f ( x ˙ ) + K x + 0 t h ( t τ ) x ˙ ( τ ) d τ = F ( t , x , x ˙ )
F D = C d ρ W ( R + t M G ) V r e l ( V r e l · k ^ ) k ^ 2 ( V r e l ( V r e l · k ^ ) k ^ )
Figure 5 depicts a comparison of the experimental and numerical analysis results. To match the free-decay results of the numerical analysis, the drag coefficient was adjusted as follows. The drag coefficient in the vertical direction (Cdz) is 4.0 and the drag coefficient in the horizontal direction (Cd) of the base column is 1.0, and the upper column and the cross brace is 0.78. Table 7 demonstrates that when surge, heave, and pitch free-decay motion were compared, the deviation with numerical analysis was less than 3%.

4. Model Test Result Validation and Verification

4.1. Numerical Analysis Approach

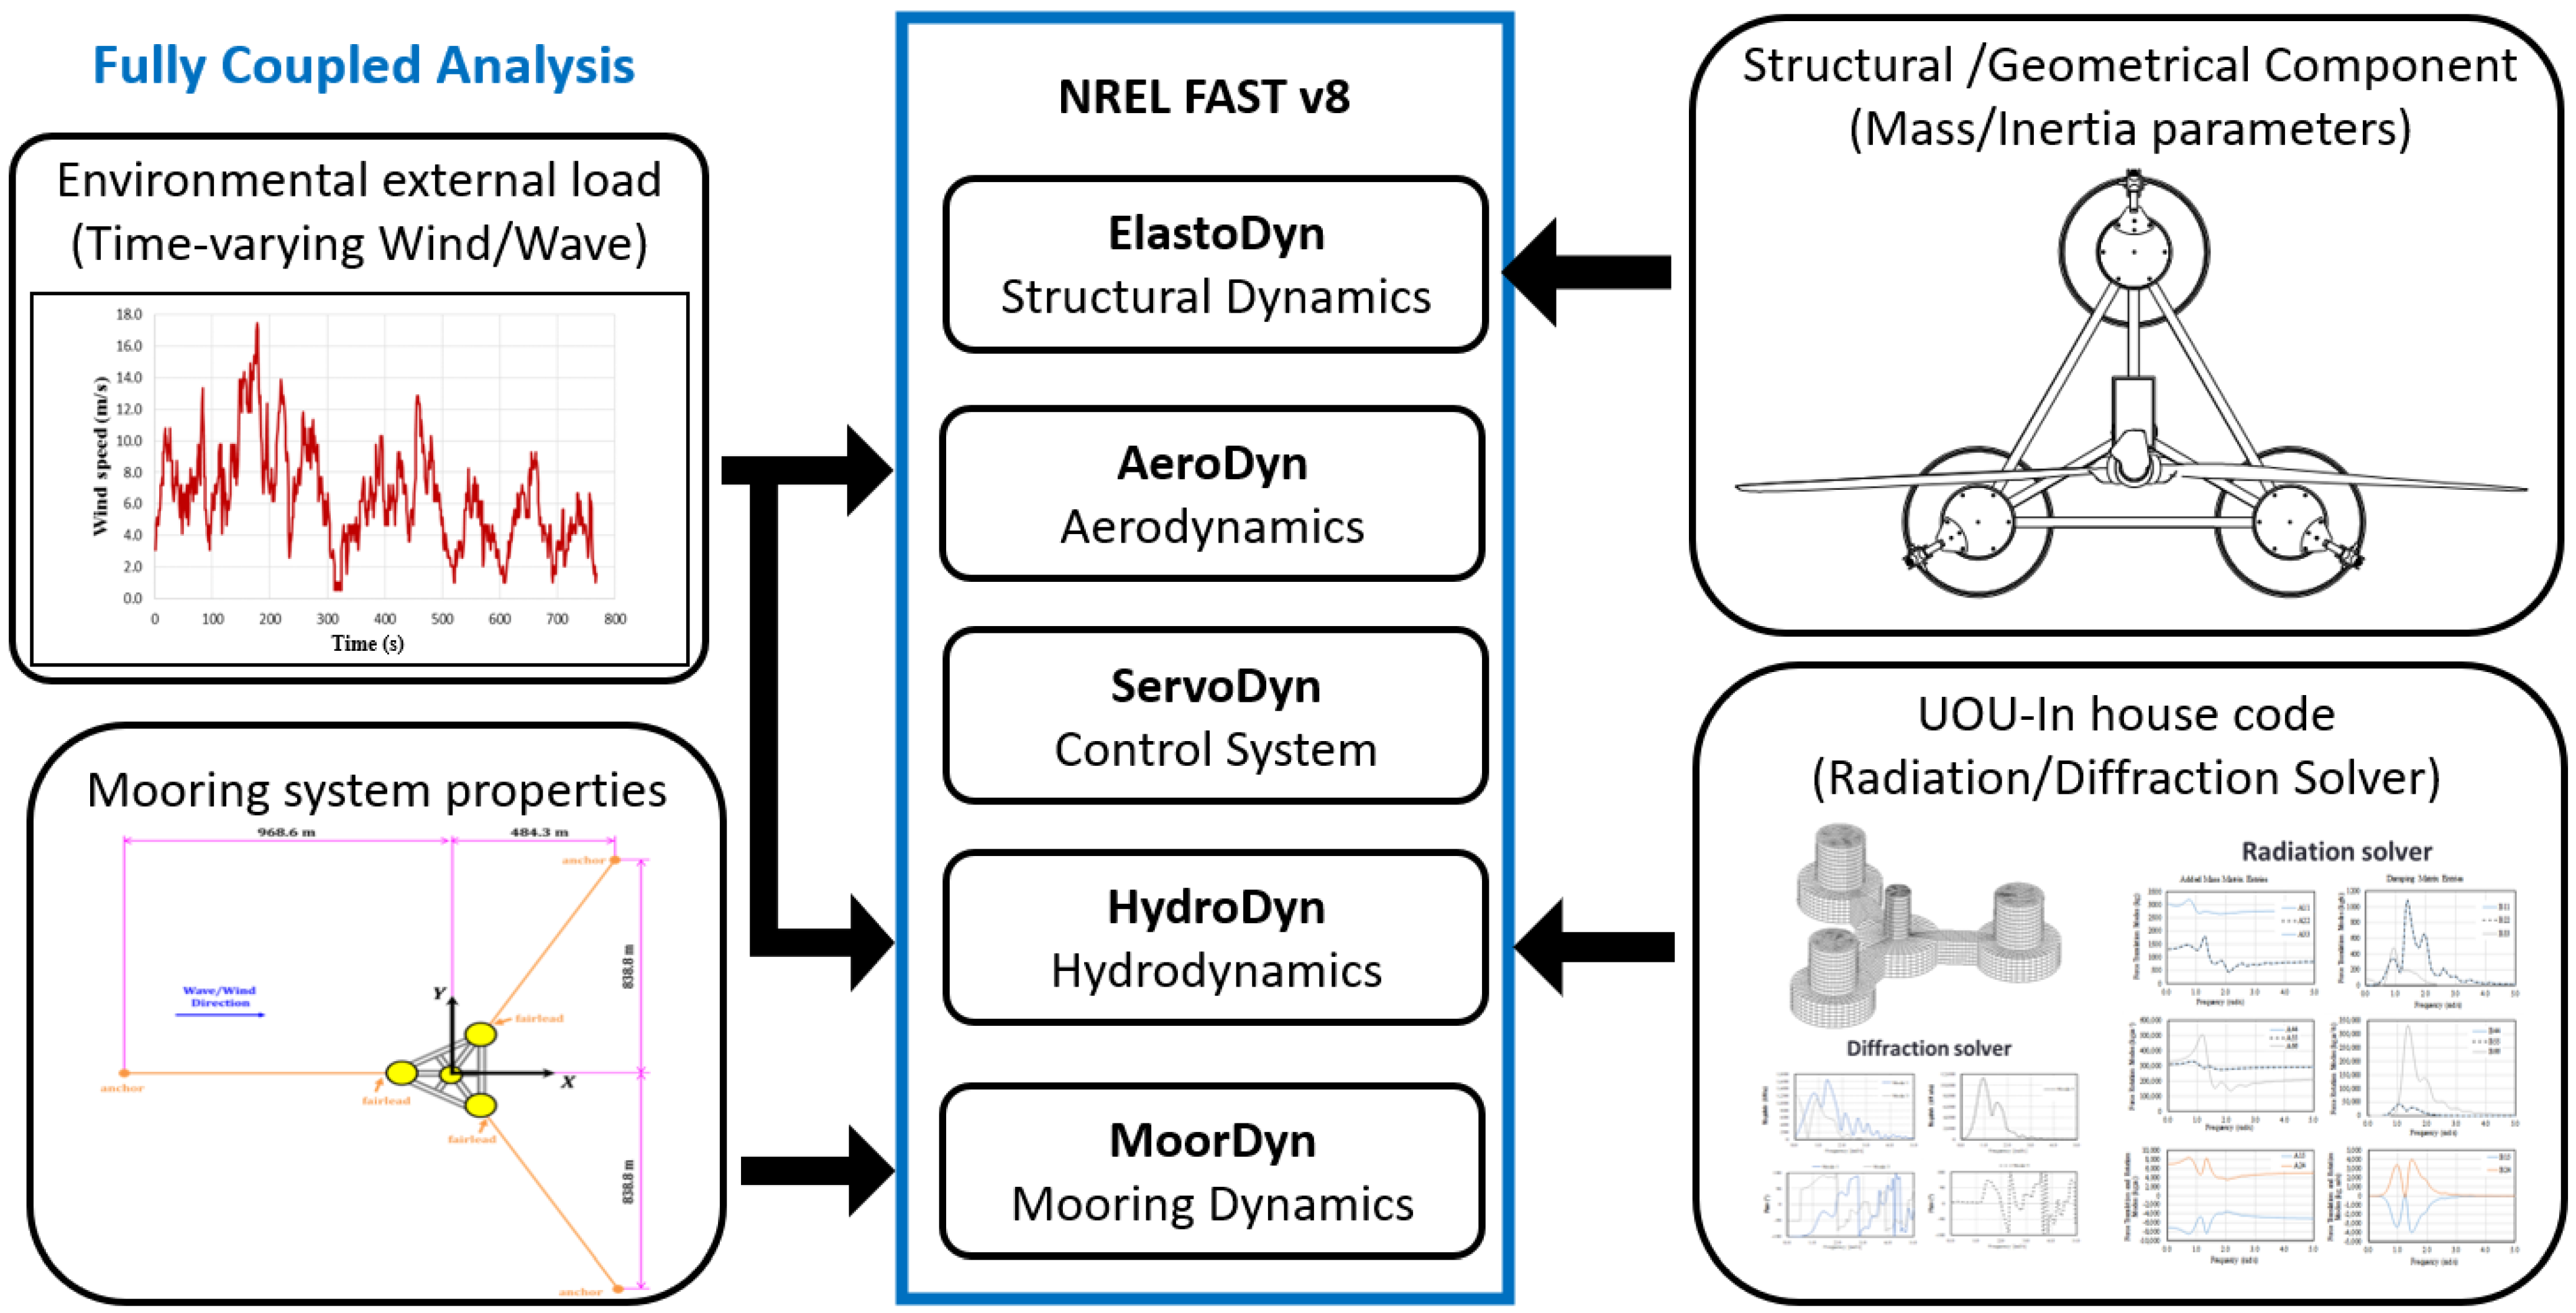
The numerical analysis used the FAST tool developed by the NREL, which is an open-source tool used by many researchers around the world [18]. Furthermore, FAST is a tool that is continuously verified through the OCx projects within the IEA WindTask, and the University of Ulsan is also participating in the OCx projects and performing extensive research on the mutual verification of numerical analysis and actual data [19]. Based on this, the comparison of numerical analysis and model test was carried out in this work. The FAST simulation’s flow chart is shown in Figure 6. Each sub-module receives analytic parameters, and FAST analyzes them using coupled Elasto-Aero-Servo-Hydro-Moordyn modules.

4.2. LC1 & LC2: RAO Result in Regular Wave

The model test results and numerical analysis results in regular waves were validated in this section. The result value was calculated by RAO (Response Amplitude Operator), and RAO is the most convenient value to check the response characteristics under the same incident wave condition. Model test conditions for regular waves are shown in Table 8. In the regular wave test, 120 s were measured considering the time when the wave arrived at the model, and the initial response is stabilized. Figure 7 shows the time history response results obtained from the experiment. The range from 80 to 100 s in which the response is stable in the entire time history was used for RAO calculation. In general, semi-submersible structures have a long natural period of surge, and, in this model test, the surge natural period result is shown only in the numerical analysis. Figure 8 and Figure 9 compare the results of the model test and numerical analysis in LC1 and LC2. Under the LC1 and LC2, the RAO results of the model test and numerical analysis match well. Surge and heave responses are not significantly different in the case of LC1 and LC2. However, the response in the pitch natural frequency region is smaller in LC2, indicating a decrease in motion due to the aerodynamic damping effect. The aerodynamic damping is an effect occurring at the rated wind speed of the wind turbine and can be confirmed by several references [20,21].

4.3. QTF Solver for 2nd Order Wave Load

The hydrodynamic force acting on the floating platform is the sum of the diffraction and radiation force of waves and the viscous damping components. Those hydrodynamic coefficients were calculated from UOU in-house codes and used as an input for the HydroDyn module. In this study, both the first-order hydrodynamic load of wave and the second-order hydrodynamic wave load were considered. The importance of considering the 2nd order wave force in the validation of the model test and numerical analysis is addressed in the references [22,23]. There was only a second-order difference in frequency wave force to be considered in this paper. Since the second-order difference in frequency wave force has a dominant effect on the response in the low-frequency region, it is suitable for consideration in the FOWT system with a low natural frequency of motion. The UOU in-house code consists of a diffraction solver, radiation solver, and QTF (Quadratic Transfer Function) solver for second-order wave force, and it can generate wave-exciting force matrices Xi (ω), added-mass matrices Aij (ω), damping matrices Bij (ω), and the QTF matrices Xmk (ωm, ωk). To calculate the second-order wave load, the QTF solver in the UOU in-house code was used based on the linear potential wave and first-order motion of the floating platform using the pressure integration method in the frequency domain. With reference to Pinkster [24], the second-order wave forces Fw(2) and moments Mw(2) are expressed as Equations (3) and (4).
F w a v e ( 2 ) = W L   1 2 ρ g ζ r ( 1 ) 2 n d l S 0   [ 1 2 ρ ϕ ( 1 ) · ϕ ( 1 ) ρ ( x ( 1 ) · ϕ ( 1 ) t ) ] n d s + α ( 1 ) × ( m x ¨ 0 ( 1 ) )
M w a v e ( 2 ) = W L   1 2 ρ g ζ r ( 1 ) 2 ( x × n ) d l S 0   [ 1 2 ρ ϕ ( 1 ) · ϕ ( 1 ) ρ ( x ( 1 ) · ϕ ( 1 ) t ) ] ( x × n ) d s + α ( 1 ) × ( I α ¨ 0 ( 1 ) )
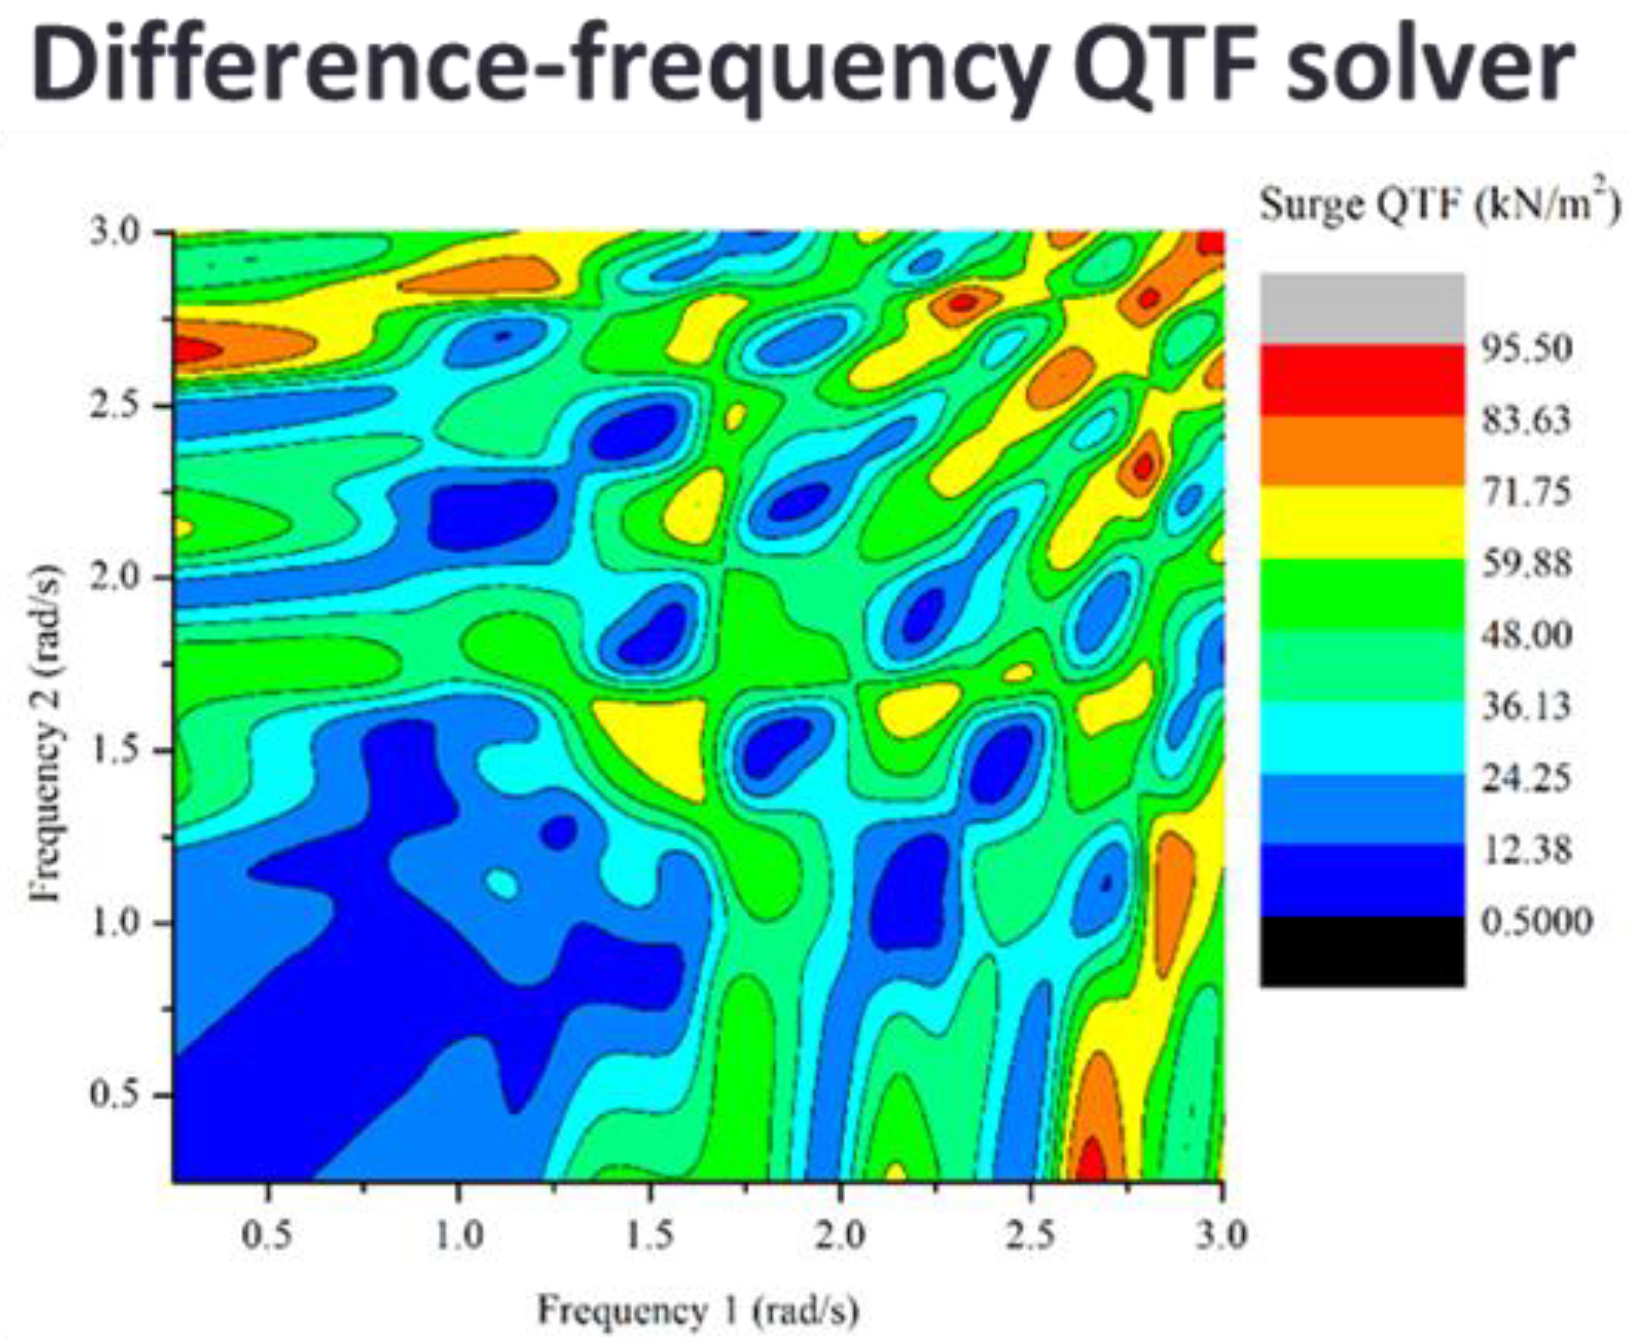
in which ρ is fluid density, g is gravity acceleration, S 0 is the wetted surface of the body, n is the unit normal vector of S , ϕ is velocity potential, subscript (1) is the first-order component, W L is the waterline, ζ r ( 1 ) is the relative wave elevation, m and I are the mass and inertia component of FOWT. x ( 1 ) and α ( 1 ) are the translations and rotational motions under first-order wave loading based on a global coordinate system. The difference-frequency component in the wave excitation QTF, X ( ω m ,   ω k ) is derived from Equations (3) and (4) of the second-order wave forces and moments. The QTF can be expressed in the same form as Equation (5). Figure 10 shows the amplitude of the Difference-frequency QTF solver.
X ( ω m ,   ω k ) = P ( ω m ,   ω k ) + i Q ( ( ω m ,   ω k   )
where P is the real part and Q is the imaginary part of the QTF.

4.4. LC3 & LC4: FFT Result in Irregular Wave

In this section, the response of S-FOWT in irregular waves was obtained and compared. The wave information of the irregular wave condition applied in this study was referenced from the co-author’s paper [25]. In the reference literature, the metocean condition of the East Sea of Korea was estimated from the actual measured Buoy data. Table 9 shows the irregular wave conditions that were generated utilizing the JONSWAP spectrum and reflects the tendency of wave heights and wave periods on the East Sea of Korea. JONSWAP spectrum has a sharper characteristic in the extreme than PM spectrum, and the response of the floating offshore wind power system at the more severe condition can be confirmed. The model test in the irregular wave condition was performed for 450 s per sea state, and 400 s excluding the initial 50 s were used for the FFT analysis. Before confirming the FOWT response results, the energy density of the input wave in the model test and numerical analysis was compared. The spectral density of the input wave is shown in Figure 11, and the two data sets are almost identical. Therefore, the verification process between the model test and numerical analysis was performed on the same input variable. Figure 12 shows the time history results of the irregular model test. In Figure 12 that LC4 the pitch response drifts because the wind-induced thrust is already generated in the rotor before the waves arrive.
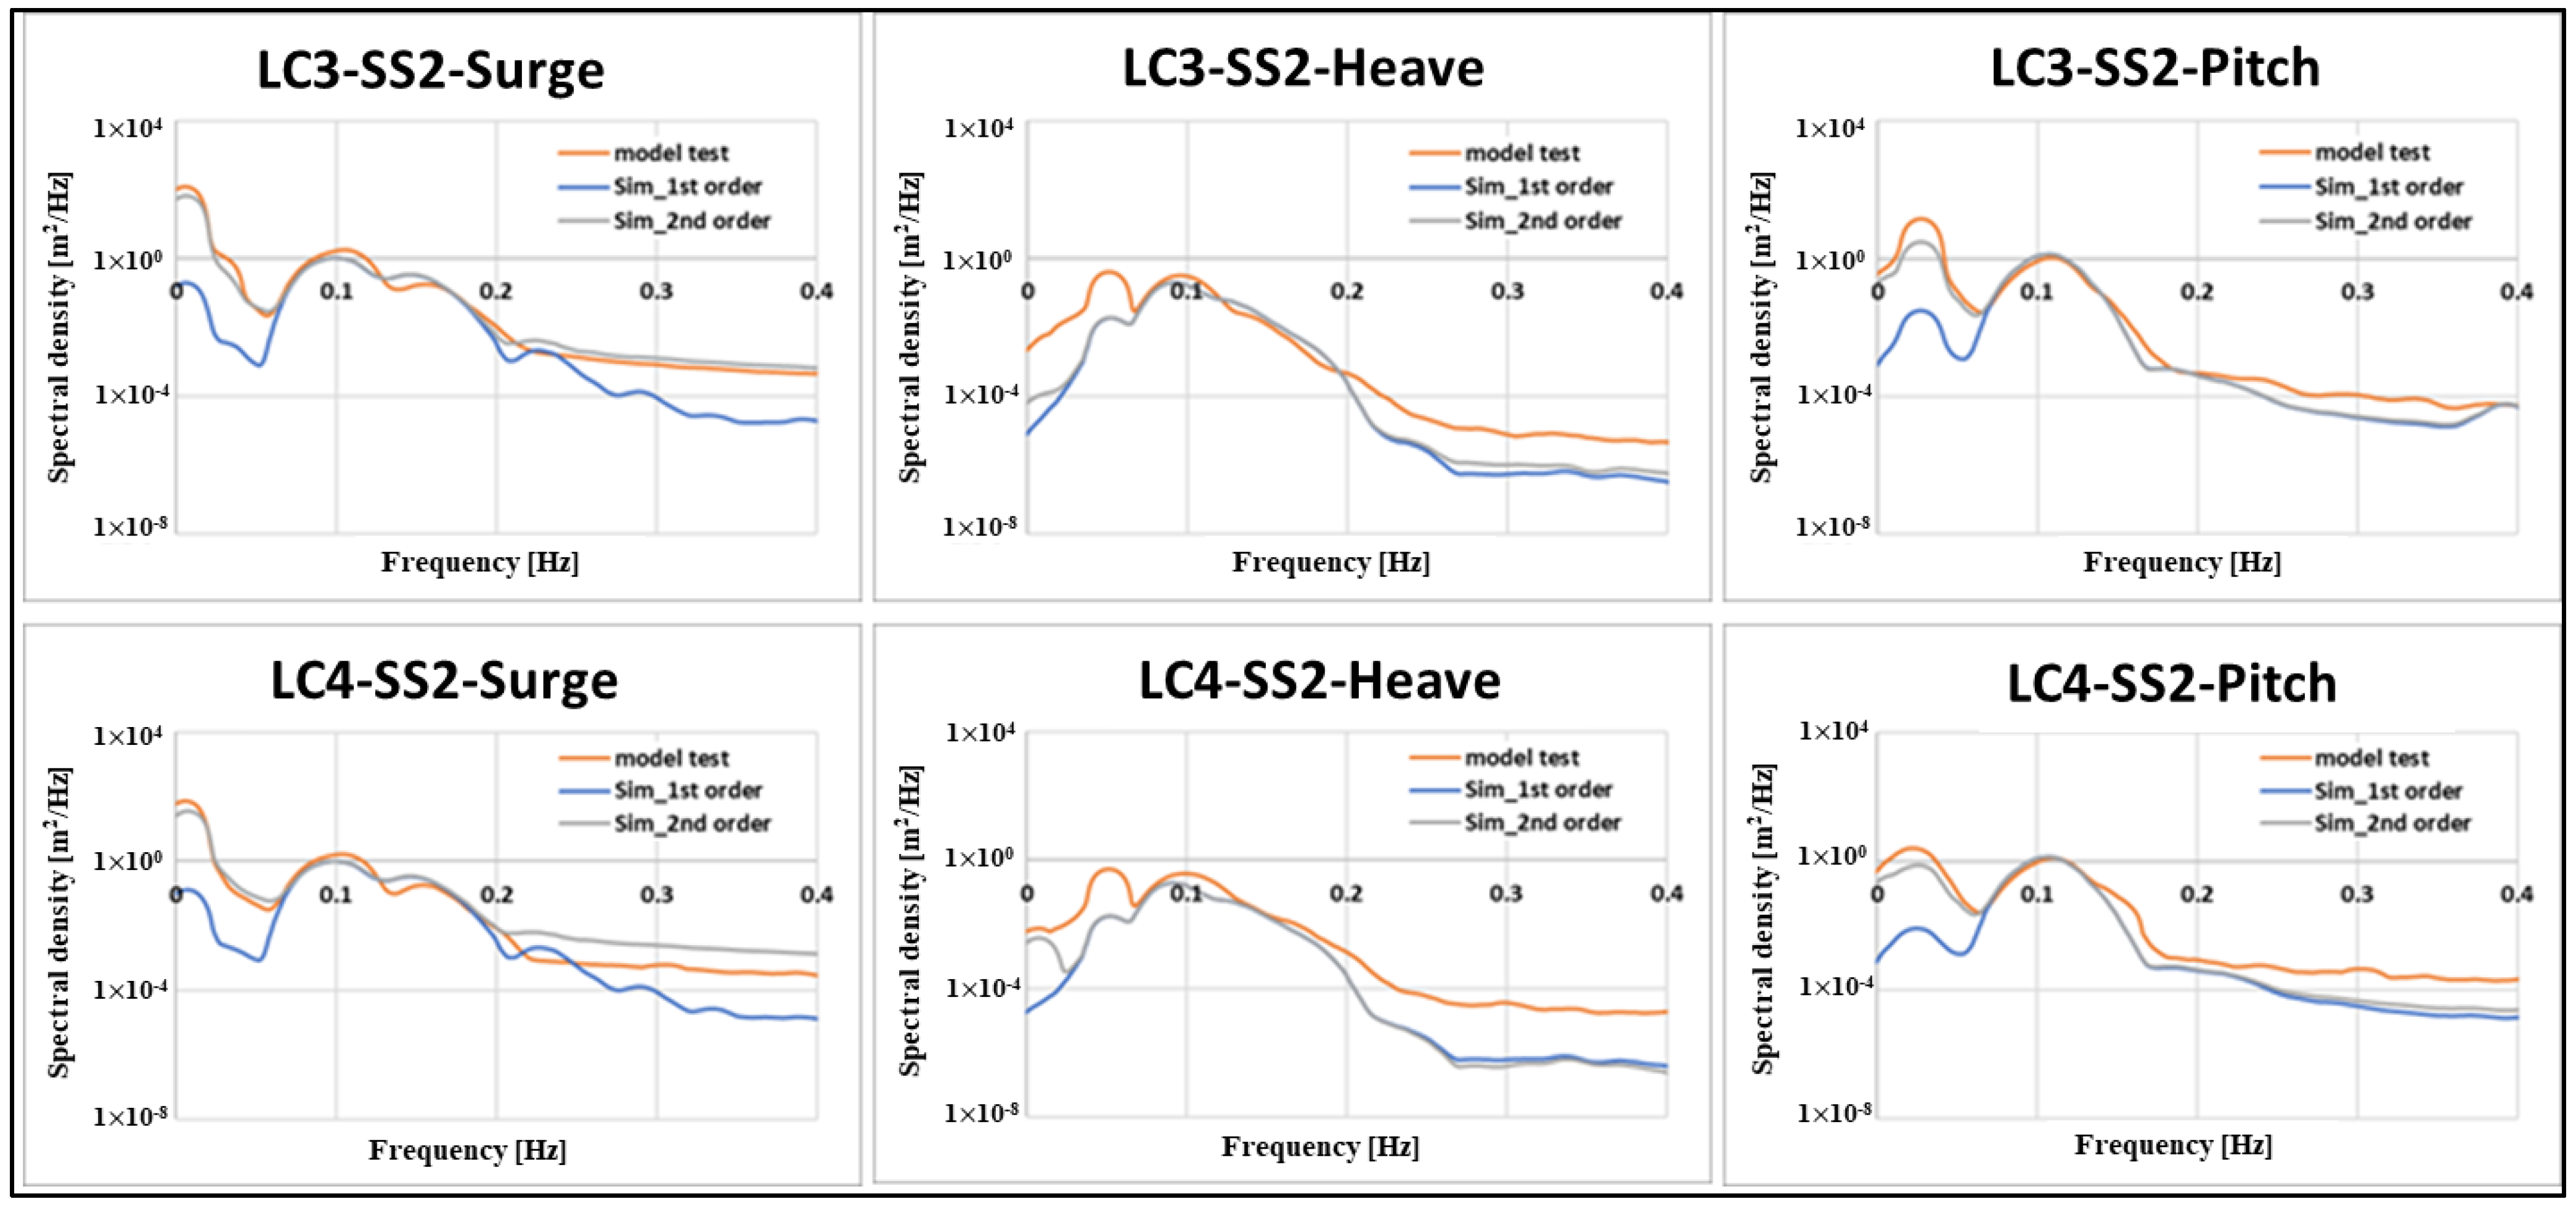
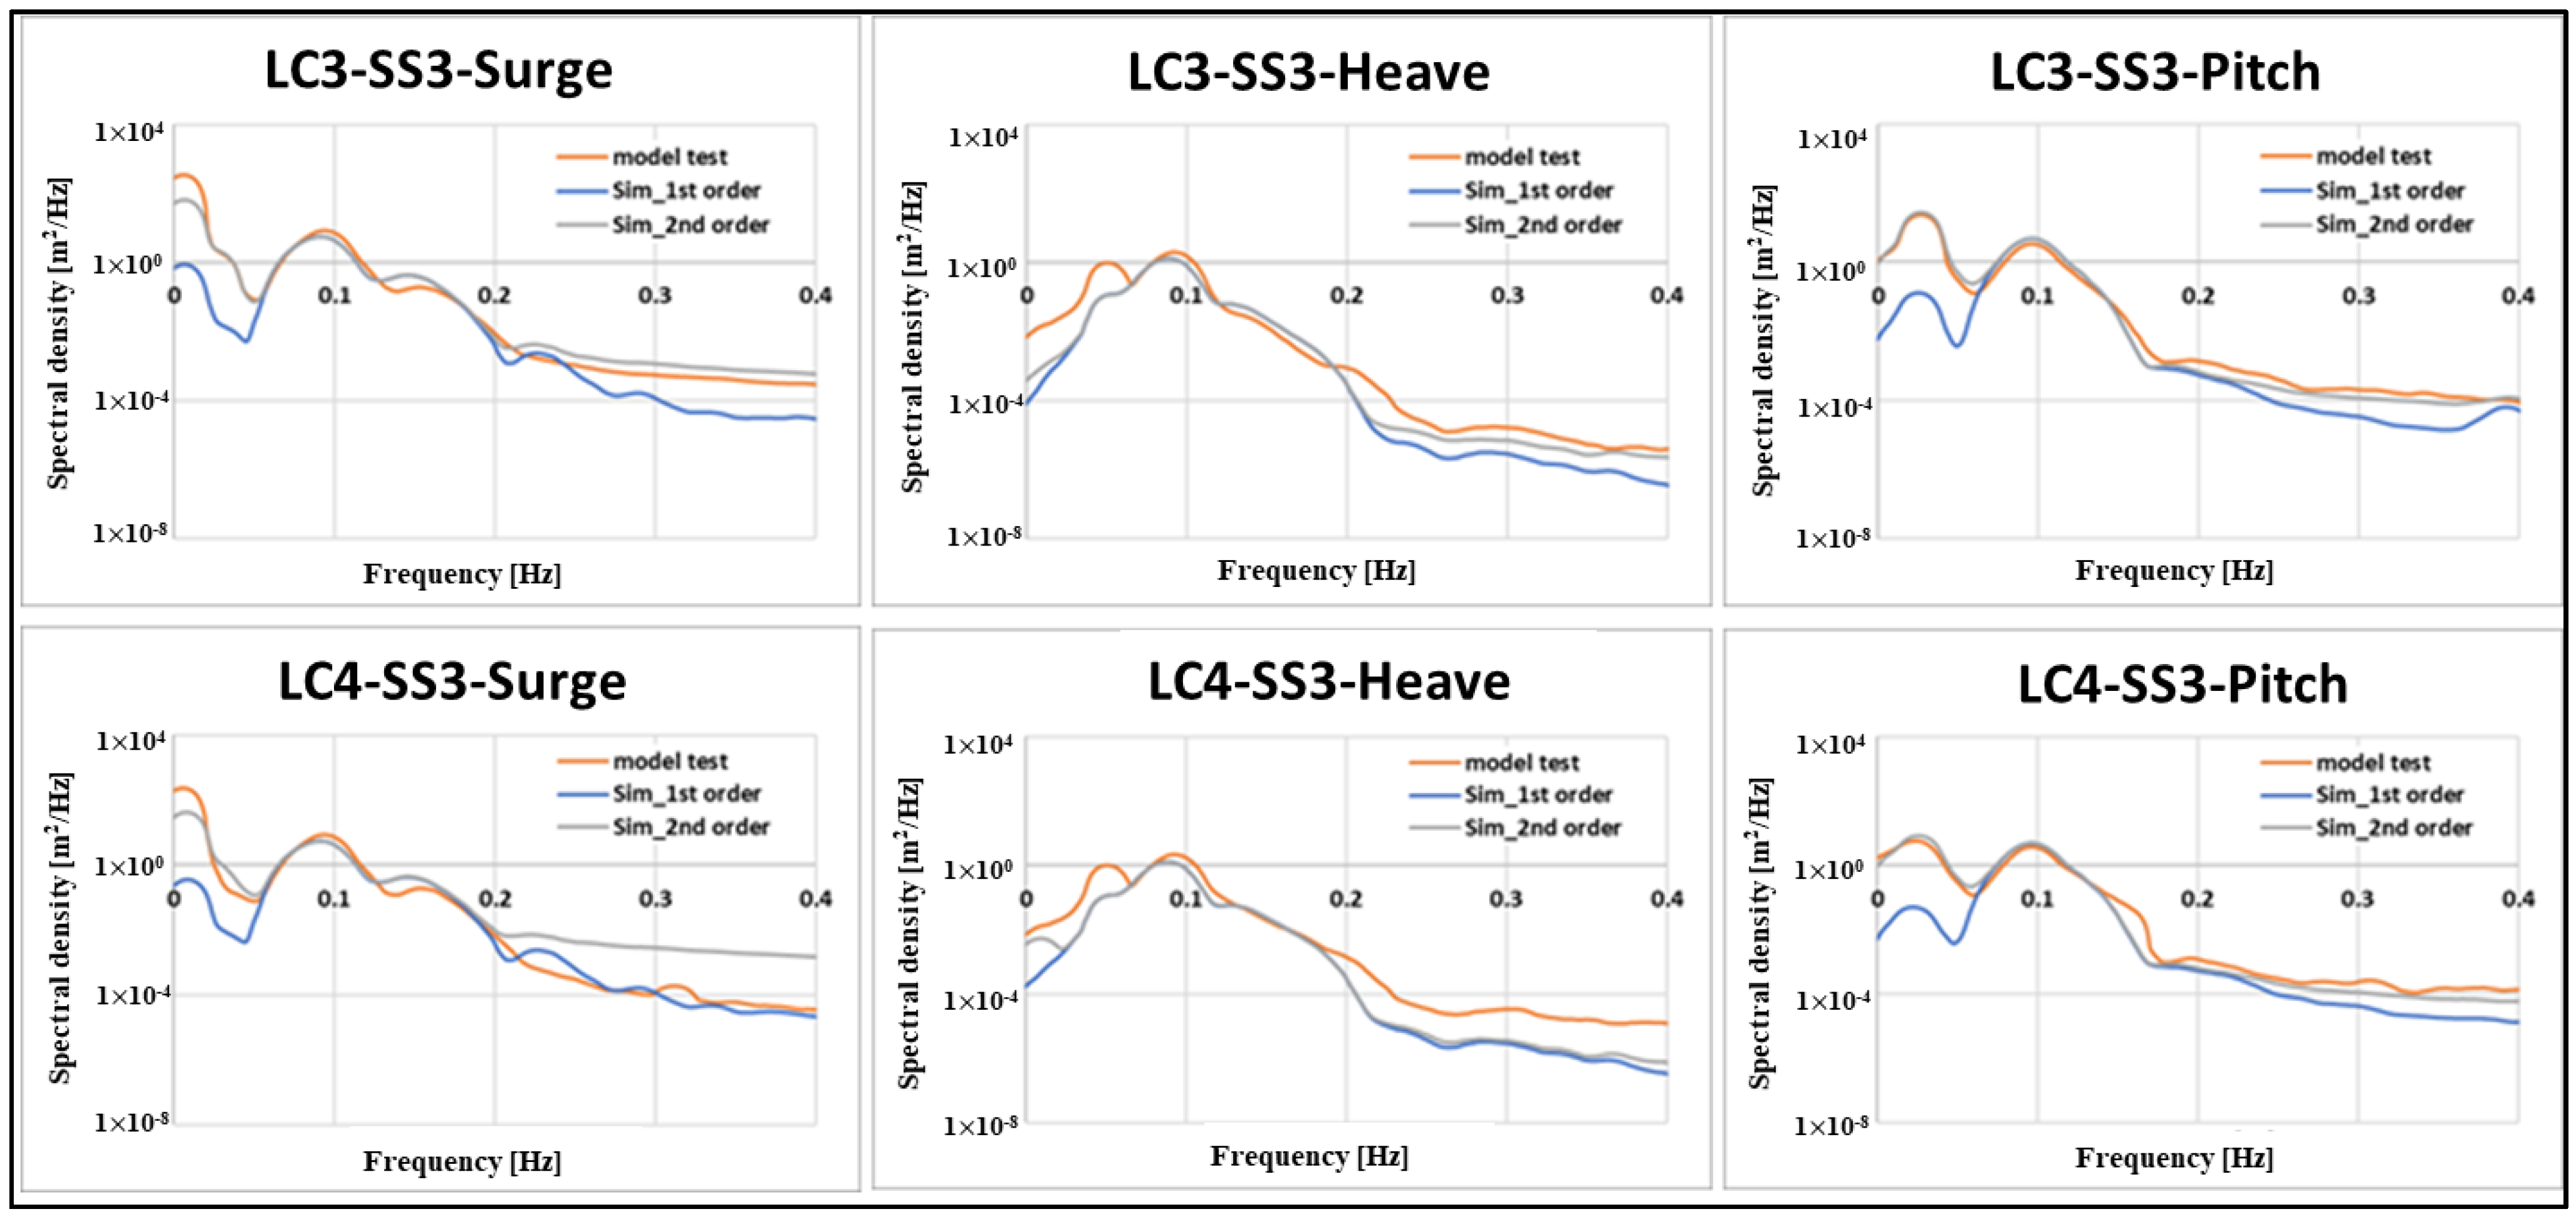
The FFT result of the FOWT response in the irregular wave is shown in Figure 13, Figure 14 and Figure 15. In the Figures, the rising section before 0.1 rad/s was regarded as the first peak, and the rising section of 0.1 to 0.15 rad/s was regarded as the second peak. The numerical analysis and model test results in the second peak region indicate nearly identical responses, and as the sea state becomes more severe, the first peak and second peak responses increase. Comparing LC3 and LC4, the pitch response is slightly reduced when the rated wind speed condition is applied. As with regular waves, this is a response characteristic that results from the aerodynamic damping effect. When considering the second-order wave load, there is no significant change in the heave result, but in surge and pitch motion, it shows a tendency to be more consistent with the results of the model test at the low-frequency region. To match the heave free decay of the model test, the heave drag force in numerical simulation is tuned with Cd = 4.8. However, the drag force in the model test has a non-linear characteristic, so the peak response between numerical analysis and model test does not seem to match well. Based on the current results, when the second-order wave load is considered, relatively accurate analysis in the low-frequency region about surge and pitch will be possible for floating platforms with long-period motion characteristics, such as semi-submersible structures.

5. Conclusions

In this paper, the study on the motional characteristics of a 10 MW class superconducting floating offshore wind turbine was conducted experimentally and numerically. The 10 MW S-FOWT was constructed based on the power scale law and the OC4 semi-submersible type, and the 1:90 scaled model was manufactured for the test in the facility of the University of Ulsan. In the regular waves, the RAO results of the model test and the numerical analysis agree well and showed that the pitch was smaller in LC2 where the wind applied on the rotating rotor due to the aerodynamic damping effect. The model was also tested under irregular waves, which showed that the FFT result of the model test and numerical analysis were similar in the second peak response, but the response of the numerical analysis was small in the low-frequency region. When the second-order hydrodynamic load was considered, the pitch and surge response in the low-frequency region were more consistent with the model test results. Consequently, in the case of the semi-submersible structures with the characteristic of a long natural period of motion, a numerical analysis considering the second-order hydrodynamic load showed a very good correlation with test results. In near future work, the three-way validation using a CFD tool capable of high-fidelity analysis will be performed for a more detailed study of the nonlinear wave effect [26].

Author Contributions

Conceptualization, H.S. and K.H.; methodology, T.D.P.; software, T.D.P. and Y.Y.; validation, Y.Y.; investigation, K.H.; writing—original draft preparation, Y.Y.; writing—review and editing, K.H. and H.S.; visualization, Y.Y.; project administration, H.S. All authors have read and agreed to the published version of the manuscript.

Funding

This work was supported by Brain Pool Program through the National Research Foundation of Korea (NRF) funded by the Ministry of Science and ICT (grant number: 2019H1D3A2A02102093). This research was also supported by Korean Electric Power Corporation. (Grant number: R18XA03).

Conflicts of Interest

The authors declare no conflict of interest.

Abbreviations

CFDComputational Fluid Dynamics
CMCenter of Mass
FFTFast Fourier Transform
FOWTFloating Offshore Wind Turbine
JONSWAPJoint North Sea Wave Project
N.F.Natural Frequency
PMPierson-Moskowitz
QTFQuadratic Transfer Function
RAOResponse Amplitude Operator
RWTS-FOWTReference Wind TurbineSuperconducting Floating Offshore Wind Turbine
SWLStill Water Level
UOUUniversity of Ulsan

References

  1. Vestas, V236-15.0MW. Available online: https://www.vestas.com/en/products/offshore%20platforms/v236_15_mw#! (accessed on 9 June 2021).
  2. EcoSwing (Energy Cost Optimization using Superconducting Wind Generators)—World’s First Demonstration of a3.6MW Low-Cost Lightweight DD Superconducting Generator on a Wind Turbine. Available online: https://cordis.europa.eu/project/id/656024 (accessed on 9 June 2021).
  3. US DoE Backs Push for Wind Turbines up to 15 MW. Available online: https://www.rechargenews.com/wind/us-doe-backs-push-for-wind-turbines-up-to-15mw/2-1-597387 (accessed on 9 June 2021).
  4. First Floating Foundation for Kincardine 9.6 MW Turbines Arrives in Rotterdam. Available online: https://www.offshorewind.biz/2020/10/15/first-floating-foundation-for-kincardine-9-6-mw-turbines-arrives-in-rotterdam/ (accessed on 10 June 2021).
  5. Hoang, T.-K.; Queval, L.; Berriaud, C.; Vido, L. Design of a 20 MW Fully Superconducting Wind Turbine Generator to Minimize the Levelized Cost of Energy. In Proceedings of the 13th European Conference on Applied Superconductivity (EUCAS2017), Geneva, Switzerland, 17–21 September 2017. [Google Scholar]
  6. Pan, Y.; Gu, D. Superconducting Wind Turbine Generators. Trans. Environ. Electr. Eng. 2016, 1, 9–15. [Google Scholar] [CrossRef] [Green Version]
  7. Abrahamsen, A.B.; Magnusson, N.; Jensen, B.B.; Runde, M. Large Superconducting Wind Turbine Generators. Energy Procedia 2012, 24, 60–67. [Google Scholar] [CrossRef] [Green Version]
  8. Equinor, Offshore Wind in South Korea. Available online: https://www.equinor.com/en/where-we-are/south-korea.html (accessed on 10 June 2021).
  9. Coulling, A.J.; Goupee, A.; Robertson, A.; Jonkman, J.M.; Dagher, H.J. Validation of a FAST semi-submersible floating wind turbine numerical model with DeepCwind test data. J. Renew. Sustain. Energy 2013. [Google Scholar] [CrossRef]
  10. Bayati, I.; Jonkman, J.; Robertson, A.; Platt, A. The Effects of Second-Order Hydrodynamics on a Semisubmersible Floating Offshore Wind Turbine. Presented at the Science of Making Torque from Wind Technical University of Denmark, Copenhagen, Denmark, 17–20 June 2014. NREL/CP-5000-61752. [Google Scholar]
  11. Pham, T.D.; Shin, H.K. The Effect of the Second-Order Wave Loads on Drift Motion of a Semi-Submersible Floating Offshore Wind Turbine. J. Mar. Sci. Eng. 2020, 8, 859. [Google Scholar] [CrossRef]
  12. Jung, G.E.; Sung, H.J.; Dinh, M.C.; Park, M.W.; Shin, H.K. A Comparative Analysis of Economics of PMSG and SCSG Floating Offshore Wind Farms. Energies 2021, 14, 1386. [Google Scholar] [CrossRef]
  13. Bak, C.; Zahle, F.; Bitsche, R.; Kim, T.; Yde, A.; Henriksen, L.C.; Hansen, M.H.; Blasques, J.P.A.A.; Gaunaa, M.; Natarajan, A. The DTU 10-MW Reference Wind Turbine; DTU Library: Kongens Lyngby, Denmark, 2013. [Google Scholar]
  14. Robertson, A.; Jonkman, J.; Masciola, M.; Goupee, A.; Coulling, A.; Luan, C. Definition of the Semisubmersible Floating System for Phase II of OC4; NREL Technical Report; NREL/TP-5000-60601; NREL: Golden, CO, USA, 2014.
  15. Ahn, H.J.; Shin, H.K. Experimental and Numerical Analysis of a 10 MW Floating Offshore Wind Turbine in Regular Waves. Energies 2020, 13, 2608. [Google Scholar] [CrossRef]
  16. Bin, W.; Yougang, T.; Yan, L.; Runbo, C. Effects of Second-Order Sum-and Difference-Frequency Wave Forces on the Motion Response of a Tension-Leg Platform Considering the Set-down Motion. J. Ocean Univ. China 2018, 17, 311–319. [Google Scholar]
  17. Jonkman, J.M.; Robertson, A.N.; Hayman, G.J. HydroDyn User’s Guide and Theory Manual; NREL Technical Report; NREL/TP-xxxx-xxxx; NREL: Golden, CO, USA, 2015.
  18. Jonkman, J.M.; Buhl, M.L. FAST User’s Guide; NREL Technical Report; NREL/EL-500-38230; NREL: Golden, CO, USA, 2005.
  19. Robertson, A.N.; Gueydon, S.; Bachynski, E.; Wang, L.; Jonkman, J.; Alarcon, D.; Amet, E.; Beardsell, A.; Bonnet, P.; Boudet, B.; et al. OC6 Phase I: Investigating the underprediction of low-frequency hydrodynamic loads and responses of a floating wind turbine. J. Phys. Conf. Ser. 2020, 1618, 032033. [Google Scholar] [CrossRef]
  20. Valamanesh, V.; Myers, A.T. Aerodynamic Damping and Seismic Response of Horizontal Axis Wind Turbine Towers. J. Struct. Eng. 2014, 140, 04014090. [Google Scholar] [CrossRef]
  21. Salzmann, D.J.C.; Tempel, J.V.D. Aerodynamic Damping in the Design of Support Structures for Offshore Wind Turbine; TU Delft: Delft, The Netherlands, 2005. [Google Scholar]
  22. Coulling, A.J.; Goupee, A.J.; Robertson, A.; Jonkman, J. Importance of Second-Order Difference-Frequency Wave Diffraction Forces in the Validation of a Fast Semi-Submersible Floating Wind Turbine Model. In Proceedings of the ASME 2013 32th International Conference on Ocean, Offshore and Arctic Engineering, Nantes, France, 9–14 June 2013. [Google Scholar]
  23. Zhang, L.; Shi, W.; Karimirad, M.; Michailides, C.; Jiang, Z. Second-Order Hydrodynamic Effects on the Response of Three Semisubmersible Floating Offshore Wind Turbines. Ocean Eng. 2020, 207, 107371. [Google Scholar] [CrossRef]
  24. Pinkster, J.A. Low Frequency Second Order Wave Exciting Forces on Floating Structures. Ph.D. Thesis, Delft University of Technology, Delft, The Netherlands, 1980. [Google Scholar]
  25. Shin, H.K.; Yu, Y.J.; Pham, T.D.; Ahn, H.J.; Seo, B.C.; Kim, J.B. Analysis of Environmental Conditions for the Conceptual Design of a 200MW Floating Offshore Wind Farm in the East Sea, Korea. In Proceedings of the 2nd International Offshore Wind Technical Conference IOWTC 2019, St. Julian’s, Malta, 3–6 November 2019. [Google Scholar]
  26. Xu, K.; Shao, Y.; Gao, Z.; Moan, T. A study on fully nonlinear wave load effects on floating wind turbine. J. Fluids Struct. 2019, 88, 216–240. [Google Scholar] [CrossRef]
Figure 1. General arrangement of the 10 MW S-FOWT floating platform.
Energies 14 06070 g001
Figure 2. Installation view of test model.
Energies 14 06070 g002
Figure 3. (a) Test facility, Ocean Engineering Widetank, University of Ulsan; (b) Test model install configuration.
Energies 14 06070 g003
Figure 4. Experiment equipment and sensors.
Energies 14 06070 g004
Figure 5. Free decaying test result.
Energies 14 06070 g005
Figure 6. FAST simulation flow chart.
Energies 14 06070 g006
Figure 10. The amplitude of Difference-frequency QTF.
Energies 14 06070 g010
Figure 7. LC1 Regular wave7 Time-series response.
Energies 14 06070 g007
Figure 8. LC1 RAO result under no wind and regular waves.
Energies 14 06070 g008
Figure 9. LC2 RAO result under wind and regular waves.
Energies 14 06070 g009
Figure 11. Irregular wave spectrum comparison between model test and numerical analysis.
Energies 14 06070 g011
Figure 12. LC4 Sea state2 Time-series response.
Energies 14 06070 g012
Figure 13. Sea state1: LC3 and LC4 result under irregular waves.
Energies 14 06070 g013
Figure 14. Sea state2: LC3 and LC4 result under irregular waves.
Energies 14 06070 g014
Figure 15. Sea state3: LC3 and LC4 result under irregular waves.
Energies 14 06070 g015
Table 1. Specifications of a 10 MW class wind turbine.
ParameterRWT DTU
10 MW Class
Superconducting 10 MW Class
Hub height [m]119120
Rotor diameter178.3178.2
Cut-in, Rated, Cut-out wind speed [m/s]4, 11.4, 253, 11.3, 25
Blade mass, 1ea [kg]41,00032,512
Hub mass [kg]106,00080,000
Nacelle mass [kg]446,000335,000
Tower mass [kg]605,000610,084
Total mass [kg]1,280,0001,113,097
Table 2. Specifications of the 10 MW S-FOWT Platform.
ParameterValue
Depth to platform base below SWL [m]24.6
Elevation to platform top above SWL [m]15.7
Volume of displacement, V0 [m3]25,889
Platform total mass (Including ballast) [kg]24,977,000
Center of mass of platform [m]−16.56
Platform roll inertia about CM [kg·m2]1.92 × 10¹⁰
Platform pitch inertia about CM [kg·m2]1.92 × 10¹⁰
Platform yaw inertia about center [kg·m2]3.75 × 10¹⁰
Table 3. Specifications of 10 MW S-FOWT mooring system.
ParameterValue
Number of mooring lines3
Depth to anchors below SWL [m]150
Depth to fairleads below SWL [m]17.46
Unstretched mooring line length [m]950
Mooring line mass density in air [kg/m]443.2
Mooring line pretension [kN]2932
Axial stiffness (1EA) [kN]1,815,000
MBL (Minimum breaking load) [kN]14,677
Table 4. Deviation between ideal model and real model.
ParameterIdeal Model
(1:90)
Actual Model
(1:90)
Deviation
Rotor and nacelle mass [kg]0.7040.7202.32%
Tower mass [kg]0.8370.820−1.70%
Platform mass [kg]34.3034.621.32%
Platform Center of mass from SWL [m]0.1840.1840.00%
Ixx of the Platform [kg·m2]3.6243.450−4.80%
Iyy of the Platform [kg·m2]3.6243.450−4.80%
Total wind turbine mass [kg]35.8035.50−3.02%
1 Mooring line mass density [kg/m]0.0670.0681.49%
1 Mooring nominal diameter [mm]1.5781.570−0.51%
Mooring line length [m]10.5610.560.00%
Table 5. Load cases for model test and numerical simulation.
Load CaseWindWaveRotor
LC1No windRegular waveFixed
LC2Rated wind speedRegular waveRotating
LC3No windIrregular waveFixed
LC4Rated wind speedIrregular waveRotating
Table 6. Deviation of aerodynamic properties between ideal and real condition.
ParameterIdeal ConditionActual ConditionDeviation [%]
Rated wind speed [m/s]1.191.00−15.97
Rated rotor speed [rpm]88.890.01.35
Rated thrust force [N]2.2722.22−0.67
Table 7. Difference of FOWT motion natural period.
ParameterModel TestSimulationConformity [%]
Surge natural period [s]112.0112.399.7
Heave natural period [s]19.419.4100.0
Pitch natural period [s]29.628.9102.4
Table 8. LC1 and LC2, Regular wave conditions for model test.
Wave No.Full Scale (1:1)Model Scale (1:90)
Wave HeightWave PeriodWave LengthWave HeightWave PeriodWave Length
[m][s][m][m][s][m]
Regular wave 12.675.5047.250.030.5800.525
Regular wave 22.676.0457.060.030.6370.634
Regular wave 32.676.7070.200.030.7070.780
Regular wave 42.677.5388.380.030.7930.982
Regular wave 52.678.58114.840.030.9041.276
Regular wave 62.679.97155.250.031.0511.725
Regular wave 72.6711.90221.220.031.2552.458
Regular wave 82.6714.77337.500.031.5573.750
Regular wave 92.6719.45548.460.032.0506.094
Regular wave 102.6728.46941.670.033.00010.463
Table 9. LC3 and LC4, Irregular wave conditions for model test.
Sea State No.Full Scale (1:1)Model Scale (1:90)
Wave HeightWave PeriodWave HeightWave Period
[m][s][m][s]
SS12.677.660.029670.80743
SS24.388.980.048670.94658
SS36.1810.360.068671.09204
Publisher’s Note: MDPI stays neutral with regard to jurisdictional claims in published maps and institutional affiliations.