Article

Feasibility of Reducing Operator-to-Passenger Contact for Passenger Screening at the Airport with Respect to the Power Consumption of the System

Department of Technical Systems Operation and Maintenance, Faculty of Mechanical Engineering, Wroclaw University of Science and Technology, Wybrzeże Wyspiańskiego 27, 50-370 Wrocław, Poland
*
Author to whom correspondence should be addressed.
Energies 2021, 14(18), 5943; https://doi.org/10.3390/en14185943
Submission received: 23 August 2021 / Revised: 8 September 2021 / Accepted: 17 September 2021 / Published: 18 September 2021

Abstract

:
So far, airport security screening has only been analysed in terms of efficiency, level of service, and protection against any acts of unlawful interference. Screening procedures have not yet addressed the need to limit operator-to-passenger contact. However, the pandemic situation (COVID-19) has shown that it is a factor that can be a key protection for the health of passengers and operators. The purpose of this paper was to analyse the feasibility of reducing contact between operators and passengers in the airport security screening system by process management with respect to the power consumption of the system. Experimental research was conducted on a real system. A computer simulation was applied to estimate system performance and power consumption. The paper identifies the important findings that expand upon previous knowledge. The results showed that there are two key factors: the experience of operators and proper system structure. These factors can significantly reduce the number of operator-to-passenger contacts and, in parallel, provide lower energy consumption of the system. The results obtained in this article showed that proper management improves the process by up to 37%. This approach expands the World Health Organization’s policy of prevention against COVID-19 and helps to ensure sustainable process management.

1. Introduction

The beginning of the 21st century in aviation began an era of activities aimed at securing against any acts of unlawful interference. These activities resulted in the development of consistent regulations on how security screening is conducted at airports. An example is the EU regulation [1], enumerating detailed measures for the implementation of the common basic standards on aviation. As a result, it is a common practice that passenger screening is conducted using walk through metal detection equipment (WTMD) or security/body scanners (BS). Unfortunately, these screening methods are not amenable to following pandemic safety procedures and, depending on the system configuration, cause increased power consumption.
The World Health Organization [2] claims that the virus can be transmitted from one surface to another through contaminated hands, thereby facilitating indirect transmission. The WHO recommends that an adequate number of hand hygiene stations should be provided. These recommendations also include transportation infrastructure buildings. In this work, we focus on additional protection, which is the reduction in direct hand contact between people. This approach, together with the WHO recommendations, should give better prevention against the spread of the virus.
The research problem results from the fact that the current passenger screening methods are imperfect. This is shown by scientific research, which is described in more detail later in this paper. This research indicates that WTMD and BS alert frequently, but unfortunately also when passengers are not in possession of prohibited items. The EU regulation [1] makes it clear that all instances of the alarm being triggered should be resolved. A hand search is performed to resolve the alarm. In such a way, the operator must check whether the passenger is carrying prohibited items. In addition, alarm triggering causes a recheck, which increases the power consumption of the system. This has not yet been studied and will be investigated in this paper.
In the present paper, we evaluate and compare two methods in terms of the number of hand search execution events and power consumption. We conduct a study to see if these events can be reduced. This has not yet been analysed and is extremely valuable to ensure the health safety of passengers and operators and sustainable system management. The purpose of this paper is to find solutions that can significantly increase health safety during security screening without compromising performance or increasing power consumption during the process.
In Section 2, the research problem is described in more detail to explain the idea of the research conducted. Then, in Section 3, it is shown that such research has not yet been conducted in scientific papers. In Section 4, the results of the research are presented, and Section 5 and Section 6 concludes the analysis.

2. Problem Background

Hand search is a critical component of screening a passenger in a pandemic situation. This is when hand contact occurs between the operator and the passenger. In addition, the necessary distances according to the WHO recommendations are not respected. The consequence of this situation may be that the operator inadvertently transfers the virus from one passenger to another. Preventive methods can be used to reduce this phenomenon. These methods will reduce the number of alarms that trigger a hand search. It is, therefore, crucial to develop a process structure at the security checkpoint that will reduce the number of alarms and ensure high system performance with low power consumption. High performance of the system is taken into account here with a perspective to prepare for the future when air traffic is restored. To show the scale of the problem, a study was conducted for the passenger screening system with WTMD and BS devices. Figure 1 shows a functional diagram of the screening process implemented with the use of WTMD (Figure 1a) and BS (Figure 1b) devices as well as for baggage screening (Figure 1c). These procedures take into account passengers who did not trigger an alarm, triggered a false alarm (did not have a prohibited item), or were randomly selected for hand search.
The first phase of the process is done in the same way for the WTMD and BS methods. The passenger must prepare properly for the inspection. Proper preparation means that all the items in the passenger’s possession are placed for separate screening. This step is crucial to reduce the operator-to-passenger hand contact later in the process. The quality of this phase of the process determines the results of the WTMD and BS screening and the choice of the further process path (Figure 1). Since the passenger is screened by one of the methods, other process paths are available.
The desired screening result is when the alarm has not been triggered. However, it results in a different way for the WTMD method and a different way for the BS method. For the WTMD method, there may be a clear indication and the passenger screening process ends. However, there may also be a random indication of the passenger to perform an additional screening using the explosives trace detection (ETD) method. This is because WTMD detects only metal items and does not protect against other types of objects (including the most dangerous ones—explosives). To perform ETD, a sample preparation is needed. It results in the first type of operator contact with the passenger. The operator takes samples from the passenger’s body and clothing. In comparison, the BS method allows dispensing with the random screening of the ETD method. When the passenger is “clear” (has not triggered the alarm), no action is required.
The different process paths for the WTMD and BS methods are also when an alarm has been triggered. The first time WTMD signals an alarm, the passenger once again disposes of the alarm-inducing items. A second screening of the passenger with the WTMD device results in only two paths. If the passenger is not in possession of prohibited items or has been randomly indicated, the ETD method is used in addition. If the cause of the alarm has not been removed and the alarm sounds again, then a full hand search is performed (the whole body of the passenger is checked). Regardless of the case, whether it is ETD or a full hand search, there is operator contact with the passenger.
The procedure is much simpler when the alarm is triggered in the BS method. When the alarm is caused by one object, a targeted hand search at that body site is performed. When there are more alarm causes, then a full hand search is performed. Whatever the case, each time, there is a shorter or longer contact between the operator and the passenger.
To calculate the power consumption, it is also important to develop a baggage inspection model (Figure 1c). There, an X-ray device is used, which also consumes power. The result of the inspection can be of three types. The best one is when there is no alarm triggered. Then, the inspection is complete. Otherwise, when the operator decides that the image is illegible, it must be X-rayed again (e.g., from a different angle or after removing the obstacle). When there is a threat in the luggage, the threat must be removed from the luggage. When baggage is indicated randomly for inspection, an ETD check must be performed.
The procedures shown in Figure 1 may vary slightly from airport to airport. The one shown here, is consistent with the research location.

3. State of the Art

The literature review was conducted while considering that WTMD and BS can be analysed as units but also as a part of the whole system (security checkpoint). The literature review is, therefore, divided into two parts. The first deals with WTMD and BS devices. The second part considers the analysis of WTMD and BS from a holistic system perspective.

3.1. Research on WTMD and BS Devices

There are a number of different methods that have been developed for the detection of threat objects [3]. However, only WTMD and BS are the primary methods for passenger screening [1]. It is important to note that these screening devices have different scopes of operation. WTMD detects only metallic objects, while BS also detects non-metallic objects. This is because different screening methods were used. WTMD uses an electromagnetic field that, when induced by a metal object, causes an alarm. BS uses backscatter or active millimetre-wave imaging technology, and the result is a created image in which the location of all the items can be identified.
When WTMD is considered, intelligent solutions are sought to identify the cause of the alarm. This is because there is a need to reduce the number of alarms caused by unthreatening items. Makkonen [4] clearly states that WTMD is too efficient in screening. This has the effect that a false alarm at the airport can be raised by, for example, belt buckles, shoes, etc. So, the study was directed to be able to recognise the cause of the alarm and select only the threats. Kottler et al. [5] based on passive magnetic sensors and analysing the magnetic spectrum generated when a person passes WTMD. Neural networks were used to discriminate the weapon type and identify other, daily items. Kauppila et al. [6] generates mutually orthogonal homogeneous magnetic fields so that the measured dipole moments allow the classification of even the smallest of the items with a high degree of classification rate (near 90%). Elgwel et al. [7] classified alarm-inducing objects based on the decay rate of the induced currents in the object. However, this method is not robust enough to signal noise, especially for smaller threat objects. Then, the correct identification becomes unlikely. Al-Qubba et al. [8] built a giant magneto-resistive sensor. They used an artificial neural network and support vector machines to recognise threat objects. The study is tested on weapon and common daily item recognition. The results are promising, but they are based on a small sample. The classification rate varied between 60% and 100%, depending on the classification methods adopted.
BS devices operate similarly to X-ray devices that are used in baggage screening. These devices provide images that need to be evaluated. When BS is considered, there is no research on detecting prohibited items. This may be due to the fact that BS devices are not yet widely used at airports. The scale of the problem is yet to be seen. Instead, the BS devices are being investigated for concerns about passenger health and data privacy [9]. However, that is not the subject of this paper. Analysis of images from the BS could be done using the same techniques as the analysis of images from X-ray devices for baggage inspection. Modern computer vision techniques are used to search for threat items on X-ray images [10]. An extensive literature review on this topic has already been performed by Akcay and Breckon [11]. Here, it is important to note that different methods are used, and learning is done on different data sets and a limited number of prohibited items. Therefore, different precision results are obtained in object detection. Jynyi et al. [12] achieved a precision of 77% using F-RCNN. In contrast, Liang et al. [13] also using F-RCNN with Inception ResNet v2 gave a precision of 92%. Liu et al. [14], using YOLOv2, obtained a precision of 94.5%. The highest precision rate (96.3%) was obtained by Ackay et al. [15] for R-FCN with ResNet-101. It is very difficult to determine which of these studies give the best results. As mentioned above, the number of prohibited items was limited in the study. However, they give hope that the process can be more automated in the near future.
To summarise this part of the state-of-the-art research, here are the following conclusions. The current methods are reactionary. These methods are only applied when a false alarm is triggered. We, however, propose preventive methods. We want to prevent false alarms. This can collaborate with the research papers presented. That is why we undertook an additional study of the state of the art in Section 3.2. We show that no one has yet tried to reduce false alarms.

3.2. Research on Security Checkpoint Functioning

Choi [16] identifies that the COVID-19 pandemic is affecting air transport at a very high rate. All processes need to be reconfigured. In addition, fulfilling the WHO [2] recommendations can significantly affect dwell-time and process performance. A system for tracking passengers based on image processing is indicated. It can be applied successfully at security checkpoint. However, it only gives information if there was contact between people. Štimac et al. [17] focus on maintaining social distance at the airport terminal. Cases of distance between passengers and airport staff are discussed. However, direct contact at the security checkpoint has not been considered. Kierzkowski and Kisiel [18] analysed different strategies for distancing passengers at the security checkpoint. In this case, a manual search was also not considered. This work also confirms that maintaining social distance limits process performance. Di Mascio et al. [19] present a reconfiguration of the passenger handling system according to the Level of Service by the IATA [20] and the WHO [2]. The main objective is to achieve a compromise between standards in the pandemic era and the level of service quality from the passenger’s point of view. Here, mainly the area per passenger and dwell-time is important. Again, a hand search at a security checkpoint is not considered.
Recent trends in the literature show that attention is being paid to maintaining principles that determine the health of passengers and operators. However, the potential for reducing false alarms in passenger screening to decreasing direct operator-to-passenger contact has not yet been explored. Looking further back, the trend was the opposite. It was indicated that higher passenger density in the security screening preparation area had a positive impact on system performance [18]. Skorupski and Uchronski [21] show that reducing the number of alarms is necessary to obtain the expected system performance. They show that this can be done by changing the sensitivity of the WTMD. However, reducing the sensitivity limits the detection of small metal objects. This may be incorrect because it reduces the safety level. Different passenger flow control strategies were considered to increase the system performance [22]. The various queuing strategies for the security checkpoint did not take into account the social distance at the time. All this shows that the previous methods were successful when contact and distance were not important. However, the new reality has shown that it is necessary to ensure efficiency with the given social rules.
This part of the state-of-the-art survey again shows that the issue of reducing operator-to-passenger contact has not been considered in a holistic view of the screening system. However, this analysis points the way that new procedural changes should also go hand in hand with system performance (as it has been so far). Therefore, we will relate our study to performance as well.

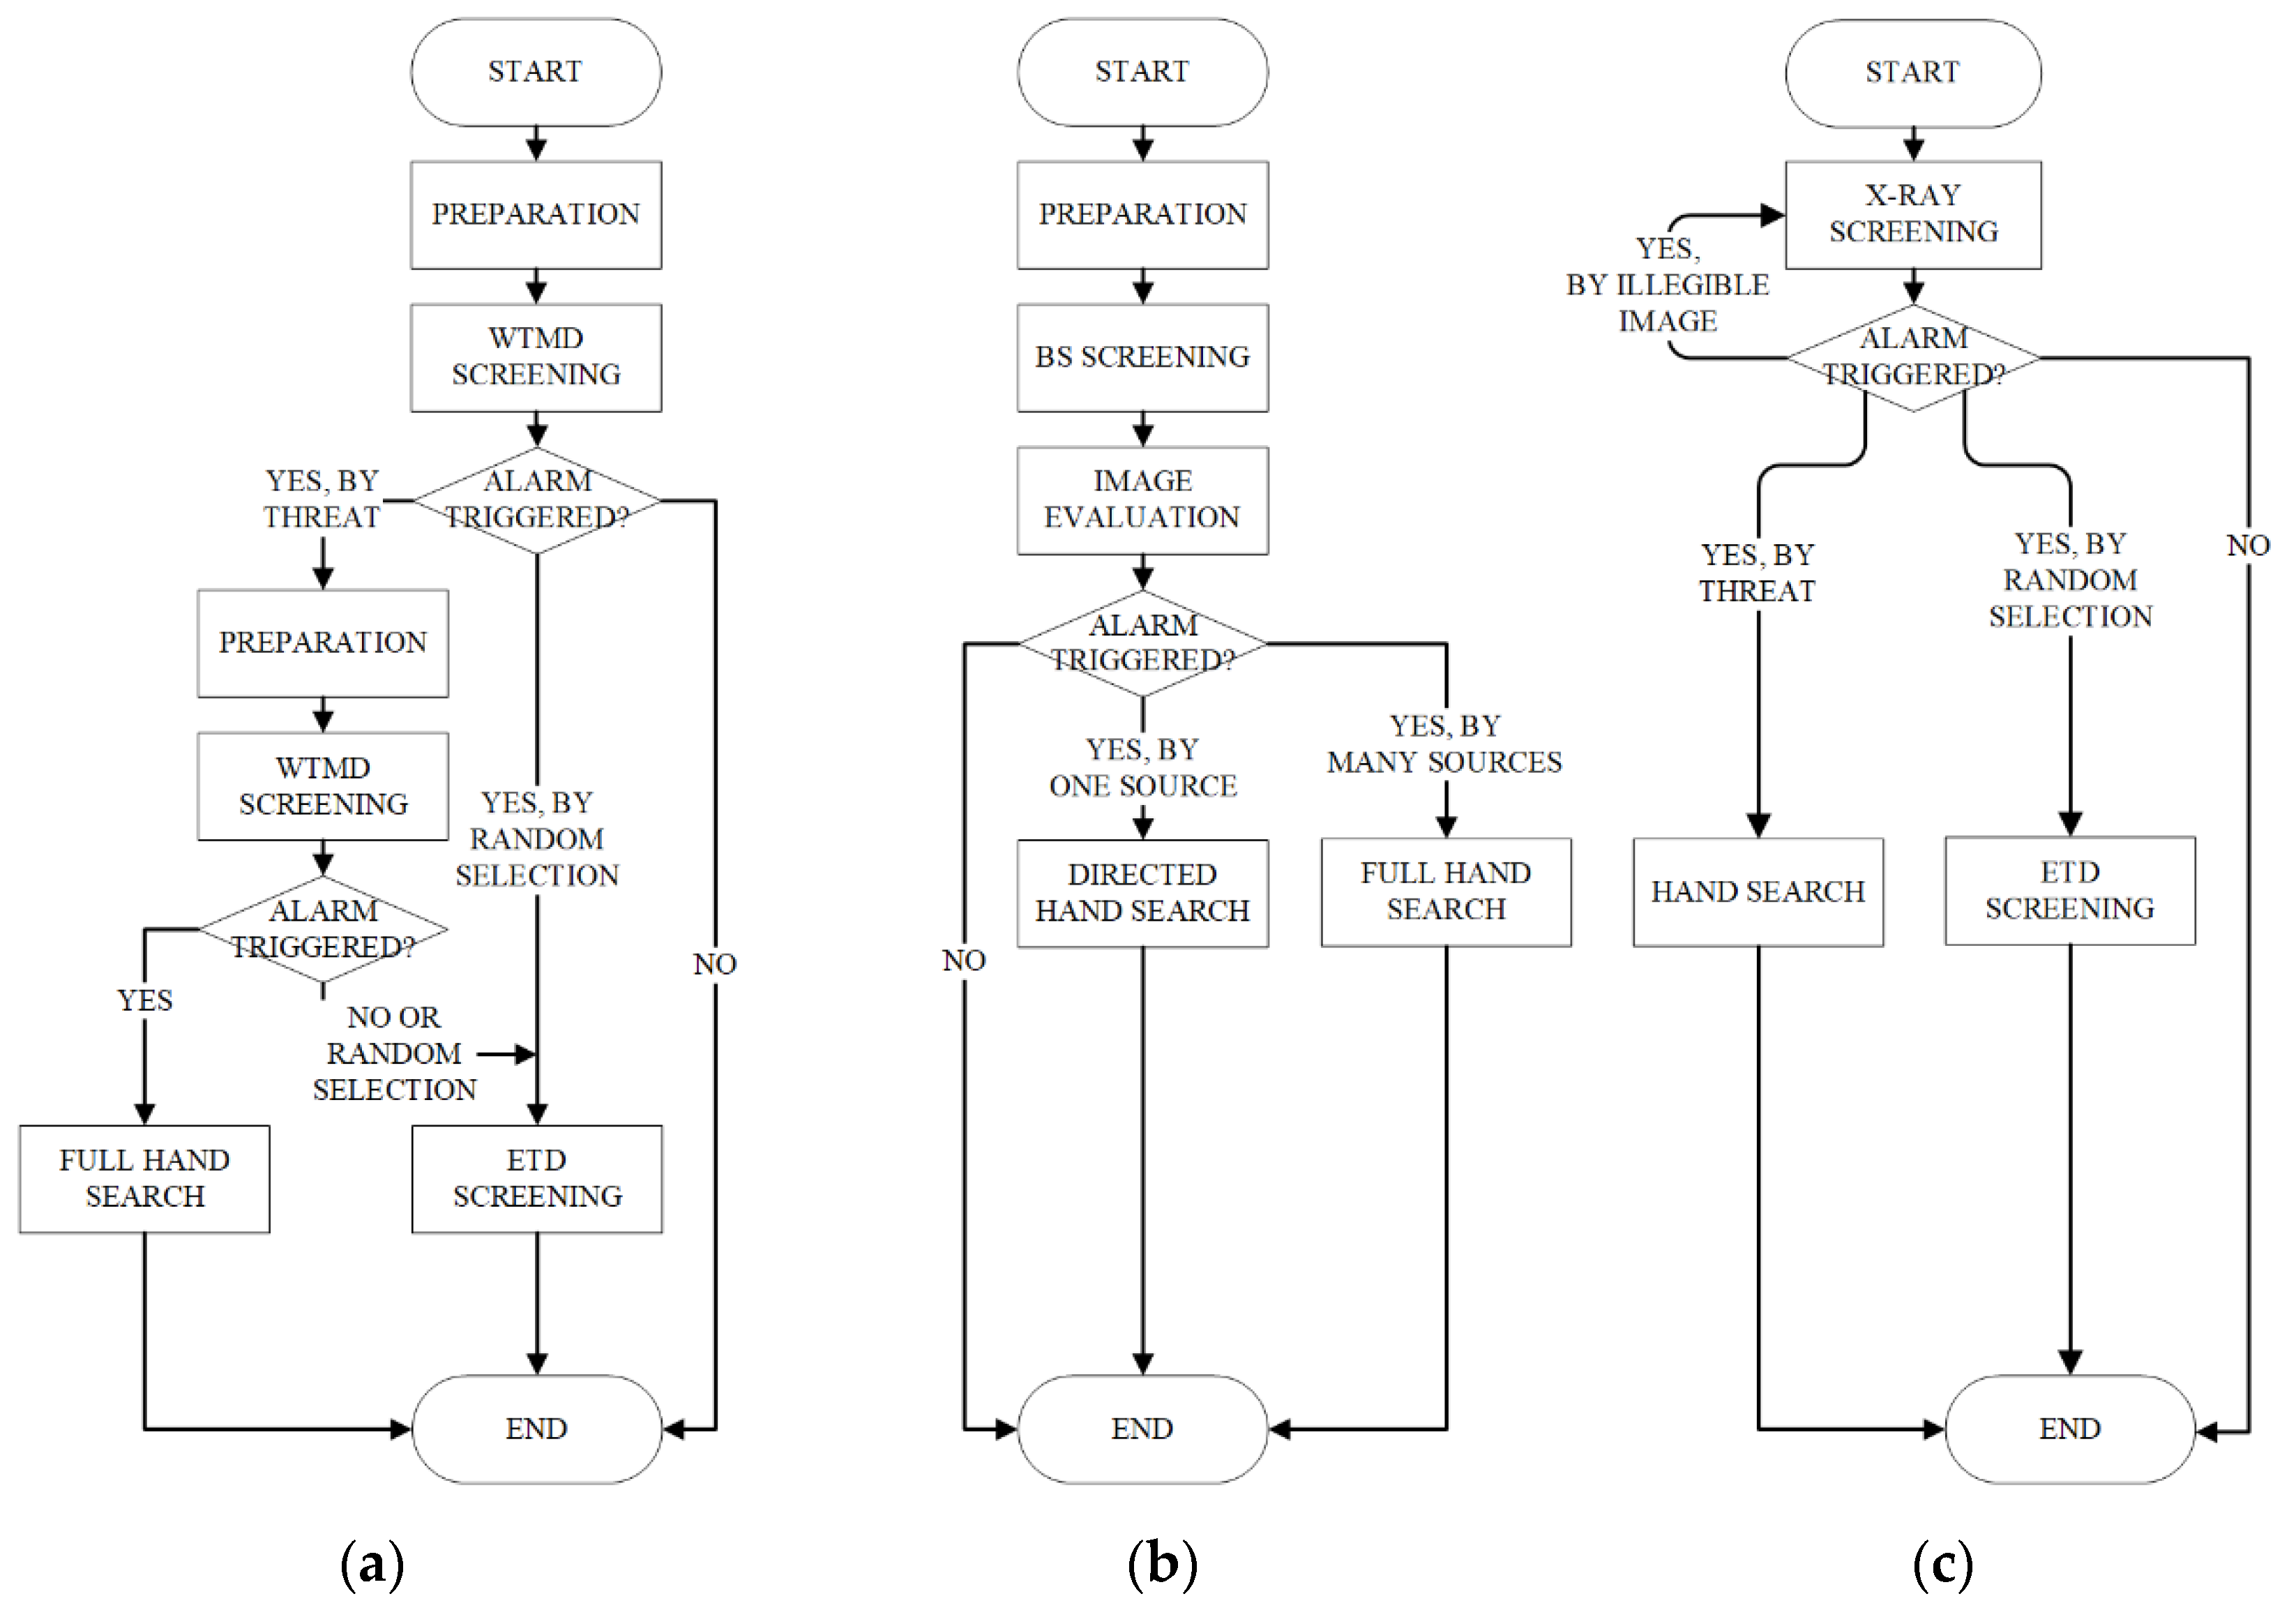
4. Study on the Improvement of Security Checkpoint Operations

This section will present empirical results for the tested process modifications in the real system. Due to the COVID-19 pandemic, it is not possible to test system performance. Hotle and Mumbower [23], show that air traffic has decreased by up to 95%. Passenger handling has changed significantly [24]. Passenger flow through the security checkpoint is currently insufficient to determine performance empirically. Therefore, we built a simulation model that will allow us to extend our analysis with the predicted performance.
Thus, the methodology is based on empirical studies that investigate the influence of operator experience on the number of alarms triggered and the duration of the process. As an additional support, a simulation model is used to perform a sensitivity analysis of the system to a change in its configuration. This allows estimations of the performance and power consumption for the process.
Section 4.1 covers the functional description of the model. Section 4.2 covers the main part of the research description and the discussion of the results.

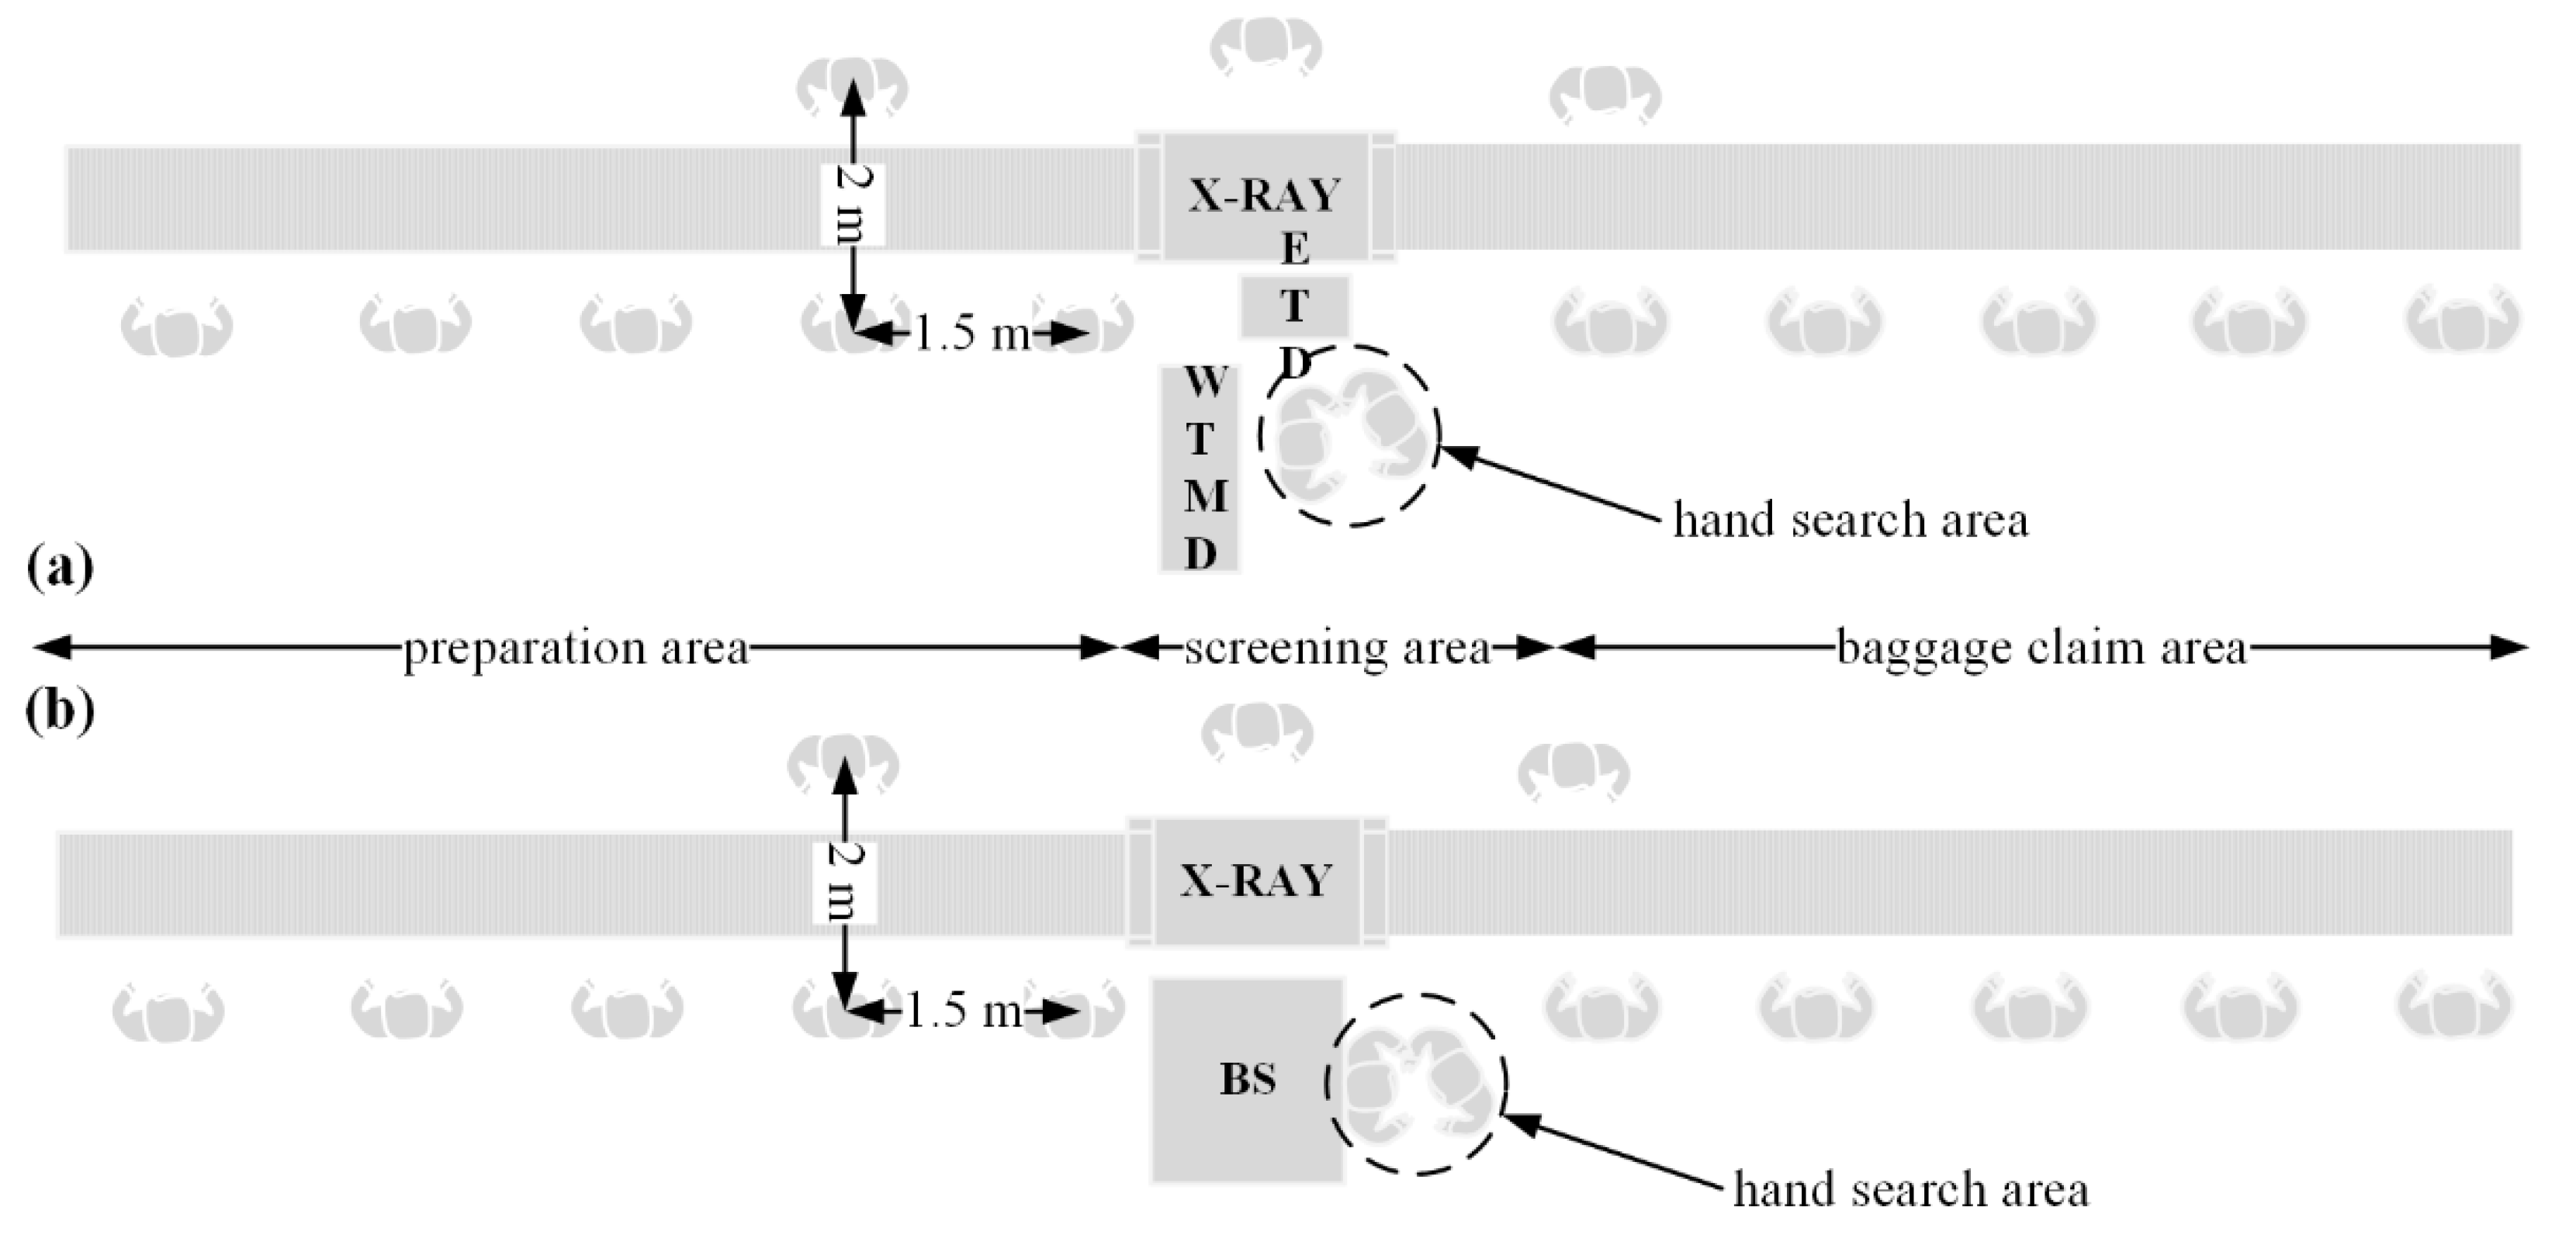
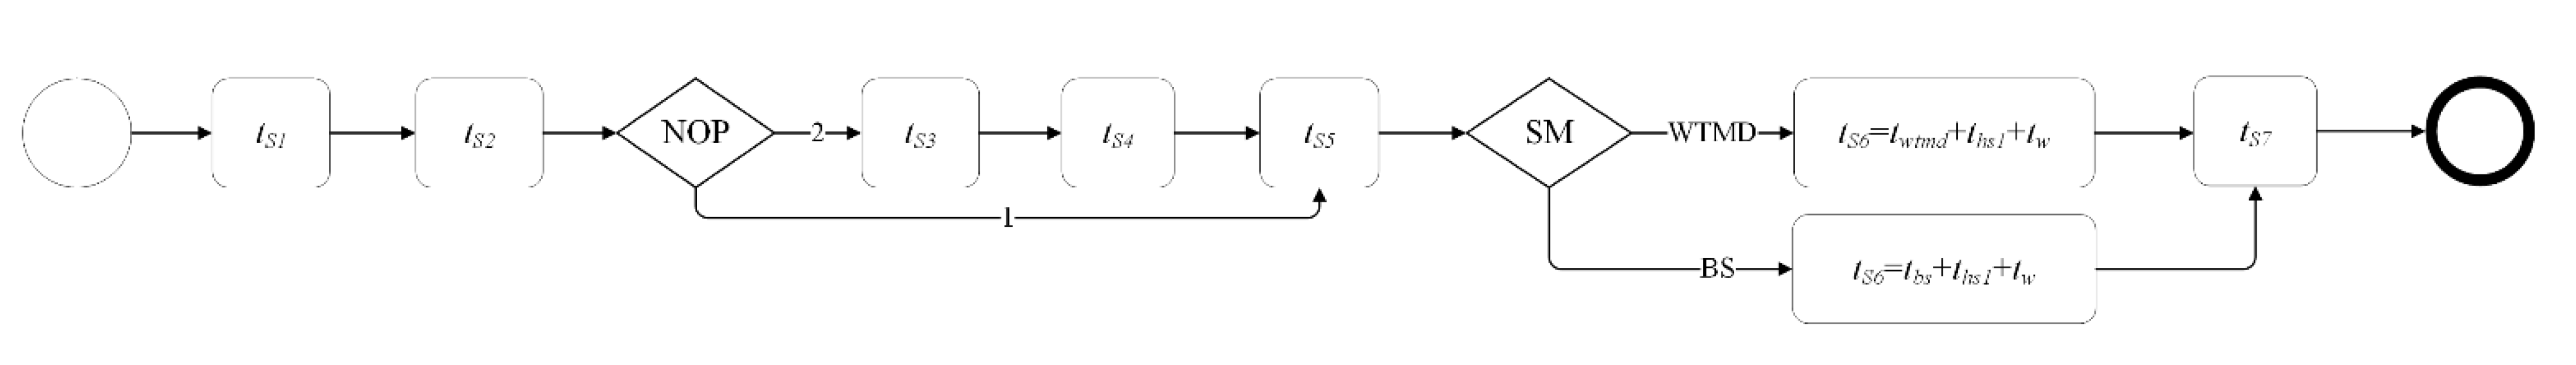
4.1. System Structure and Its Representation in the Simulation Model

We conducted research on two security single lanes. Single lane means that the lane is equipped with only one X-ray device for baggage screening. Simplified lane diagrams for the procedure with WTMD and BS are shown in Figure 2. It is noteworthy that the system structure is almost identical. The only difference is the use of WTMD, ETD, and BS devices. The exact structure of the process has already been described in the chapter entitled as a problem background (see Figure 1, Section 2).
We will be investigating the different structures of the system, and therefore, we introduce the basic notation (1) describing the system parameters to make its analysis understandable.
NOP | E1 | E2 | SM |
The NOP parameter specifies the number of operators who assist passengers in the preparation area. The set of possible cases is one or two operators. By default, there was one operator in the system, and we increased the number to two during the research. The parameters E1 and E2 define the experience of the operators. Parameters E1 and E2 are important because they allow us to interpret the influence of the operator experience on the likelihood of a hand search and the time it takes to prepare a passenger for a screening. Based on the experience of airport experts (passenger service managers were interviewed), we adopted three groups for parameters E1 and E2. A value of 1 means that the operator has no experience (has worked less than one month). A value of 2 means moderate experience (between 1 month and 3 months of work). A value of 3 means extensive experience of the operator (more than 3 months of work). When NOP = 1, E2 is equal to 0, because there is only one operator. The last parameter indicates which device is dedicated to screening the passenger. For example, for a system with a structure 1|1|0|WTMD, there is one operator with low experience, and the primary screening method is the WTMD device.
The lanes function with pandemic standards in mind. The distance between adjacent people is greater than or equal to 1.5 m. However, maintaining this distance in the hand search area is impossible. From a simulation modelling point of view, the volume of the lane areas is important. The volume of the preparation area for screening VPA and baggage claim area VBCA is a maximum of five passengers (VPA = 5, VBCA = 5). These parameters refer to the real system we analysed. Only one passenger may be in the screening area at a time VSA = 1. For estimating system performance, a full workload is important. This means that another passenger must be generated in the model any time that it has access to the preparation area. The condition for generating a new passenger is, therefore, NPA < 5, where NPA is the current number of passengers in the preparation area.
The simulation model controls the flow of passengers so that they are moved in the FIFO strategy according to the locations, as shown in Figure 3. Depending on the dynamics of the implementation of the simulation experiment, the passengers can be given different states from S1 to S7. An example a state pattern is shown in Figure 3.
The system generates a passenger with state S1. This means that the passenger starts the preparation process according to their own experience. At the same time, the passenger also spreads the signal that operator assistance is required. The time (tS1) spent in S1 ends when the operator begins assisting the passenger. Time tS1 is the result of the current state of the simulation experiment and is measured directly from the simulation model. S2 means the preparation for the screening continues as instructed by the operator. The time tS2 spent in S2 is given by a random variable according to Table 1. Depending on the operator experience E1, the time tS2 is generated from a different probability density function.
Depending on the system configuration (NOP parameter), other simulation steps were executed in the simulation experiment. When NOP = 1 (one operator in the preparation area), the passenger goes to state S5. When there are two operators in the preparation area (NOP = 2), the passenger preparation is verified and revised by the second operator. After S2, the passenger waits in S3 for the next operator to be available. The time in S3 (tS3) is calculated in the simulation model and depends on whether the operator can check the preparation quality of the passenger. When the passenger moves to S4, a preparation revision takes place. The time tS4 of this revision is given by a random variable defined by a probability density function (Table 2). The time tS4 depends on the experience of the preceding operator E1 and the experience of the current operator E2. The passenger waits in S5 for space availability in the screening area. The time duration of S5 (tS5) is calculated in the simulation model and depends on the time when the current number of passengers in the screening area is equal to NSC = 0. In the screening area, the passenger is assigned state S6. However, it is interpreted separately for other screening methods (SM), which may be WTMD or BS. For the WTMD pathway, the WTMD device screening time, the manual inspection time (including hand search and ETD screening), and the wait time for an available space in the baggage claim area are taken into account. For the BS pathway, the BS device screening time, the hand search duration, and the wait time for an available space in the baggage claim area are taken into account. Therefore, the time spent in S6 is counted differently for WTMD and BS (see Figure 4, tS6). Probability density functions based on real system data are shown in Table 3. Time, tS7, is dedicated to baggage claim by the passenger and is described by a probability distribution (Table 3).
As the output, we measured the system performance. It indicated how many passengers per hour (pax/h) can pass through the lane with the given system configuration. During the simulation experiment, an additional algorithm also calculated the power consumption per passenger. This gave an additional output variable to prevent the search for an environmentally negative solution. The algorithm is shown in Figure 5 and is based on the following assumptions.
The power consumption was determined experimentally by measuring it in the real system. The power consumption for WTMD, BS, X-ray, and ETD devices was checked. The tests indicated that the power consumption of WTMD is constant at 70 W. The body scanner has a variable consumption. It depends on the state it is in (operating, idle, cooling). Here, however, the load on the screening lane was set at maximum and the device was considered continuously running. A constant consumption of 1.9 kW was therefore assumed. X-ray and ETD will be considered in more detail.
The stream of baggage checks in the X-ray was unsteady. There were flow disturbances due to the varying number of items in the passenger’s possession and the occurrence of re-check. So, here, 1 kW at idle, 1.13 kW during transport on conveyor and 1.85 kW during baggage screening were determined in detail. ETD, on the other hand, is only used for selected passengers. Here, one must also check if it is in one of two states (idle—48 W, operating—120 W). The algorithm checks these states with a frequency of 1 s and sums the total energy consumption for an experiment lasting one hour. Then, the value is converted per passenger.
To validate the proper operation of the model, a two-sample Kolmogorov–Smirnov test was conducted. This is the method used to validate event-based simulation models (Belli et al., 2012). Validation was performed on a sample of 100 real system data for configurations 1|2|0|WTMD. The passenger processing time in the system was compared with simulation. The value of the test statistic was 0.09, which is less than the critical value of 1.92. This means that the model gives results that are consistent with the real system.

4.2. Study on the Feasibility of Reducing Operator-to-Passenger Contact with Respect to System Performance

In this section, we provide a discussion of the research conducted and its findings. We refer in our considerations to the problems related to process aspects. To see if it is possible to reduce the number of alarms without significantly affecting system performance, we are looking for answers to the following questions:
  • Is it better to use WTMD or BS?
  • Does the experience of operators have a significant impact on the number of alarms triggered?
  • Will adding an additional operator to the system reduce the number of alarms triggered?
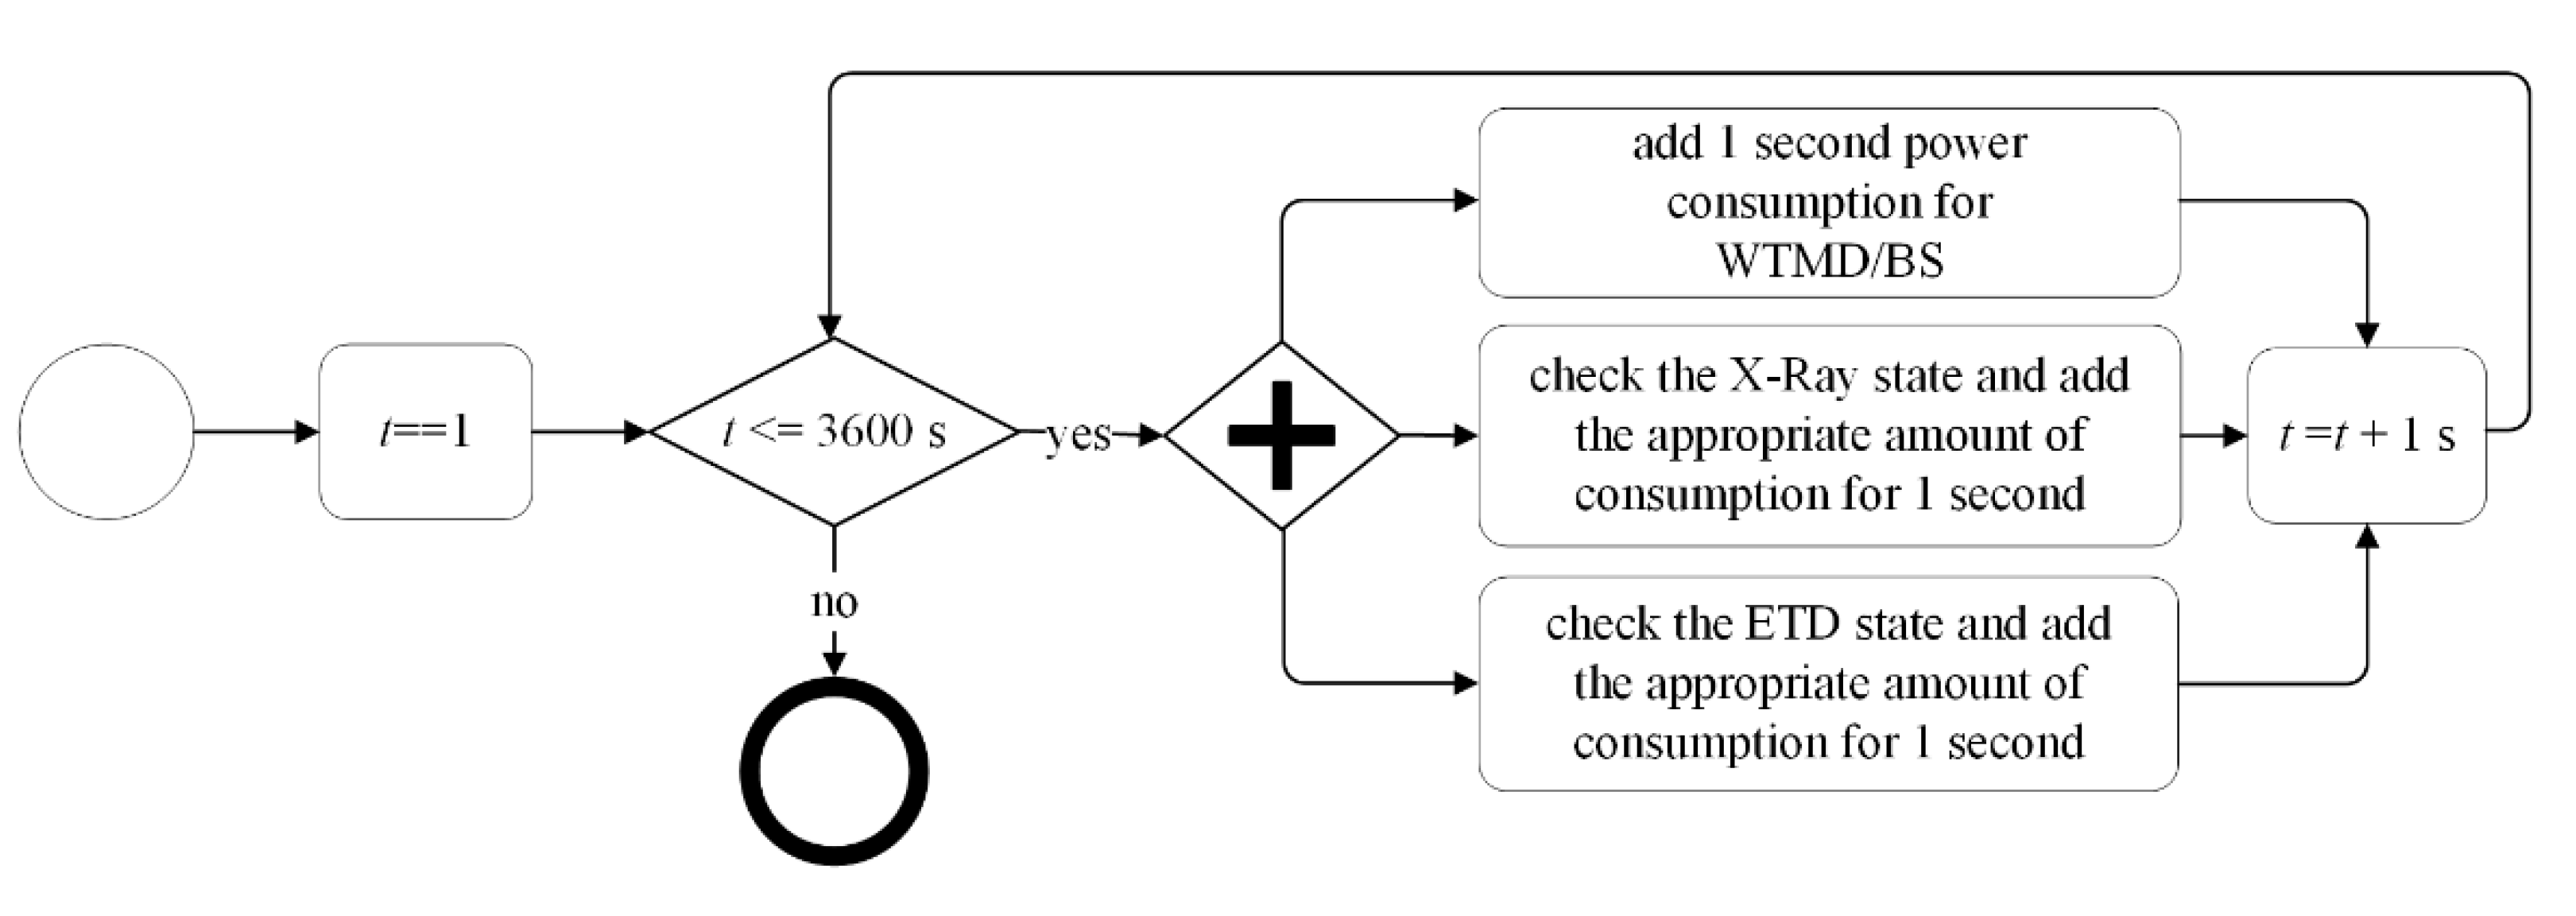
  • How do the investigated system parameters relate to power consumption?
Table 4 and Table 5 show the results of the research conducted. The results were collected depending on the investigated system configuration NOP | E1 | E2 | SM (see Section 4.1). The results were divided into two tables according to the SM parameter—WTMD or BS detection method.
By changing the system configuration, it can be seen that the best result for both performance and the number of triggered alarms is given by System Configuration 12 with the WTMD method (Table 4). The percentage of alarms drops to a minimum value of 15%, and the throughput is the highest 146 pax/h. This means that approximately 22 contacts between the hand search operator and the passenger will occur per hour. This scenario will, therefore, be the optimal one—it will be called the target scenario when comparing the results. The worst result is for the System Configuration 1 with the BS detection method (Table 5). The percentage of triggered alarms, in this case, is 61%. Considering the system performance for this configuration, which is 125 pax/h, the number of operator-to-passenger contacts will be approximately 76 per hour. Thus, it can be seen that, depending on the system configuration, the final value can change by as much as 17% of the system performance and 37% of the number of alarms per hour. This shows the significance of the problem that is raised in this paper.
For each comparison, when the same scenarios from Table 4 and Table 5 are taken into consideration, it is seen that the system configuration using WTMD gives a better result. This is true for the percentage of alarms triggered as well as the system performance. Figure 6 shows the ratio between the number of alarms triggered against a target value of 22 alarms per hour. Figure 7 shows the ratio between the system performance and the target value of 146 passengers per hour. In both cases, each scenario is considered for the BS and WTMD methods.
In both cases, it can be seen that BS always gives worse results. In Figure 6, the results for BS (triangular markers) are always higher than the results for WTMD (circular markers). This means that, when comparing equal scenarios for WTMD and BS methods, BS always results in more alarms than WTMD. The analogy is in Figure 7, only this time, the BS results are always lower than the WTMD results. In this figure, this means that BS causes a larger performance reduction each time compared to the same WTMD scenario. Considering all the scenarios, on average, BS causes 4.3 more alarms per hour than WTMD. BS also reduces performance by 12.6 pax/h on average compared to WTMD. This may seem like an insignificant difference. However, the process is often performed on several security lanes in parallel. In this situation, the results will have a more significant effect on the whole system. The power consumption results also show that the use of WTMD is more environmentally friendly. The key point in this system is the high power consumption of the BS device. The system in BS configuration consumes as much as twice as much power as the system with WTMD.
When we consider the sets of results for Scenarios {1, 2, 3}, {4, 5, 6}, {7, 8, 9}, and {10, 11, 12} separately, the effect of operator experience on the results obtained may be visible. In these groups, the experience of one of the operators is increased in the following scenarios. It can be clearly seen that, by increasing the experience, the ratio approaches close to 1.0—the target value. For example, in the case where there is only one inexperienced operator (Scenario 1 for WTMD, Figure 6), it causes a result 2.55 times worse for the number of alarms than the target value. When a worker with average experience is in the system instead (Scenario 2 for WTMD, Figure 6), this result is only 2.05 times worse than the target value. Additionally, when the best worker is present (Scenario 3 for WTMD, Figure 6), the result is only 1.32 times worse. The same is true for system performance, where a better operator helps ensure greater system performance (Figure 7). These are not surprising results; however, this paper helped determine the scale of this phenomenon for this case study. It is noteworthy that changing these results directly into numbers, for example in the set {1, 2, 3}, the number of alarms per hour could be 41, 32, or 20. The performance in the same case could be 137, 140, or 145. This means that the results for the system are dependent on the experience of the operators.
One more important conclusion should be noted here. The importance of the influence of operator experience also makes it important to select the proper system configuration. It can be seen that adding another operator to the system is not always beneficial. Please see the set of Scenarios {3, 4, 5} (Figure 6). In Scenario 3, there is only one operator (well experienced), and it guarantees better results than the configurations {4, 5} where there are two operators who are but less well trained.
The results show that operator experience also affects power consumption. When the passenger is well prepared, the number of re-checks decreases. This increases the performance. This causes the power consumption per passenger to decrease. This is a very positive aspect.
The preceding analysis has shown the potential for alarm reduction by using the appropriate system structure. Table 4 and Table 5 also show statistics that represent the time a passenger remains in the preparation area without operator assistance, tps. This parameter varies between 76 and 119 s. With knowledge of this time reserve, using a simulation model, we did a sensitivity analysis in which we changed the percentage of alarms triggered and added an extra second to the assist time. We have shown the results of this experiment in Figure 8. We are aware that the time reserve is the result of various factors, e.g., operator availability, screening area availability, etc. However, we wanted to see if increasing the assistance time would result in a decrease in process performance. The results shown in Figure 8 show that the passenger assistance time can be increased by an average of 6 s. Then, the reduction in performance is low. For further values, this process will already be a critical element and the performance of the system will decrease drastically.
We then trimmed the graph in Figure 8 to three values 0, 6, and 7 s of additional assist time. The value of zero represents the current assist time, and the value of six is the critical value for maintaining performance. The value of seven shows the initiation of a large performance loss. We presented the distributions obtained by trimming in Figure 9. If the hypothesis that increasing the assist time decreases the percentage of alarms triggered were true, then Figure 9 shows that, for System Configuration 3, using WTMD, a 6 s increase in time must decrease the number of alarms by 5% (shown by the arrow in Figure 9). Then, the performance of the system will not change. However, if this reduction in the number of alarms were greater than 5%, then the performance of the system may increase by up to 3 pax/h. With a value of less than 5%, the performance may decrease by 2 pax/h. It can also be seen that, when increasing the assist time by 7 s, it is not possible to keep the performance the same. For 10% of the number of alarms (the minimum value due to the random triggering of alarms by WTMD), the performance is 145. It therefore already decreases by one compared to the current scenario. This analysis identified an area of possible system optimization. In future research, we will attempt to develop a standardized operator assist method that will verify the hypothesis and allow us to assess the scale of its impact for the case shown in Figure 9.
The analyses presented in this chapter can be performed for any of the scenarios presented and for any security control lane configuration. The proposed evaluation method allows for the selection of a beneficial strategy for the operation of the airport security checkpoint.

5. Discussion

The research conducted and the analysis of the results allowed us to find answers to the questions raised in Section 4.2. From the results, it is directly shown that, in any system configuration, WTMD gives better performance and a lower number of alarms triggered and lower power consumption than BS. This is, unfortunately, related to the specificity of the BS method. The method is sensitive to passenger movement during screening, folds, and small clothing additions. In addition, operators must remind passengers that many more things can raise an alarm than with WTMD—here, only metal objects do. Thus, for Question I, the answer suggests that the WTMD method is better for epidemic conditions of system operation.
The answers to Questions II and III are interrelated. In terms of Question II, the results showed conclusively that operator experience is key to reducing the number of alarms triggered, which results in the number of operator-to-passenger contacts by performing hand searches. However, this also makes the answer to Question III ambiguous. From the results, it comes out that sometimes it is better to have one operator in the system who is highly experienced versus having two with little experience. However, in comparing other scenarios, there are also cases where two operators work better than one. This is where the graphical charts presented in Section 4.2 come in very useful. The airport manager can plan his actions based on them. However, on the basis of conducted analyses, it is recommended to use, in pandemic periods, one highly experienced operator in the area of passenger preparation for security control. The undoubted advantage of such a solution is to reduce by half the necessary hygiene measures (gloves, masks). Of course, very experienced operators are not always available in the system. Then, again, airport managers can refer to our results and choose the best strategy possible. Preventive measures, however, should be focused first and foremost on a good training system for operators. This also has positives in sustainable system management. Greater operator experience reduces the occurrence of re-check. This gives a reduction in the power consumption of the system.
The results are promising, and it may be possible to develop a training system that, through adequate preparation time, will not reduce the performance but will rather reduce the number of alarms raised. We will verify this in the nearest future.

6. Conclusions

In this paper, through a combined experimental study and computer simulation, we have shown that the security screening process can be managed at a level currently overlooked. A significant effect of operator experience on the occurrence of alarm triggers for metal detection devices can be observed in the system. It is also no surprise that a change in process performance goes hand-in-hand with this. We have demonstrated the magnitude of this effect here by using a simulation model. Considering also the possibility to determine energy consumption, we show that process management can aim at subsequent optimization of health safety, performance, and energy consumption. This offers a good chance of achieving sustainable air transport development in terms of passenger handling. Our research provides a basis for the future development of new process evaluation methods taking these metrics into account. Additionally, the results obtained show that it is needed. Here, it was identified that it is not always better to have two operators in the system than one. This is not an obvious fact to notice during basic observation of the system. The observations also showed that there is some space that can potentially be managed through better employee training. This will be the focus of our further research.

Author Contributions

Conceptualization, A.K. and T.K.; methodology, A.K.; software, T.K.; validation, A.K. and T.K.; formal analysis, A.K.; investigation, A.K. and T.K.; resources, A.K. and T.K.; data curation, A.K. and T.K.; writing—original draft preparation, A.K. and T.K.; writing—review and editing, A.K. and T.K.; visualization, A.K. and T.K. All authors have read and agreed to the published version of the manuscript.

Funding

This research received no external funding.

Data Availability Statement

Data are contained within the article.

Conflicts of Interest

The authors declare no conflict of interest.

References

  1. EU. Commission Implementing Regulation (EU) 2015/1998 of 5 November 2015 Laying down Detailed Measures for the Implementation of the Common Basic Standards on Aviation Security. 2015. Available online: https://eur-lex.europa.eu/legal-content/EN/TXT/PDF/?uri=CELEX:32015R1998&from=EN (accessed on 15 September 2021).
  2. WHO. Interim Recomenndation on Obligatory Hand Hygiene against Transmission of COVID-19; World Health Organization: Geneva, Switzerland, 2020. [Google Scholar]
  3. Agruto, A.; Li, Y.; Tian, G.Y.; Bowring, N.; Lockwood, S. A Review of Concealed Weapon Detection and Research in Perspective. In Proceedings of the 2007 IEEE International Conference on Networking, Sensing and Control, London, UK, 15–17 April 2007; pp. 443–448. [Google Scholar]
  4. Makkonen, J. Classification of Metallic Targets Using a Walk—Through Metal Detection Portal; Tampereen Teknillinen Yliopisto—Tampere University of Technology: Tempere, Finland, 2016; pp. 1–69. [Google Scholar]
  5. Kottler, D.K.; Roybal, L.G.; Polk, R.E. Detection and classification of concealed weapons using a magnetometer-based portal. In Proceedings Sensors, and Command, Control, Communications, and Intelligence (C3I) Technologies for Homeland Defense and Law Enforcement; SPIE: Orlando, FL, USA, 2009; Volume 4708, pp. 1–8. [Google Scholar]
  6. Kauppila, J.; Ala-Kleemola, T.; Vihonen, J.; Jylhä, J.; Ruotsalainen, M.; Järvi, A.; Visa, A. Classification of items in a walk-through metal detector using time series of eigenvalues of the polarizability tensor. In Proceedings Detection and Sensing of Mines, Explosive Objects, and Obscured Targets XIV; SPIE: Orlando, FL, USA, 2009; Volume 7303, pp. 1–15. [Google Scholar]
  7. Elgwel, A.; Harmer, S.W.; Bowring, N.J.; Shaofei, Y. Resolution of Multiple Concealed Threat Objects Using Electromagnetic Pulse Induction. Prog. Electromagn. Res. M 2012, 26, 55–68. [Google Scholar] [CrossRef] [Green Version]
  8. Al-Qubba, A.R.; Al-Shiha, A.; Tian, G.Y. Threat Target Classification Using ANN and SVM Based on a New Sensor Array System. Prog. Electromagn. Res. B 2014, 61, 69–85. [Google Scholar] [CrossRef] [Green Version]
  9. Mironenko, O. Body scanners versus privacy and data protection. Comput. Law Secur. Rev. 2011, 27, 232–244. [Google Scholar] [CrossRef]
  10. Mery, D.; Svec, E.; Arias, M.; Riffo, V.; Saavedra, J.M.; Banerjee, S. Modern Computer Vision Techniques for X-Ray Testing in Baggage Inspection. IEEE Trans. Syst. Man Cybern. Syst. 2017, 4, 682–692. [Google Scholar] [CrossRef]
  11. Akçay, S.; Breckon, T. Towards Automatic Threat Detection: A Survey of Advances of Deep Learning within X-ray Security Imaging. arXiv 2020, arXiv:2001.01293, 1–32. [Google Scholar]
  12. Jinyi, L.; Leng, J.; Liu, Y. Deep Convolutional Neural Network Based Object Detector for X-Ray Baggage Security Imagery. In Proceedings of the International Conference on Tools with Artificial Intelligence (ICTAI), Portland, OR, USA, 4–6 November 2019; pp. 1–10. [Google Scholar]
  13. Liang, K.J.; Sigman, J.B.; Spell, G.P.; Strellis, D.; Chang, W.; Liu, F.; Mehta, T.; Carin, L. Toward Automatic Threat Recognition for Airport X-ray Baggage Screening with Deep Convolutional Object Detection. Computer Vision and Pattern Recognition (cs.CV). arXiv 2019, arXiv:1912.06329, 1–11. [Google Scholar]
  14. Liu, Z.; Li, J.; Shu, Y.; Zhang, D. Detection and Recognition of Security Detection Object Based on Yolo9000. In Proceedings of the International Conference on Systems and Informatics (ICSAI), Nanjing, China, 10–12 November 2018; pp. 278–282. [Google Scholar]
  15. Akçay, S.; Breckon, T. An Evaluation of Region-Based Object Detection Strategies within X-ray Baggage Security Imagery. In Proceedings of the IEEE International Conference on Image Processing (ICIP), Beijing, China, 17–20 September 2017; pp. 1337–1341. [Google Scholar]
  16. Choi, J.H. Changes in airport operating procedures and implications for airport strategies post-COVID-19. J. Air Transp. Manag. 2021, 94, 102065. [Google Scholar] [CrossRef]
  17. Štimac, I.; Bračić, M.; Pivac, J.; Oleksa, I. Analysis of Recommended Measures in the Conditions of the COVID-19 Pandemic at Croatian Airports. Transp. Res. Procedia 2020, 51, 141–151. [Google Scholar] [CrossRef]
  18. Kierzkowski, A.; Kisiel, T. Simulation model of security control lane operation in the state of the COVID-19 epidemic. J. Air Transp. Manag. 2020, 88, 101868. [Google Scholar] [CrossRef] [PubMed]
  19. Di Mascio, P.; Moretti, L.; Piacitelli, M. Airport Landside Sustainable Capacity and Level of Service of Terminal Functional Subsystems. Sustainability 2020, 12, 8784. [Google Scholar] [CrossRef]
  20. IATA—International Air Transport Association. Airport Development Reference Manual, 10th ed.; IATA: Montreal, QC, Canada, 2014. [Google Scholar]
  21. Skorupski, J.; Uchroński, P. Managing the process of passenger security control at an airport using the fuzzy inference system. Expert Syst. Appl. 2016, 54, 284–293. [Google Scholar] [CrossRef]
  22. Li, Y.; Gao, X.; Xu, Z.; Zhou, X. Network-based queuing model for simulating passenger throughput at an airport security checkpoint. J. Air Transp. Manag. 2018, 66, 13–24. [Google Scholar] [CrossRef]
  23. Hotle, S.; Mumbower, S. The impact of COVID-19 on domestic U.S. air travel operations and commercial airport service. Transp. Res. Interdiscip. Perspect. 2021, 9, 100277. [Google Scholar]
  24. Schultz, M.; Soolaki, M. Analytical approach to solve the problem of aircraft passenger boarding during the coronavirus pandemic. Transp. Res. Part C Emerg. Technol. 2021, 124, 102931. [Google Scholar] [CrossRef] [PubMed]
Figure 1. Simplified diagram of the passenger screening process: (a) procedure for passengers with the WTMD screening method, (b) procedure for passengers with the BS screening method, (c) procedure for hand luggage.
Energies 14 05943 g001
Figure 2. Simplified diagrams of security lanes: (a) procedure for the WTMD screening method, (b) procedure for the BS screening method.
Energies 14 05943 g002
Figure 3. Example of a model state with passenger states covered.
Energies 14 05943 g003
Figure 4. Simplified algorithm for simulating passenger flow through a security lane.
Energies 14 05943 g004
Figure 5. Algorithm for determining power consumption.
Energies 14 05943 g005
Figure 6. Ratio between the number of alarms triggered against a target value of 22 alarms/h.
Energies 14 05943 g006
Figure 7. Ratio between the system performance and the target value of 146 pax/h.
Energies 14 05943 g007
Figure 8. System performance sensitivity analysis for the assist time and percentage of alarms triggered for System Configuration 3.
Energies 14 05943 g008
Figure 9. The concept of reducing the number of alarms triggered by increasing operator assistance time.
Energies 14 05943 g009
Table 1. Erlang distribution parameters, describing the time tS2, depending on the experience of the first operator.
System Configuration E1 ParameterLocationScaleShape
12.0113.6422.760
22.1863.9593.000
32.2524.0783.014
Table 2. Weibull distribution parameters, describing the time, tS4, depending on the experience of the second operator conditioned by experience of first operator.
E2 ParameterE1 Parameter
123
LocationScaleShapeLocationScaleShapeLocationScaleShape
13.77811.2091.2053.90511.5861.2464.11812.2161.313
23.99011.8381.2734.24512.5941.3544.37212.9721.395
34.16012.3421.3274.41513.0981.4084.50013.3501.435
Table 3. Distributions describing the other variables in the simulation model.
VariableDistributionParameters
LocationScaleShape
twtmdlognormal0.0003.0140.113
tbspearson V2.9909.8982.262
ths1erlang12.08111.1112.000
ths2weibull1.2897.4402.337
twgamma0.00048.1480.395
tS7weibull9.44296.3782.102
Table 4. Results for the WTMD detection method.
No.System ConfigurationAlarmsPerformanceSelf-Preparing TimePower Consumption
NOPE1E2SM[%][pax/h]tps = tS3 + tS5 [s]Wh/pax
1110WTMD4113710,51614.0
2120WTMD32140977113.5
3130WTMD20145924112.7
4211WTMD36139905713.7
5212WTMD29140882613.5
6213WTMD18145841812.6
7221WTMD28141832413.4
8222WTMD24142813513.1
9223WTMD17145786412.6
10231WTMD19145783812.7
11232WTMD16145769012.5
12233WTMD15146761812.4
Table 5. Results for the BS detection method.
No.System ConfigurationAlarmsPerformanceSelf Preparing TimePower Consumption
NOPE1E2SM[%][pax/h]tps = tS3 + tS5 [s]Wh/pax
1110BS49125119,1229.9
2120BS39128111,9928.9
3130BS30130108,2028.0
4211BS43126104,0729.4
5212BS34129101,4828.4
6213BS23133961527.0
7221BS33127981928.8
8222BS28130942227.9
9223BS22132920627.2
10231BS23133912227.0
11232BS22132907327.1
12233BS18134888326.7
Publisher’s Note: MDPI stays neutral with regard to jurisdictional claims in published maps and institutional affiliations.

