1. Introduction
Power consumption costs airports as much as 15% of expenses for operating activities [
1]. Over 75% of the power is consumed by the terminal buildings [
2]. The remainder is the maintaining of the navigation infrastructure, runway lighting, taxiways, aprons, etc. Inside the terminals, there are cooling, lighting and air ventilation facilities as well as information and technical infrastructure for passenger service. This article will focus on analyzing the operation of equipment that relates to passenger service.
Power consumption is at every stage of passenger and baggage handling. The passenger completes the transport process at the check-in, security screening, documents control, gate. The highest power consumption is at the security checkpoint, where each security lane is equipped with electrical devices like X-ray, explosive trace detectors, metal detectors, body scanners, etc. There are also supporting devices that control the flow of baggage like belt conveyors and roller conveyors that are controlled by electric motors or manually.
The primary purpose of the system is to scan the passenger and items in the passenger’s possession. This screening is designed to identify items that could lead to an act of unlawful interference by a passenger. The screening lane must also have an adequate level of performance [
3]. The airport operator must ensure that the screening system is efficient enough to allow passengers to arrive at the gate on time. This system is usually designed to be redundant and is managed by the scheduling of security line operations.
The manner in which screening is conducted and the passenger space is important on Level of Service (LoS) [
4,
5,
6]. LoS is directly related to the airport’s non-aeronautical revenue. The higher the LOS the higher the revenue. According to [
7], 40–60% of airport revenues are from non-aeronautical activities.
Performance and LoS have already been considered in other research work. There, however, no one considered the need for sustainable development. The only consideration was passenger satisfaction and quick processing time.
This paper proposes a method that also considers power consumption when optimizing the security screening process. This is to prevent taking actions that will be negative for the environment. This will ensure the sustainability of passenger service at airports. This has not been considered so far.
The article consists of the following parts as follows.
Section 2 indicates a research gap that will be filled by the model presented in
Section 3.
Section 4 presents the validation of the model using a selected real system as an example and discusses the results obtained.
Section 5 presents the conclusion of the paper.
2. State of the Art
The importance of air transport management in terms of power consumption has already been noted in the scientific literature. An excellent literature review on this topic was conducted in [
2]. Analyzing this review and extending it with recent research papers, the first conclusion is that there is a research gap in the field of terminal passenger handling. Particular interest should be placed on power modelling and simulation, since that is what this article is about. Here, it is important to note that the analyses are macroscopic. They apply to entire airport terminal buildings. As such, they focus primarily on HVAC (heating, ventilation, air conditioning) systems. For example, a thermal simulation for Greek airports was carried out by [
8], or in China [
9]. The simulation predicted up to 35% of potential gains.
Some of the papers involve focused research on selected topics. Ma et al. [
10] established the relationship between indoor airflow and interior space to improve indoor comfort. Parker et al. [
11] reduced the carbon footprint by improving the envelope of a glazed roof at a selected airport. Gowresuunker et al. [
12] analyzed the efficiency of displacement ventilation for an airport terminal.
Selected articles are directed towards the prediction of power consumption of airport terminals. In this case, Chen [
13] used an unbiased gray Markov model. Huang et al. [
14] on the other hand relied on neural networks. Fan et al. [
15] built a model based on probability density functions.
There are only 2 papers in the literature that relate their subject matter to terminal operations. However, they are not directly related to the analysis of the power consumption of the operating systems. Mambo et al. [
16] noted that the internal environment can be dynamically controlled according to flight schedules. This can give up to 25% benefits. In [
17,
18], the ability to dynamically manage thermal comfort and lighting for different terminal spaces was similarly noted.
Summarizing this part of the review, it is clear that the current research gap in the literature is the lack of consideration of power consumption in airport handling processes. So far, other aspects have only been considered. An extensive literature review on passenger service process modelling is presented in [
19]. It takes into account scientific papers published until 2013. The review found that the main factors were process efficiency and quality of passenger service. Until now, the approach has not changed significantly. Recent work indicates that these factors are still a major interest for researchers. For example, a stochastic passenger boarding model was developed to improve the efficiency of the process [
20]. Additionally, uncertainty is also considered when planning airport terminal operations [
21]. The goal is to continue to focus on handling optimization processes [
22]. To support process performance, proper resource allocation is often considered [
23,
24]. The current challenge is to align legacy solutions with the safety standards associated with COVID-19 [
25].
However, the new solutions developed do not take into account the indicator related to power consumption. It is not compared whether the new proposals are environmentally friendly. In this article, this gap will be filled. The aim of the paper is to develop a model that allows checking different system configurations also in terms of power consumption.
3. Methodology
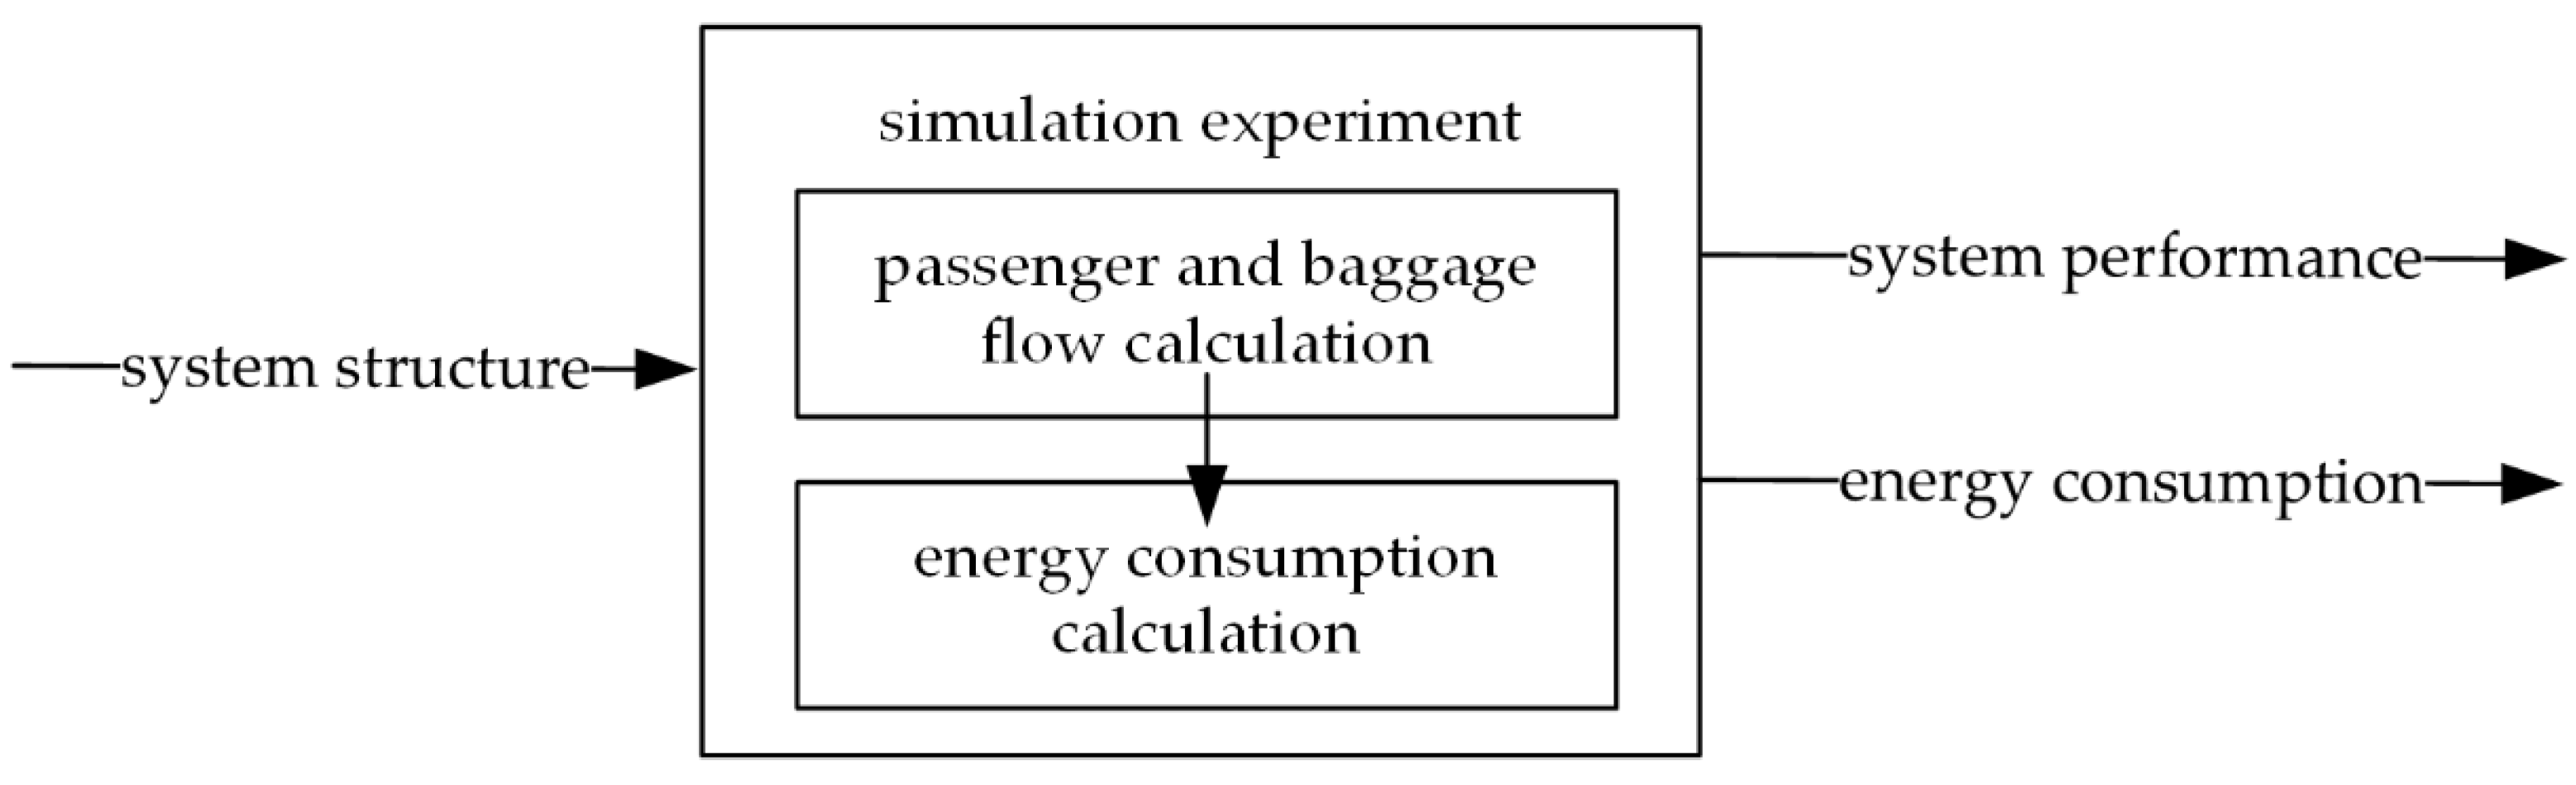
To be able to evaluate different system configurations and different output variables, a discrete event simulation model is proposed. The model was developed using the FlexSim environment. A model was built that represents the known screening of passengers and baggage methods [
26,
27]. The concept of the model is shown in
Figure 1. The user must configure the structure of the system as an input variable. Then the simulation model calculates the flow of passengers and their items through the system. Based on this flow, in parallel, the operational state of the devices is checked and the power consumption is counted. Performance and power consumption are given as output variables. The individual components of the model are described in detail in
Section 3.1 and
Section 3.2.
3.1. System Structure
To identify the basic lane features of the analyzed system, the elementary notation is introduced (1).
The TYPE parameter specifies the type of security lane. It can be set to an “F” value, which specifies a Fast Lane for business class, or an “S” value, which specifies a Standard Lane for other passengers. This parameter is necessary because service times vary on these lanes. This is due to the number of items held by businesses and other passengers. The LANES parameter specifies the complexity of the lane. It can be set to either 1 or 2. A value of 1 indicates that it is a single lane and 2 indicates that it is a double lane. This parameter is also important because it determines the number of passenger screening devices. Each individual lane is equipped with an X-ray device for baggage screening, an Explosives Trace Detector (ETD) for passenger and baggage screening and a WTMD (Walk Through Metal Detector) for passenger screening. However, if it is a double lane, then only one WTMD will continue. If there were 2 single lanes side by side, then there would be 2 WTMD devices. The difference between 2 single lanes and 1 double lane is shown in
Figure 2.
The IN parameter indicates the number of places in the passenger preparation area. In this area, the passenger transfers his/her baggage and all items in his/her possession for screening. The OUT parameter indicates the number of places in the collection area where the passenger picks up their items after inspection. Overall, the IN and OUT parameters determine the size of the screening lane.
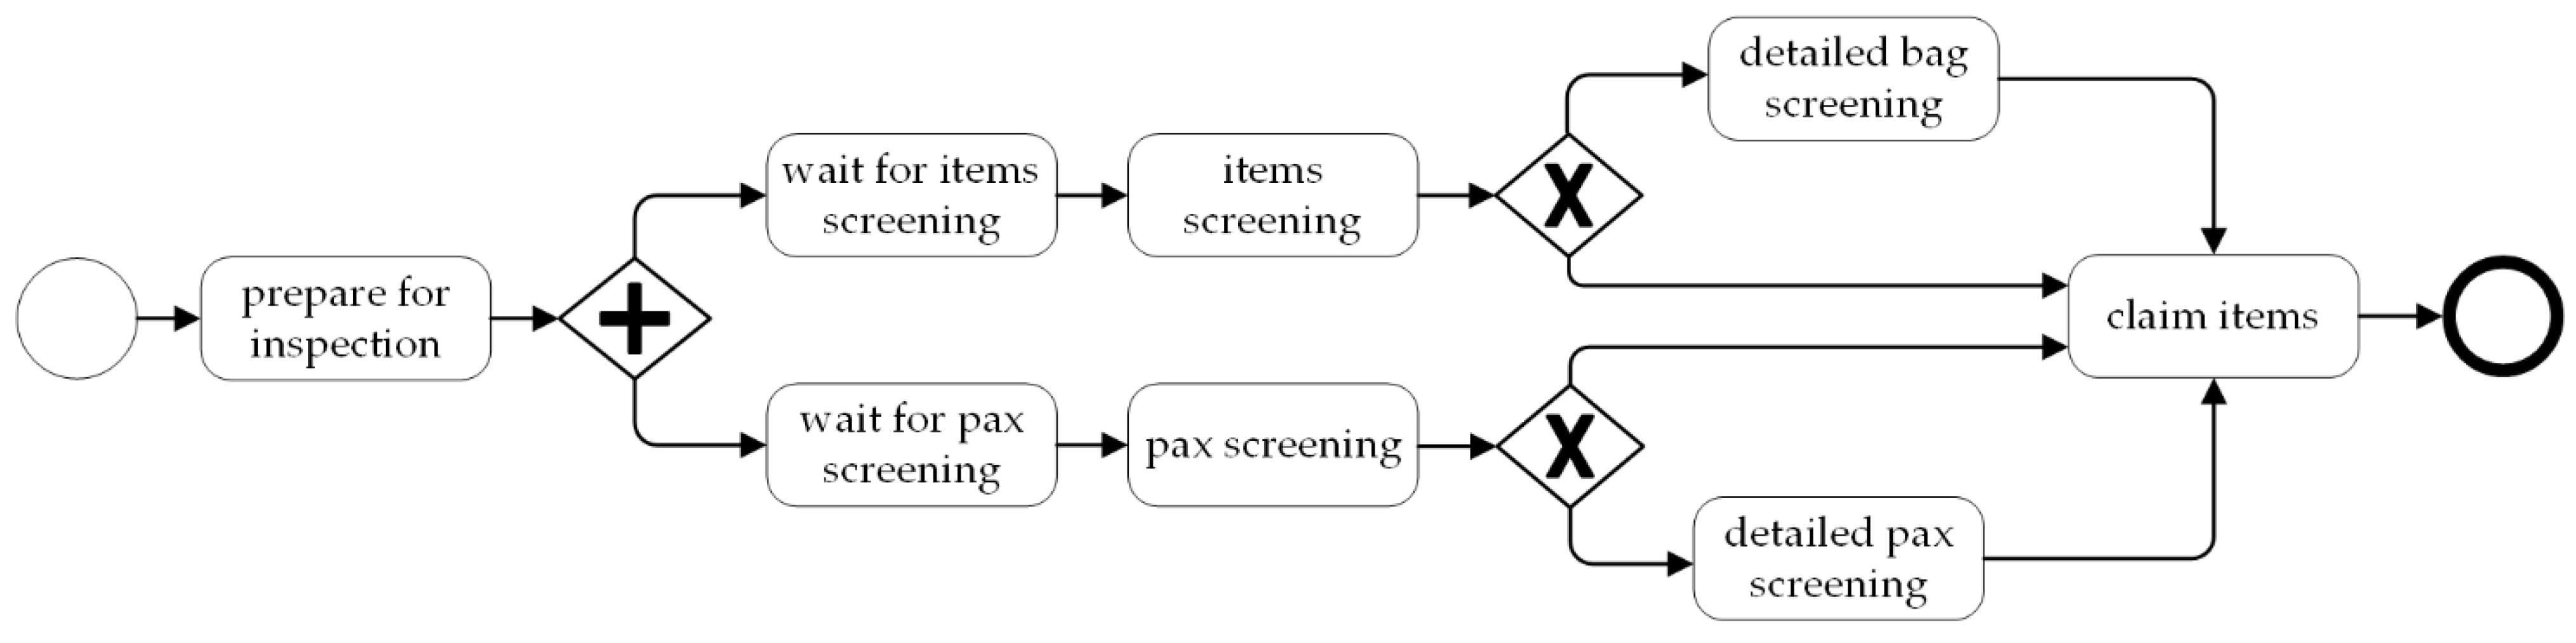
Other inputs are directly related to the flow of passengers and items through the simulation model. As soon as the number of passengers in the preparation area is less than the IN parameter, a new passenger is generated. The process of its handling is carried out as shown in
Figure 3.
Passengers and baggage move through the system in a FIFO (First In First Out) strategy. In the first stage, preparation for inspection is carried out. Passenger transfers items to be X-rayed. The time it takes is given by the random variable tpr. After this, the passenger and objects await inspection on their flow paths. Here the time is not set by the user. It is derived from the current state of the simulation experiment. To screen the waiting objects, the X-ray must be free from screening other objects. To screen a waiting passenger, WTMD must be free from screening other passengers. Additionally, the current number of passengers in the items claim area must be less than the OUT parameter. So, as a result of the experiment, the simulation model counts passenger waiting time tqp and items waiting time tqi. Once this is in place, passenger screening is conducted according to the time specified by the random variable tsp. The same is true for items and the time of their inspection is determined by the random variable tsi.
The probability that a screened passenger must have an additional screening will be designated as Ppe. The probability that it will be an ETD screening is Ppetd. The probability that a manual inspection is required is 1-Ppetd. The time for the ETD to screen the passenger is given by the random variable tpetd. The time of manual passenger screening is given by the variable tpm. The probability that a screened items must have an additional screening will be designated as Pie. The probability that it will be an ETD screening is Pietd. The probability that a manual inspection is required is 1-Pietd. The time for the ETD to screen the items is given by the random variable tietd. The time of manual passenger screening is given by the variable tim.
As soon as the passenger and luggage are screened, the process of collecting the items begins. The duration is described by a random variable
tic. The passenger is then removed from the system. The total service time for a given passenger is described by Equation (2).
All of the aforementioned random variables are initially described in the model by the distributions shown later in Chapter 3, where the validation of the model on a case example is presented. The model supports the use of probability distributions: Beta, Cauchy, Erlang, Exponential, Gamma, Logistic, Log-Normal, Normal, Pearson, Poisson, Uniform and Weibull.
3.2. Output Data
The simulation model provides two output variables. These are crucial from a system management perspective. The first (SP) provides information about system performance. The second output variable (WSC) indicates the power consumption of the system. The simulation model implements a Monte-Carlo experiment to obtain the expected value of the results. This means that the experiment is repeated many times. Thus, the output is counted as the average value of SP
i and WSC
i indices according to Formulas (3) and (4).
Each iteration of the simulation model determines the parameter SPi, which represents the number of passengers served in one hour at the analyzed station. This is counted according to an algorithm (
Figure 4a) that, in a loop, waits for a passenger service completion event and adds it to the current value of the SP
i indicator. The loop ends when one hour (3600 s) of the simulation experiment has passed.
Another loop (
Figure 4b) analyzes the current power consumption and adds it to the total consumption for that
i-th iteration of the computer simulation WSCi. This is performed at a 1 s interval. Every 1 s, the algorithm checks the current status of the devices. When they are under workload, their one-second current consumption is calculated and added to the total WSCi value. The loop ends when the 3600 s (1 h) value of the simulation is reached.
During the real system investigation, different states were defined for the devices used in the security screening. The X-ray may be in a waiting state for inspection when no further objects are transferred to the device and it is already available. The power consumption of the device in this state is indicated as PXi. When moving items to and from the X-ray when the X-ray is not screening, the current consumption is indicated as PXm. The last state of the X-ray machine indicates that objects are being x-rayed. The current consumption is indicated as PXs. The power consumption of the WTMD is independent of the idle or screening state. Thus, only one state is defined, and its current consumption is denoted as PW. The next device with power consumption is the ETD. Here the difference is again significant depending on the state of the device. In the idle state, the current consumption of the ETD will be as PEi. In the overexposed state, the current consumption of the ETD will be as PEs.
For each device, the power consumption can be calculated for given time intervals as
W =
P∙∆
t. As already mentioned in this model, second intervals are considered, and the total power consumption of a given device state will be the sum of all calculations. Totally for each iteration of the simulation experiment, the entire screening lane consumes power according to (5).
4. Results and Discussion
In this section, validation of the proposed model is presented. The three screening lane configurations are examined. They are based on data from the real system (EPKT, KTW Airport, Poland). The first configuration |F|1|8|8| is an 8 places single fast lane. The second configuration |S|1|8|8| is an 8 places single standard lane. The third configuration |S|2|8|8| is 8 places double standard lane. Simulation experiments were conducted for various conditions as follows:
the maximum workload with a comparison of different devices (Scenario 1),
the variable workload for selected devices (Scenario 2).
For the simulation model, data were collected for more than 100 passengers for each lane configuration. Based on this, the input data of the simulation model were estimated and entered (
Table 1). Configuration |S|1|8|8| and |S|2|8|8|represent the standard lane and the basic characteristics are the same. However, some of the characteristics are different for the fast lane |F|1|8|8| because it serves passengers of a selected type (usually only business passengers).
To validate the proper operation of the model, a two-sample Kolmogorov–Smirnov test was conducted. This is the method used to validate event-based simulation models [
28]. Validation was performed on a sample of 100 real system data for configurations |S|1|8|8|, |S|2|8|8| and |F|1|8|8|. The passenger processing time
ts (2) in the system was compared with simulation. The value of the test statistic was less than the critical value of 1.92. This means that the model gives results that are consistent with the real system.
4.1. Scenario 1: Maximum Workload with a Comparison of Different Devices
Due to the development of technology, new equipment is being used for screening at airports. During the research conducted at EPKT, it was possible to test three different X-ray machines. The first X-ray device for which the study was conducted was the HI-SCAN 6040i single-generator scanner (hereafter designated SH1). This is a basic device in which an object is screened by a single beam of X-ray. The second popular baggage screening device that was studied is the HI-SCAN 6040aTiX scanner (with the 2018 version hereafter designated SH2 and the 2020 version hereafter designated SH3). In this case, 2 or more X-ray beams cross the object being moved during an inspection.
Different models of equipment are used at airports, depending on the needs and financial capabilities of the airport. Multi-generator X-ray machines can be additionally equipped with EDS (Explosive Detection System) that automatically detects explosives.
According to the adopted model (
Section 3.2), tests were conducted on the real system and the data needed for further analysis was determined. The data are presented in
Table 2.
To be complete, all screening lines were also equipped with other passenger and baggage screening devices. One of the most popular solutions for passenger screening at airports is the use of a walk-through metal detector (WTMD), which uses the electromagnetic induction effect. The device detects metal objects concealed on the body of the controlled person. Most of the objects, which may be considered as weapons and therefore are not allowed for air transport, are made of different types of metals. Thus, their elimination is of great importance in the context of transport safety. Given the possibility of making dangerous articles prohibited for carriage out of non-metallic materials, WTMD screening is supported by hand search and explosives trace detection (ETD). Hand search and ETD is also used in baggage screening at the security checkpoint. However, only ETD uses a device that requires power consumption. ETD is based on the ion mobility spectrometry measurement method. It is a device that allows detecting the presence in the baggage or on the body of a passenger of a wide range of explosives that pose a real threat to air operations. In practice, the control carried out by this device not only prevents attempts to bring explosives on board the aircraft, but also has a preventive effect by indicating the person who only had physical contact with dangerous substances.
In this study, only one type of WTMD and ETD was available for each screening lane configuration, so the necessary data, according to
Section 3.2, is presented in
Table 3.
Monte-Carlo simulation (100 replicate experiments) was performed for the adopted system configurations. The results are summarized in
Table 4. The tests were conducted for the full workload of the screening line so that the performance of the system could also be determined. Since each system configuration yields a different performance, the results were converted to power consumption per passenger. This will allow for a simpler comparison of results. Furthermore, data were collected for different simulation experiment durations of 1, 12 and 24 h. This may be useful for those stakeholders interested in the results for which dynamic or continuous use of lanes may have different operation durations.
The results obtained gave a lot of important conclusions. First, note that regardless of the configuration of the security control lane, SH1 always yields lower power consumption per passenger than SH2 and SH3. This is up to 3 times less power consumption. It is known from other literature sources that single-generator devices like SH1 are rated as inferior for safety assurance. So, the dilemma arises: is increased safety or lower power consumption important? This has never been analyzed from this point of view in the scientific literature. The model proposed in this paper therefore opens a new field of discussion on this topic for future research work. It may turn out that an operator with high skills provides an adequate level of safety with SH1 and the power consumption of the system can be reduced. This will be the subject of future research.
Looking at the results in more detail, interesting insights for the process manager can be seen. For the SH2 device and a single lane, the highest value of power consumption with a low system performance of about 139 pax/h can be observed. The power consumption at the determined system performance is 12.93 Wh/pax. For a double lane, the power consumption at a performance of 300 pax/h is 12.37 Wh/pax. At a double lane, the gaps between passengers passing through the WTMD gates are eliminated, which results in a continuous service stream and, consequently, a lower power consumption value per passenger. In the case of the fast lane system configuration with the performance of 169 pax/h, the power consumption per passenger is 11.13 Wh/pax. In the case of the fast lane, the reduction in power consumption is influenced by the passengers’ behaviour. Fast lane passengers are usually business customers who do not have many pieces of luggage and have full knowledge about the security control process. For stations equipped with SH3, power consumption is slightly lower than for SH2. Regardless of the manager’s choice of screening device (SH1, SH2, SH3), it is more advantageous from a power consumption perspective to configure the screening checkpoint based on dual stations supported by a fast track. It is crucial to ensure a continuous stream of passenger requests. However, because the volume of the service stream varies throughout the day, an extended analysis was performed. The variable value of passengers handled per hour and its impact on power consumption was checked (see
Section 4.2).
4.2. Scenario 2: Variable Workload for Selected X-ray
It is crucial for the security control system manager to plan the work schedule in order to achieve a uniform workload for security control lanes. The number of passengers must also be high enough to maximize the operational performance of the screening lane. According to the conducted research (
Section 4.1), baggage screening equipment in an idle state consumes more than 50% of the power it uses during the screening process. When non-uniform security lanes workloads are obtained, the power consumption per passenger for each lane varies.
A sensitivity analysis of the security lane to a change in the intensity of passenger reports to the system was performed. The study was conducted for lane configurations that were equipped with SH2 X-ray machines selected as the most frequently used in EPKT. The power consumption per passenger as a function of the number of passengers screened on the security lane per hour is shown in
Figure 5. The results for the double-lane configuration were split into single lanes to be comparable to the other configurations.
It should be noted that the single screening lane has the highest power consumption per passenger and the double lane the lowest. The power consumption of the single lane is also worse (about 10 passengers per hour) than the double lane configuration. The fast lane has the highest performance (approximately 170PAX/h), but the power consumption per passenger is in the middle between the single and double lane configuration. Assuming the recommended IATA screening performance level [
29] of 120 pax/h (for single lane and fast track) and 240 pax/h (for double lane), the power consumption per passenger is:
14.56 Wh/pax for a single lane,
12.25 Wh/pax for a double lane,
13.83 Wh/pax for the fast lane.
The difference in power consumption at an airport with approximately 2 million passengers for which the screening checkpoint is based on double lanes compared to single lanes can be less by 4614 kWh/year. These results show that the scale of the issue is high. The proposed model that calculates power consumption can be extremely important for the process manager. Dynamic management of the number of open lanes per hour with power consumption determination can contribute to significant savings and sustainability of air transport.
5. Conclusions
The issue of managing a security screening system from the perspective of power consumption has not been addressed in the literature to date. This study shows the impact of passenger and baggage screening equipment types on power consumption per passenger processed. Newer devices have higher power consumption but from a procedural point of view more operational steps have to be performed (e.g., manual control). The simulation model made it possible to analyze the impact of operational decisions made by the airport manager on the amount (which translates into costs) of power consumption. The most advantageous variant of security control from the point of view of power consumption is a double stand. However, crucial from the point of view of its use is the need to ensure a high number of passengers reaching its capacity.
Further work will be carried out in the direction of developing a multi-criteria evaluation method for the screening system. On the one hand, the key parameters for evaluating a screening process are: performance, passenger service level, electricity consumption level per passenger but there is also a second aspect, i.e., the probability of carrying a prohibited item into the security restricted area of the airport. Older generation scanners consume less power; however, they do not have the tools to support the operator in the evaluation of the scanned image.
Author Contributions
Conceptualization, A.K. and T.K.; methodology, A.K., T.K. and P.U.; software, T.K.; validation, A.K., T.K. and P.U.; formal analysis, A.K.; investigation, P.U.; resources, A.K., T.K. and P.U.; data curation, A.K., T.K. and P.U.; writing—original draft preparation, A.K., T.K. and P.U.; writing—review and editing, A.K., T.K. and P.U.; visualization, T.K. All authors have read and agreed to the published version of the manuscript.
Funding
This research received no external funding.
Data Availability Statement
Data are contained within the article.
Conflicts of Interest
The authors declare no conflict of interest.
References
- Airports. Available online: https://snopud.bizenergyadvisor.com/article/airports (accessed on 16 September 2021).
- Ortega Alba, S.; Manana, M. Energy Research in Airports: A Review. Energies 2016, 9, 349. [Google Scholar] [CrossRef] [Green Version]
- Kierzkowski, A.; Kisiel, T. Simulation model of security control lane operation in the state of the COVID-19 epidemic. J. Air Transp. Manag. 2020, 88, 2–10. [Google Scholar] [CrossRef] [PubMed]
- Kierzkowski, A.; Kisiel, T.; Pawlak, M. A Method for Passenger Level of Service Estimation at the Airport Landside. In Contemporary Complex Systems and Their Dependability, Proceedings of the Thirteenth International Conference on Dependability and Complex Systems DepCoS-RELCOMEX, Brunów, Poland, 2–6 July 2018; Zamojski, W., Mazurkiewicz, J., Sugier, J., Walkowiak, T., Kacprzyk, J., Eds.; Advances in Intelligent Systems and Computing; Springer: Berlin/Heidelberg, Germany, 2019; Volume 761, pp. 1–6. [Google Scholar] [CrossRef]
- Correia, A.R.; Wirasinghe, S.C.; De Barros, A.G. Overall level of service measures for airport passenger terminals. Transp. Res. Part A 2008, 42, 330–346. [Google Scholar] [CrossRef]
- De Barros, A.G.; Somasundaraswaran, A.; Wirasinghe, S.C. Evaluation of level of service for transfer passengers at airports. J. Air Transp. Manag. 2007, 13, 293–298. [Google Scholar] [CrossRef]
- ACI. Annual Report 2016; Airports Council International: Montreal, QC, Canada, 2017. [Google Scholar]
- Balaras, C.A.; Dascalaki, E.; Gaglia, A.; Droutsa, K. Energy conservation potential, HVAC installations and operational issues in Hellenic airports. Energy Build. 2003, 35, 1105–1120. [Google Scholar] [CrossRef]
- Liu, J.; Yu, N.; Lei, B.; Rong, X.; Yang, L. Research on indoor environment for the terminal 1 of Chengdu Shuangliu international airport. In Proceedings of the 11th International IBPSA Conference, Glasgow, UK, 27–30 July 2009. [Google Scholar]
- Ma, J.S.; Liu, X.T.; Zhuang, D.M.; Wang, S.G. CFD-based design of the natural ventilation system of the traffic center of T3 Beijing International Airport. Adv. Mater. Res. 2011, 291–294, 3292–3295. [Google Scholar] [CrossRef]
- Parker, J.; Cropper, P.; Shao, L. Using building simulation to evaluate low carbon refurbishment options for airport buildings. In Proceedings of the 12th Conference of International Building Performance Simulation Association, Sydney, Australia, 14–16 November 2011. [Google Scholar]
- Gowreesunker, B.L.; Tassou, S.A.; Kolokotroni, M. Coupled TRNSYS-CFD simulations evaluating the performance of PCM plate heat exchangers in an airport terminal building displacement conditioning system. Build. Environ. 2013, 65, 32–145. [Google Scholar] [CrossRef] [Green Version]
- Chen, J.; Xie, K. A prediction model based on unbiased grey Markov for airport energy consumption prediction. In Proceedings of the 2013 Chinese Automation Congress (CAC), Changsha, China, 7–8 November 2013. [Google Scholar]
- Huang, H.; Chen, L. A new model predictive control scheme for energy and cost saving in commercial buildings: An airport terminal building study. Build. Environ. 2015, 89, 203–216. [Google Scholar] [CrossRef]
- Fan, B.; Jin, X.; Du, Z. Optimal control strategies for multi-chiller system based on probability density distribution of cooling load ratio. Energy Build. 2011, 43, 2813–2821. [Google Scholar] [CrossRef]
- Mambo, A.D.; Efthekhari, M.; Thomas, S.; Steffen, T. Evaluation of Indoor Environment System Performance for Airport Buildings. Int. J. Sustain. Green Energy 2015, 4, 73–84. [Google Scholar]
- Mambo, A.D.; Efthekhari, M.; Thomas, S.; Steffen, T. Fuzzy supervisory control strategies to minimise energy use of airport terminal buildings. In Proceedings of the 18th International Conference on Automation and Computing (ICAC), Loughborough, UK, 7–8 September 2012. [Google Scholar]
- Mambo, A.D.; Efthekhari, M.; Thomas, S.; Steffen, T. Designing an occupancy flow-based controller for airport terminals. Build. Serv. Eng. Res. Technol. 2015, 36, 51–66. [Google Scholar] [CrossRef] [Green Version]
- Wu, P.P.-Y.; Mengersen, K. A review of models and model usage scenarios for an airport complex system. Transp. Res. Part A 2013, 47, 124–140. [Google Scholar]
- Schultz, M. Implementation and application of a stochastic aircraft boarding model. Transp. Res. Part C 2017, 90, 334–349. [Google Scholar] [CrossRef]
- Scala, P.; Mujica Mota, M.; Cheng-Lung, W.; Delahaye, D. An optimization–simulation closed-loop feedback framework for modeling the airport capacity management problem under uncertainty. Transp. Res. Part C 2021, 124, 1–19. [Google Scholar] [CrossRef]
- Mujica, M.; Scala, P.; Delahaye, D. Improving Airport Performance through a Model-based and Optimization Approach. In Applied Simulation and Optimization 2; Mota, M.M., De La Mota, I.F., Eds.; Springer: Cham, Switzerland, 2017. [Google Scholar] [CrossRef] [Green Version]
- Skorupski, J.; Grabarek, I.; Kwasiborska, A.; Czyżo, S. Assessing the suitability of airport ground handling agents. J. Air Transp. Manag. 2020, 83, 1–10. [Google Scholar] [CrossRef]
- Skorupski, J.; Żarów, P. Dynamic management of aircraft stand allocation. J. Air Transp. Manag. 2021, 90, 1–14. [Google Scholar] [CrossRef]
- Schultz, M.; Evler, J.; Asadi, E.; Preis, H.; Fricke, H.; Cheng-Lung, W. Future aircraft turnaround operations considering post-pandemic requirements. J. Air Transp. Manag. 2020, 89, 1–11. [Google Scholar] [CrossRef] [PubMed]
- Regulation (EC) No 300/2008 of the European Parliament and of the Council of 11 March 2008 on Common Rules in the Field of Civil Aviation Security and Repealing Regulation (EC) No 2320/2002 (Text with EEA Relevance). Available online: https://eur-lex.europa.eu/legal-content/EN/ALL/?uri=CELEX%3A32008R0300 (accessed on 15 October 2021).
- Commission Implementing Regulation (EU) 2015/1998 of 5 November 2015 Laying down Detailed Measures for the Implementation of the Common Basic Standards on Aviation Security. Available online: https://eur-lex.europa.eu/legal-content/pl/TXT/?uri=CELEX%3A32015R1998 (accessed on 15 October 2021).
- Belli, F.; Beyazit, M.; Güler, N. Event-Oriented, Model-Based GUI Testing and Reliability Assessment—Approach and Case Study. Adv. Comput. 2012, 85, 277–326. [Google Scholar]
- IATA. Airport Development Reference Manual, 11th ed.; International Air Transport Association: Montreal, QC, Canada, 2019. [Google Scholar]
| Publisher’s Note: MDPI stays neutral with regard to jurisdictional claims in published maps and institutional affiliations. |
© 2021 by the authors. Licensee MDPI, Basel, Switzerland. This article is an open access article distributed under the terms and conditions of the Creative Commons Attribution (CC BY) license (https://creativecommons.org/licenses/by/4.0/).


