Article

Analysis of Methodology for Scaling up Building Retrofits: Is There a Role for Virtual Energy Audits?—A First Step in Hawai’i, USA

1
Hawai’i Natural Energy Institute, University of Hawai’i, 1680 East-West Road, POST 109, Honolulu, HI 96822, USA
2
Center of Excellence for Smart Building and Community Design, University of Hawai’i Sea Grant College Program, 2525 Correa Road, HIG 238, Honolulu, HI 96822, USA
3
Environmental Research and Design Laboratory, University of Hawai’i School of Architecture, 2410 Campus Road, Honolulu, HI 96822, USA
*
Author to whom correspondence should be addressed.
Energies 2021, 14(18), 5914; https://doi.org/10.3390/en14185914
Submission received: 1 August 2021 / Revised: 9 September 2021 / Accepted: 13 September 2021 / Published: 17 September 2021

Abstract

:
Energy audits are a time-consuming and expensive initial step in the building retrofit process. Virtual energy audits purport to be an alternative that remotely identifies energy efficiency measures (EEMs) that may reduce electricity consumption and offset operational costs to businesses operating during and after the COVID-19 pandemic. This case study reviews virtual energy audits as a means to benchmark energy use and estimate cost savings from future EEMs. A novel feature was the estimation of energy costs associated with increasing ventilation to improve indoor air quality. The authors analyzed ten virtual energy audits performed in Honolulu, Hawai’i, over a two-week period that used existing building information and electricity use data to estimate a potential 9% to 41% annual electricity use reduction per building and a 24 MWh to 1195 MWh reduction, respectively. This paper makes a significant contribution through its assessment of virtual energy audits as a step beyond benchmarking, which has merit as an educational tool to motivate business owners to reduce energy use and improve indoor air quality. Further evaluation and improvements are suggested to study how often the virtual energy audits instigate action, how they compare with in-person audits, and their potential for use at a large scale.

Graphical Abstract

1. Introduction

The Healthy and Resilient Buildings Initiative, “Initiative”, was introduced by the City and County of Honolulu, Hawai’i, USA (Honolulu) in December of 2020 to offer free energy assessments vis-à-vis virtual energy audits to commercial building owners with revenue-grade smart meters [1]. The objective was to provide an immediate pathway for relief to businesses from the COVID-19 pandemic by using virtual energy audits to quickly identify operational energy savings from potential energy efficiency measures (EEMs) and indoor air quality improvements through potential increased air flow. The outcomes of each virtual energy audit were summarized in a report to participating building owners and outlined potential energy efficiency and resiliency measures to be further investigated for deployment. The objective of this paper is to demonstrate the large-scale potential to conduct virtual energy audits and inform businesses of potential energy cost savings and costs of increased ventilation rates when considering economic, operational, and air ventilation factors.

The Initiative as a COVID-19 Response
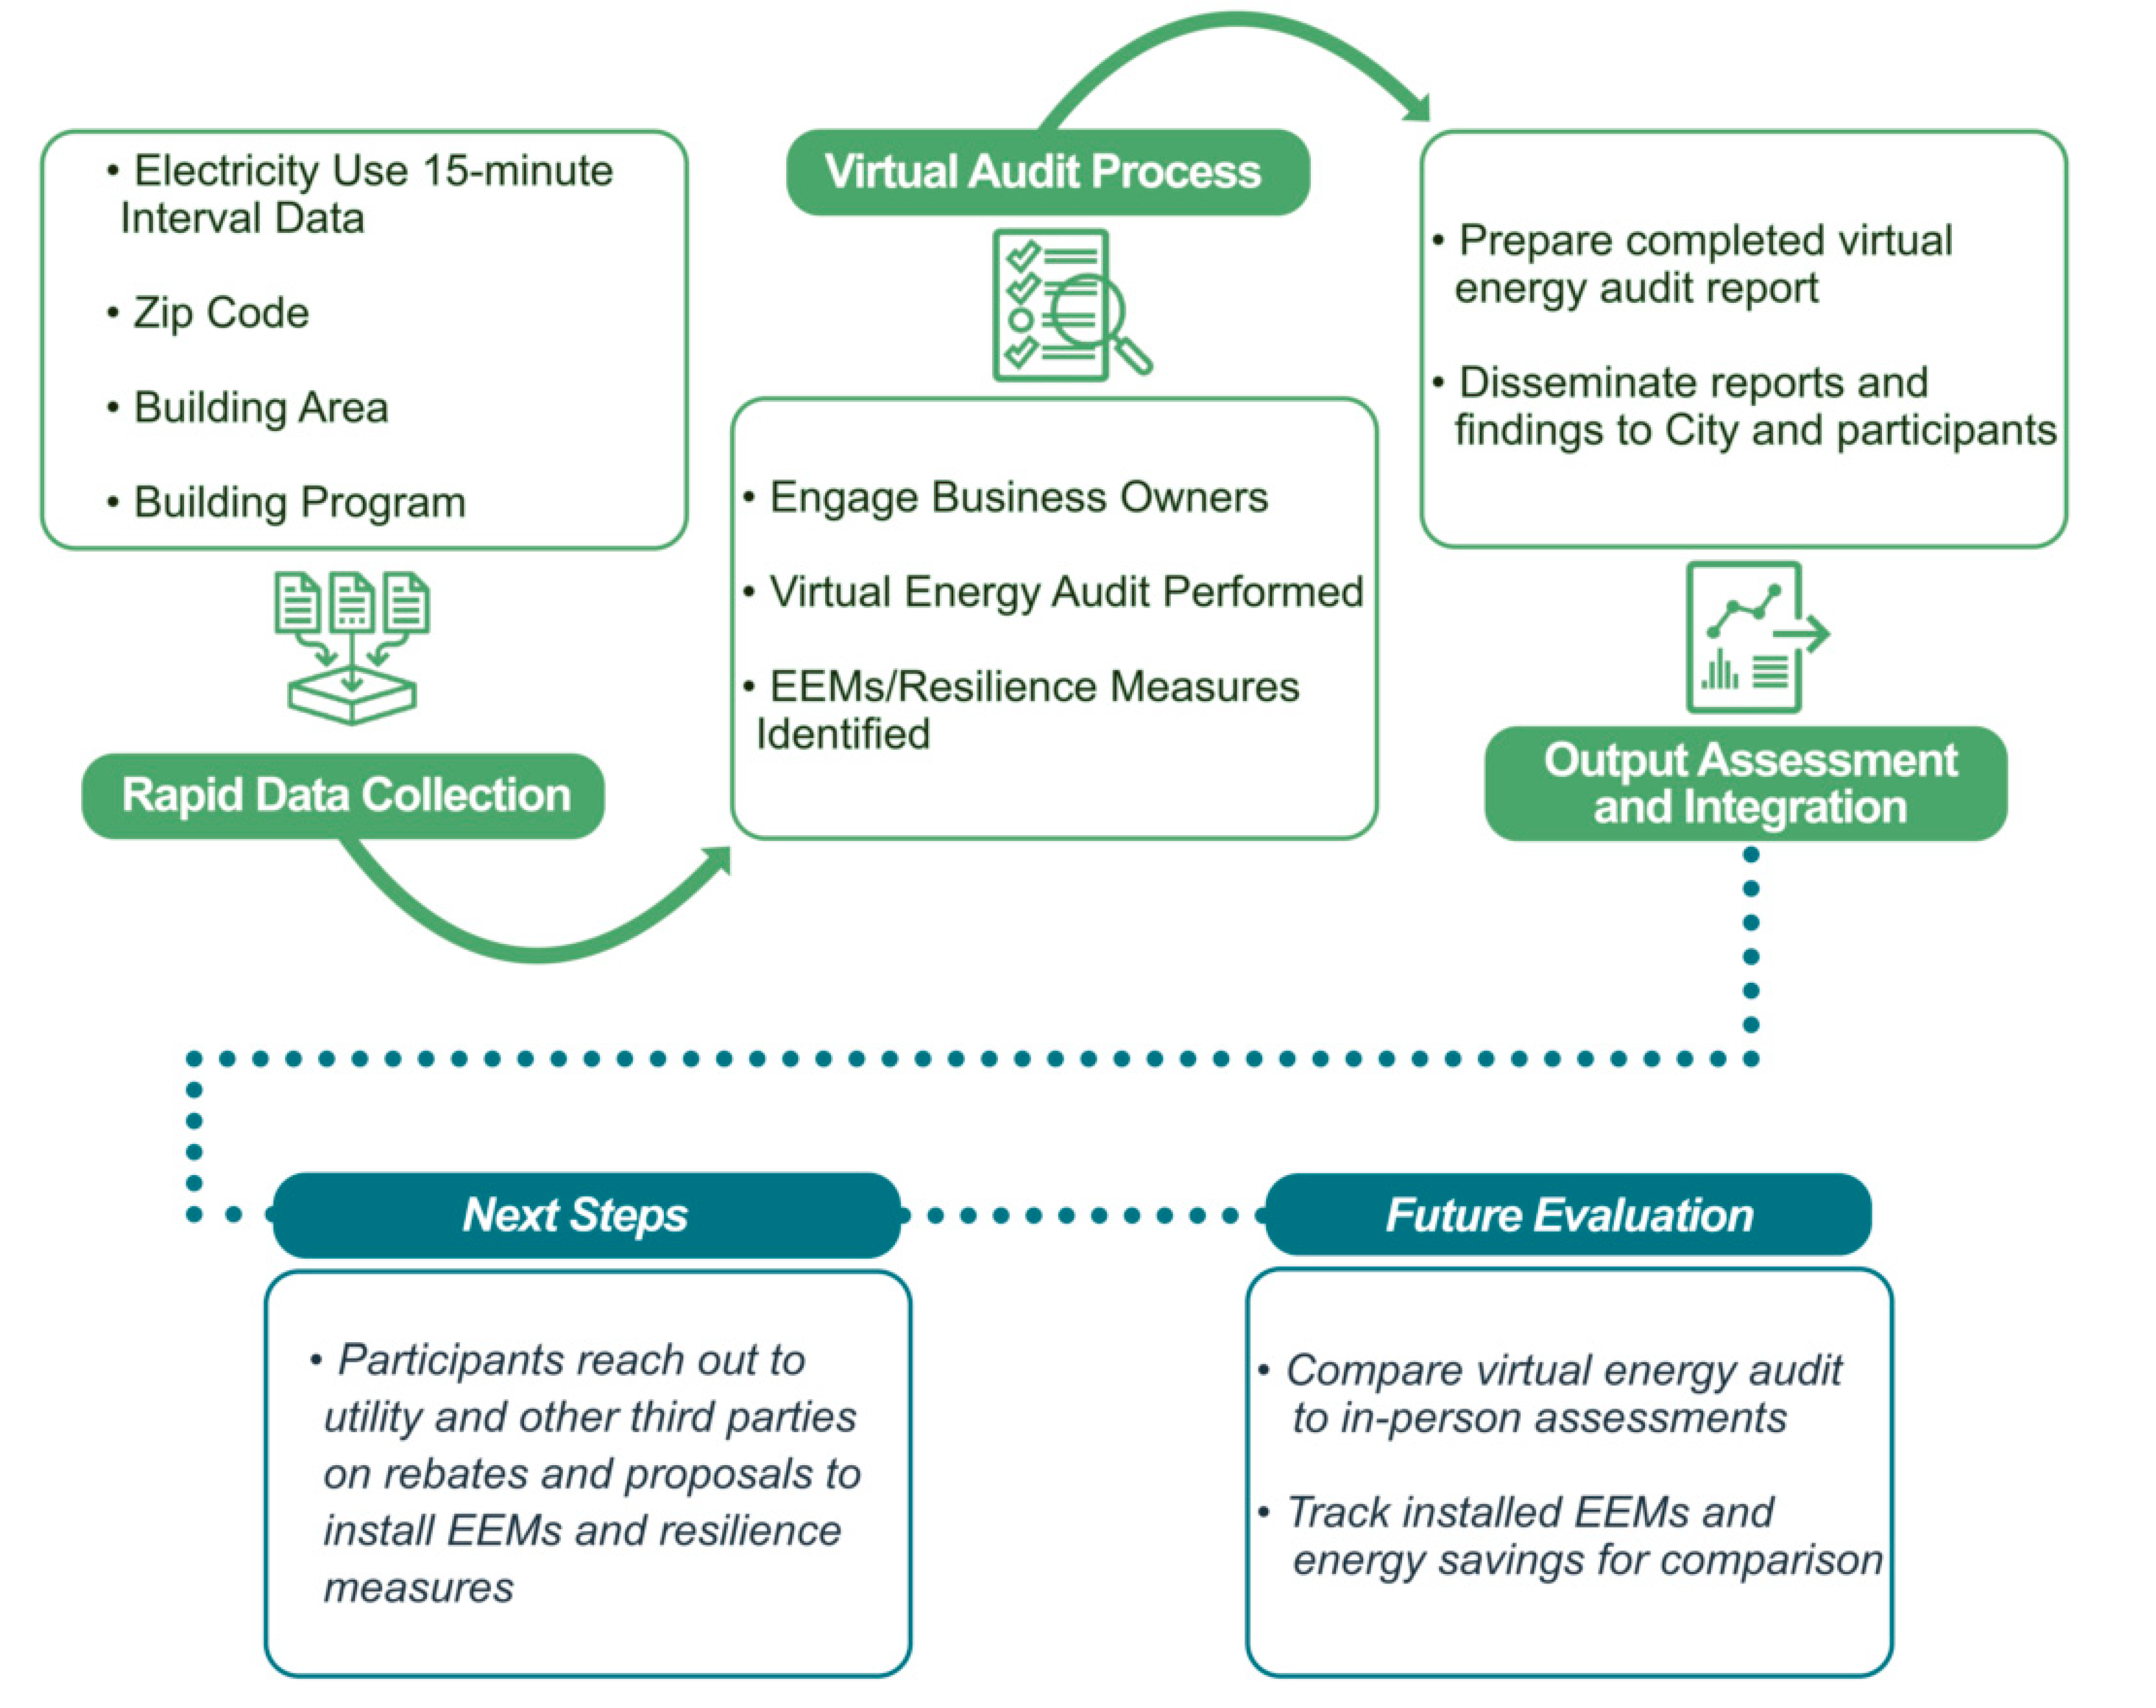
In Honolulu, the Office of Climate Change, Sustainability and Resiliency determined that the adverse impact of the Severe Acute Respiratory Syndrome Coronavirus-2 (SARS-CoV-2) (referred herein as COVID-19) pandemic, had created an urgent need to reduce operating costs to businesses through changes to the built environment while also addressing modifications to achieve healthy and safe operations. Hawai’i’s unemployment rate increased from a little over 2% prior to the pandemic to more than 20% as businesses were closed, at least temporarily, particularly among businesses in the tourism industry [2]. Reducing energy demand by increasing energy efficiency was incorporated as the fifth strategy of Honolulu’s 2020–2025 One Climate One Oahu Climate Action Plan (CAP), with the Initiative specifically identified as a principal action (Action 5.4) [3]. The Honolulu City Council adopted the CAP by unanimous vote in June of 2021 to guide Oahu’s greenhouse emissions reductions and address the challenges to businesses affected by COVID-19.
The Initiative targeted commercial building owners for the provision of virtual energy audits to quickly establish baseline energy use, benchmark against peer buildings, and identify potential EEMs and resilience measures to improve indoor air quality. The virtual energy audit report included a summary of potential annual energy cost savings to assist in decision-making by building owners to seek proposals to deploy identified EEMs. An appendix to the report was a novel feature of the Initiative that summarized findings, suggested next steps, and identified rebates by the third-party administrator appointed by the Public Utilities Commission [4] to incentivize efficiency measures for which the building owner or operator may qualify. The virtual energy audit also estimated increased energy use due to increased ventilation, and the appendix identified potential precautionary temporary best practices for improved ventilation to minimize the spread of COVID-19 through the air.
The Initiative was originally conceived as a five-step process but was executed as a three-step process due to time constraints, as shown in Figure 1. The Hawai’i USA study was funded by the Coronavirus Relief Fund established by the U.S. Congress under the Coronavirus Aid, Relief, and Economic Security (CARES) Act for states and certain local governments. Phase One tasks included rapid data collection of 15 min interval electricity use, the virtual energy audit analysis process, and the virtual energy audit output assessment and reporting, which was required to be completed by the CARES Act funding deadline of 30 December 2020. Phase One tasks are shown in green in Figure 1. Phase Two activities in the blue boxes, including consideration of next steps and evaluation and validation, could not be completed by the funding deadline and must be carried out and studied at a later time.
A second objective of the Initiative aligns with the interests of global communities engaged in energy transitions supporting decarbonization through energy efficiency and renewable energy systems, i.e., Hawai’i Clean Energy Initiative [5] goals, and fulfilling commitments under the Paris Climate Agreement [6,7]. Any substantial progress to be achieved in this regard will require an accelerated rate and expansion of existing building energy efficiency renovations [8].
While building owners in different market segments have particular needs and challenges, all business owners face the dual challenge of rethinking their operations and purpose [9], and planning and executing infrastructure investments to reduce risk of COVID-19 infections that may arise from inadequate air quality, filtration, treatment, and air flow systems [10]. Many businesses that are fighting to remain in operation must quickly plan and deploy new equipment and operations in an affordable, sustainable, and resilient manner.
This paper seeks to explore the potential for virtual energy audits to inexpensively and rapidly estimate electricity savings in commercial buildings, and consider future deployment on a large scale.

2. Methods

2.1. Buildings and Data Acquisition

The virtual energy audits were conducted without on-site access to this study’s buildings, on the tropical island of Oahu, Hawai’i, USA (21° N 158° W). Input data included at least 12 months of 15 min interval electricity data, the building’s postal code (USA zip code), floor area, and building category (its principal building activity). The local electric utility engaged commercial customers to participate in the study and made electricity data available for the audits. The utility reviewed its portfolio of approximately 400 revenue-grade smart meter commercial electricity-only customers. Due to the research funding expiration date, the utility selected a short list of candidates to be offered virtual energy audits at no charge and 19 customers agreed to participate. The identities of the customers were withheld from the research team due to the short duration of the project and estimated time to obtain each customer’s written consent to disclose their non-public information. The ten buildings were categorized as food sales (2), education (1), office building (2), healthcare (1), entertainment venue (2), and condominium common area under the control of the Association of Apartment Owners, not the residences (2). The size of the buildings ranged from 604 m2 to 68,756 m2 and were located in Honolulu (7), Pearl City (2), and Kailua (1) on the island of Oahu, Hawai’i (cities at elevations <275 m).

2.2. Data Analysis Software

The virtual energy audit software chosen for the study was the Energy Diagnostics Investigator for Efficiency Savings (EDIFES) developed by Case Western Reserve University and spun off as a start-up, Edifice Analytics. EDIFES software uses building markers to analyze potential costs and savings associated with identified EEMs [11]. Building markers are the set of functions that identify building energy characteristics from which a building energy profile can be prepared to compare buildings and assess if a building is operating at near peak efficiency. These functions may include baseload to peak energy ratio, energy pattern snapshot, HVAC schedule (on/off times), and building occupancy patterns. When a small population of buildings of different categories and climates are analyzed in a virtual energy audit, varying usage characteristics such as baseload, daily operation, and energy use intensity (EUI) may be clearly identified [12].
The software analyzed the 15 min electric interval data with algorithms that distinguished utility usage into end uses such as lighting, heat pumps and HVAC fans. Using the square footage of the building, the software can estimate appropriate ranges of energy usage and detect potential areas of excessive energy to perform typical needs such as lighting, air conditioning, etc.

2.3. Virtual Energy Audit Reporting

Data were delivered to Edifice Analytics, who verified its completeness. Only 10 of the 19 buildings had enough data to execute the audit. Categories of potential energy savings identified by the virtual energy audits are as follows:
  • Energy use intensity benchmarking by building category and climate type;
  • Energy consumption pattern “snapshot”: a graph showing annual average hourly energy consumption by day of the week during winter and summer seasons. Box and whiskers indicate the variability of energy use;
  • Baseload cooling savings;
  • HVAC reschedule savings;
  • Setpoint setback savings;
  • HVAC size/efficiency savings: replacing equipment;
  • Window replacement savings;
  • Plug load and interior lighting savings: replacing equipment;
  • Refrigeration savings: replacing commercial equipment;
  • Exterior lighting savings: adding daylight sensors or a schedule;
  • Building shell savings: air-sealing, added insulation, roof replacement;
  • Additional cost for increased ventilation (without EEMs implemented);
  • Weighted total savings estimate.
The weighted total savings estimate is the result of changes made to the building and its operation in each of the categories, assuming all efficiency measures are employed. It is based on changes relative to the time period evaluated using the midpoint value for each marker. For HVAC, an adjustment is made to each of the individual markers (schedule, set-point, base load, etc.) to account for the overlapping impact of each measure on the HVAC savings as a whole.

2.4. Increased Ventilation in Response to COVID-19

The virtual energy audit also evaluated the predicted increase in energy consumption if the ventilation rate was increased as a means to improve indoor air quality and reduce the risk of airborne transmission of COVID-19. Mechanical ventilation in a tropical climate zone such as Hawai’i refers to the mechanical processes to introduce fresh air within a building over a period of time, and is typically combined with dehumidification, cooling, filtration, and, sometimes, reheat. Ventilation and air conditioning mechanical systems in larger and newer buildings are generally equipped with advanced controls with default settings based upon standards and guidance by the American Society of Heating, Refrigerating, and Air-conditioning Engineers (ASHRAE) to provide uniform sequences to maximize energy efficiency and performance, control stability, and allow for real-time fault detection and diagnostics [13]. The advanced controls may be manually adjusted beyond standard settings. ASHRAE, et al., provide guidance about the adjustment of ventilation to create a safer and healthier workplace and reduce risk of indoor transmission of COVID-19 [14,15]. To help building managers and owners, the virtual energy audit estimated increased energy use associated with increasing the ventilation rate by 25%, 50%, and 100% (e.g., by changing the damper position accordingly). Costs from the increased ventilation could be offset by cost savings resulting from the implementation of EEMs identified in the virtual energy audit. Building owners and managers were advised to use those results alongside an in-person assessment of the HVAC system’s maximum ventilation rate.

2.5. Appendices to the Virtual Energy Audit Report

Appendices [16,17,18] (not provided here) were prepared by the University of Hawai’i at Manoa with input from engineers and staff of Hawai’i Energy, the administrator of a public benefits fee dedicated to support end-use energy efficiency measures available to the utility’s customers by providing financial incentives. The appendices included checklists for discussion with a future on-site energy auditor to validate virtual energy audit findings and identify specific energy efficiency measures for installation. Specific energy conservation and air handling measures to be considered and undertaken by the participating businesses require the building owner or operator to engage qualified contractors to conduct site visits to prepare and present proposals based on the virtual energy audit findings. The three appendices in the report are as follows.
  • Appendix A [16] is divided by energy end-use and describes:
    Checklists of very specific EEMs recommended by ASHRAE to consider implementing;
    Hawai’i Energy’s financial incentives for implementing each EEM;
    Hawai’i Energy’s participating contractors; and
    Temporary pandemic-related ventilation and indoor air quality measures to consider implementing.
    A list of references.
  • Appendix B lists Hawai’i Energy’s recommendations for Business Re-entry, HVAC Operations & Energy Impact [17].
  • Appendix C consists of the ASHRAE Epidemic Task Force Commercial Guidelines [18].
The completed virtual energy audit reports were delivered to the electric utility to forward to the participating businesses to prompt consideration of potential equipment, operational, and maintenance improvements.

3. Results

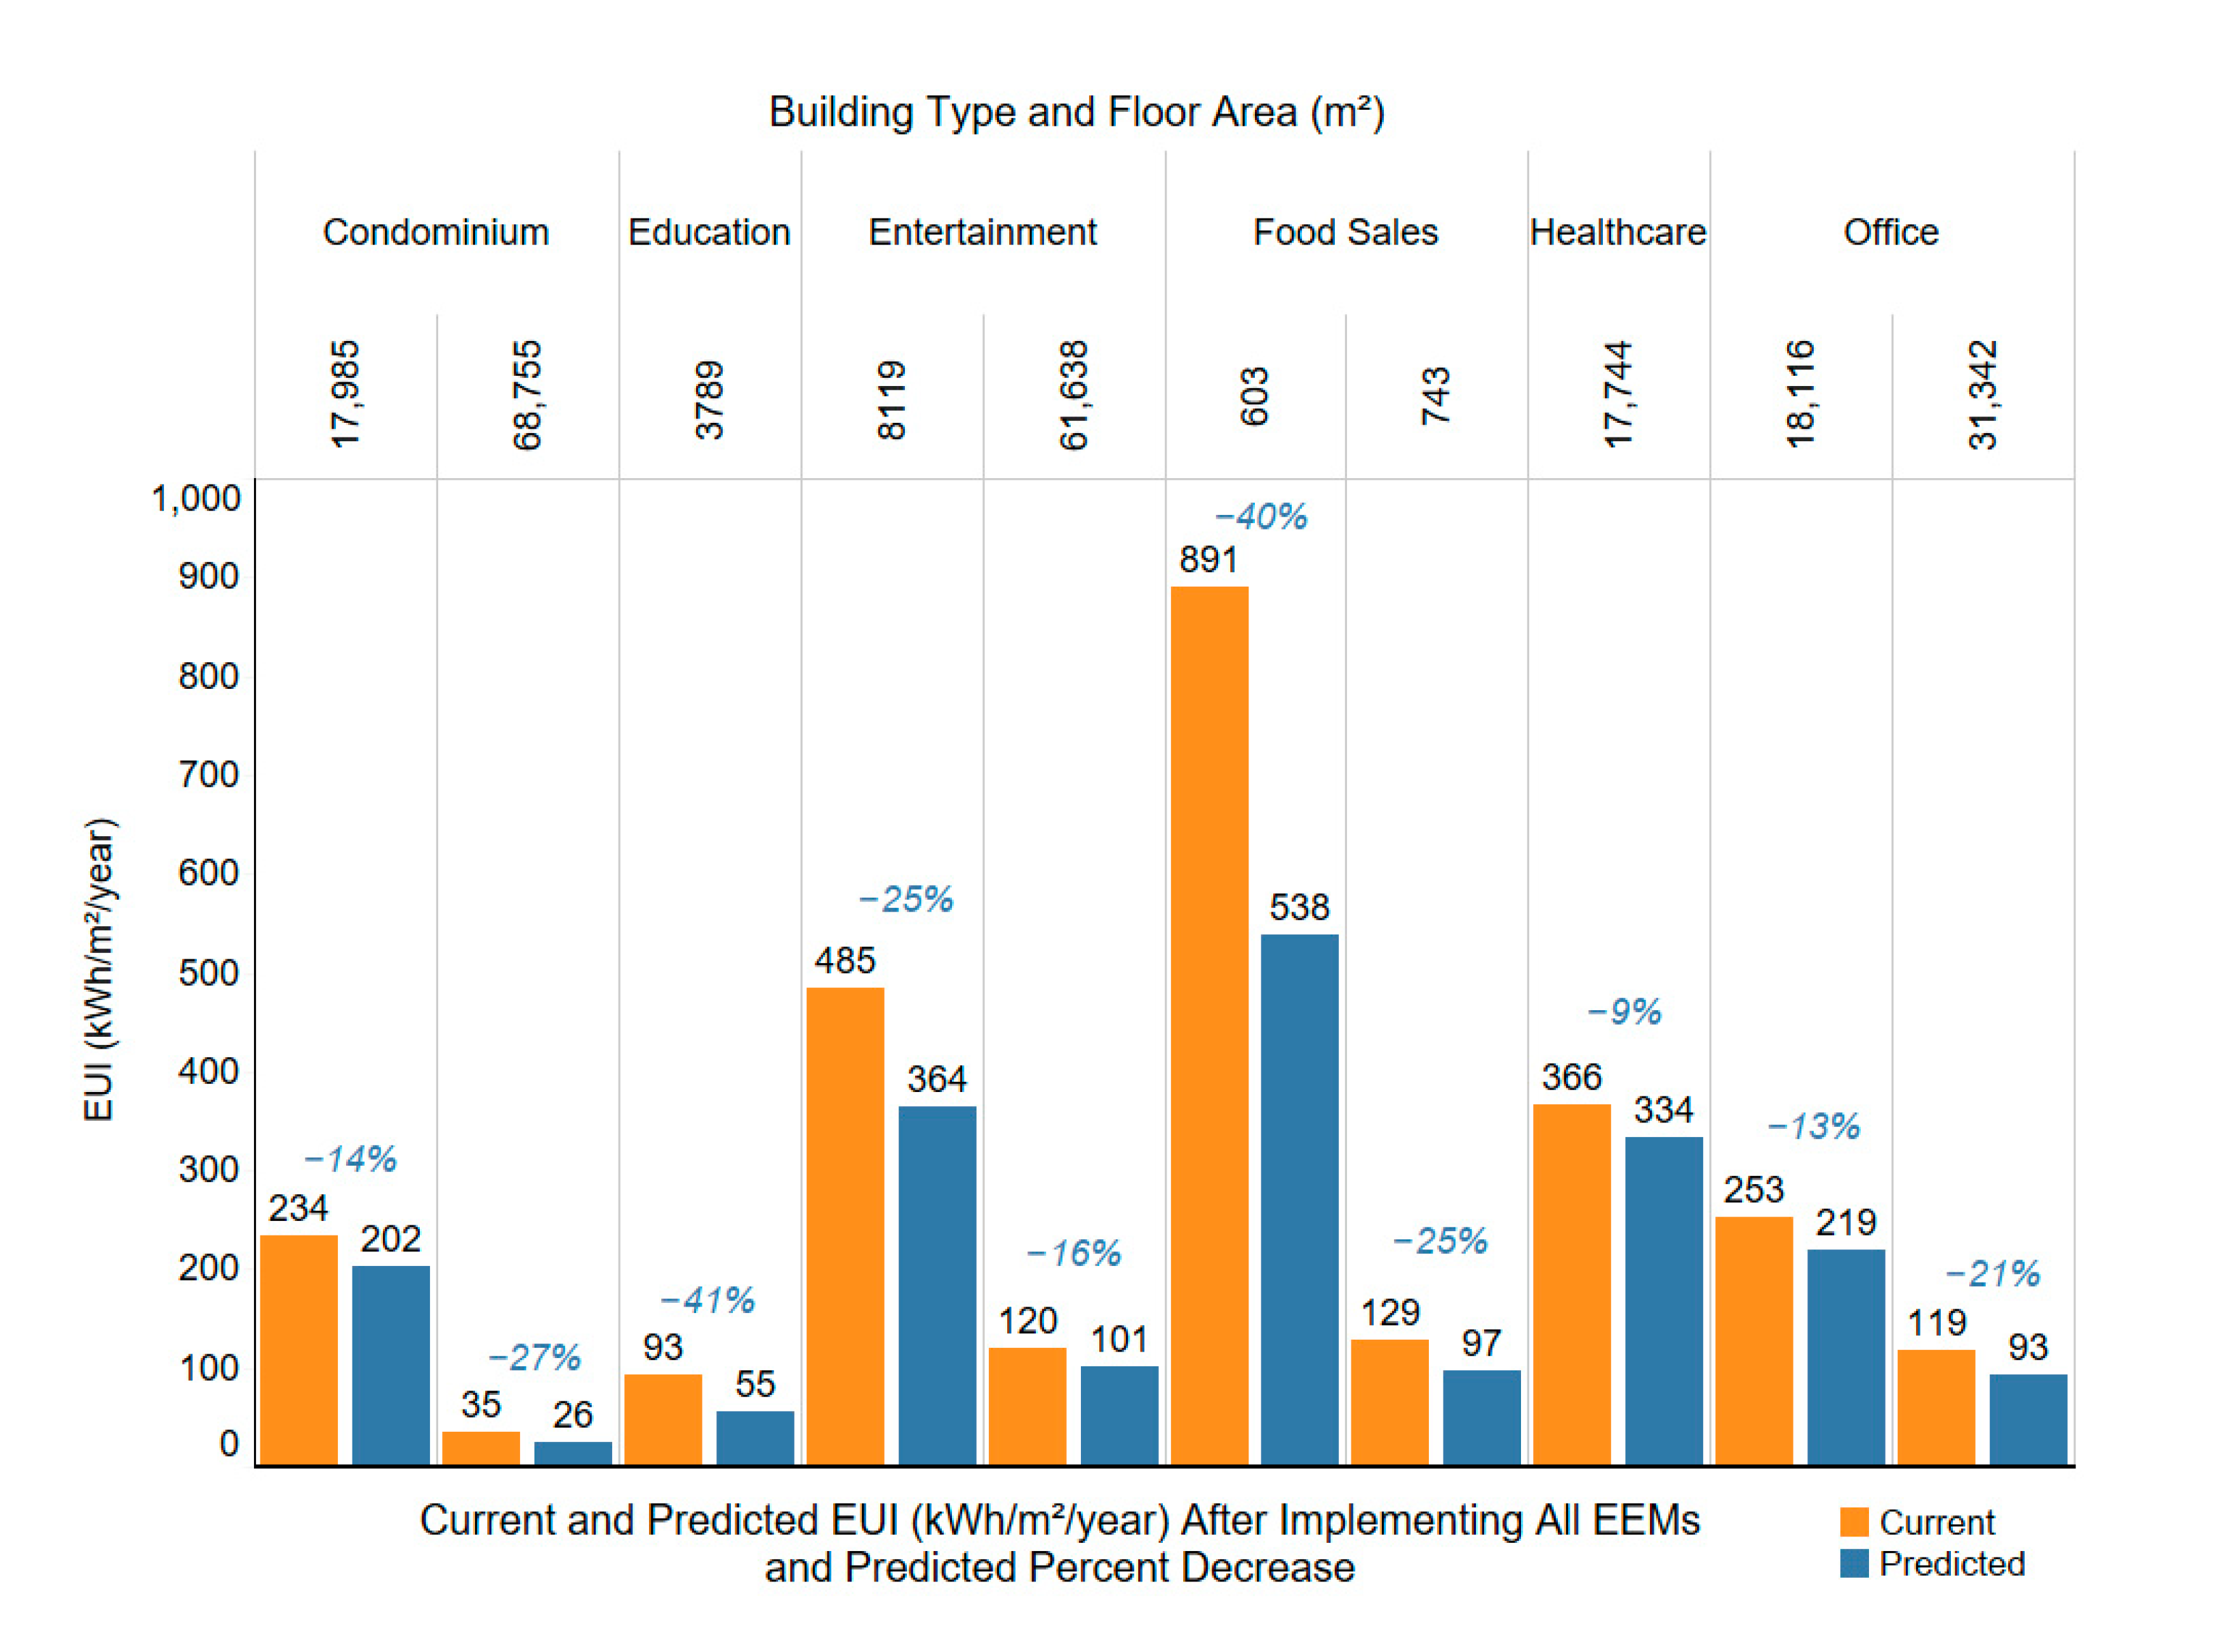
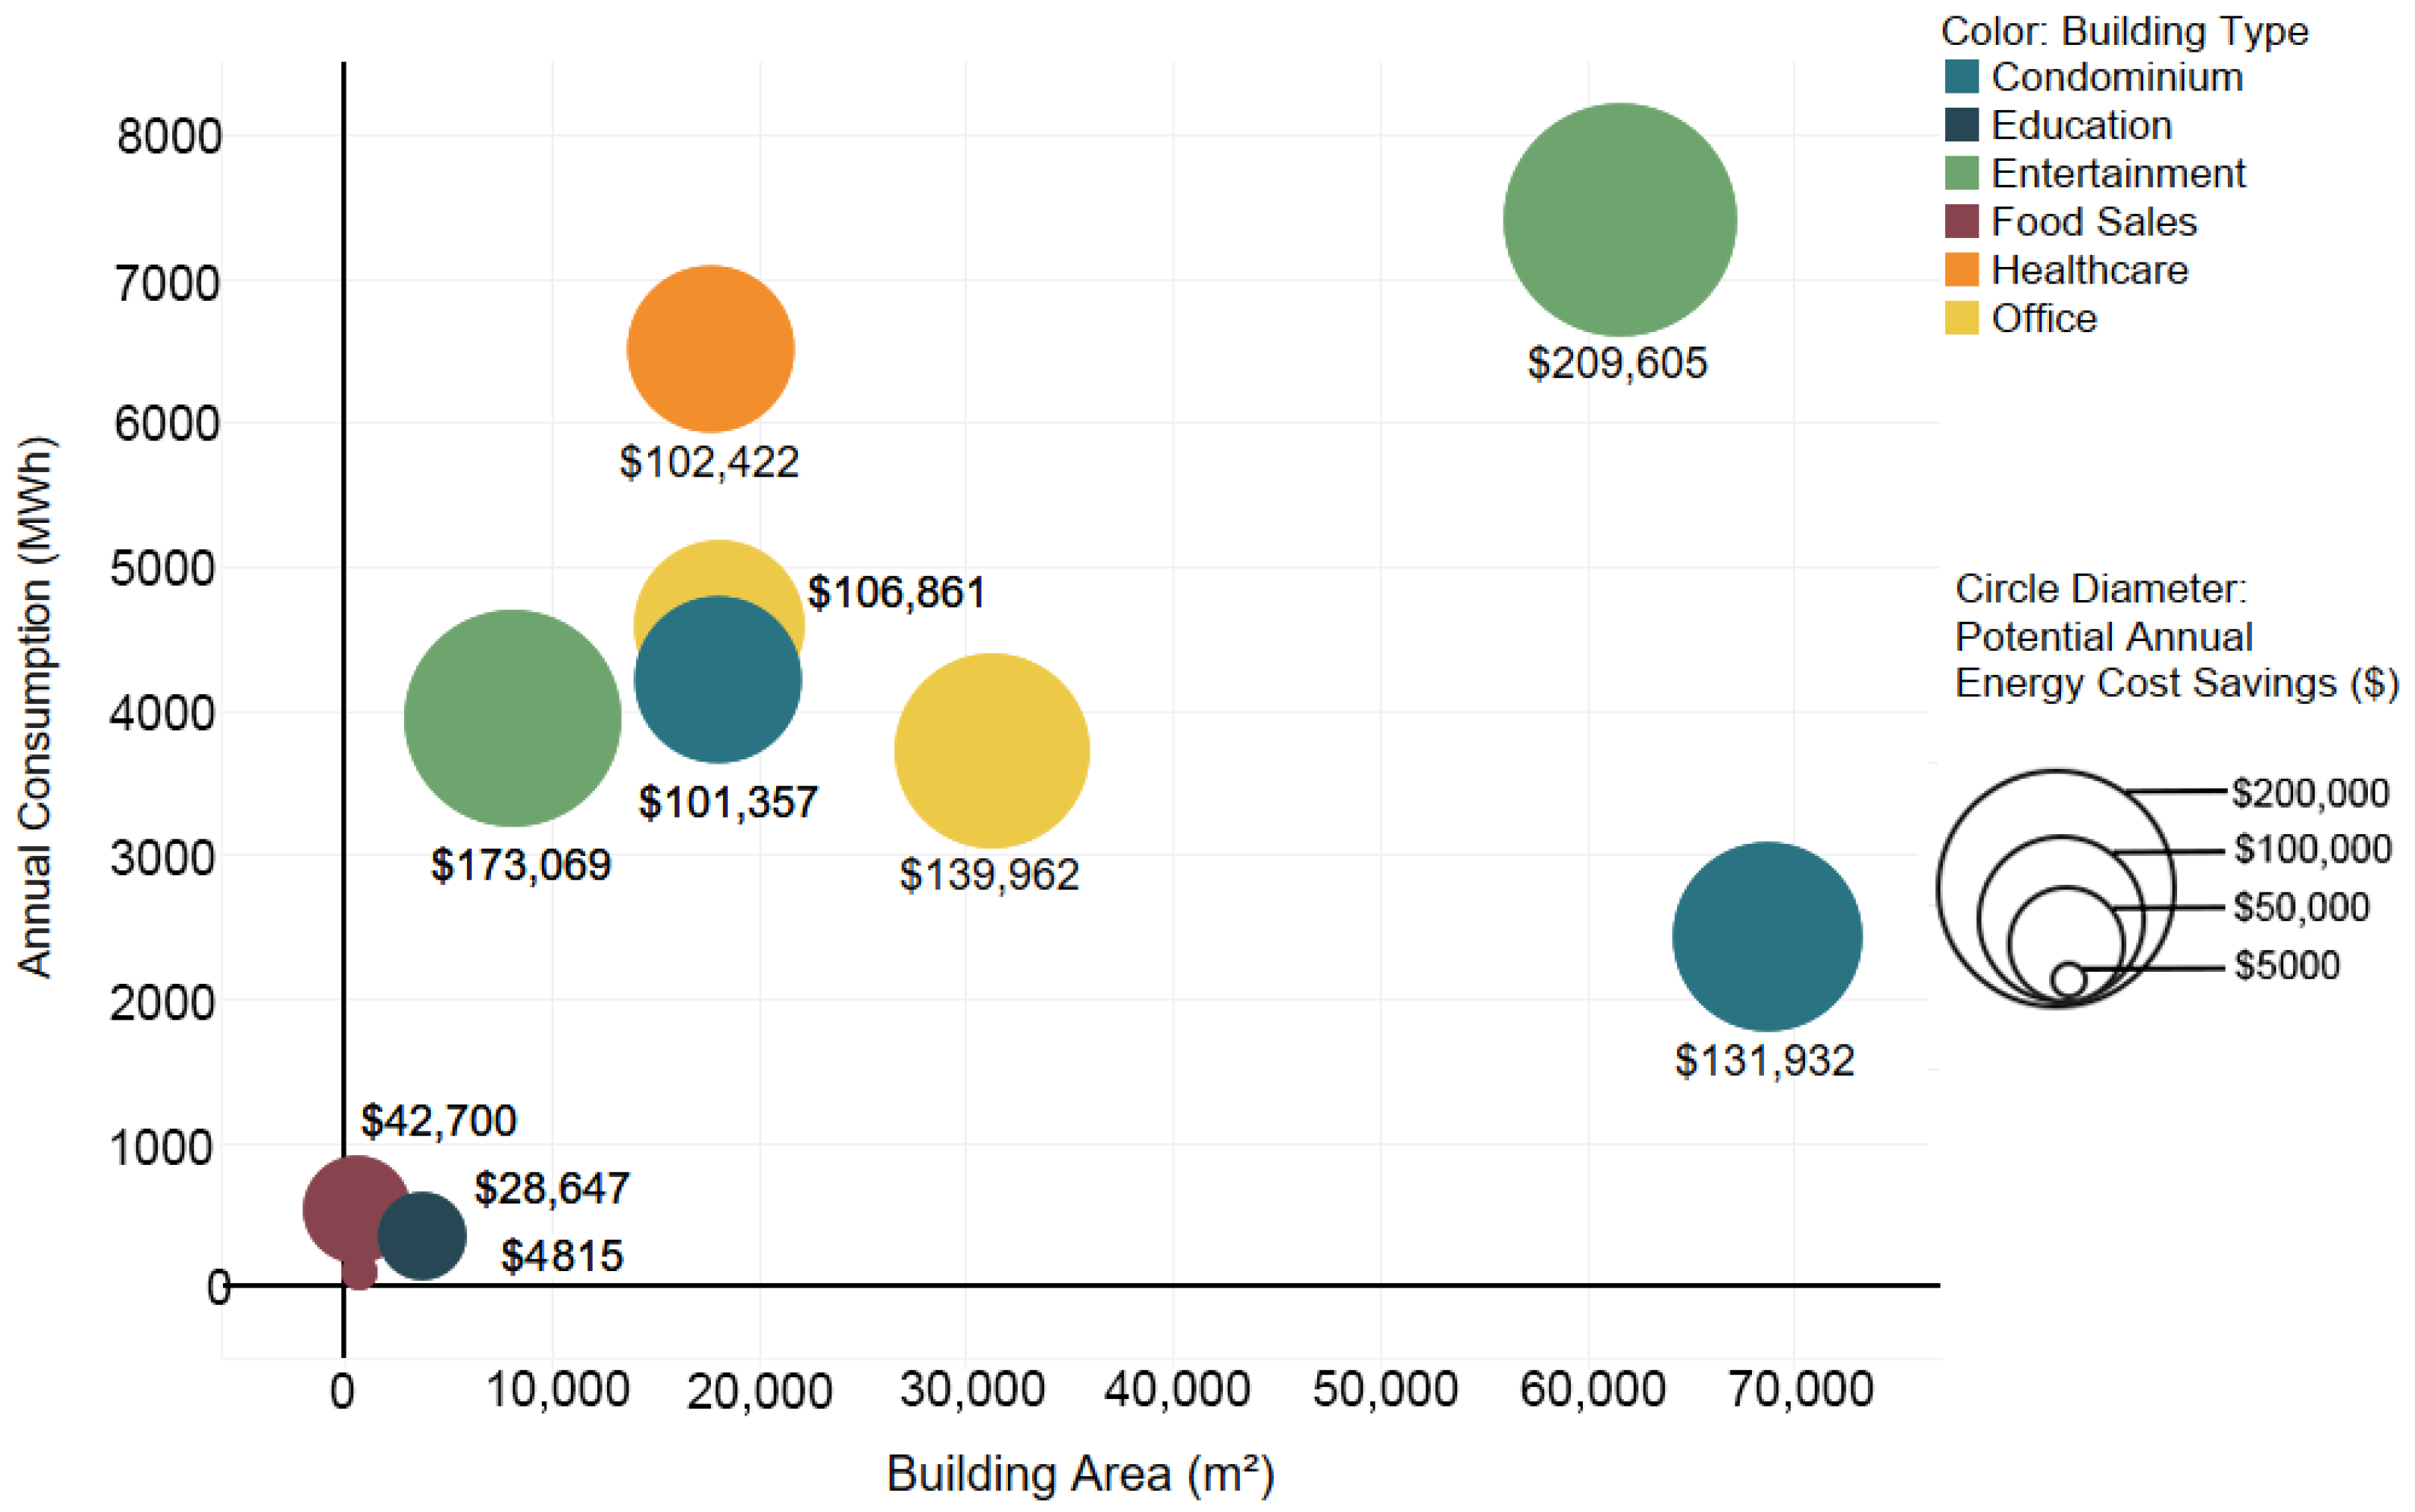
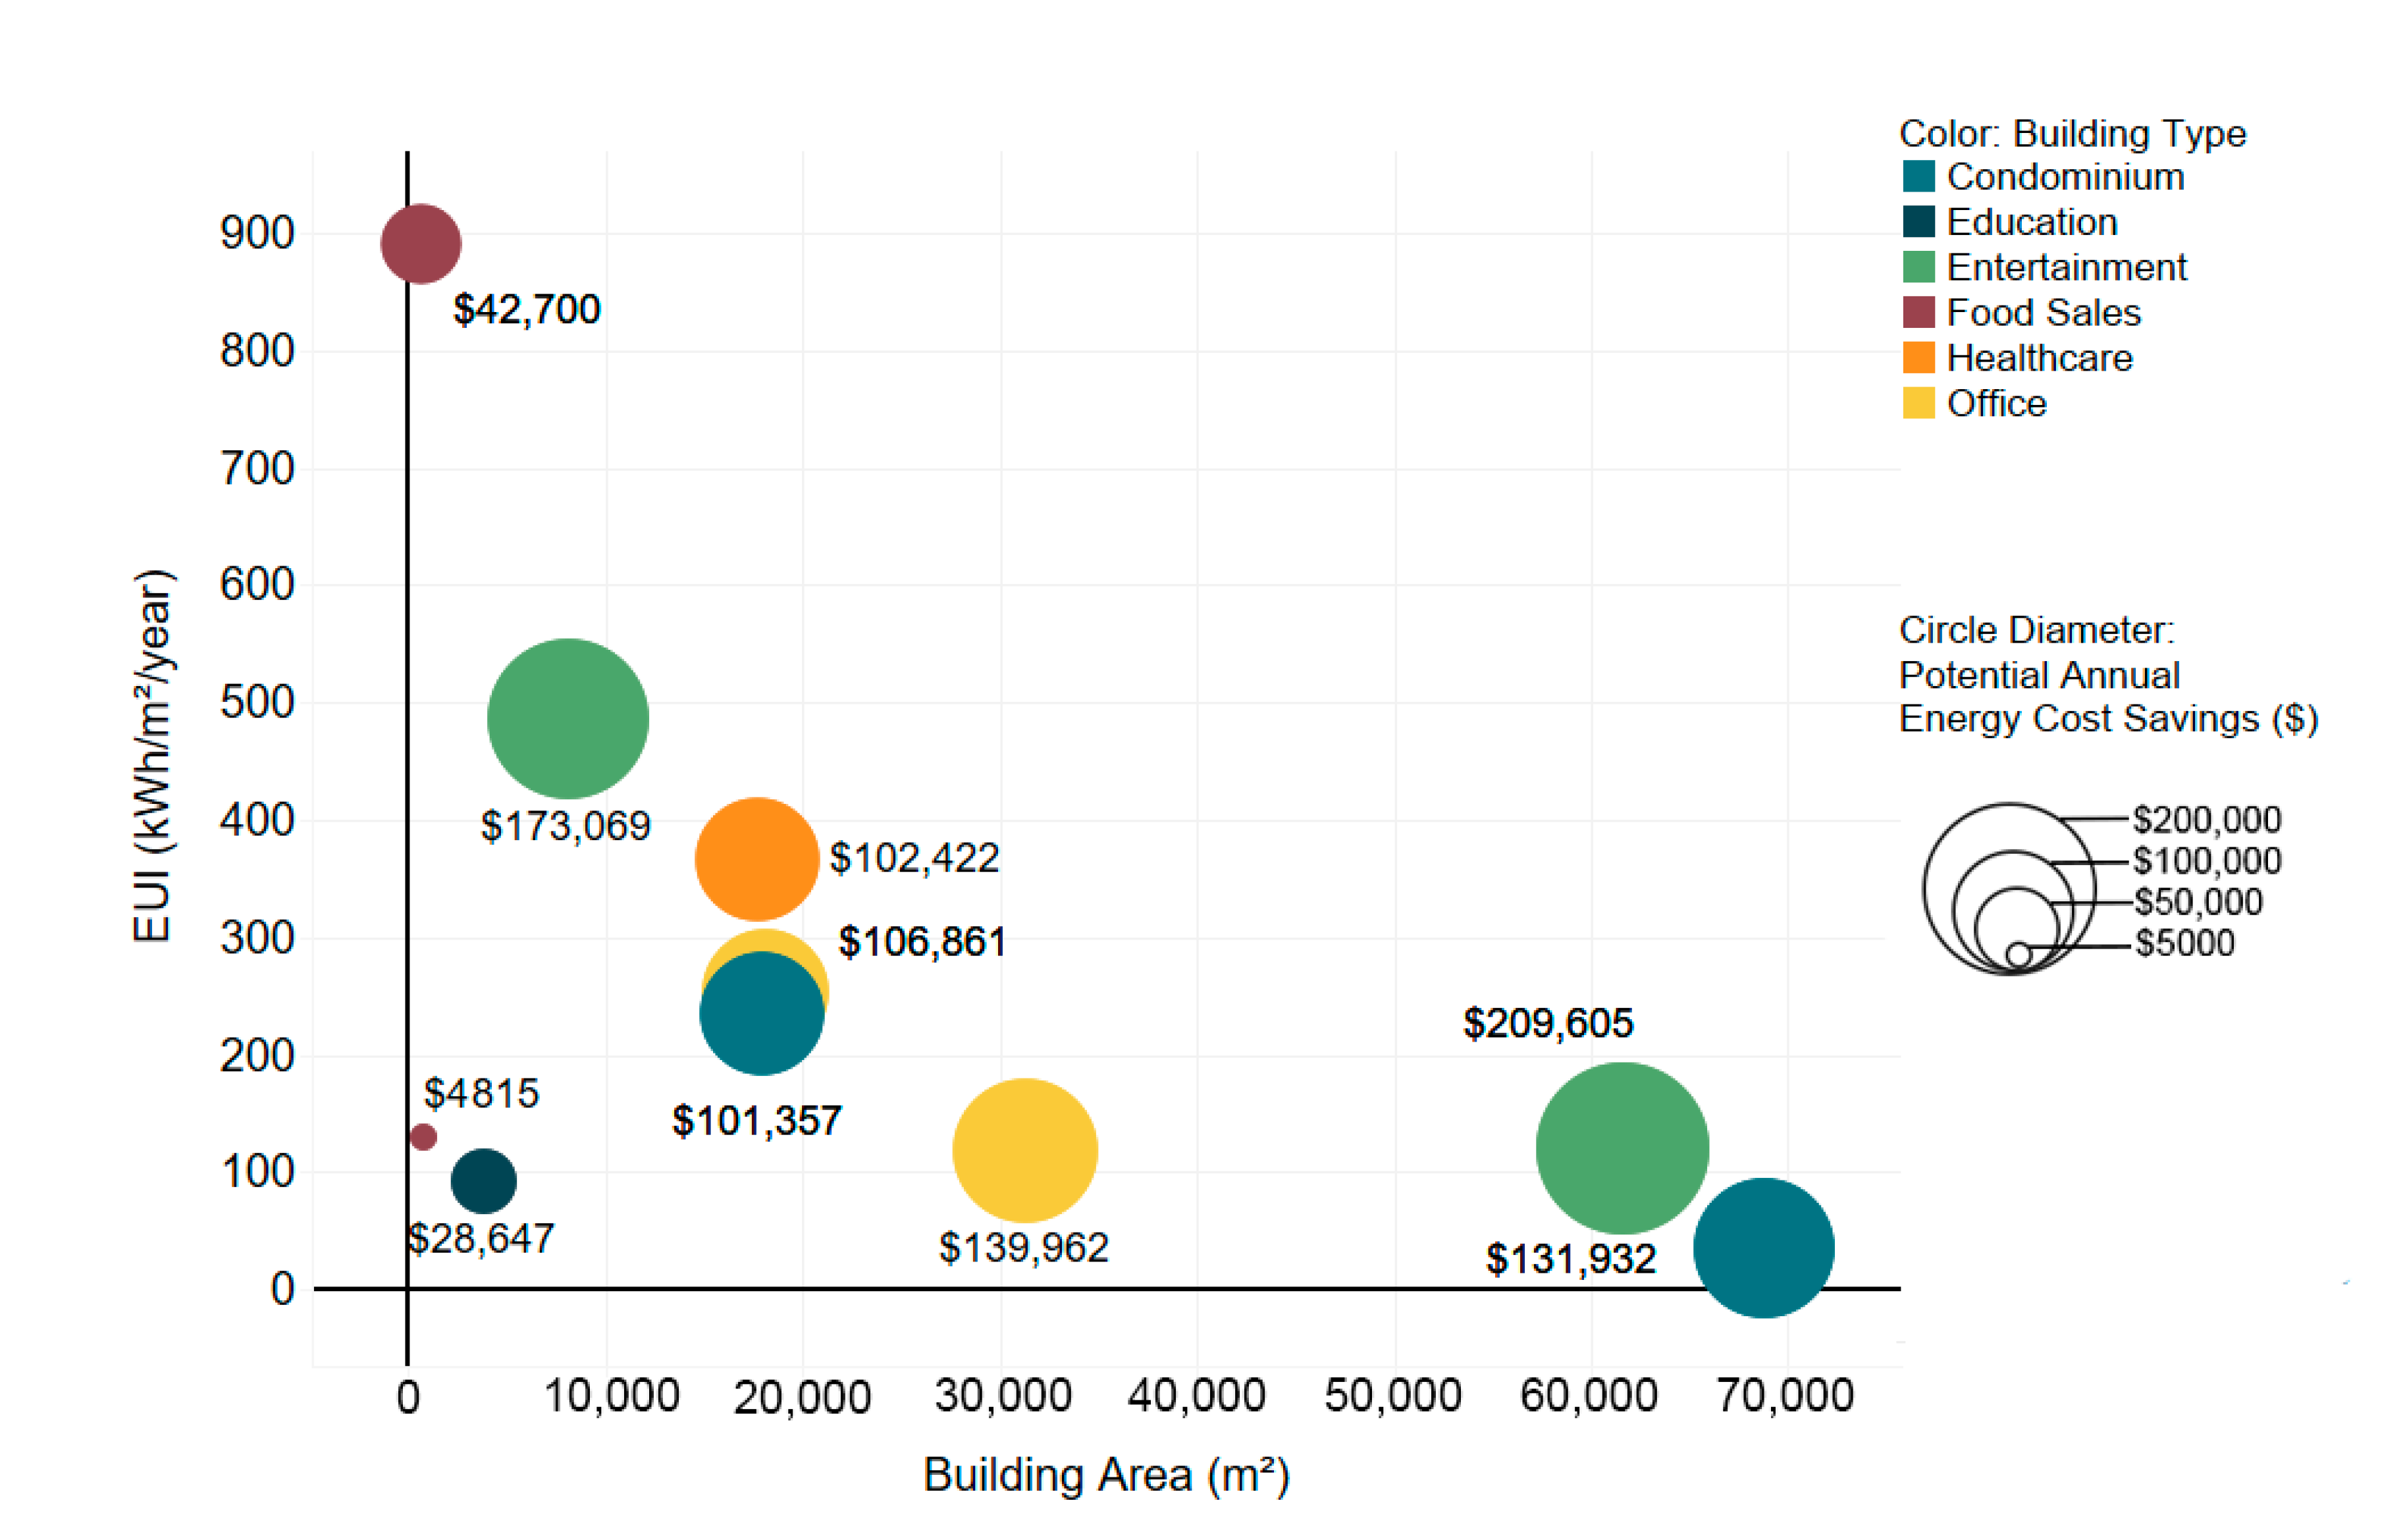
3.1. Energy Analysis and Predicted Savings

The estimated annual electricity cost savings for implementing EEMs ranged from USD 4815 for a 604 m2 building to USD 209,605 for a 61,629 m2 building (Figure 2). This represents a 9% to 41% reduction in annual electricity use and a 24 MWh to 1195 MWh reduction in annual energy use, respectively.
Building energy use intensities (EUI; kWh/m2/year) can vary greatly, even within the same building category. For example, in the Food Sales category, one building had an EUI of 892 kWh/m2/year, while another had an EUI of 129 kWh/m2/year (Figure 3).
The virtual energy audit reports benchmarked the EUI of the buildings studied, compared with peer buildings. Peer buildings are in the same building activity category and are located in a similar climate zone. In this case, it was hot climates (hot-dry, mixed-dry, and hot-humid) defined by the U.S. Energy Information Administration’s Commercial Buildings Energy Consumption Survey [19]. A building ranked in the first quartile has a lower EUI than its peer buildings and one in the fourth quartile has a higher EUI than its peers. For example, the healthcare building EUI of 366 kWh/m2/year was higher than an office building (253 kWh/m2/year) and a condominium building (234 kWh/m2/year), but was ranked in the third quartile for its building type, compared with the others that were in ranked in the fourth quartile for their building types (Figure 4). Five of the ten buildings ranked below the median (first and second quartiles) for their building types. Knowledge of a building’s EUI relative to its peer buildings may motivate the owners of more energy-intensive buildings to solicit an in-person energy audit and install EEMs. It may also help the owner of a portfolio of buildings to identify and prioritize the buildings for in-person energy audits and EEM retrofits.
Figure 5 shows the estimated annual energy cost savings (USD) disaggregated by end-use. The four HVAC/cooling measures account for 47.5% to 97.4% of the estimated energy savings for the ten buildings.
Figure 6 shows the EUIs of the buildings in their current state and the predicted EUIs after implementing all the EEMs identified by the virtual energy audit, demonstrating the reductions ranging from 9% to 41%.

3.2. Increased Energy Use with Increased Ventilation in Response to COVID-19

Increasing ventilation in response to the COVID-19 pandemic is estimated to increase energy use by 1.9% to 19.3% for these buildings depending on the specific building and increased ventilation rate (Edifice Analytics did not perform this analysis for the healthcare building, noting “Given the nature of this healthcare building and the inherent ventilation complexities with healthcare facilities, EDIFES was unable to accurately identify the ventilation load and potential costs associated with increasing ventilation operation within the building.”). Operational cost estimates related to the increased energy use for ventilation were calculated for scenarios of 25%, 50% and 100% increases in ventilation rates (see Table 1). CDC [15,20], ASHRAE [14,18], and others, do not provide specific guidance on how much the ventilation rate should be increased. For example, the CDC states: “The ventilation intervention considerations… come with a range of initial costs and operating costs which, along with risk assessment parameters such as community incidence rates, facemask compliance expectations and room occupant density, may affect considerations for which interventions are implemented.” [20]. Some of the increased energy use from increasing ventilation could be offset by implementing EEMs outlined in the virtual energy audit and Appendix A, further supplemented by rebates offered by organizations such as Hawai’i Energy.

4. Discussion

The opportunity for energy efficiency savings in existing buildings is extremely large considering that nearly two-thirds of the building area existing today will still exist in 2050 on a global level [8]. At the federal level in the United States, building retrofits are among the solutions chosen by the Biden Administration to pursue green jobs and climate change mitigation. These objectives are addressed under the proposed American Jobs Plan, a Biden Administration proposal that includes building, preserving, and retrofitting more than two million homes and commercial buildings in the United States [21]. It is not clear, however, whether the retrofit of as many as a quarter of the commercial buildings in the United States can be achieved at the scale contemplated by the Biden policies without cheaper and quicker means to assess potential EEMs or indoor air quality improvements. The urgency for climate change mitigation may compel priority actions such as strengthening the market pull for energy-efficiency innovations and demand-side policies [22].
When assessing whether virtual energy audits might be rapidly deployed at a large scale, there is potential to utilize existing smart meters nationwide to provide the necessary interval electricity data. In 2019, U.S. electric utilities had about 94.8 million advanced (smart) metering infrastructure (AMI) installations. About 88% of the AMI installations were residential customer installations [23]. Commercial customers, however, consume a disproportionate share of electricity. In 2018, 18 million commercial electricity customers directly consumed 1381.76 TWh or 32.72% of the total electricity produced in the United States [24]. For all customers with smart meters, including the 12% or more commercial utility customers in the U.S., electricity usage is measured and recorded at 5, 15, 30, or 60 min intervals and provided to both the utility and utility customer at least once a day. Smart meters range from interval meters to real-time meters with built-in two-way communication that are capable of recording and transmitting instantaneous data.
To accomplish the large-scale energy-efficiency retrofits proposed by the Biden Administration, voluntary or mandatory building energy benchmarking would help identify buildings that consume the most energy relative to their peers. Voluntary tools such as Energy Star Portfolio Manager can help track and improve energy efficiency across a portfolio of properties and enable comparison to peer buildings [25]. A second approach is county-led building energy benchmarking, a recently launched resilience initiative in Honolulu [26]. Third, municipalities may mandate building benchmarking or limit carbon emissions of existing buildings through policy, as some jurisdictions in the U.S. have already undertaken [27,28]. Such benchmarking can be followed by virtual energy audits to determine whether the buildings with the highest energy consumption also have the highest estimated potential energy cost savings.
Cities or building portfolio owners may use energy benchmarking data to identify and prioritize buildings for virtual and in-person energy audits and EEM retrofits. In most large cities in the U.S., a small percentage of big buildings are responsible for about half of the total building sector emissions in that city. For example, in Seattle, WA, 2.8% of the total building sector (5098 of 181,947 buildings) is responsible for 45% of the city’s total building sector emissions. In New York, NY, buildings over 50,000 ft2 are responsible for about half of the city’s total building sector emissions [29]. On a global scale, the opportunity to reduce operational emissions from existing buildings is supported by the fact that nearly two-thirds of the building area existing today will still exist in 2050 [8].
Simple benchmarking (comparing the EUI of a building with a population of similar buildings and tracking its performance over time) has been successfully used as a tool to encourage energy efficiency implementation [30], and as of August 2021, four states and 37 cities in the U.S. have some benchmarking requirements in their policies [31], and other countries are making similar changes to policies [32]. In the UK, benchmarking first gained prominence when it became part of a mandatory Display Energy Certificate (DEC) scheme under the Energy Performance of Buildings Directive (EPBD) (CIBSE, 2003). Under the directive, public buildings with floor areas greater than 500 m2 and frequently visited by the public are required to produce a DEC (DCLG, 2012) [33]. The revised EPBD of 19 June 2018 is a European Commission directive with follow-on action plans with specific regulatory, financing and enabling measures intended to double the annual energy renovation rate of buildings by 2030. Anticipated future revisions to EPBD will focus on provisions that are central to boosting building renovations, motivate consumers to accelerate investments in smart building technologies, and support the uptake of technology innovation in the building sector [34].
The virtual energy audit is a step beyond benchmarking and could be used as an educational tool to motivate business owners to act on reducing energy use. Based on the virtual energy audit estimates of potential energy savings, business owners may wish to consider early replacement of less efficient equipment. For example, the four HVAC/cooling measures in the Honolulu case study account for 48% to 97% of the estimated energy savings of the ten audited buildings. While replacing HVAC equipment with more efficient models is an expensive retrofit, implementing the reschedule and set point changes on existing equipment accounts for 28% to 69% of the total estimated savings. Because this virtual energy audit trial did not allow researchers to access the buildings or know the addresses, there was no way to determine if natural ventilation was an option to save energy. The appendix to the virtual energy audit report lists detailed options to consider when not to use air conditioning and instead use natural ventilation if the building was designed for it.
Several calls for improvement to conventional (in-person) and virtual energy audits point to potential future industry-wide action. In their review of conventional energy audits used to inform EEM deployment, Consortium for Advanced Residential Buildings (CARB) investigators found that audits performed by Building Performance Institute accredited contractors lacked clear reporting, resulting in arbitrary recommendations for building upgrades and containing non-energy-related measures that can be justified for health, safety, or cosmetic reasons but do not contribute to reducing energy use [35]. Virtual energy audits as an alternative have also faced criticism for a variety of reasons including inaccurate remote interview answers from building owners, limited EEM descriptions and options, and lack of specificity in the root causes of excess energy [36].
Based on the approach utilized under the Initiative, an issue that can hamper the effectiveness of virtual energy audits is the high dependence on having at least 12 months of contiguous data. In Honolulu, a number of data sets were found to be deficient in this regard due to a variety of factors, including uncharacteristic demand profiles stemming from COVID-19 and the limited time in which smart meters were in place prior to the Initiative.
After a thorough review of the Initiative, the following observations can be made when considering conducting a virtual energy audit as a precursor to future in-person energy audits and installation of EEMs, compared with relying on a building owner to initiate an in-person audit:
  • The Initiative’s virtual energy audits identified EEMs for end uses relevant to the commercial sector in the subtropical environment, such as air conditioning, ventilation, plug loads, and lighting. As mentioned previously, commercial electricity customers consume 32.72% of the total electricity produced in the United States;
  • A virtual audit feature that estimates energy costs associated with increasing ventilation to improve indoor air quality emerged during the COVID-19 pandemic;
  • Although increasing ventilation during the pandemic would temporarily increase energy use, implementing other EEMs would save energy. The Initiative’s virtual energy audits provide businesses affected by the pandemic with a quick estimate of potential energy increases and savings.
Upon receipt of a virtual energy audit report, building owners should consider the following next steps:
  • Identify specific opportunities to be investigated via on-site assessment and potential actions that may be considered;
  • Identify potential financial incentives for EEMs to create further cost savings and contractors familiar with utilizing those incentives;
  • Consider the potential energy cost savings, including potential rebates, when evaluating solicitations to implement the recommended measures and savings opportunities.

5. Conclusions

Virtual energy audits provide more information than simple benchmarking to target energy savings and costs for building owners or facility operators considering building retrofits. Associated reports that contain information on available financial incentives for EEMs inform building owners how to improve upon recommended cost savings and offset costs of increasing ventilation to reduce the risk of exposure to COVID-19. There are several observed potential advantages in using a virtual energy audit as an initial step, rather than a typical on-site energy audit process as an initial step:
  • The low cost of a virtual energy audit versus an in-person audit makes it a more feasible first step when considering large-scale deployment;
  • The building owner or facility operator is not required to initiate or spend time on the virtual energy audit process. Electricity use may be provided directly from the utility;
  • The virtual energy audits rapidly estimate potential annual energy cost savings, which may motivate the building owner or operator to pursue the suggested next steps with an on-site assessment. There are additional time and cost savings advantages for building owners when virtual energy audit reports are coordinated with existing rebate programs and other incentives;
  • This process can be enhanced by coordination with existing programs for energy-efficiency financial incentives and approved contractors;
  • Virtual energy audit reports have clear, understandable kWh and cost data for building owners and associated utility commercial account representatives.
These described advantages are consistent with other literature on virtual energy audits [11,36,37,38].
When planning future virtual energy audits, buildings should be selected for their potential to significantly reduce energy use and associated greenhouse gas emissions using the following criteria:
  • Target the largest energy users;
  • Target buildings with high energy use intensities as compared with peer buildings;
  • Target owners with a portfolio of buildings who are inclined to pursue energy efficiency. Improving multiple buildings through one point of contact may be faster than multiple owners and operators.
Future research is warranted to address unfinished tasks discussed in the Introduction. For buildings identified in virtual energy audit reports with the greatest estimated potential energy savings, there is a need to compare forecasted energy savings and ventilation energy increases from virtual energy audits to ASHRAE Level II audits and actual installations. For jurisdictions that have a public fee benefits administrator overseeing energy efficiency opportunities in the utility’s service territory, an addendum to the virtual energy audit report with available incentives to offset installation costs will be a useful addition. There is also an opportunity to study co-benefits such as peak electricity demand reduction or development of building benchmarking grades.
Finally, federal, regional, and state regulatory oversight agencies’ guidance and directives on utility adoption of smart meters should reference the potential of interval data for virtual energy audits in addition to other uses such as electricity pricing innovations (e.g., Real Time Pricing (RTP) and Critical Peak Pricing (CPP) rates). It should be noted that virtual energy audit software is also commercially available for the residential sector, which was beyond the scope of this analysis. However, similar analysis and evaluation on virtual energy audit performance in the residential sector would be in the public interest and is recommended.

Author Contributions

The authors note their respective contributions to this paper as follows: Conceptualization, M.B.G., W.M., E.P.; methodology, W.M., M.B.G., E.P.; formal analysis, E.P., W.M., M.B.G.; visualization, W.M., E.P., M.B.G.; writing—original draft preparation, W.M., E.P., M.B.G.; writing—review and editing, M.B.G., E.P., W.M.; funding acquisition—M.B.G., W.M., E.P. All authors have read and agreed to the published version of the manuscript.

Funding

Principal funding was provided by the Hawai’i Natural Energy Institute with resources allocated to them from the State of Hawai’i Energy Systems Special Fund §304A-C. Additional funding was provided by a grant/cooperative agreement from the National Oceanic and Atmospheric Administration, Project A/AS-1, which is sponsored by the University of Hawai’i Sea Grant College Program, SOEST, under Institutional Grant No. NA18OAR4170076 from NOAA Office of Sea Grant, Department of Commerce. The views expressed herein are those of the author(s) and do not necessarily reflect the views of NOAA or any of its subagencies. UNIHI-SEAGRANT-JC-18-22.

Institutional Review Board Statement

Not applicable.

Acknowledgments

The authors wish to thank A.J. Maskrey for his valuable counsel and support; Robert “Rocky” Mould and his Healthy and Resilient Buildings Initiative team at the City and County of Honolulu; the inaugural and current directors of the Honolulu Office of Climate Change, Sustainability and Resiliency, Josh Stanbro and Matthew Gonser, respectively; Yoh Kawanami and his Customer Energy Resources team at Hawaiian Electric Company; Caroline Carl and Keith Block and their team at Hawai’i Energy; Megan Russell and Kendal Leonard of HNEI, and Dave Gordon of Edifice Analytics.

Conflicts of Interest

The authors declare no conflict of interest.

References

  1. American National Standard. ANSI C12.1-2008—Electric Meters Code for Electricity Metering. Self-Generation Incentive Program. 2008. Available online: http://webstore.ansi.org/RecordDetail.aspx?sku=ANSI+C12.1-2008 (accessed on 13 August 2021).
  2. Quach, T.; Ðoàn, L.N.; Liou, J.; Ponce, N.A. A Rapid Assessment of the Impact of COVID-19 on Asian Americans: Cross-sectional Survey Study. JMIR Public Health Surveill. 2021, 7, e23976. [Google Scholar] [CrossRef]
  3. City and County of Honolulu Climate Action Plan 2020–2025. City and County of Honolulu, UHERO, ISR. 2020. Available online: https://static1.squarespace.com/static/5e3885654a153a6ef84e6c9c/t/6080c33e91bbf23a20b74159/1619051381131/2020-2025+Climate+Action+Plan.pdf (accessed on 25 August 2021).
  4. GM 760 (Act 118). State of Hawaii Senate. 2008. Available online: https://www.capitol.hawaii.gov/session2008/bills/GM760_.PDF (accessed on 14 August 2021).
  5. Hawaii Clean Energy Initiative. Available online: https://energy.hawaii.gov/testbeds-initiatives/hcei (accessed on 24 August 2021).
  6. GOVERNOR’S OFFICE NEWS RELEASE: Hawai‘i Becomes First State to Enact Law That Aligns with Paris Agreement. Available online: https://governor.hawaii.gov/newsroom/governors-office-news-release-hawaii-becomes-first-state-to-enact-law-that-aligns-with-paris-agreement/ (accessed on 25 August 2021).
  7. Hawaii State Senate, SB559 (Act 032). Available online: https://www.capitol.hawaii.gov/session2017/bills/SB559_CD1_.htm (accessed on 25 August 2021).
  8. Existing Buildings: Operational Emissions—Architecture 2030. Available online: https://architecture2030.org/existing-buildings-operation/ (accessed on 25 August 2021).
  9. Kumar, A.; Luthra, S.; Mangla, S.K.; Kazançoğlu, Y. COVID-19 impact on sustainable production and operations management. Sustain. Oper. Comput. 2020, 1, 1–7. [Google Scholar] [CrossRef]
  10. Schoen, L.J. Guidance for Building Operations During the COVID-19 Pandemi. ASHRAE J. 2020, 5, 72–74. [Google Scholar]
  11. Pickering, E.M. EDIFES 0.4: Scalable Data Analytics for Commercial Building Virtual Energy Audits. Master’s Thesis, Case Western Reserve University, Cleveland, OH, USA, 2016. [Google Scholar]
  12. Pickering, E.M.; Hossain, M.A.; Mousseau, J.P.; Swanson, R.A.; French, R.H.; Abramson, A.R. A cross-sectional study of the temporal evolution of electricity consumption of six commercial buildings. PLoS ONE 2017, 12, e0187129. [Google Scholar] [CrossRef] [PubMed] [Green Version]
  13. Taylor, S.T.; Chair Standing Guideline Project Committee. ASHRAE Guideline 36-2018 High. Performance Sequences of Operation for HVAC Systems; American Society of Heating, Refrigerating and Air-Conditioning: Atlanta, GA, USA, 2018. [Google Scholar]
  14. ASHRAE Guidance for Re-Opening Buildings. American Society of Heating, Refrigerating and Air-Conditioning. 2020. Available online: https://www.ashrae.org/filelibrary/technicalresources/covid-19/guidance-for-re-opening-buildings.pdf (accessed on 16 August 2021).
  15. CDC (Centers for Disease Control and Prevention). Community, Work, and School. 11 February 2020. Available online: https://www.cdc.gov/coronavirus/2019-ncov/community/ventilation.html (accessed on 25 August 2021).
  16. A Guide for Next Steps for Energy Efficiency Measures and Indoor Air Quality Improvements; Unpublished Internal University Document; Hawaii Natural Energy Institute, University of Hawaii: Honolulu, HI, USA, 2021.
  17. Hawaii Energy−Re-entry, HVAC Operations & Energy Impact. Available online: https://hawaiienergy.com/hvac-resources (accessed on 25 August 2021).
  18. ASHRAE Epidemic Task Force Commercial. American Society of Heating, Refrigerating and Air-Conditioning. 2021. Available online: https://www.ashrae.org/file%20library/technical%20resources/covid-19/ashrae-commercial-c19-guidance.pdf (accessed on 29 July 2021).
  19. U.S. Energy Information Administration. 2018 Commercial Buildings Energy Consumption Survey. 2018. Available online: https://www.eia.gov/consumption/commercial/ (accessed on 13 August 2021).
  20. CDC. Coronavirus Disease 2019 (COVID-19); Department of Health and Human Services, CDC: Atlanta, GA, USA, 2020. Available online: https://www.cdc.gov/coronavirus/2019-nCoV/index.html (accessed on 25 August 2021).
  21. FACT SHEET: The American Jobs Plan. The White House, 31 March 2021. Available online: https://www.whitehouse.gov/briefing-room/statements-releases/2021/03/31/fact-sheet-the-american-jobs-plan/ (accessed on 25 August 2021).
  22. OECD. The World Bank, and United Nations Environment Programme. In Financing Climate Futures: Rethinking Infrastructure; OECD Publishing: Paris, France, 2018. [Google Scholar] [CrossRef]
  23. Frequently Asked Questions (FAQs)−U.S. Energy Information Administration (EIA). Available online: https://www.eia.gov/tools/faqs/faq.php (accessed on 25 August 2021).
  24. U.S. Energy Information Administration. Electric Power Annual 2018; U.S. Energy Information Administration: Washinton, DC, USA, 2018; p. 239. [Google Scholar]
  25. Benchmark Your Building Using ENERGY STAR® Portfolio Manager®. Available online: https://www.energystar.gov/buildings/benchmark (accessed on 25 August 2021).
  26. Energy, Resilience Office-City and County of Honolulu Office of Climate Change, Sustainability and Resiliency. Available online: https://resilientoahu.org/energy (accessed on 27 August 2021).
  27. U.S. Building Benchmarking Policy Landscape. Available online: https://www.buildingrating.org/graphic/us-building-benchmarking-policy-landscape (accessed on 25 August 2021).
  28. Delivering Climate Solutions From Existing Buildings: No Time to Waste, New Buildings Institute. 13 July 2020. Available online: https://newbuildings.org/delivering-climate-solutions-from-existing-buildings-no-time-to-waste/ (accessed on 25 August 2021).
  29. Mazria, E. RESET! Timing Is Everything & The Road to COP26. CarbonPositive. Available online: https://carbon-positive.org/sessions/reset-timing-is-everything-the-road-to-cop26/ (accessed on 25 August 2021).
  30. U.S. EPA. “Section 1: Building Energy Benchmarking and Transparency: Overview for State and Local Decision Makers”, Benchmarking and Building Performance Standards Policy Toolkit. EPA-430-F-21-001. February 2021. Available online: https://www.epa.gov/sites/default/files/2021-02/documents/benchmarking_building_performance_standards_section1.pdf (accessed on 25 August 2021).
  31. Map: U.S. City, County, and State Policies for Existing Buildings IMT. 2021. Available online: https://www.imt.org/resources/map-u-s-building-benchmarking-policies/ (accessed on 26 August 2021).
  32. Jurisdictions. Available online: https://www.buildingrating.org/jurisdictions (accessed on 27 August 2021).
  33. Hong, S.-M.; Paterson, G.; Burman, E.; Steadman, P.; Mumovic, D. A comparative study of benchmarking approaches for non-domestic buildings: Part 1—Top-down approach. Int. J. Sustain. Built Environ. 2013, 2, 119–130. [Google Scholar] [CrossRef] [Green Version]
  34. Communication from the Commission to the European Parliament, the Council of the European Economic and Social Committee and the Committee of the Regions A Renovation Wave for Europe—Greening Our Buildings, Creating Jobs, Improving Lives. European Commission. 14 October 2020. Available online: https://eur-lex.europa.eu/resource.html?uri=cellar:0638aa1d-0f02-11eb-bc07-01aa75ed71a1.0003.02/DOC_1&format=PDF (accessed on 21 July 2021).
  35. Eisenberg, L.; Shapiro, C.; Fleischer, W. Retrofit Audits and Cost Estimates: A Look at Quality and Consistency; No. NREL/Sr-5500-55217; DOE/GO-102012-3631; Technical Report; National Renewable Energy Lab. (NREL): Golden, CO, USA, 2012; p. 68. [Google Scholar]
  36. Avina, J.M.; Rottmayer, S.P. Virtual audits: The promise and the reality. Energy Eng. 2016, 113, 34–52. [Google Scholar] [CrossRef]
  37. Abramson, A.; French, R. Systems and Methods for Data Analytics for Virtual Energy Audits and Value Capture Assessment of Buildings. 2019. Available online: https://worldwide.espacenet.com/publicationDetails/biblio?FT=D&date=20191114&DB=EPODOC&CC=U.S.&NR=2019347670A1 (accessed on 26 August 2021).
  38. Koehrsen, W. Data Science for Virtual Energy Audits, Medium. 26 January 2020. Available online: https://williamkoehrsen.medium.com/data-science-for-virtual-energy-audits-d761477ca564 (accessed on 27 August 2021).
Figure 1. Healthy and Resilient Buildings Initiative Process Flow Chart.
Energies 14 05914 g001
Figure 2. Current annual energy consumption (MWh) vs. building area (m2), with estimated potential annual energy cost savings indicated by size of bubble, and building type indicated by color.
Energies 14 05914 g002
Figure 3. Energy use intensity (EUI; kWh/m2/year) of each building vs. building area (m2) with estimated potential annual energy cost savings indicated by size of bubble, and building type indicated by color.
Energies 14 05914 g003
Figure 4. Energy use intensity (EUI; kWh/m2/year) of each building vs. the quartile it ranks within, compared with peer buildings. Estimated potential annual energy cost savings indicated by size of bubble, and building type indicated by color.
Energies 14 05914 g004
Figure 5. Estimated annual energy cost savings (USD) disaggregated by end-use/category vs. building area (m2) and building type.
Energies 14 05914 g005
Figure 6. Current EUI and predicted EUI (kWh/m2/year) after implementing all EEMs suggested by the virtual energy audits, and the percent decrease in energy consumption.
Energies 14 05914 g006
Table 1. Percent increases in annual energy use with varying increases in ventilation rates, as estimated by the virtual energy audits (except for the healthcare building).
Building TypeAnnual Electricity Consumption (MWh)Percent Increase in Ventilation Rate with Resulting Percent
Increase in Annual Energy Consumption
25%50%100%
Food Sales962.5%4.9%9.8%
Food Sales5383.0%6.0%12.0%
Education3524.8%9.6%19.2%
Office Building37233.1%6.2%12.4%
Office Building45801.9%2.0%7.6%
Entertainment Venue74072.1%4.2%8.4%
Entertainment Venue39403.6%7.3%14.5%
Condominium42132.2%2.6%8.9%
Condominium24214.8%9.7%19.3%
Publisher’s Note: MDPI stays neutral with regard to jurisdictional claims in published maps and institutional affiliations.

