Article

The Effect of Environmental Degradation, Climate Change, and the European Green Deal Tools on Life Satisfaction

by
Manuela Ortega-Gil
1,*,
Georgina Cortés-Sierra
2 and
Chaima ElHichou-Ahmed
3
1
Department of General Economy and INDESS, University of Cadiz, 11202 Algeciras, Spain
2
Department of Economy and Economic History Study Group, University of Extremadura, 06006 Badajoz, Spain
3
Facultad de Ciencias Económicas y Empresariales in Campus de Algeciras, University of Cadiz, 11202 Algeciras, Spain
*
Author to whom correspondence should be addressed.
Energies 2021, 14(18), 5839; https://doi.org/10.3390/en14185839
Submission received: 15 June 2021 / Revised: 8 September 2021 / Accepted: 9 September 2021 / Published: 15 September 2021

Abstract

:
Environmental issues, sustainability, and climate change have become the targets of many policies from international and governmental organizations including the EU’s European Green Deal action plan. This plan provides tools to address them—which include support for the circular economy, implementation of energy and environmental taxes, and investment in environmental protection—with the aim of favoring the well-being of EU citizens. In this context, this study analyses the impact of several parameters (environmental matters, global warming, circular economy, energy and environmental taxes, and expenditure and investment on the environment) on life satisfaction, or subjective well-being, and their effects on 33 European countries. For this purpose, four econometric models were carried out using data collected from the World Values Survey (WVS), the European Values Study (EVS), and the World Bank and Eurostat, reflecting subjective citizen satisfaction data. The findings present a highly significant inverse relationship between life satisfaction variables and both environmental problems and energy taxes. Additionally, there is a highly significant positive relationship between circular economy, environmental tax, and environmental protection expenditure parameters and life satisfaction variables, as well as, to a lesser degree of significance, with noise pollution from neighbours.

1. Introduction

The deterioration of the environment and unsustainability of resources are among the main global issues in this millennium owing to the serious risks they pose to ecosystems, human health, and the economy on a planetary scale. The energy issue should be addressed as a key challenge to fight climate change and its adverse effects, owing to the high impact of energy consumption and production on collective emissions of greenhouse gases (GHG), due to the high dependence on fossil fuels in current production and consumption patterns. The efficient use of energy together with the consumption of clean energies are essential to address global warming [1,2,3,4].
In this context, European Union policies are essential to achieve the energy transition. It is under these circumstances that the European Green Deal (EGD) action plan has been developed to facilitate structural change in the energy system and address the processes of climate change and environmental degradation. However, the EGD goes further—it is an ambitious growth strategy to turn the challenges of mitigating global warming and environmental degradation into opportunities to transform the current EU socio-economic model into another more equitable and prosperous model, supported by a modern economy, in which economic growth is decoupled from the use of environmental resources. All this without leaving behind the people or territories within the European territory. It aims to achieve a sustainable future from the triple perspective of economic, social, and environmental.
Thus, it aims to reach a more competitive and modern Europe with zero net GHG by 2050. It also seeks an inclusive and just transition to a sustainable, green, and circular economy, transforming waste from the production system into valuable resources [5,6]. This plan focuses on the maintenance and protection of biodiversity and environmental sustainability through innovation in industries, enhancement of renewable energies and energy efficiency, and creation of more planet-friendly technologies together with economical and ecological transport [1,2,3,4].
The EGD will entail an economic and social transformation that requires for its success the inclusion of citizens and companies as well as the protection of the most vulnerable groups. The transition to renewable energies must be accompanied by labour reinsertion and compensation in low-income households for rising fuel prices [7]. This process can contribute to job creation and boost economic growth [8]. Besides, it implies changes in environmental and climate considerations at the political, institutional, regulatory, administrative, and individual levels. It requires the involvement of EU citizens and stakeholders in the process, as they will have to bear the costs and be aware of the changes [9].
This plan is also committed to a circular economy that transforms waste from the production system into valuable resources, instead of the linear model based on “take–make–dispose” [10]. This requires changes in all links of the value chain: processes, markets, marketing, and consumers [11]. This implies changes that require new technologies and innovations not only in production processes, but also in environmental assessments, commercial channels, financing, and society [12], affecting the economy, labour, and the well-being of citizens.
In addition, the EGD will use fiscal policy instruments (taxes, fees, and public expenditure on environmental protection) to achieve its goals. Among them, energy taxes regulated in the EU Energy Taxation Directive (ETD) have been in force since 2003. Studies such as Zaharia et al. [13] argue that this is an inaccurate energy taxation. This directive is currently under review to make the most polluting fuels the most heavily taxed as the assessment carried out in 2019 showed a need for change; i.e., “The Directive does not adequately promote greenhouse gas emissions reductions, energy efficiency and the take-up of electricity and alternative fuels (renewable hydrogen, synthetic fuels, advanced biofuels, etc.). The reason for this is that new, less carbon-intensive fuels are taxed as their fossil equivalent if the new fuel emerged since the 2003 adoption of the last ETD and therefore there is no explicit rate for it. Biofuels are disadvantaged by the volume-based taxation (rates expressed per litre)” [14]. In 2016, it was concluded that the classic taxation measures imposed should include taxation of excessive energy consumption and highly polluting energy products [15]. To achieve the target of reducing greenhouse gas emissions by at least 55% by 2030, it is necessary to increase the share of renewable energies and improve energy efficiency [16].
Therefore, it is intended to bring about a sweeping change that will affect the way of life and the objective and subjective well-being of EU citizens. For this reason, it is worth analyzing how these issues and the instruments of the EGD action plan affect the well-being of the European population by country. Other studies have asked how environmental tax reform can be implemented without reducing growth and social welfare [17], improving competitiveness [13] or ensuring green economic development [15]. Unlike them, we focus on the well-being of citizens. Well-being is a complex concept that has been studied by many authors both in its objective and subjective dimensions. From an objective perspective, well-being has been related to wealth [18], economic growth [19,20], education [21], health [22,23], environment [24,25], and energy [26,27]. Likewise, Emmerling et al. [28] associate increases in subjective personal well-being over time with factors of sustainable development and high technological and economic growth based on the consumption of fossil fuels, together with the rapid development of human capital. That is, with variables related to material living conditions and well-being status. Another study conducted in 43 sub-Saharan African (SSA) countries over the period 1990–2019 [29] shows that non-renewable energy consumption had a negative impact on quality of life, and the study by [30] reveals that renewable energy consumption and environmental quality (lower carbon emissions) increase subjective well-being in G20 countries and non-renewable energy consumption degrades subjective well-being. Although, another study demonstrates that subjective well-being, measured as life satisfaction, is not related to energy consumption [31].
Both happiness and well-being require a multidimensional perspective, given that they are influenced by political, economic, and cultural aspects, as well as physical and/or psychological variables [32]. Subjectively speaking, well-being as a concept is identified with abstract concepts such as happiness, satisfaction with different areas of their life or with personal relationships or the meaning of their life (eudemonic dimension), and/or stress. It is based on individuals’ self-reported perceptions and self-assessment of their life satisfaction [33]; these data have been structured into four main blocks for treatment: positive effect, negative effect, life satisfaction, and satisfaction domains [34].
However, the temporality of this emotional state is a limitation for researchers of subjective well-being; for this reason, numerous studies have focused on the stability of life satisfaction, obtaining contradictory results, given the temporal instability of the variables. In previous studies, life satisfaction shows temporal stability between 0.5 and 0.6 for six years [35], and 0.54 for four years in others [36]. For some authors, this temporal stability may be influenced by life events [37] or various factors, such as personality traits and/or age [38]. However, both the World Values Survey (WVS) and the European Values Study (EVS) provide data for 4-year waves of the life satisfaction indicator.
More and more authors are exploring the relationship between well-being and biodiversity and the environment, including [39], who show that human well-being is at risk without biodiversity. In the same vein, studies by [40,41] confirm a positive relationship between biodiversity and well-being. In turn, [42] analyzes the relationship between biodiversity and the subjective satisfaction of people living in cities, concluding that contact with plant nature positively affects satisfaction. In the same line are positioned the studies of [43,44,45,46], who add that a greater occupation of vegetation increases psychological benefits.
In the same vein are air and noise pollution indicators and climate change that negatively affect health and well-being [46,47]. Some results show that, the better the air quality, the greater the individual satisfaction [48], or that air pollution has a negative effect on life satisfaction [49]. In the opposite direction, noise negatively affects the quality of life [50,51] and, as it spreads faster than air pollution, it has a more significant negative impact on well-being [47]. Therefore, environmental sustainability and well-being are related [52].
Another factor to consider is climate change, with the increase in the temperature of the atmosphere and the oceans, the rise in sea level, the amount of ice on the earth’s surface, the increase in extreme natural disasters [53], and the oceanic ecosystem [54]. Heat waves will also increase in intensity and duration, and mortality rates will increase, directly related to cardiovascular or respiratory diseases [55,56]. Because of climate change, environmental changes will imply that the subjective well-being of people will vary, as it will be responsible for alterations in ecosystems and variations in water levels, in terms of both scarcity and excess, causing changes in the ecosystem [57].
In the face of this environmental deterioration, the circular economy is an instrument to fight against the depletion of natural resources and the generation of greenhouse gases, the main generators of which are the energy and construction sectors [6,58]. The circular economy focuses on environmental, social, and economic variables [59]. Currently, the countries that have invested the most in the circular economy with recycling and reuse of materials policies are countries with a high GDP, such as Austria, Germany, Belgium, Luxembourg, the Netherlands, Denmark, Finland, Ireland, Sweden, and the United Kingdom [60].
Another instrument for sustainability and environmental deterioration are environmental protection policies [61]; among them are the implementation of taxes as demand policy measures to make consumers change their behaviors concerning the acquisition, use, and demand of polluting products and services [62]. Among the most controversial taxes and charges are those that affect the price of energy as they increase energy poverty and, with it, welfare; in Europe, it mainly affects Central and Eastern European countries [27,63]. Currently, most countries have reduced the contribution of environmental tax revenues relative to total taxes and GDP and do not provide comprehensive information on their sustainability trajectories [64].
Therefore, given the need to implement the EGD and the few existing studies with disparate results regarding the relationships between well-being and the issues and instruments included in this Plan as a whole, it is worth asking how the deterioration of the environment, climate change, the circular economy, and the fiscal policies necessary to achieve the Plan affect the subjective well-being of EU citizens. Therefore, the main objective of this paper is to analyze the impact of the environment, climate change, circular economy, and fiscal policies—especially environmental and energy taxes—on life satisfaction, or subjective well-being, and its effects in 33 European countries (EU-28, Norway, Switzerland, Iceland, Serbia, Turkey).
This review of the available literature offers few results regarding life satisfaction and the variables related to the EGD action plan. Therefore, it seemed appropriate to focus our research on two different approaches to a single variable, life satisfaction (LS), which contains ten levels (1–10), and to explore it at the country level focusing on high levels of well-being (8–10) using four different models (two logit models and two ordinary least squares models). Two of them analyze the effect on life satisfaction of the variables of environmental problems, sustainability, and climate change that appear in the EGD and the other two analyze the effect of the instruments that the Plan will use to achieve its objectives, the circular economy, environmental protection expenditure, and investment in environmental protection. All of them include control variables. The analysis was carried out for the period 1999–2019 in 33 European countries. These models were used to test the following hypotheses:
Hypothesis 1 (H1).
Countries with higher pollution andother environmental problems have a lower proportion of citizens with life satisfaction levels equal to or higher than 8.
Hypothesis 2 (H2).
Countries with higher climate change impacts (change in methane levels and CO2 emissions) are less likely to have more than 35% of their citizens at SL levels 9 and 10 than those with lower values.
Hypothesis 3 (H3).
Countries with a higher percentage of GDP in private investments, jobs, and gross value added related to circular economy sectors have a higher percentage of citizens in SL levels equal to or higher than 8.
Hypothesis 4 (H4).
Countries with higher environmental and energy tax rates are less likely to have more than 35% of their citizens at satisfaction levels 9–10.
Hypothesis 5 (H5).
Countries with a higher percentage of GDP spent on environmental protection have a higher percentage of citizens with SL levels equal to or higher than 8.
The rest of the paper is structured as follows. At the end of the Introduction, the hypotheses are raised. In the next section, we describe the data and the methodology. The third section presents the results obtained in the study carried out. The last section contains the discussion and most essential conclusions obtained in this study. In this study, we have not introduced fixed effects that distinguish the peculiarities of the countries, as this would reduce the number of observations in the model.

2. Materials and Methods

Like other studies on subjective well-being, this paper used the World Values Survey (WVS), the European Values Study (EVS), and the World Bank and Eurostat databases. The WVS and EVS databases provided data on the dependent variable, life satisfaction, at the individual level [65,66]. The data obtained came from citizens of 33 countries, and the World Bank and Eurostat provided the data on the independent variables on the countries studied. All the above data sets were entered into Stata statistical software (version 16) for analysis.
The dependent variable (LS) was constructed in two different ways using data from thousands of surveys conducted between 1999 and 2019 by the World Values Survey and European Values Study groups in 33 countries to calculate percentages by level.
  • SL_8_10. It is a variable that shows the percentage by country of citizens at the level equal to or more than 8 of LS.
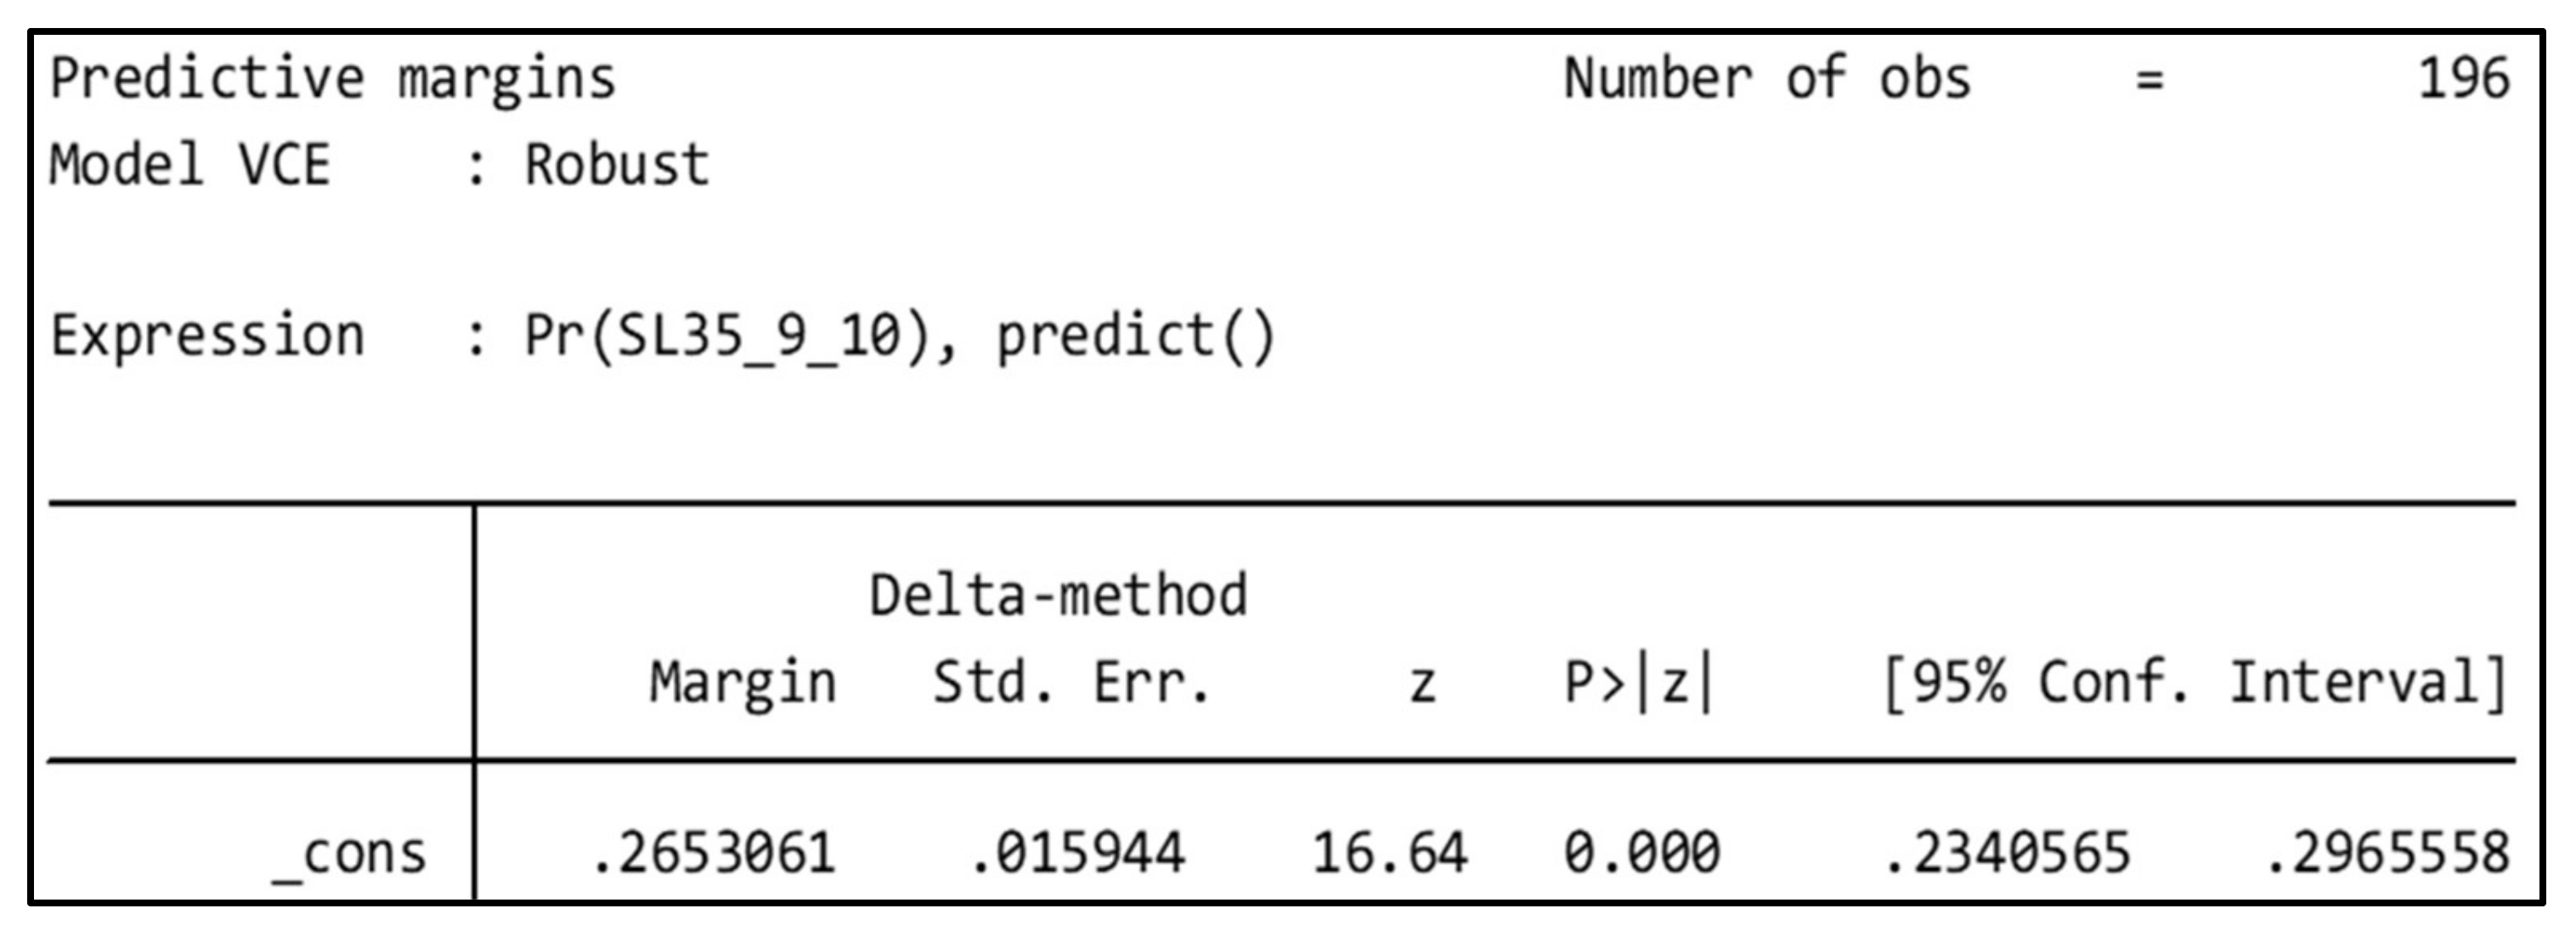
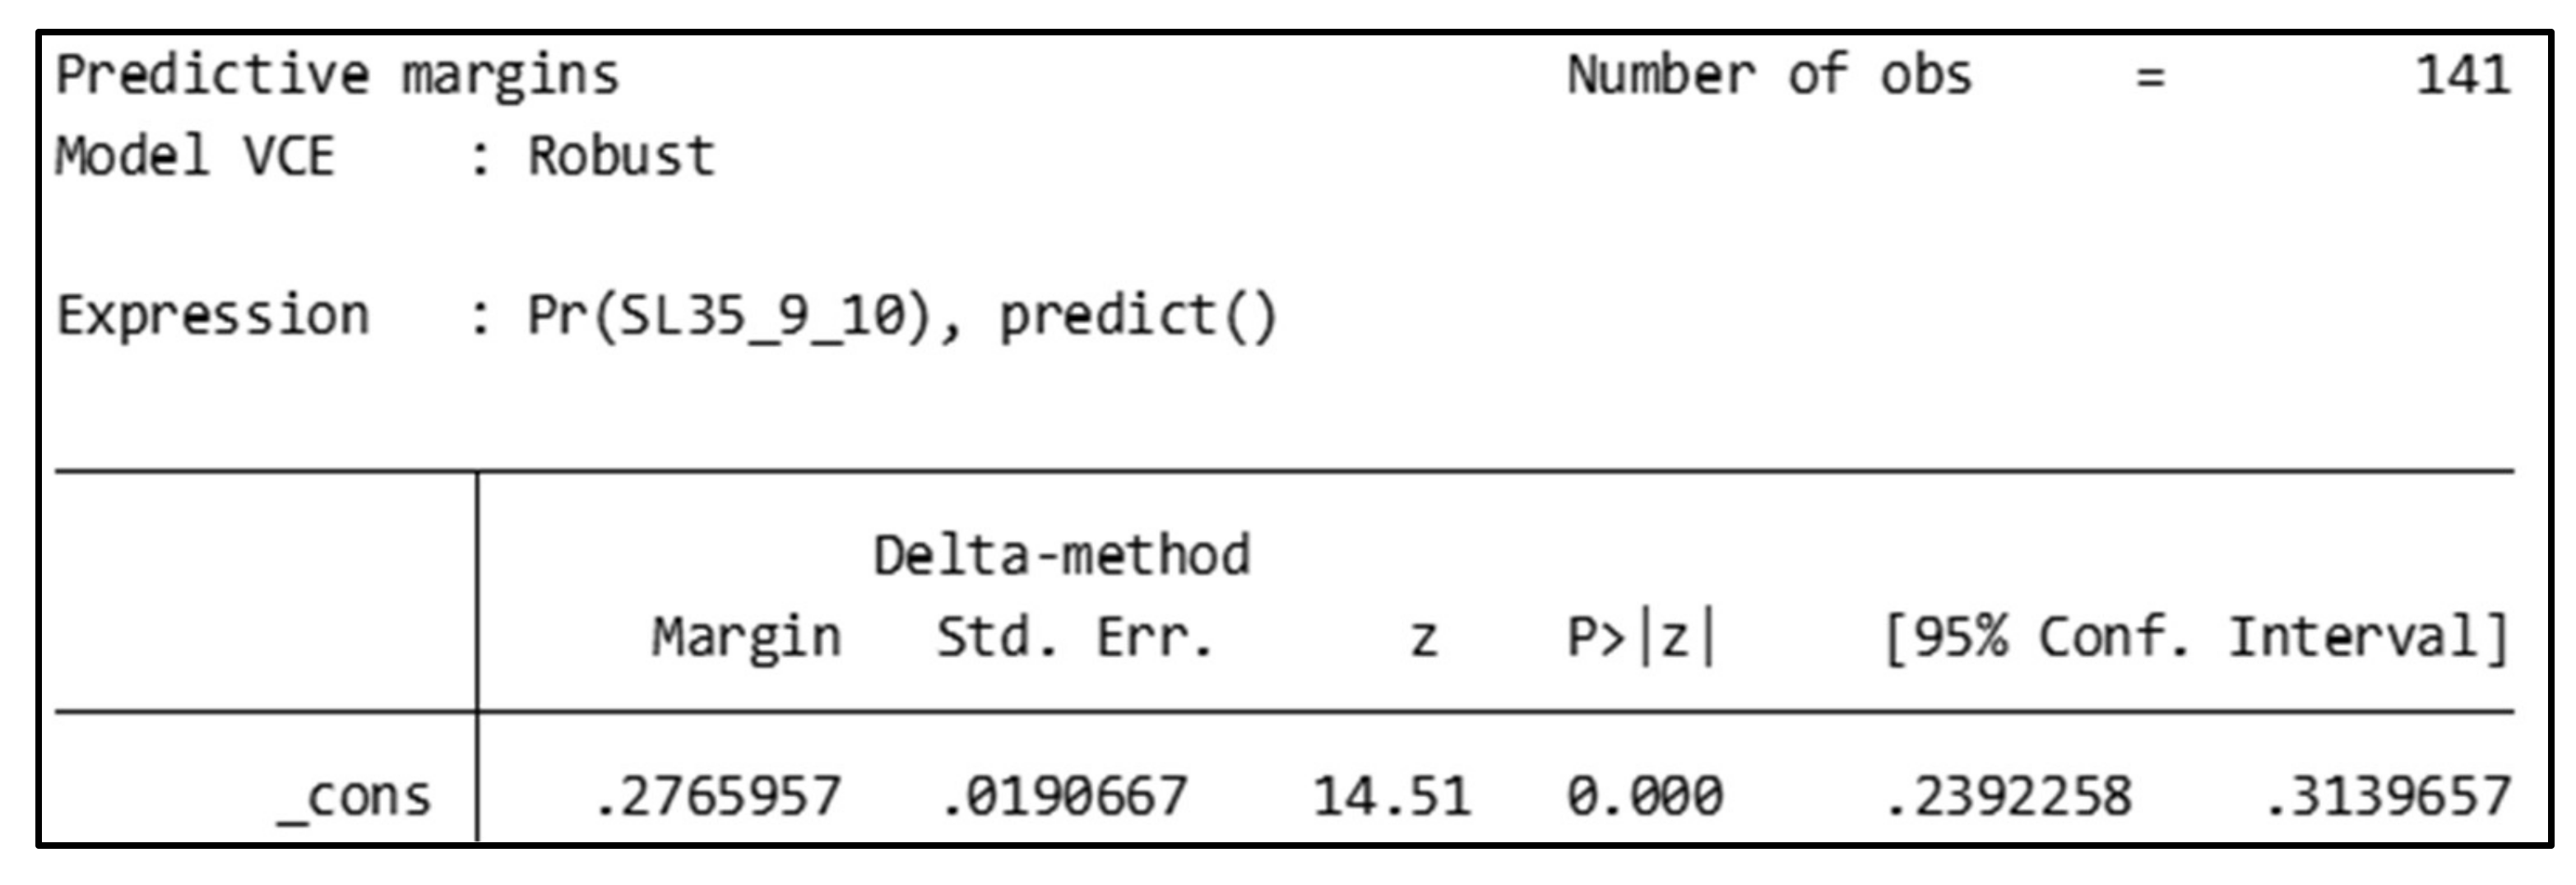
  • SL35_9_10. A dichotomous variable that takes a value of 0 when the condition is not met is that more than 35% of its citizens have a satisfaction level equal to or more than nine and the value 1 when the condition is met.
The independent variables were selected based on a preliminary analysis of indicators related to EGD (environment, sustainability, climate change, circular economy, environmental taxes, and environmental protection expenditure and investment) with Eurostat data and macroeconomic indicators such as unemployment (in percent), GDP per capita, GDP growth (in percent), life expectancy (years), Human Development Index (HDI, in percent), Gini Index (Gini, in percent), and poverty headcount ratio at $5.50 per day (Pov55, in percent).
Finally, we selected the following independent variables for the models:
A.
Indicators of EGD issues (environment, sustainability, and climate change).
  • ENV_PM10. Exposure to air pollution by particulate matter. Particulates < 10 µm.
  • ENV_polp. Pollution, grime, or other environmental problems. (% Total).
  • ENV_poln. Noise from neighbours or the street. (% Total).
  • CL_Met. Climate change indicator. Methane emissions (% change from 1990). World Development Indicators/Methane emissions (% change from 1990).
  • CL_CO2. Climate change indicator. CO2 emissions from solid fuel consumption (% of total)/Emisiones de CO2 por consumo de combustibles sólidos (% del total).
B.
Indicators of EGD instruments (circular economy, taxes, and environmental protection spending and investment).
  • CE_V_added. Private investments, jobs, and gross value added related to circular economy sectors. Value-added at factor cost—percentage of gross domestic product (GDP).
  • ENV_Tax. Total environmental taxes; percentage of gross domestic product (GDP).
  • E_Tax_House. Energy taxes by paying sector household.
  • E_Tax_Const Energy taxes by paying construction sector.
  • E_Tax_Servic Energy taxes by paying sector services (except wholesale and retail trade, transportation, and storage).
  • E_Tax_Primary energy taxes by paying sector agriculture, forestry, and fishing.
  • E_Tax_Wholesale energy taxes by paying sector wholesale and retail trade; repair of motor vehicles.
  • Tax_Rate_E. Implicit tax rate on energy; Euro per tonne of oil equivalent (TOE).
  • Exp_Env_GDP. National expenditure on environmental protection. Percentage of gross domestic product.
  • Inv_Env_GDP. Environmental protection investments of total economy. Percentage of gross domestic product (GDP).
C.
Macroeconomic control variables.
  • HDI. Human Development Index.
  • Pov55. Poverty headcount ratio at $5.50 a day (2011 PPP) (% of the population).
  • Gini. Gini Index.
  • lgGDPpc. Log GDP per capita.
  • nEmpl. Unemployment, total (% of total labor force. Our dependent variable SL is satisfaction with the life, measuring in country i how satisfied they are with their lives are its citizens at WVS wave t.
The model may be specified as
L S i t = β 0 + l = 1 , . b β l E N V i t + l = b + 1 , , d β l C C i t + l = g + 1 , h β l X i t + I W A V E t β d + 2 + ε i t
model 1 and 3
L S i t = β 0 + l = 1 , . a β l C E i t + l = a + 1 , , h β l T A X i t + l = h + 1 j β l E P i t + l = g + 1 , h β l X i t + I W A V E t β d + 2 + ε i t
Model 2 and 4.
Our dependent variable LS is life satisfaction, measuring in country i how satisfied its citizens are with their lives at WVS wave t. We include vectors whose variables have been mentioned previously. In models 1 and 3, the vectors are environment, climate change, and the control variables. In models 2 and 4, we include the instrumental vectors of circular economy, taxation, and environmental protection and the control variables. We also include dummy variables to control wave t fixed effects in I (WAVEt).
The results were achieved using different models as the dependent variable was processed in two ways. The first is a variable showing the percentage by country of citizens at the level equal to or more than eight (models 1 and 2). The second is a dichotomous variable that takes a value of 0 when not meeting the condition that more than 35% of its citizens have a satisfaction level equal to or more than nine, and the value 1 when the condition is met (models 3 and 4). In the first case, the models were performed by linear regression, and in the second, we used logit models [67,68,69]. In all models, we used the same control variables and fixed effects as described above.

3. Results

We built four robust models, three with dummy variables to control for t-surge fixed effects in the I (WAVEt) vectors. The results of models 1 and 2 (OLS) and 3 and 4 (logit) are shown in Table 1, and the marginal effects and odd ratios of models 3 and 4 are shown in Table 2.
Models 1 and 2 were performed as an ordinary least squares (OLS) regression with the dependent variable SL_8_10, which distributes life satisfaction with the percentage of citizens by country with satisfaction levels equal to or higher than 8 (the scale of the WVS survey item).
The results of model 1, which analyzes the effect of environmental problems, sustainability, and climate change on well-being, showed in Table 1 a positive significance at p < 0.01 with the control variable gross domestic product per capita (12.84 ***) and with lower significance and effect p < 0.05 with noise from neighbors or street (0.299 **) and p < 0.1 with CO2 emissions (0.0785 *). In addition, it presents an inverse significance at p < 0.01 with pollution, filth, or other environmental problems (−0.829 ***) and with the control variables Gini index (−0.818 ***) and unemployment (−0.483 ***).
On the other hand, model 2, which analyzes the effect of the instruments used in the plan with subjective well-being, shows a positive significance at p < 0.01 with private investments, employment, and gross value added related to the circular economy sectors (23.49 ***); environmental taxes (4.526 ***); energy taxes to the construction sector (1.151 ***); environmental protection expenditure (7.165 ***); and with the control variable human development index (164.5 ***) and a lower significance p < 0.05 with energy taxes by payment sector services. In the opposite direction, it shows a negative significance at p < 0.01 with household energy taxes (−0.257 ***), the primary sector −2.044 ***), and the implicit tax rate on energy (−0.0702 ***), as well as in the control variable poverty (−1.567 ***).
Models 3 and 4 treated the dependent variable as a dichotomous variable (SL35_9_10) with a value of 0 when not meeting the condition that more than 35% of its citizens have a level of satisfaction equal to or higher than nine, and a value of 1 when the condition is met. Two robust logit models were constructed with the independent variables, model 3 with the environmental problems, sustainability, and climate change and model 4 with the instruments that the plan will use to solve them. The results show a positive significance (p < 0.01) and, therefore, an increase in the probability that, in a country, more than 35% of its citizens have a level of satisfaction equal to or higher than 9 with the increase of the two variables CL_Met and CL_CO2 of climate change and the control variable GDP per capita in logarithm (model 3) and poverty and GDP per capita in logarithm (model 4).
The results also show inverse significance at p < 0.01 with the energy taxes by payment sector household (E_Tax_House), services except for wholesale and retail trade, transport and storage (E_Tax_Servic), and wholesale (E_Tax_Wholesale) variables; environmental protection expenditure (Exp_Env_GDP); and the Gini index (Gini) in model 4. Model 3 does not present any variable with inverse significance at p < 0.01.
The study of the marginal effect in model 3 shows how the probability of more than 35% of its citizens having a level of satisfaction equal to or higher than nine changes if the independent variables change by one unit. This positive effect is most potent for gross domestic product per capita (0.3320 ***) and CO2 emission (0.0063 ***). Overall, the marginal effect in model 3 is significant, positive, and shows a result of 0.2653 points; consequently, the probability that, in a country, more than 35% of its citizens have a level of satisfaction equal to or higher than 9 when all variables are averages is 26.53%, with 95% confidence that the probability is between 23.40% and 29.65% (Figure 1), and has a correct classification of 94.39% (88.46% sensitivity and 96.53% specificity).
The study of the marginal effect in model 4 shows the probability that a country has more than 35% of its citizens with a satisfaction level equal to or higher than nine. This positive effect is most potent for gross domestic product per capita (0.6771 ***) and investment in environmental protection (0.0887 ***) and inverse or negative for household energy taxes (E_Tax_House) and wholesale and retail trade and motor vehicle repair (E_Tax_Wholesale). Overall, the marginal effect in model 4 is significant, positive, and shows a result of 0.2766 points; consequently, the probability that, in a country, more than 35% of its citizens have a satisfaction level equal to or higher than 9 when all variables are averages is 27.66%, with 95% confidence that the probability is between 23.92% and 31.39% (Figure 2), and has a correct classification of 95.04% (84.62% sensitivity and 99.02% specificity).
Comparing models 1 and 3, we can be observed that, in the logit model (countries with a population with more than 35% of their citizens at satisfaction levels 9 and 10), the climate change variables are positive and significant, which is not the case in model 1, which presents a different treatment of the life satisfaction variable.
The case of models 2 and 4 that analyze the effects of life satisfaction with the tools to be used by the EGD action plan (circular economy, environmental taxes, and spending and investment in social protection) also present significant differences depending on the treatment of the variable SL, highlighting the positive significance in model 2 of the circular economy variable (CE_V_added), the environmental tax (ENV_Tax), and the construction sector energy tax (E_Tax_Const), which are not significant in model 4, and the change in significance from positive (model 2) to negative (model 4) of the environmental protection expenditure variable (Exp_Env_GDP).

4. Discussion and Conclusions

The analysis of the effect of the environmental variables analyzed is in line with the theoretical framework of this research; model 1 shows a significant negative effect p < 0.01 of pollution, grime, or other environmental problems with life satisfaction measured as the percentage of citizens with satisfaction values equal to or higher than 8 of −0.829 and of air pollution (ENV_PM10) of −0.153, although with a lower significance p < 0.1. Therefore, this significant inverse relationship is in line with hypothesis one and the studies of Luechinger [49]. In the opposite direction to the results of this work are the studies by Shepherd, et al. [47], Jarosińska, et al. [50], and Clark and Paunovic [51] on noise pollution, which, unlike ours, present an inverse relationship with well-being. Therefore, it would be interesting to go deeper into this topic, which in our case shows a direct relationship between life satisfaction and noise pollution (ENV_poln) with a significance of p < 0.05, thus indicating that those countries with higher noise from their neighbors in the street have a higher percentage of citizens with satisfaction higher than 8. We believe that it could be related to the typology of noise, the way of socializing, and the culture of the country, but we have not found studies to rely on.
Concerning the climate change variables analyzed, methane and CO2 emissions, it should be noted that model 3, unlike other studies such as [30], shows a positive and significant relationship between the change since 1990 of emissions in methane levels in the countries analyzed and in CO2 emissions with life satisfaction. These results on climate change variables also differ from the reviewed literature [53,54,55,56,57], although they would be in line with the works of [28,25] that reflect the positive relationship between fossil energy consumption, CO2 increase, and human well-being. Although, other studies such as [31] argue that subjective well-being is not related to energy consumption. Therefore, hypothesis 2 would be accepted. Although, it would be interesting to deepen the analysis of the effect of climate change with life satisfaction by broadening the variables of change, increasing the data, and introducing less developed countries.
Regarding the three tools used by the EGD action plan to fight against environmental degradation, sustainability, and climate change (models 2 and 4), model 2 shows a significant positive relationship with private investments, jobs, and gross value added to the circular economy sectors. Therefore, hypothesis 3 is accepted. This result is consistent with the study of Marino and Pariso [60] and the fact that the countries that have invested the most in circular economy with recycling and reuse of materials policies are countries with a high GDP, and this variable presents a direct positive relationship with life satisfaction.
In environmental and energy taxes, the effect depends on the type of tax and its destination. Model 2 shows a significant positive relationship at p < 0.01 with the environmental tax and the energy tax on construction and negative with the energy tax on the primary sector. The analysis of tax rates in model 4 shows a significant negative relationship with the increase of energy rates to households, businesses, and services in line with the studies on energy taxes in [63,64] and the argument for inaccurate energy taxation [13] and the need to change the form of taxation [14,15,16], and hypothesis 4 is accepted. Regarding environmental protection expenditure, the results show a significant positive relationship in model 2, in line with hypothesis 5 of the study.
Like other papers shown in the literature review, our work shows that the development and gross domestic product per capita control variables in Europe have a positive and significant relationship with the life satisfaction variable.
Another aspect that we would like to highlight is the difference in the effects according to the treatment of the subjective well-being variable. This difference could be observed in the results of model 1, where the environmental variables are significant, while in model 3, it is the climate change variables. The same happened in the analysis of the plan’s instruments (model 2 and 4). In these, the results of environmental expenditure stand out, which changes sign depending on the treatment of the variable.
In addition, when carrying out the study, we have encountered limitations in the data and variables to be analyzed. These are mainly with the sustainability indicators for which we have not found enough data from all the countries to be able to carry out the analysis. On the other hand, the analysis of the 33 countries instead of individuals has created limitations when introducing fixed effects that distinguish the peculiarities of the countries, although these are minor as the countries are located on the same continent.
It would be interesting and could be considered for future studies to analyze the effect of environmental problems such as global warming, climate change, and the sustainability of the planet on the well-being of people at the global level, both by country and individually.
On the other hand, it would be important to analyze the instruments that can be used to combat these problems at the global level with the aim of being able to carry out global policies that solve them, positively affecting welfare or harming it as little as possible.
To conclude, we believe that it is essential to take into account the well-being of citizens in the elaboration of public policies and in the implementation of measures to solve the problems facing the world today. To this end, it is necessary to carry out studies, as has been done in this paper, that show the effects of the problems on well-being, but also of the instruments and measures to be implemented to solve them so that the policies are not only effective, but also efficient in relation to the well-being of citizens.

Author Contributions

Conceptualization, M.O.-G.; G.C.-S. and C.E.-A.; methodology, M.O.-G.; software, M.O.-G.; validation, M.O.-G. and G.C.-S.; formal analysis, M.O.-G. and G.C.-S.; investigation, M.O.-G., G.C.-S. and C.E.-A.; resources M.O.-G. and C.E.-A.; Data curation, M.O.-G. and C.E.-A.; Writing—original draft, M.O.-G.; Writing—review & editing, M.O.-G. and G.C.-S.; Supervision, M.O.-G. and G.C.-S. All authors have read and agreed to the published version of the manuscript.

Funding

This publication and research have been (partially) granted by Department of General Economy, Universidad de Cádiz, Spain.

Institutional Review Board Statement

Not applicable.

Informed Consent Statement

Not applicable.

Data Availability Statement

As indicated, data used the World Values Survey (WVS), the European Values Study (EVS), the World Bank and Eurostat databases: https://www.worldvaluessurvey.org/wvs.jsp (accessed on 15 December 2020); https://europeanvaluesstudy.eu/methodology-data-documentation/ (accessed on 14 May 2021); https://databank.worldbank.org/home.aspx; https://ec.europa.eu/eurostat/data/database (accessed on 26 May 2021).

Conflicts of Interest

The authors declare no conflict of interest. The funders had no role in the design of the study; in the collection, analyses, or interpretation of data; in the writing of the manuscript; or in the decision to publish the results.

References

  1. European Environment Agency [EEA]. Climate Change Impacts and Vulnerability in Europe 2016 an Indicator-Based Report; EEA: Copenhagen, Denmark, 2017; p. 424, Report 1; Available online: https://www.eea.europa.eu/publications/climate-change-impacts-and-vulnerability-2016 (accessed on 15 February 2021). [CrossRef]
  2. Mei, H.; Li, Y.; Suo, C.; Ma, Y.; Lv, J. Analyzing the impact of climate change on energy-economy-carbon nexus system in China. Appl. Energy 2020, 262, 114568. [Google Scholar] [CrossRef]
  3. IPCC. Climate change 2021: The physical science basis. In Contribution of Working Group I to the Sixth Assessment Report of the Intergovernmental Panel on Climate Change; Masson-Delmotte, V., Zhai, P., Pirani, A., Connors, S.L., Péan, C., Berger, S., Caud, N., Chen, Y., Goldfarb, L., Gomis, M.I., et al., Eds.; Cambridge University Press: Cambridge, UK, 2021. [Google Scholar]
  4. Nejat, P.; Jomehzadeh, F.; Taheri, M.M.; Gohari, M.; Majid, M.Z. A global review of energy consumption, CO2 emissions and policy in the residential sector (with an overview of the top ten CO2 emitting countries). Renew. Sustain. Energy Rev. 2015, 43, 843–862. [Google Scholar] [CrossRef]
  5. European Commission, Directorate-General for Climate Action. Procedure 2020/0036/COD of the European Parliament of the 4 March 2020. Proposal of The European Parliament and of The Council Establishing the Framework for Achieving Climate Neutrality and Amending Regulation (EU) 2018/1999 (European Climate Law) 2020. Available online: https://eur-lex.europa.eu/legalcontent/ES/ALL/?uri=CELEX:52020PC0080 (accessed on 7 May 2021).
  6. Bonoli, A.; Zanni, S.; Serrano-Bernardo, F. Sustainability in building and construction within the framework of circular cities and European New Green Deal. The contribution of concrete recycling. Sustainability 2021, 13, 2139. [Google Scholar] [CrossRef]
  7. Claeys, G.; Tagliapietra, S.; Zachmann, G. How to Make the European Green Deal Work. Bruegel Policy Contribution. 2019. Available online: http://www.jstor.org/stable/resrep28626 (accessed on 9 August 2021).
  8. Simionescu, M.; Păuna, C.B.; Diaconescu, T. Renewable energy and economic performance in the context of the European Green Deal. Energies 2020, 13, 6440. [Google Scholar] [CrossRef]
  9. Sikora, A. European Green Deal—Legal and financial challenges of the climate change. ERA Forum 2021, 21, 681–697. [Google Scholar] [CrossRef]
  10. Smol, M.; Kulczycka, J.; Henclik, A.; Gorazda, K.; Wzorek, Z. The possible use of sewage sludge ash (SSA) in the construction industry as a way towards a circular economy. J. Clean. Prod. 2015, 95, 45–54. [Google Scholar] [CrossRef]
  11. Kiss, K.; Ruszkai, C.; Takács-György, K. Examination of short supply chains based on circular economy and sustainability aspects. Resources 2019, 8, 161. [Google Scholar] [CrossRef] [Green Version]
  12. Smol, M.; Marcinek, P.; Duda, J.; Szołdrowska, D. Importance of sustainable mineral resource management in implementing the circular economy (CE) model and the European Green Deal strategy. Resources 2020, 9, 55. [Google Scholar] [CrossRef]
  13. Zaharia, M.; Pătrașcu, A.; Gogonea, M.R.; Tănăsescu, A.; Popescu, C. A cluster design on the influence of energy taxation in shaping the new EU-28 economic paradigm. Energies 2017, 10, 257. [Google Scholar] [CrossRef] [Green Version]
  14. European Comission. Proposal for a Council Directive Restructuring the Union Framework for the Taxation of Energy Products and Electricity. Available online: https://ec.europa.eu/info/law/better-regulation/have-your-say/initiatives/12227-Pacto-Verde-Europeo-revision-de-la-Directiva-sobre-fiscalidad-de-la-energia_es (accessed on 14 July 2021).
  15. Andrei, J.; Mieila, M.; Popescu, G.H.; Nica, E.; Cristina, M. The impact and determinants of environmental taxation on economic growth communities in Romania. Energies 2016, 9, 902. [Google Scholar] [CrossRef] [Green Version]
  16. European Union. Decarbonizing our Energy System to Meet Our Climate Goals 2021. Available online: https://ec.europa.eu/commission/presscorner/detail/en/fs_21_3672 (accessed on 20 February 2021).
  17. Oueslati, W. Environmental tax reform: Short-term versus long-term macroeconomic effects. J. Macroecon. 2014, 40, 190–201. [Google Scholar] [CrossRef]
  18. D’Acci, L. Measuring well-being and progress. Soc. Indic. Res. 2011, 104, 47–65. [Google Scholar] [CrossRef] [Green Version]
  19. Cibulka, S.; Giljum, S. Towards a comprehensive framework of the relationships between resource footprints, quality of life, and economic development. Sustainability 2020, 12, 4734. [Google Scholar] [CrossRef]
  20. Easterlin, R.A. Happiness, growth, and public policy. Econ. Inq. 2013, 51, 1–15. [Google Scholar] [CrossRef] [Green Version]
  21. Frey, B.S.; Stutzer, A. Maximizing happiness? Ger. Econ. Rev. 2000, 1, 145–167. [Google Scholar] [CrossRef]
  22. Dolan, P.; White, M.P. How can measures of subjective well-being be used to inform public policy? Perspect. Psychol. Sci. 2007, 2, 71–85. [Google Scholar] [CrossRef]
  23. Gorry, A.; Gorry, D.; Slavov, S.N. Does retirement improve health and life satisfaction? Health Econ. 2018, 27, 2067–2086. [Google Scholar] [CrossRef]
  24. Li, Q.; Chen, H. The relationship between human well-being and carbon emissions. Sustainability 2021, 13, 547. [Google Scholar] [CrossRef]
  25. Diffenbaugh, N.S. Human well-being, the global emissions debt, and climate change commitment. Sustain. Sci. 2013, 8, 135–141. [Google Scholar] [CrossRef]
  26. Sompolska-Rzechuła, A.; Kurdyś-Kujawska, A. Towards understanding interactions between sustainable development goals: The role of climate-well-being linkages. Experiences of EU countries. Energies 2021, 14, 2025. [Google Scholar] [CrossRef]
  27. Thomson, H.; Snell, C.; Bouzarovski, S. Health, Well-Being and Energy Poverty in Europe: A Comparative Study of 32 European Countries. Int. J. Environ. Res. Public Health 2017, 14, 584. [Google Scholar] [CrossRef] [Green Version]
  28. Emmerling, J.; Navarro, P.; Sisco, M.R. Subjective well-being at the macro level—Empirics and future scenarios. Soc. Indic. Res. 2021. [Google Scholar] [CrossRef]
  29. Ibrahim, R.L.; Julius, O.O.; Nwokolo, I.C.; Ajide, K.B. The role of technology in the non-renewable energy consumption-quality of life nexus: Insights from sub-Saharan African countries. Econ. Chang. Restruct. 2021. [Google Scholar] [CrossRef]
  30. Kumari, N.; Kumar, P.; Sahu, N.C. Do energy consumption and environmental quality enhance subjective wellbeing in G20 countries? Environ. Sci. Pollut. Res. 2021. [Google Scholar] [CrossRef]
  31. Okulicz-Kozaryn, A.; Altman, M. The happiness-energy paradox: Energy use is unrelated to subjective well-being. Appl. Res. Qual. Life 2019, 15, 1055–1067. [Google Scholar] [CrossRef]
  32. Ripoll, R.; Marchena, D.J.; Montañés Del Rio, M.Á. Happiness management en la época de la industria 4.0. Retos 2019, 9, 189–202. [Google Scholar] [CrossRef] [Green Version]
  33. Kim-Prieto, C.; Diener, E.; Tamir, M.; Scollon, C.; Diener, M. Integrating the diverse definitions of happiness: A time-sequential framework of subjective well-being. J. Happiness Stud. 2005, 6, 261–300. [Google Scholar] [CrossRef]
  34. Diener, E. Assessing subjective well-being: Progress and opportunities. Soc. Indic. Res. 1994, 31, 103–157. [Google Scholar] [CrossRef]
  35. Zika, S.; Chamberlain, K. On the relation between meaning in life and psychological well-being. Br. J. Psychol. 1992, 83, 133–145. [Google Scholar] [CrossRef]
  36. Pavot, W.; Diener, E. Review of the satisfaction with life scale. In Assessing Well-Being; Diener, E., Ed.; Springer: Dordrecht, The Netherlands, 2009; pp. 101–117. [Google Scholar] [CrossRef]
  37. Fujita, F.; Diener, E. Life satisfaction set point: Stability and change. J. Personal. Soc. Psychol. 2005, 88, 158–164. [Google Scholar] [CrossRef]
  38. Ehrhardt, J.J.; Saris, W.E.; Veenhoven, R. Stability of life-satisfaction over time. J. Happiness Stud. 2000, 1, 177–205. [Google Scholar] [CrossRef]
  39. Rinawati, F.; Stein, K.; Lindner, A. Climate change impacts on biodiversity—The setting of a lingering global crisis. Diversity 2013, 5, 114–123. [Google Scholar] [CrossRef] [Green Version]
  40. Grinde, B.; Patil, G.G. Biophilia: Does visual contact with nature impact on health and well-being? Int. J. Environ. Res. Public Health 2009, 6, 2332–2343. [Google Scholar] [CrossRef] [PubMed] [Green Version]
  41. Chang, K.G.; Sullivan, W.C.; Lin, Y.-H.; Su, W.; Chang, C.-Y. The effect of biodiversity on green space users’ wellbeing—An empirical investigation using physiological evidence. Sustainability 2016, 8, 1049. [Google Scholar] [CrossRef] [Green Version]
  42. Hepburn, L.; Smith, A.C.; Zelenski, J.; Fahrig, L. Bird diversity unconsciously increases people’s satisfaction with where they live. Land 2021, 10, 153. [Google Scholar] [CrossRef]
  43. Zhang, Y.; Van den Berg, A.E.; Van Dijk, T.; Weitkamp, G. Quality over quantity: Contribution of urban green space to neighborhood satisfaction. Int. J. Environ. Res. Public Health 2017, 14, 535. [Google Scholar] [CrossRef] [PubMed]
  44. Jiricka-Pürrer, A.; Tadini, V.; Salak, B.; Taczanowska, K.; Tucki, A.; Senes, G. Do protected areas contribute to health and well-being? A cross-cultural comparison. Int. J. Environ. Res. Public Health 2019, 16, 1172. [Google Scholar] [CrossRef] [Green Version]
  45. Schebella, M.F.; Weber, D.; Schultz, L.; Weinstein, P. The wellbeing benefits associated with perceived and measured biodiversity in australian urban green spaces. Sustainability 2019, 11, 802. [Google Scholar] [CrossRef] [Green Version]
  46. Ojala, M. Coping with climate change among adolescents: Implications for subjective well-being and environmental engagement. Sustainability 2013, 5, 2191–2209. [Google Scholar] [CrossRef] [Green Version]
  47. Shepherd, D.; Dirks, K.; Welch, D.; McBride, D.; Landon, J. The covariance between air pollution annoyance and noise annoyance, and its relationship with health-related quality of life. Int. J. Environ. Res. Public Health 2016, 13, 792. [Google Scholar] [CrossRef] [Green Version]
  48. Liu, W.; Xu, Z.; Yang, T. Health effects of air pollution in China. Int. J. Environ. Res. Public Health 2018, 15, 1471. [Google Scholar] [CrossRef] [PubMed] [Green Version]
  49. Luechinger, S. Life satisfaction and transboundary air pollution. Econ. Lett. 2010, 107, 4–6. [Google Scholar] [CrossRef]
  50. Jarosińska, D.; Héroux, M.-È.; Wilkhu, P.; Creswick, J.; Verbeek, J.; Wothge, J.; Paunović, E. Development of the WHO environmental noise guidelines for the European region: An introduction. Int. J. Environ. Res. Public Health 2018, 15, 813. [Google Scholar] [CrossRef] [Green Version]
  51. Clark, C.; Paunovic, K. WHO environmental noise guidelines for the European region: A systematic review on environmental noise and quality of life, wellbeing and mental health. Int. J. Environ. Res. Public Health 2018, 15, 2400. [Google Scholar] [CrossRef] [Green Version]
  52. Solano-Pinto, N.; Garrido, D.; Gértrudix-Barrio, F.; Fernández-Cézar, R. Is knowledge of circular economy, pro-environmental behavior, satisfaction with life, and beliefs a predictor of connectedness to nature in rural children and adolescents? A pilot study. Sustainability 2020, 12, 9951. [Google Scholar] [CrossRef]
  53. Sa’Adin, S.L.B.; Kaewunruen, S.; Jaroszweski, D. Risks of climate change with respect to the Singapore—Malaysia high speed rail system. Climate 2016, 4, 65. [Google Scholar] [CrossRef] [Green Version]
  54. Visbeck, M.; Keiser, S. Climate change and its impact on the ocean. In Transitioning to Sustainable Life Below Water; Hornidge, A.K., Ekau, W., Eds.; MDPI: Basel, Switzerland, 2021; pp. 1–21. [Google Scholar] [CrossRef]
  55. Zacharias, S.; Koppe, C.; Mücke, H.-G. Climate change effects on heat waves and future heat wave associated IHD mortality in Germany. Climate 2015, 3, 100–117. [Google Scholar] [CrossRef] [Green Version]
  56. Synnefa, A.; Haddad, S.; Rajagopalan, P.; Santamouris, M. SI: Survivability under overheating: The impact of regional and global climate change on the vulnerable and low-income population. Climate 2020, 8, 122. [Google Scholar] [CrossRef]
  57. Vido, J.; Nalevanková, P. Impact of natural hazards on forest ecosystems and their surrounding landscape under climate change. Water 2021, 13, 979. [Google Scholar] [CrossRef]
  58. Lyeonov, S.; Pimonenko, T.; Bilan, Y.; Štreimikienė, D.; Mentel, G. Assessment of green investments’ impact on sustainable development: Linking gross domestic product per capita, greenhouse gas emissions and renewable energy. Energies 2019, 12, 3891. [Google Scholar] [CrossRef] [Green Version]
  59. Hysa, E.; Kruja, A.; Rehman, N.U.; Laurenti, R. Circular economy innovation and environmental sustainability impact on economic growth: An integrated model for sustainable development. Sustainability 2020, 12, 4831. [Google Scholar] [CrossRef]
  60. Marino, A.; Pariso, P. Comparing european countries′ performances in the transition towards the circular economy. Sci. Total. Environ. 2020, 729, 138142. [Google Scholar] [CrossRef]
  61. Onofrei, M.; Gavriluţă, A.-F.; Bostan, I.; Filip, B.F.; Popescu, C.L.; Jitaru, G. Impacts of the allocation of governmental resources for improving the environment. An empirical analysis on developing european countries. Int. J. Environ. Res. Public Health 2020, 17, 2783. [Google Scholar] [CrossRef] [PubMed] [Green Version]
  62. Liobikienė, G.; Butkus, M.; Matuzevičiūtė, K. The contribution of energy taxes to climate change policy in the European Union (EU). Resources 2019, 8, 63. [Google Scholar] [CrossRef] [Green Version]
  63. Borozan, D. Efficiency of energy taxes and the validity of the residential electricity environmental kuznets curve in the European Union. Sustainability 2018, 10, 2464. [Google Scholar] [CrossRef] [Green Version]
  64. Andreoni, V. Environmental taxes: Drivers behind the revenue collected. J. Clean. Prod. 2019, 221, 17–26. [Google Scholar] [CrossRef]
  65. Systems Institute & WVSA Secretariat. World Values Survey: All Rounds—Country-Pooled Datafile; Inglehart, R., Haerpfer, C., Moreno, A., Welzel, C., Kizilova, K., Diez-Medrano, J., Lagos, M., Norris, P., Ponarin, E., Puranen, B., et al., Eds.; Systems Institute & WVSA Secretariat: Madrid, Spain, 2020; Available online: http://www.worldvaluessurvey.org/WVSDocumentationWVL.jsp (accessed on 20 November 2020).
  66. European Values Study 2017. Integrated Dataset (EVS 2017). ZA7500 Data file Version 4.0. GESIS Data Archive: Cologne, Germany. Available online: https://doi.org/10.4232/1.13560 (accessed on 18 October 2020).
  67. Aldrich, J.H.; Nelson, F.D. Quantitative Applications in The Social Sciences: Linear Probability, Logit, and Probit Models; SAGE Publications Inc.: Thousand Oaks, CA, USA, 1984. [Google Scholar] [CrossRef]
  68. Hosmer, D.; Lemeshow, S. Stepwise logistic regression. In Applied Logistic Regression; John Wiley & Sons: New York, NY, USA, 2000; Chapter 4; pp. 116–121. [Google Scholar]
  69. Cramer, J. Logit Models from Economics and Other Fields; Cambridge University Press: Cambridge, UK, 2003. [Google Scholar] [CrossRef] [Green Version]
Figure 1. Predictive margins of model 3.
Energies 14 05839 g001
Figure 2. Predictive margins of model 4.
Energies 14 05839 g002
Table 1. Logit and linear regression model.
Model 1
Regress
Model 2 RegressModel 3
Logit
Model 4
Logit
VARIABLESSL_8_10SL_8_10SL35_9_10SL35_9_10
ENV_PM10−0.153 * −0.0273
(0.0808) (0.0461)
ENV_polp−0.829 *** −0.0753
(0.154) (0.102)
ENV_poln0.299 ** −0.0833
(0.150) (0.117)
CL_Met−0.0281 0.0816 ***
(0.0247) (0.0280)
CL_CO20.0785 * 0.127 ***
(0.0444) (0.0422)
CE_V_added 23.49 ***
(4.821)
ENV_Tax 4.526 ***
(1.204)
E_Tax_House −0.257 *** −0.34 2 ***
(0.0928) (0.109)
E_Tax_Const 1.151 ***
(0.388)
E_Tax_Servic 0.747 ** −1.054 ***
(0.314) (0.247)
E_Tax_Primary −2.044 ***
(0.525)
E_Tax_Wholesale −1.212 ***
(0.331)
Tax_Rate_E −0.0702 ***
(0.0133)
Exp_Env_GDP 7.165 *** −4.533 ***
(1.797) (1.403)
Inv_Env_GDP −4.990 * 1.718
(2.607) (1.154)
IDH 164.5 ***
(31.71)
Pov55 −1.567 *** 0.710 ***
(0.543) (0.250)
Gini−0.818 *** −0.308 **
(0.164) (0.142)
lgGDPpc12.84 *** 6.725 ***13.12 ***
(1.531) (1.895)(2.235)
UnEmpl−0.483 *** −0.757 **
(0.185) (0.301)
2.wave−1.299 −0.771
(1.538) (1.299)
3.wave−2.562−3.116−1.253
(1.855)(3.493)(1.353)
4.wave 0.511
(3.396)
Constant−40.12 **−109.4 ***−65.81 ***−90.77 ***
(20.21)(28.54)(21.69)(15.49)
Observations194101196141
R-squared0.7970.824
Pseudo R2 0.71350.7124
Robust standard errors in parentheses *** p < 0.01, ** p < 0.05, * p < 0.1.
Table 2. Margins and odds ratios.
VARIABLESModel 3
dx/dy
Model 4
dx/dy
Model 3
Odds Ratio
Model 4
Odds Ratio
SL35_9_10SL35_9_10SL35_9_10SL35_9_10
ENV_PM10−0.0013479 0.9730642
ENV_polp−0.0037186 0.9274384
ENV_polp−0.00411 0.9201159
CL_Met0.0040282 *** 1.085021 ***
CL_CO20.0062665 *** 1.13535 ***
lgGDPpc0.3319991 *** 833.2508***
UnEmpl−0.0373774 ** 0.4689974 **
wave
2−0.0405994 0.4623935
3−0.0642236 0.2856696
E_Tax_House −0.0176565 *** 0.7103508 ***
E_Tax_Wholesale −0.0625616 *** 0.2976664 ***
E_Tax_Servic −0.0544215 0.3485014
Exp_Env_GDP −0.2340095 0.0107524
Inv_Env_GDP 0.0886884 *** 5.572496 ***
lgGDPpc 0.6771198 *** 496,542 ***
Gini −0.0159009 0.7349218
Pov55 0.0366392 2.03334
Robust standard errors in parentheses *** p < 0.01, ** p < 0.05, * p < 0.1.
Publisher’s Note: MDPI stays neutral with regard to jurisdictional claims in published maps and institutional affiliations.

