
Effect of Traffic Calming in a Downtown District of Szczecin, Poland


Abstract
1. Introduction
2. Materials and Methods
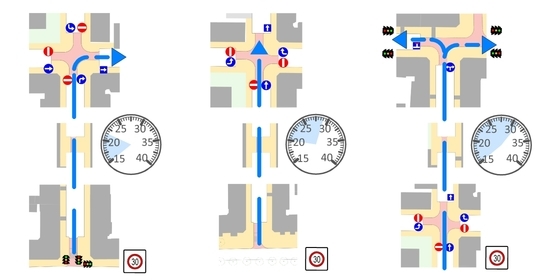
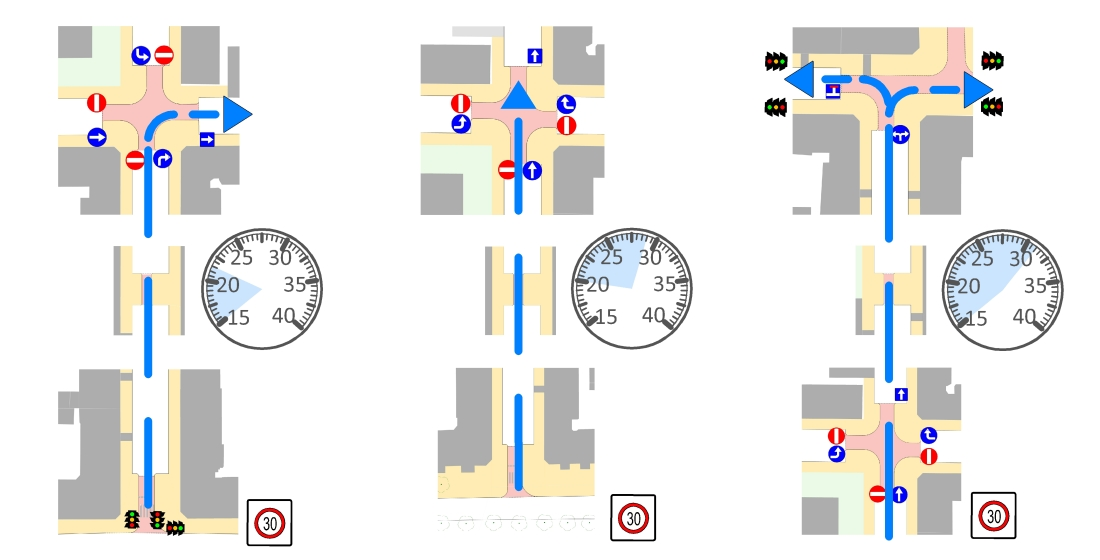
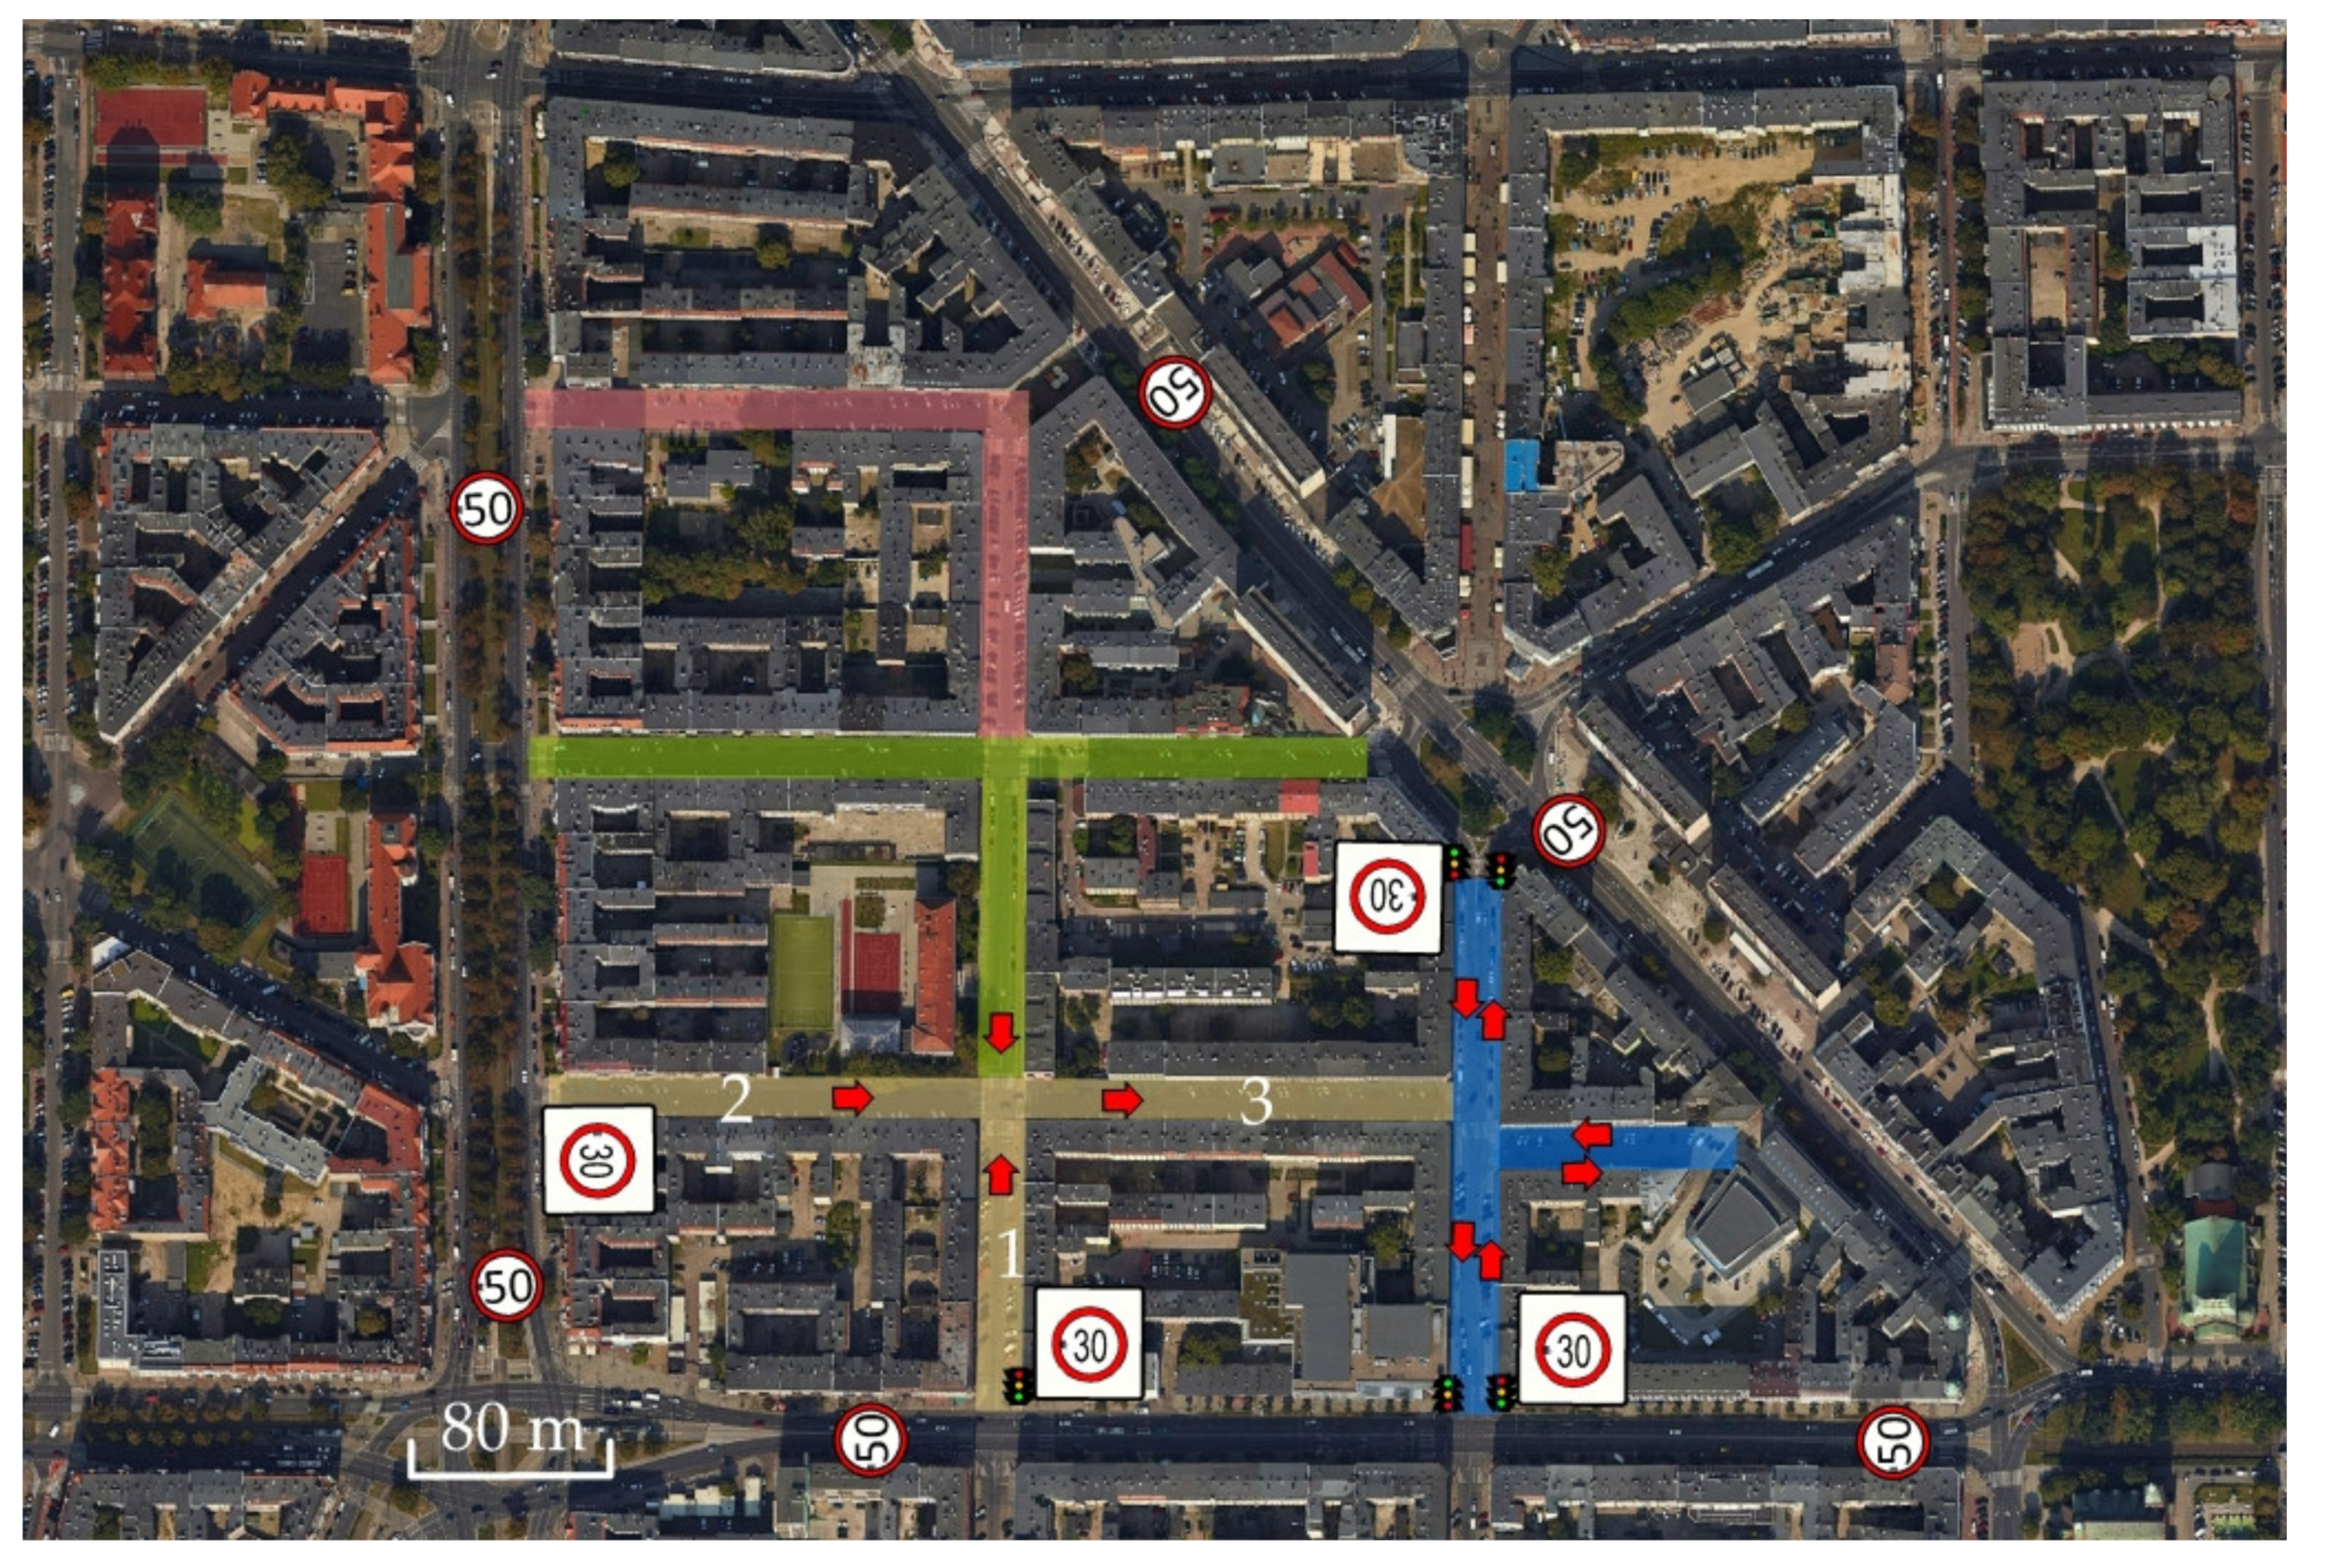
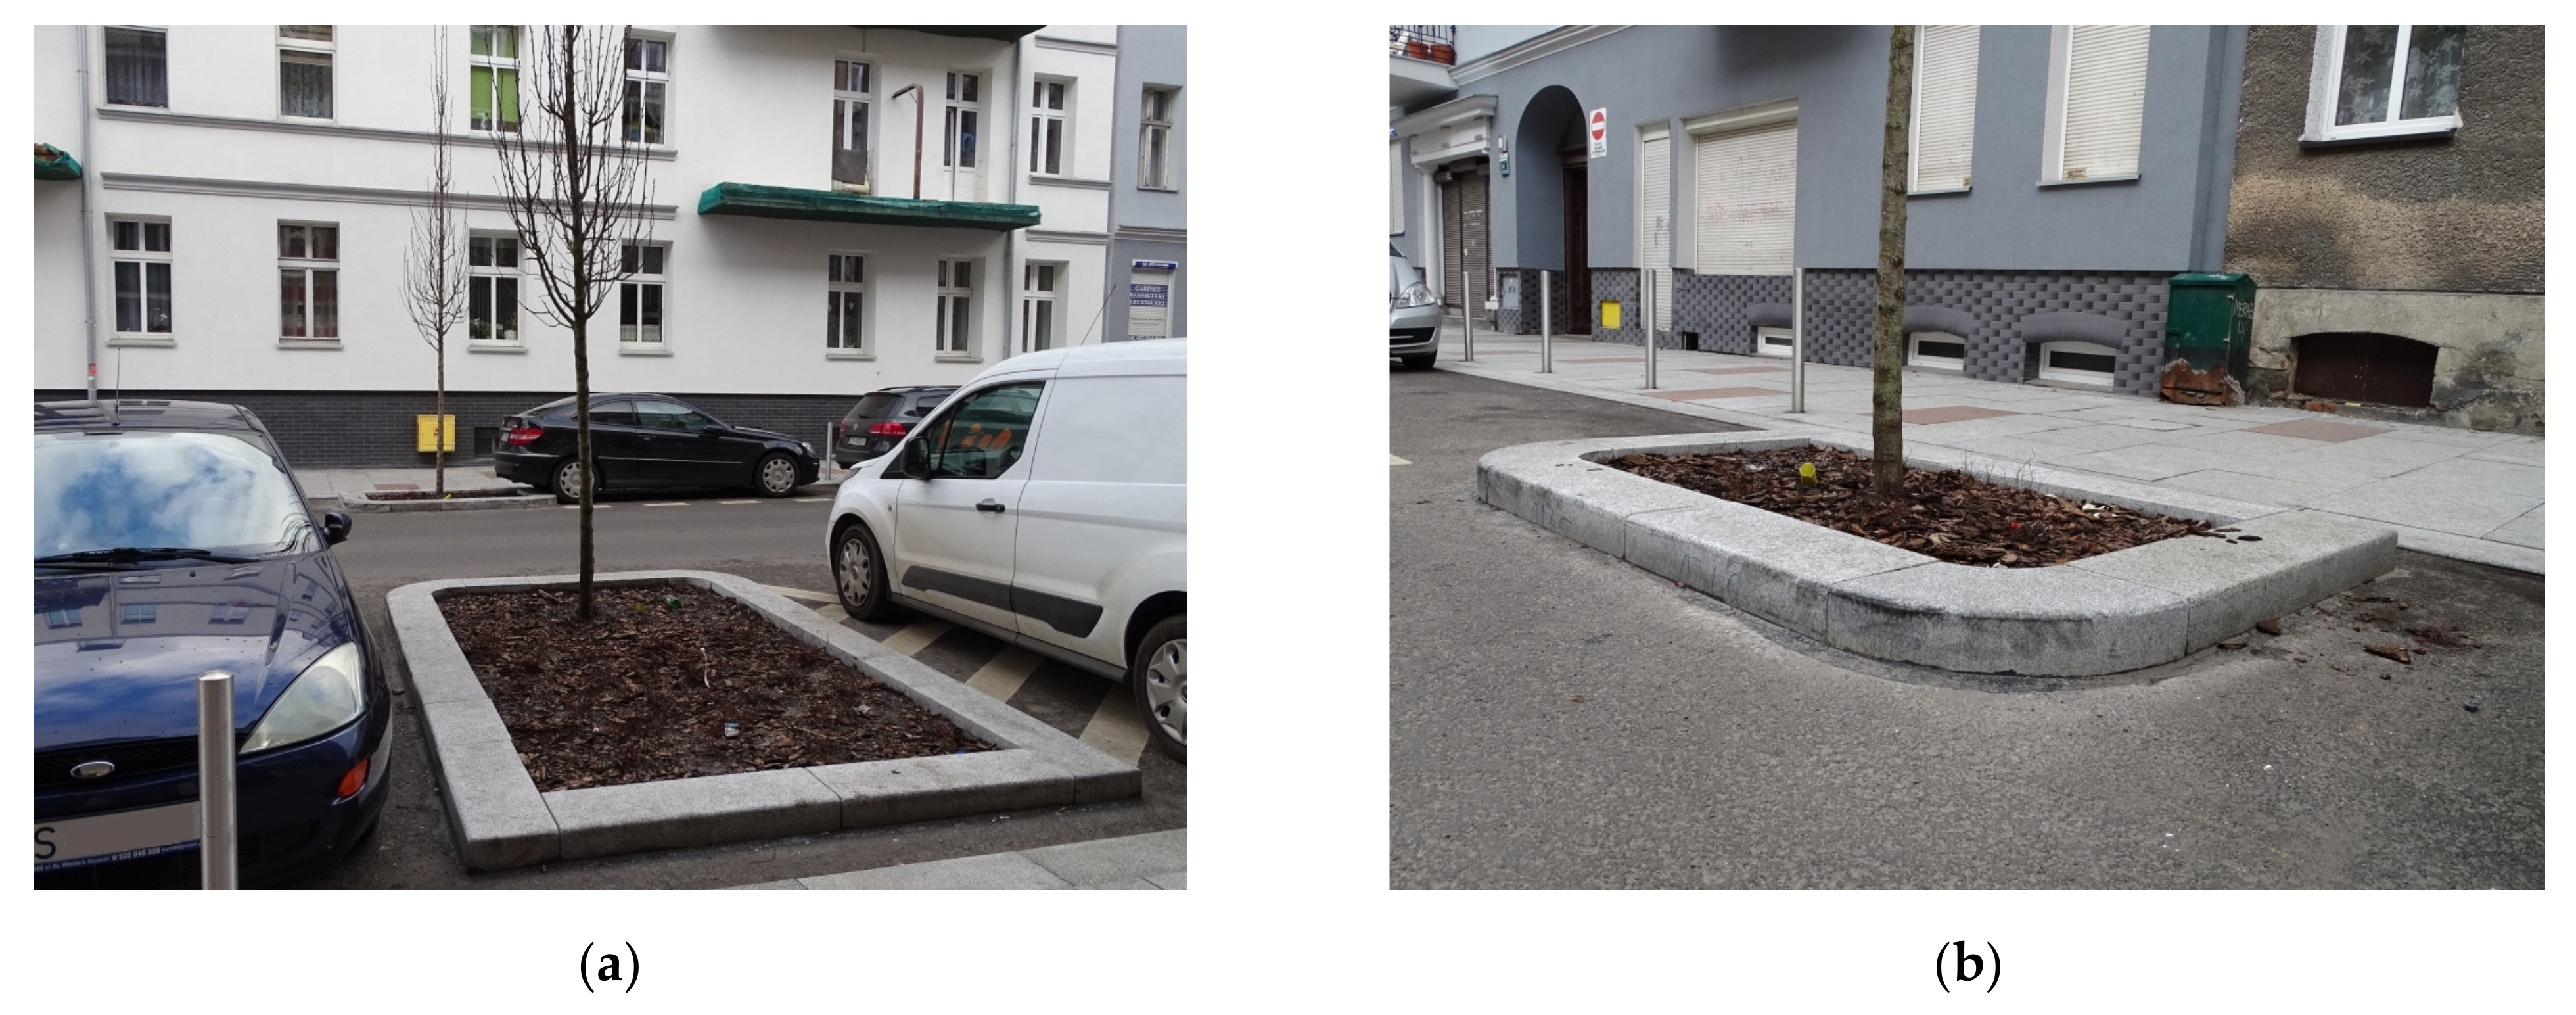
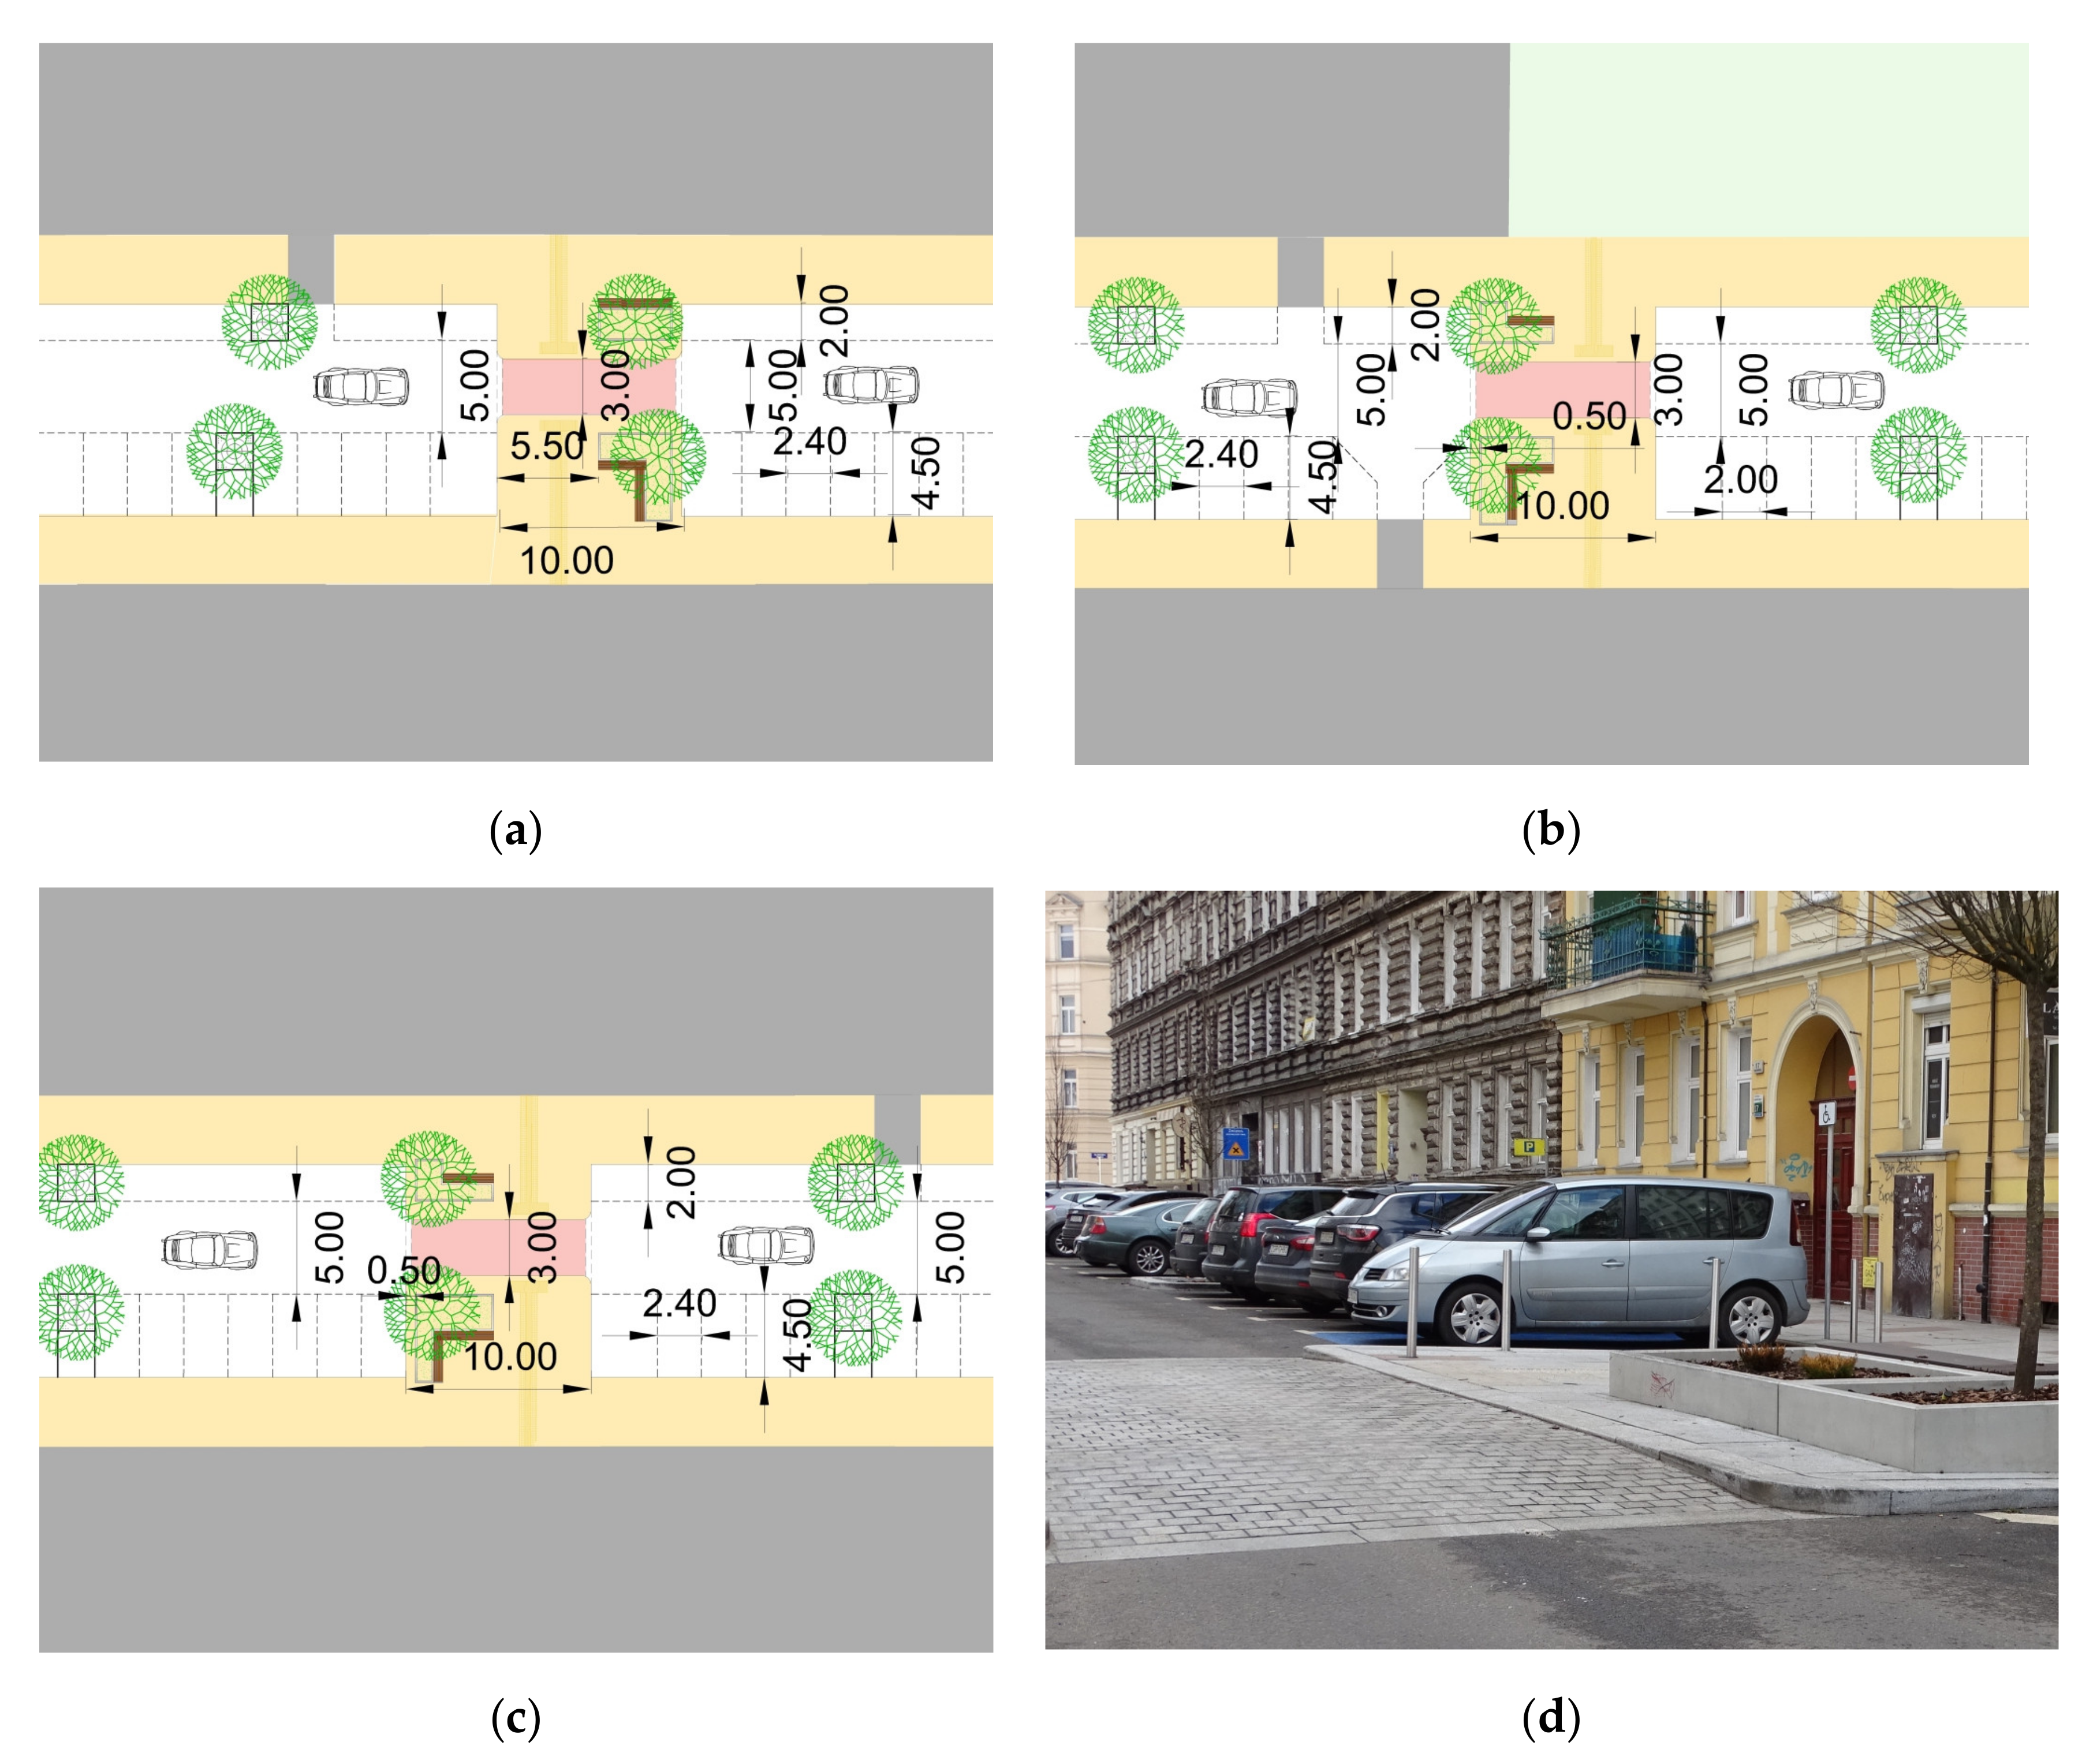
2.1. Subject of Study and Testing Ground
2.2. Measurement Method
2.3. Research Methods
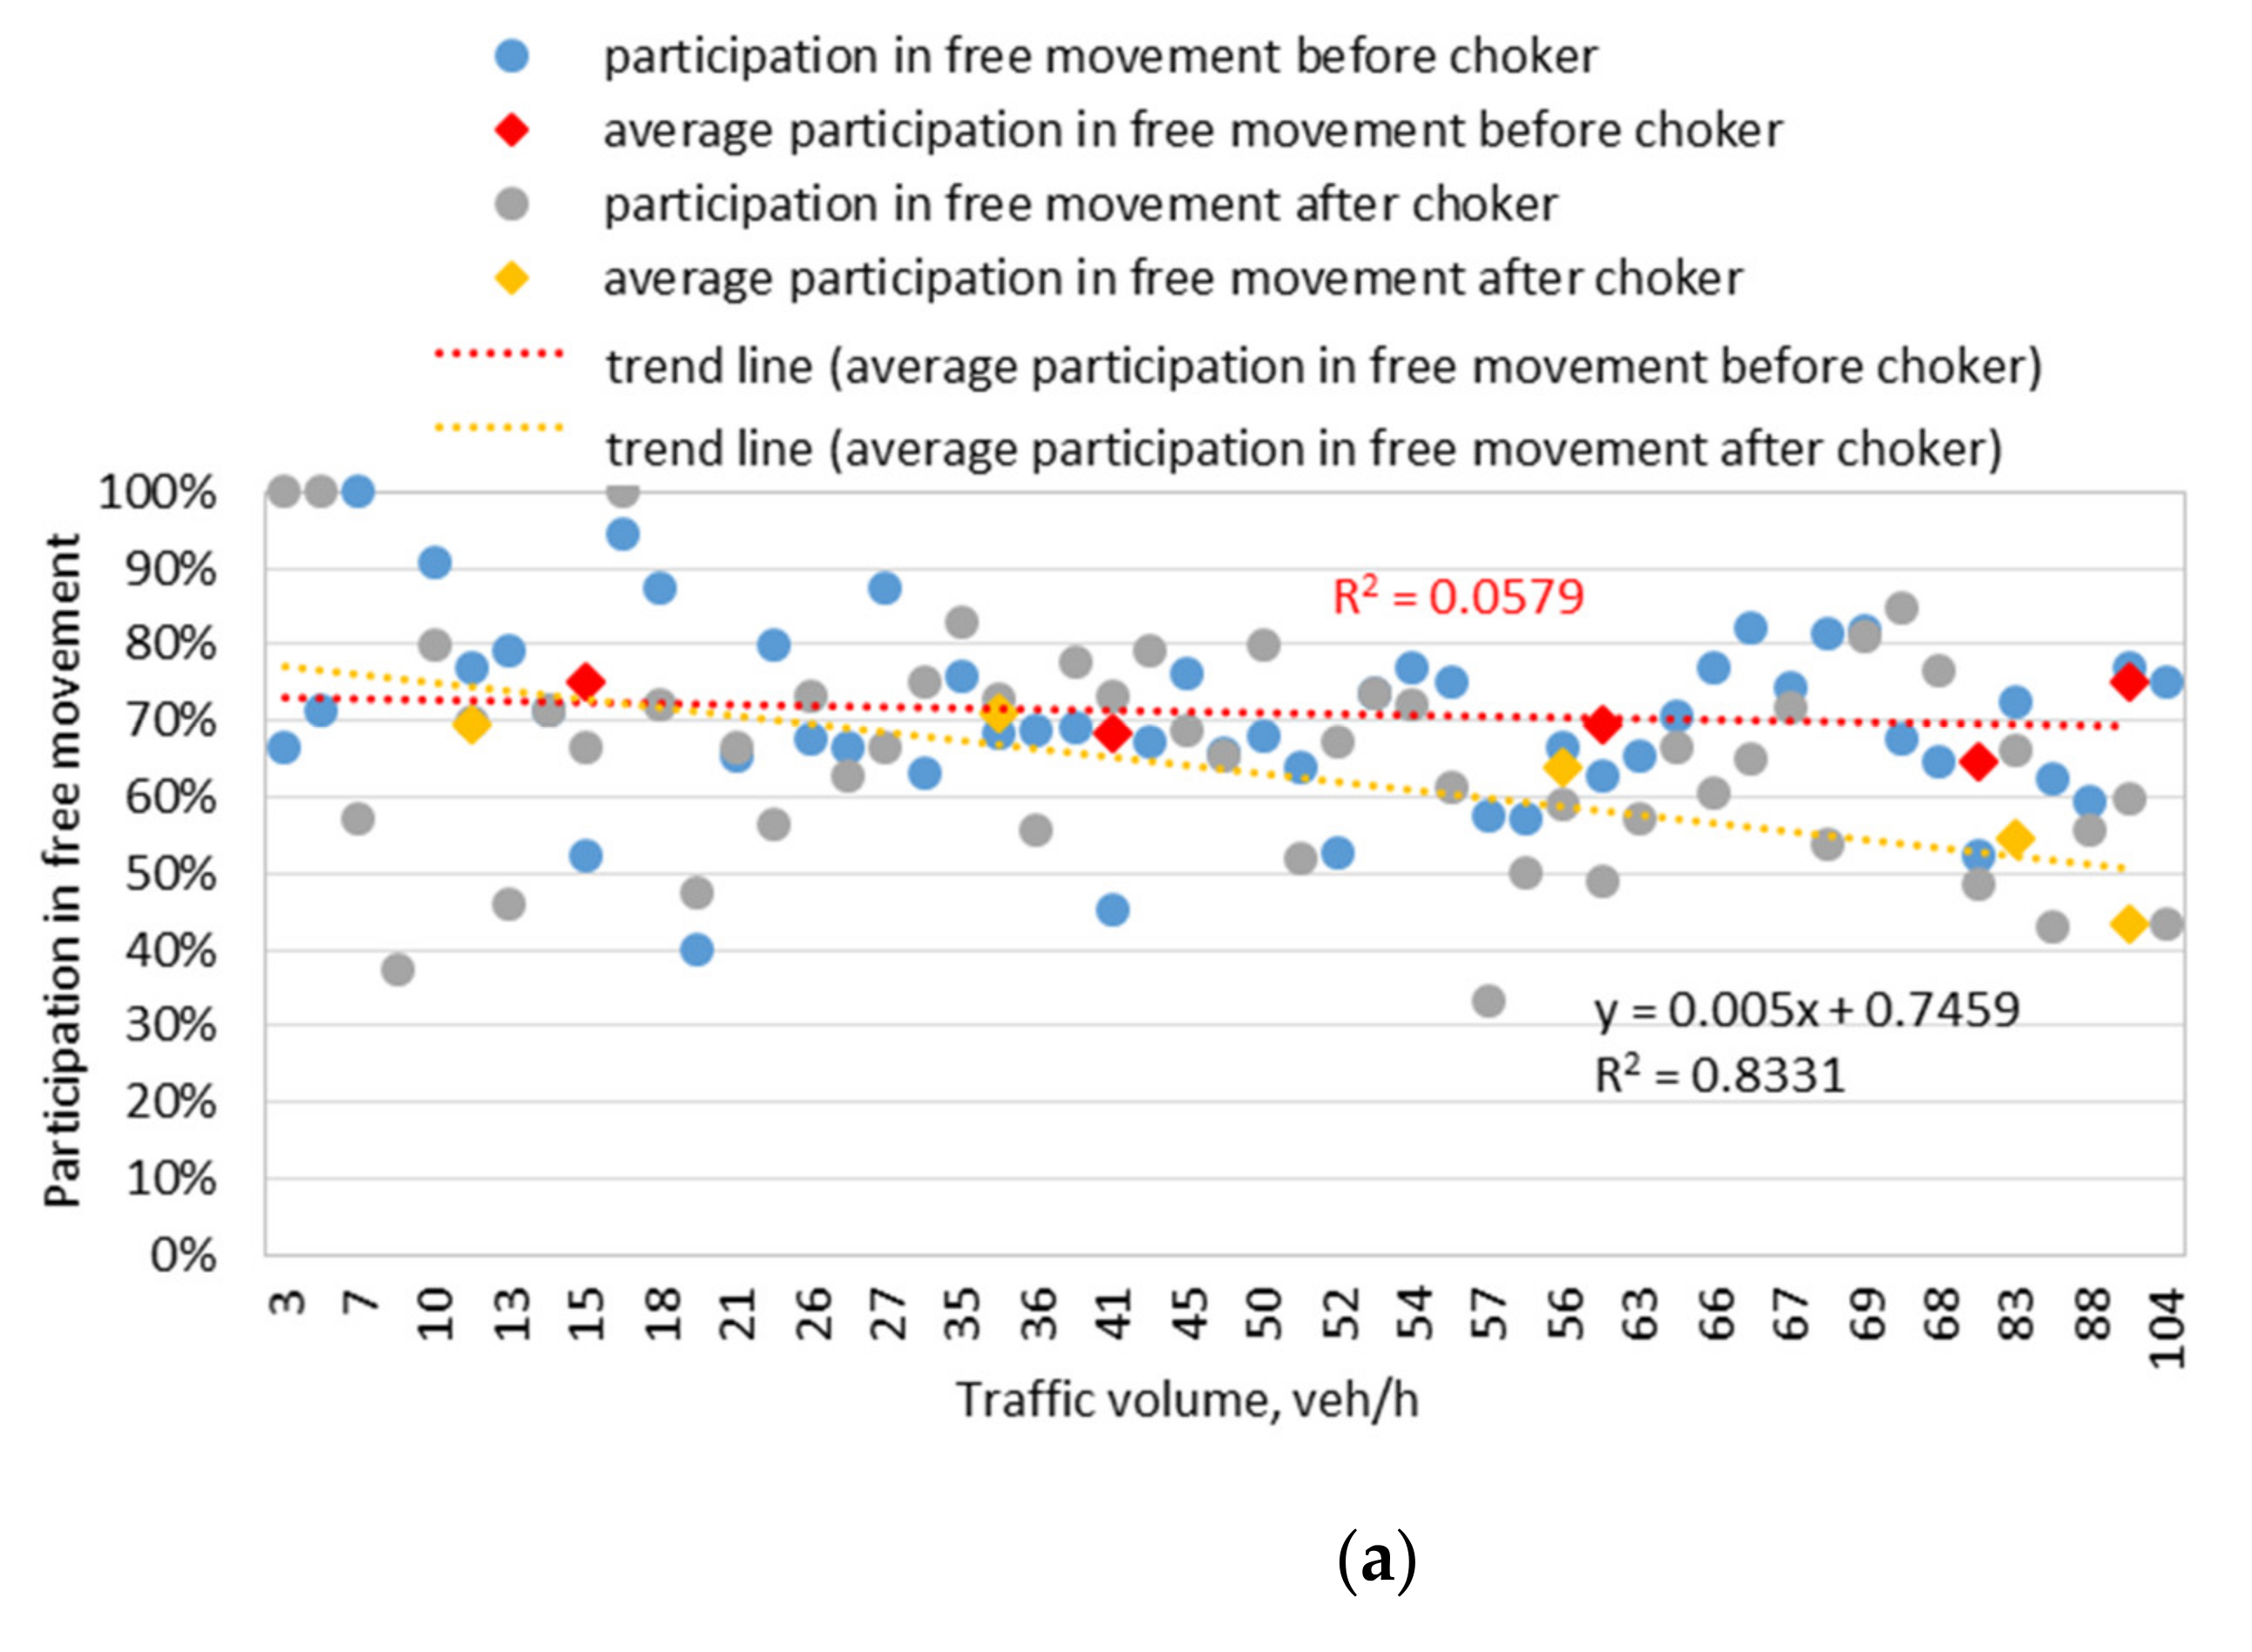
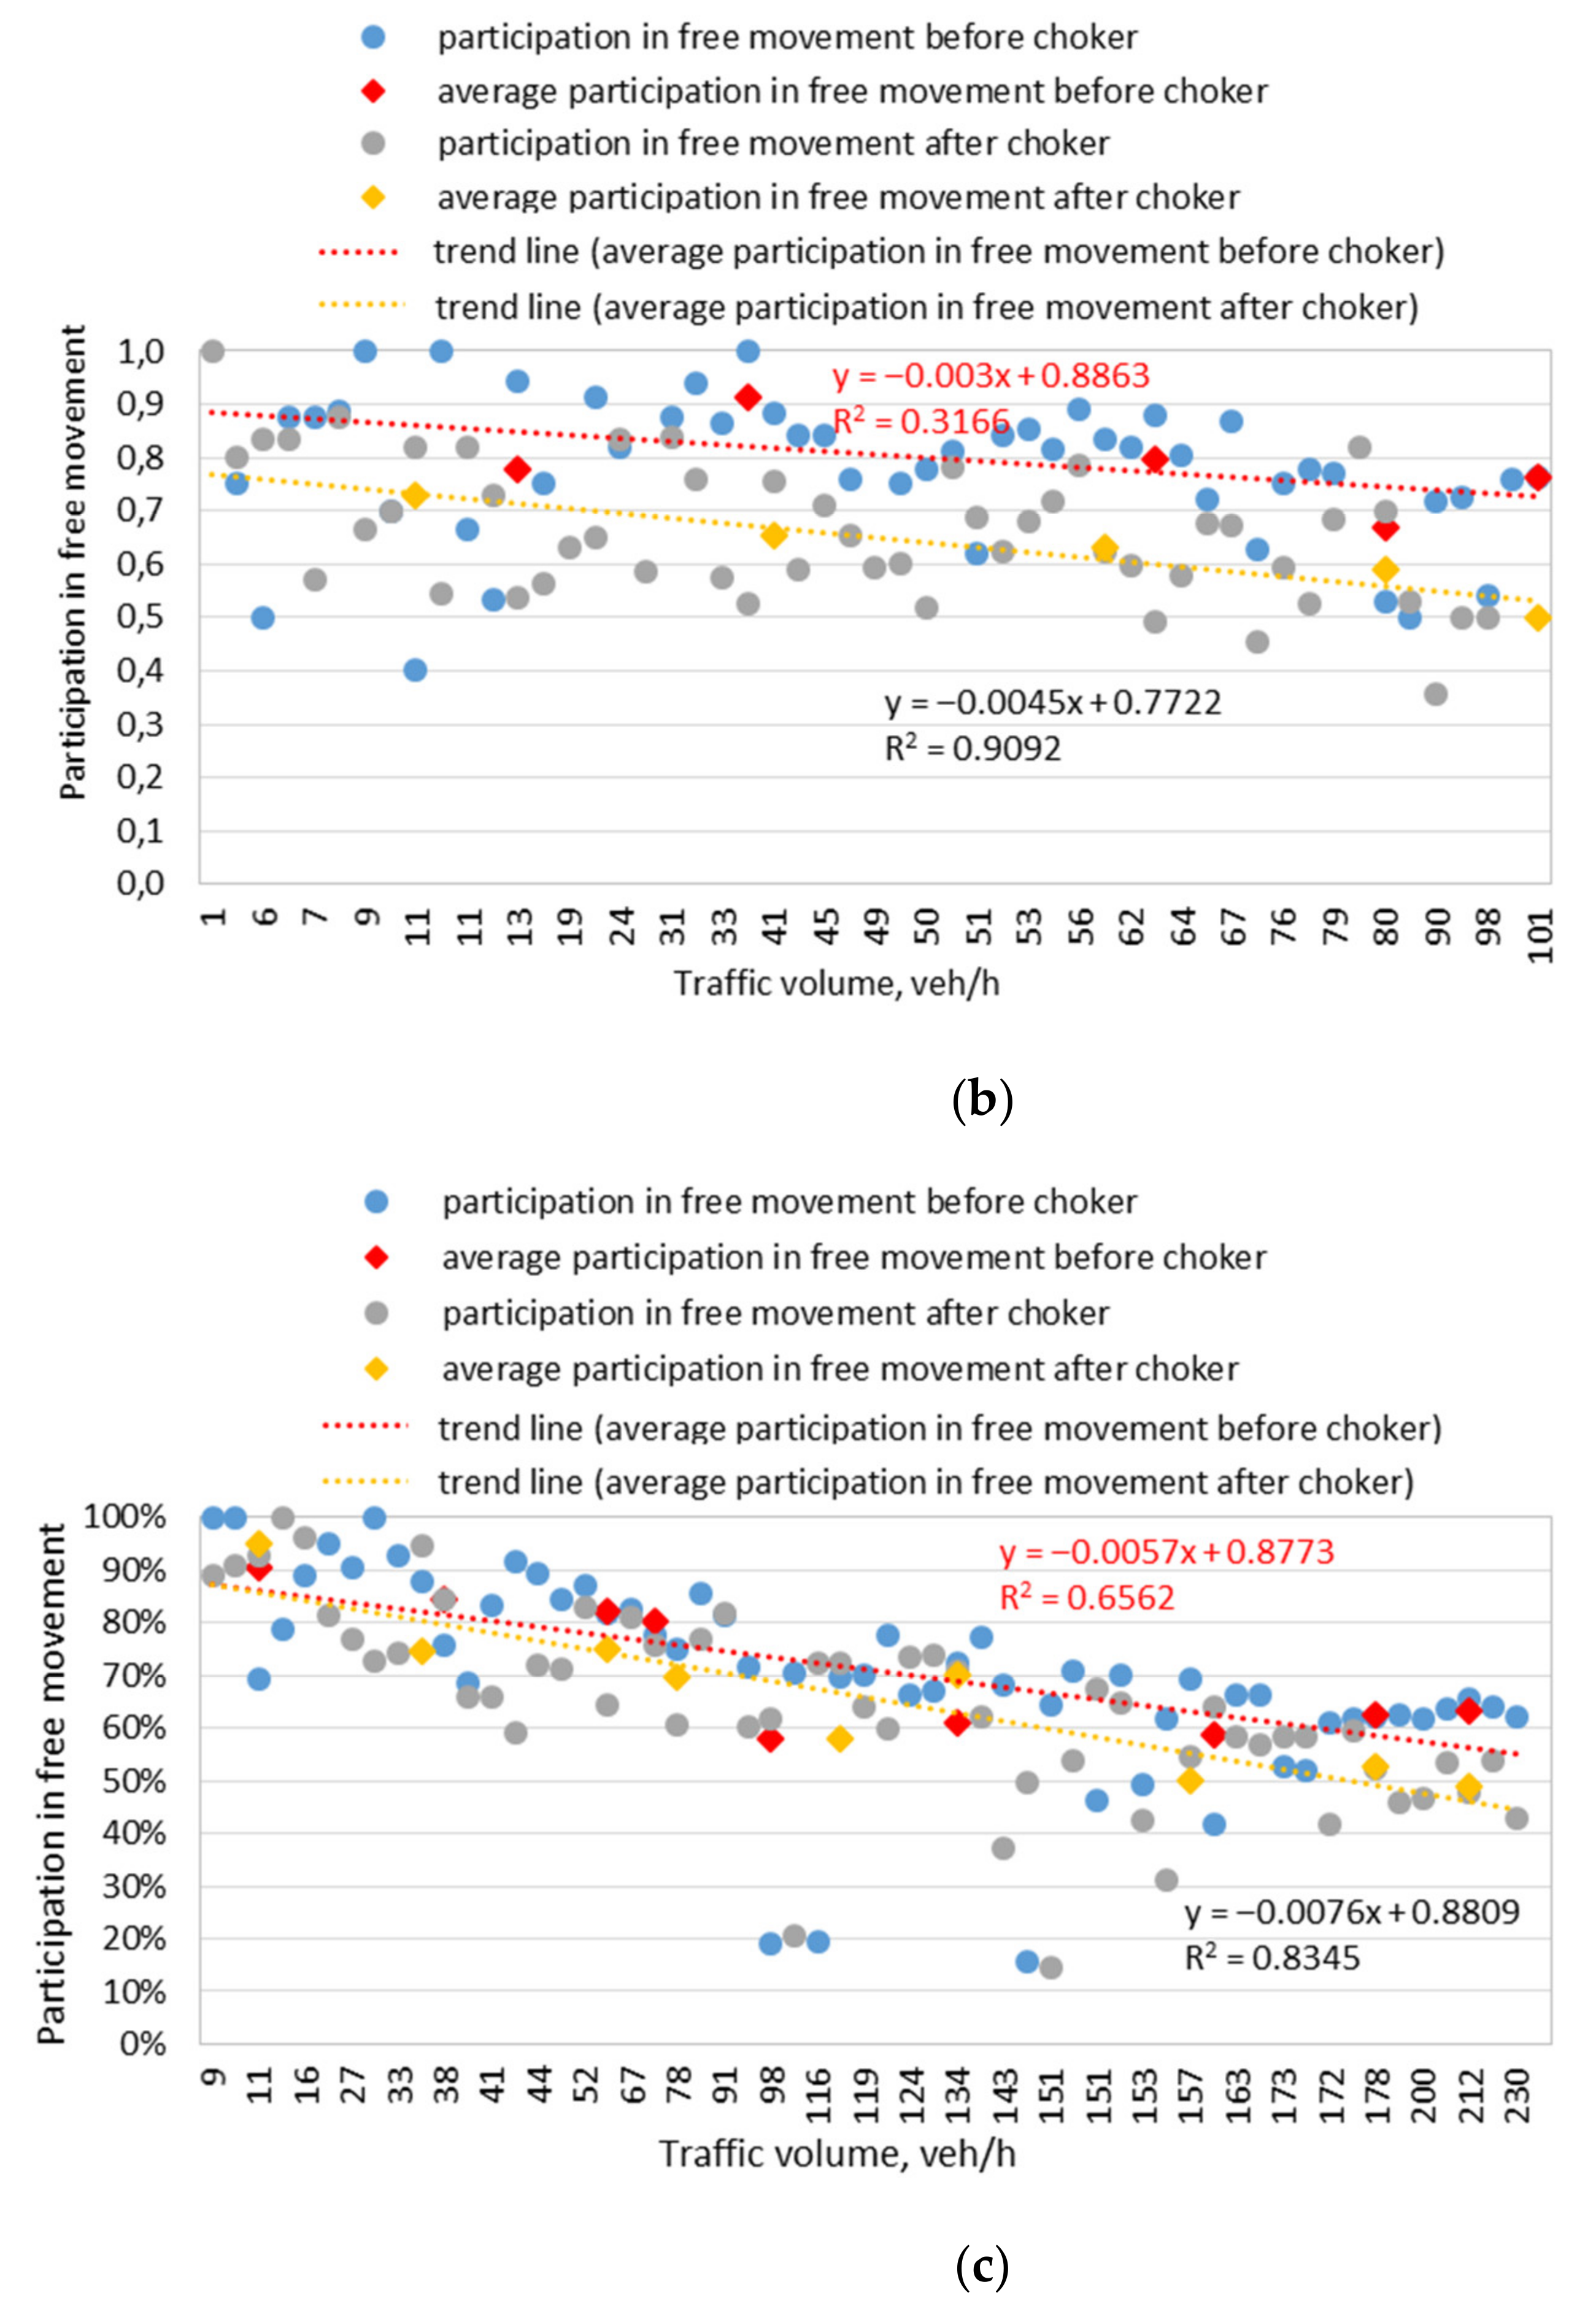
3. Results
4. Discussion
5. Conclusions
Funding
Data Availability Statement
Acknowledgments
Conflicts of Interest
Appendix A

| Traffic Volume, veh/h | Goodness-of-Fit Test K-S λ H0: F(v) = F0(v); H1: F(v) ≠ F0(v), λα = 0.05 = 1.36 | |||||
|---|---|---|---|---|---|---|
| Testing Ground No. 1 | Testing Ground No. 2 | Testing Ground No. 3 | ||||
| λ (v before) | λ (v after) | λ (v before) | λ (v after) | λ (v before) | λ (v after) | |
| 0–25 | 0.51 | 0.52 | 0.44 | 0.57 | 0.38 | 0.46 |
| 25–50 | 0.89 | 1.06 | 0.62 | 0.51 | 0.62 | 0.87 |
| 50–75 | 0.92 | 0.80 | 0.78 | 1.31 | 0.38 | 0.53 |
| 75–100 | 0.74 | 0.56 | 0.69 | 1.13 | 0.47 | 0.38 |
| 100–125 | 0.30 | 0.53 | 0.41 | 0.28 | 0.93 | 0.86 |
| 125–150 | – | – | – | – | 0.69 | 0.54 |
| 150–175 | – | – | – | – | 0.65 | 1.29 |
| 175–200 | – | – | – | – | 0.91 | 0.80 |
| 200–225 | – | – | – | – | 0.36 | 0.69 |
Appendix B
| Traffic Volume, veh/h | Two-Sample Kolmogorov–Smirnov Test λ H0: F(vbefore) = F(vafter); H1: F(vbefore) ≠ F(vafter) | |||||
|---|---|---|---|---|---|---|
| Testing Ground No. 1 | Testing Ground No. 2 | Testing Ground No. 3 | ||||
| λ | λα, α= 0.05 | λ | λα, α= 0.05 | λ | λα, α= 0.05 | |
| 0–25 | 8.06 | 1.36 | 8.59 | 1.36 | 6.77 | 1.36 |
| 25–50 | 12.54 | 1.36 | 13.01 | 1.36 | 11.93 | 1.36 |
| 50–75 | 19.79 | 1.36 | 2.07 | 1.36 | 7.91 | 1.36 |
| 75–100 | 10.92 | 1.36 | 13.76 | 1.36 | 13.28 | 1.36 |
| 100–125 | 5.35 | 1.36 | 0.56 | 1.36 | 14.47 | 1.36 |
| 125–150 | – | – | – | – | 14.72 | 1.36 |
| 150–175 | – | – | – | – | 23.67 | 1.36 |
| 175–200 | – | – | – | – | 14.96 | 1.36 |
| 200–225 | – | – | – | – | 9.56 | 1.36 |
Appendix C
| Traffic Volume, veh/h | Test of Independence H0: P{X = vbeforei, Y = vafteri} = P{X = vbeforei} P{Y = vafteri} H1: P{X = vbeforei, Y = vafteri} ≠ P{X = vbeforei} P{Y = vafteri} χα2 = 3.84, α = 0.05 | The Median Test H0: F1(x) = F2(x) H1: F1(x) ≠ F2(x) χα2 = 3.84, α = 0.05 | ||||
|---|---|---|---|---|---|---|
| Testing Ground: | Testing Ground: | |||||
| No. 1 | No. 2 | No. 3 | No. 1 | No. 2 | No. 3 | |
| 0–25 | 1.01 | 1.46 | 27.43 | 11.94 | 22.72 | 69.04 |
| 25–50 | 1.87 | 2.52 | 51.40 | 379 | 273 | 962 |
| 50–75 | 0.50 | 0.02 | 11.57 | 3731 | 850 | 164 |
| 75–100 | 0.02 | 4.62 | 27.18 | 162 | 508 | 1482 |
| 100–125 | 0.57 | 0.04 | 23.96 | 7.32 | 4.28 | 1599 |
| 125–150 | – | – | 25.87 | – | – | 1643 |
| 150–175 | – | – | 47.50 | – | – | 12917 |
| 175–200 | – | – | 19.77 | – | – | 964 |
| 200–225 | – | – | 4.86 | – | – | 639 |
References
- Urban Street Design Guide; National Association of City Transportation Officials: Washington, DC, USA, 2013.
- Krystek, R. Principles of Traffic Calming on the Roads of the Pomorskie Region in Poland, Part 1: Street Layouts in Towns and Cities; GAMBIT Pomorski: Gdańsk, Poland, 2008. [Google Scholar]
- Krystek, R. Principles of Traffic Calming on the Roads of the Pomorskie Region in Poland, Part 2: Sections of Major Roads through Towns and Villages; GAMBIT Pomorski: Gdańsk, Poland, 2008. [Google Scholar]
- Guidelines for Traffic Calming; City of Sparks Public Works Traffic Division, Sierra Transportation Engineers, Inc.: Reno, NV, USA, 2007.
- Urban Traffic Areas—Part 7—Speed Reducers; Vejdirektoratet-Vejregeludvalget: Copenhagen, Denmark, 1991.
- Traffic Calming Guidelines; Devon County Council Engineering & Planning Department: Devon, UK, 1992.
- Traffic Calming; Local Transport Note 1/07; Department for Regional Development (Northern Ireland), Scottish Executives, Welsh Assembly Government: London, UK, 2007.
- Roads Development Guide; East Ayrshire, Strathclyde Regional Council: London, UK, 2010.
- Harvey, T.A. Review of Current Traffic Calming Techniques; University of Leeds: Leeds, UK, 2013. [Google Scholar]
- Directives for the Design of Urban Roads. RASt 06; Road and Transportation Research Association (FGSV): Kӧln, Germany, 2006.
- Zhu, H.; Almukdad, A.; Iryo-Asano, M.; Alhajyaseen, W.K.M.; Nakamura, H.; Xin Zhang, X. A novel agent-based framework for evaluating pedestrian safety at unsignalized mid-block crosswalks. Accid. Anal. Prev. 2021, 159, 106288. [Google Scholar] [CrossRef] [PubMed]
- Davidson, K.B. A flow–travel time relationship for use in transportation planning. In Proceedings of the 3rd Australian Road Research Board (ARRB) Conference, Sydney, Australia; 1966; Volume 3, pp. 183–194. Available online: https://trid.trb.org/view/1209266 (accessed on 12 September 2021).
- Davidson, K.B. The theoretical basis of a flow–travel time relationship for use in transportation planning. Aust. Road Res. 1978, 8, 32–35, Discussion, p. 45. [Google Scholar]
- Tisato, P. Suggestions for an improved Davidson travel time function. Aust. Road Res. 1991, 21, 85–100. [Google Scholar]
- Akcelik, R. Travel time functions for transport planning purposes: Davidson’s function, its time dependent form and alternative travel time function. Aust. Road Res. 1991, 21, 49–59. Available online: https://www.researchgate.net/publication/242258239_Travel_time_functions_for_transport_planning_purposes_Davidson’s_function_its_time-dependent_form_and_an_alternative_travel_time_function (accessed on 9 July 2021).
- Barbosa, H.M. Impacts of Traffic Calming Measures on Speeds on Urban Roads; University of Leeds: Leeds, UK, 1995. [Google Scholar]
- Cascetta, E. Transportation Systems Engineering: Theory and Methods, 49th ed.; Springer Science: Berlin, Germany, 2013. [Google Scholar]
- Macioszek, E.; Iwanowicz, D. A Back-of-Queue Model of a Signal-Controlled Intersection Approach Developed Based on Analysis of Vehicle Driver Behavior. Energies 2021, 14, 1204. [Google Scholar] [CrossRef]
- Richter, M.; Paszkowski, J. Modelling driver behaviour in traffic-calmed areas. Czas. Tech. 2018, 8, 111–124. [Google Scholar] [CrossRef][Green Version]
- Paszkowski, J.; Herrmann, M.; Matthias, R.; Szarata, A. Modelling the Effects of Traffic-Calming Introduction to Volume–Delay Functions and Traffic Assignment. Energies 2021, 14, 3726. [Google Scholar] [CrossRef]
- Macioszek, E.; Świerk, P.; Kurek, A. The Bike-Sharing System as an Element of Enhancing Sustainable Mobility—A Case Study based on a City in Poland. Sustainability 2020, 12, 3285. [Google Scholar] [CrossRef]
- Abdulmawjoud, A.A.; Jamel, M.G.; Al-Taei, A.A. Traffic flow parameters development modelling at traffic calming measures located on arterial roads. Ain Shams Eng. J. 2021, 12, 437–444. [Google Scholar] [CrossRef]
- Baltrènas, H.P.; Januševicius, T.; Chlebnikovas, A. Research into the impact of speed bumps on particulate matter air pollution. Measurement 2017, 100, 62–67. [Google Scholar] [CrossRef]
- Akgol, K.; Gunay, B.; Aydin, M.M. Geometric optimisation of chicanes using driving simulator trajectory data. Transp. Proc. Inst. Civ. Eng. Transp. 2020. [Google Scholar] [CrossRef]
- Distefano, N.; Leonardi, S. Effects of speed table, chicane and road narrowing on vehicle speeds in urban areas. In Proceedings of the VI International Symposium, NEW HORIZONS 2017 of Transport and Communications”, Sarajevo, Bosnia and Herzegovina, 17–18 November 2017; Available online: https://www.researchgate.net/publication/328738163_EFFECTS_OF_SPEED_TABLE_CHICANE_AND_ROAD_NARROWING_ON_VEHICLE_SPEEDS_IN_URBAN_AREAS (accessed on 12 June 2021).
- Distefano, N.; Leonardi, S. Evaluation of the Benefits of Traffic Calming on Vehicle Speed Reduction. Civ. Eng. Archit. 2019, 7, 200–214. [Google Scholar] [CrossRef]
- Obregón-Biosca, S.A. Speed humps and speed tables: Externalities on vehicle speed, pollutant emissions and fuel consumption. Results Eng. 2020, 5, 100089. [Google Scholar] [CrossRef]
- Lav, A.H.; Bilgin, E.; Lav, A.H. A fundamental experimental approach for optimal design of speed bumps. Accid. Anal. Prev. 2018, 116, 53–68. [Google Scholar] [CrossRef]
- Beckx, L.I.P.C.; Broekx, S. Impact of 30 km/h Zone Introduction on Vehicle Exhaust Emissions in Urban Areas. Available online: https://www.researchgate.net/publication/237327146 (accessed on 12 June 2021).
- Da Silva, F.N.; Custódio, R.A.L.; Martins, H. Low Emission Zone: Lisbon’s Experience. J. Traffic Logist. Eng. 2014, 2, 133–139. [Google Scholar] [CrossRef][Green Version]
- De Vlieger, I.; De Keukeleere, D.; Kretzschmar, J. Environmental effects of driving behaviour and congestion related to passenger cars. Atmos. Environ. 2000, 34, 4649–4655. [Google Scholar] [CrossRef]
- Beckx, C.; Int Panis, L.; Debal, P.; Wets, G. Influence of gear changing behaviour on fuel-use and vehicular exhaust emissions. In Proceedings of the 8th International Symposium on Highways and the Urban Environment, Nicosia, Cyprus, 12–14 June 2006; Rauch, S., Morrisson, G., Eds.; Chalmers University: Göteborg, Denmark, 2006. [Google Scholar]
- Liimatainen, H. Measures for Energy Efficient and Low Emission Private Mobility. In Encyclopedia of the UN Sustainable Development Goals; Springer International Publishing: Cham, Switzerland, 2020; pp. 1–12. [Google Scholar] [CrossRef]
- Tang, J.; McNabola, A.; Mistear, B. The potential impacts of different traffic management strategies on air pollution and public health for a more sustainable city: A modelling case study from Dublin, Ireland. Sustain. Cities Soc. 2020, 60, 102229. [Google Scholar] [CrossRef]
- Sun, L.L.; Liu, D.; Chen, T.; He, M.T. Road traffic safety: An analysis of the cross-effects of economic, road and population factors. Chin. J. Traumatol. 2019, 22, 290–295. [Google Scholar] [CrossRef]
- Jeon, J.; Hong, J.; Kim, S.; Kim, K.-H. Noise Indicators for Size Distributions of Airborne Particles and Traffic Activities in Urban Areas. Sustainability 2018, 10, 4599. [Google Scholar] [CrossRef]
- Bendtsen, H.; Haberl, J.; Litzka, J.; Pucher, E.; Sandberg, U.; Watts, G. Traffic Management and Noise Reducing Pavements-recommendations on Additional Noise Reducing Measures; Report 137; Road Directorate, Danish Road Institute: Copenhagen, Denmark, 2004. [Google Scholar]
- Niebieska Książka. Sektor Transportu Publicznego w Miastach, Aglomeracjach i Regionach, Blue Book Road Infrastructure, Jaspers 2015. Available online: https://www.cupt.gov.pl/ (accessed on 30 November 2020).
- Google Earth. Available online: http://www.earth.google.com (accessed on 12 August 2016).
- Sochanowski, M. Kompleksowa Modernizacja Chodników, Miejsc Postojowych i Nawierzchni Jezdni w Kwartale Ulic: Królowej Jadwigi, Małkowskiego, Bogusława X, Bohaterów Getta Warszawskiego, Ściegiennego; Pracownia Projektowa Macieja Sochanowskiego: Szczecin, Poland, 2016. [Google Scholar]
- Speed Displays Traffic Detection, Radar, Detection, Software; Vitronic: Kędzierzyn Koźle, Poland, 2015.
- Künzler, P.; Dietiker, J.; Steiner, R. Nachhaltige Gestaltung von Verkehrsräumen im Siedlungsbereich, Grundlagen für Planung, Bau und Reparatur von Verkehrsräumen; Herausgegeben vom Bundesamt für Umwelt: Bern, Switzerland, 2011; Available online: https://www.bafu.admin.ch/dam/bafu/de/dokumente/luft/uw-umwelt-wissen/nachhaltige_gestaltungvonverkehrsraeumenimsiedlungsbereich.pdf (accessed on 12 August 2019).
- Nina67, Consommation D’essence en Fonction de Vitesse et Rapport. Astuces-Pratiques 2015. Available online: https://www.astuces-pratiques.fr/auto-moto/consommation-d-essence-en-fonction-de-vitesse-et-rapport (accessed on 12 August 2019).


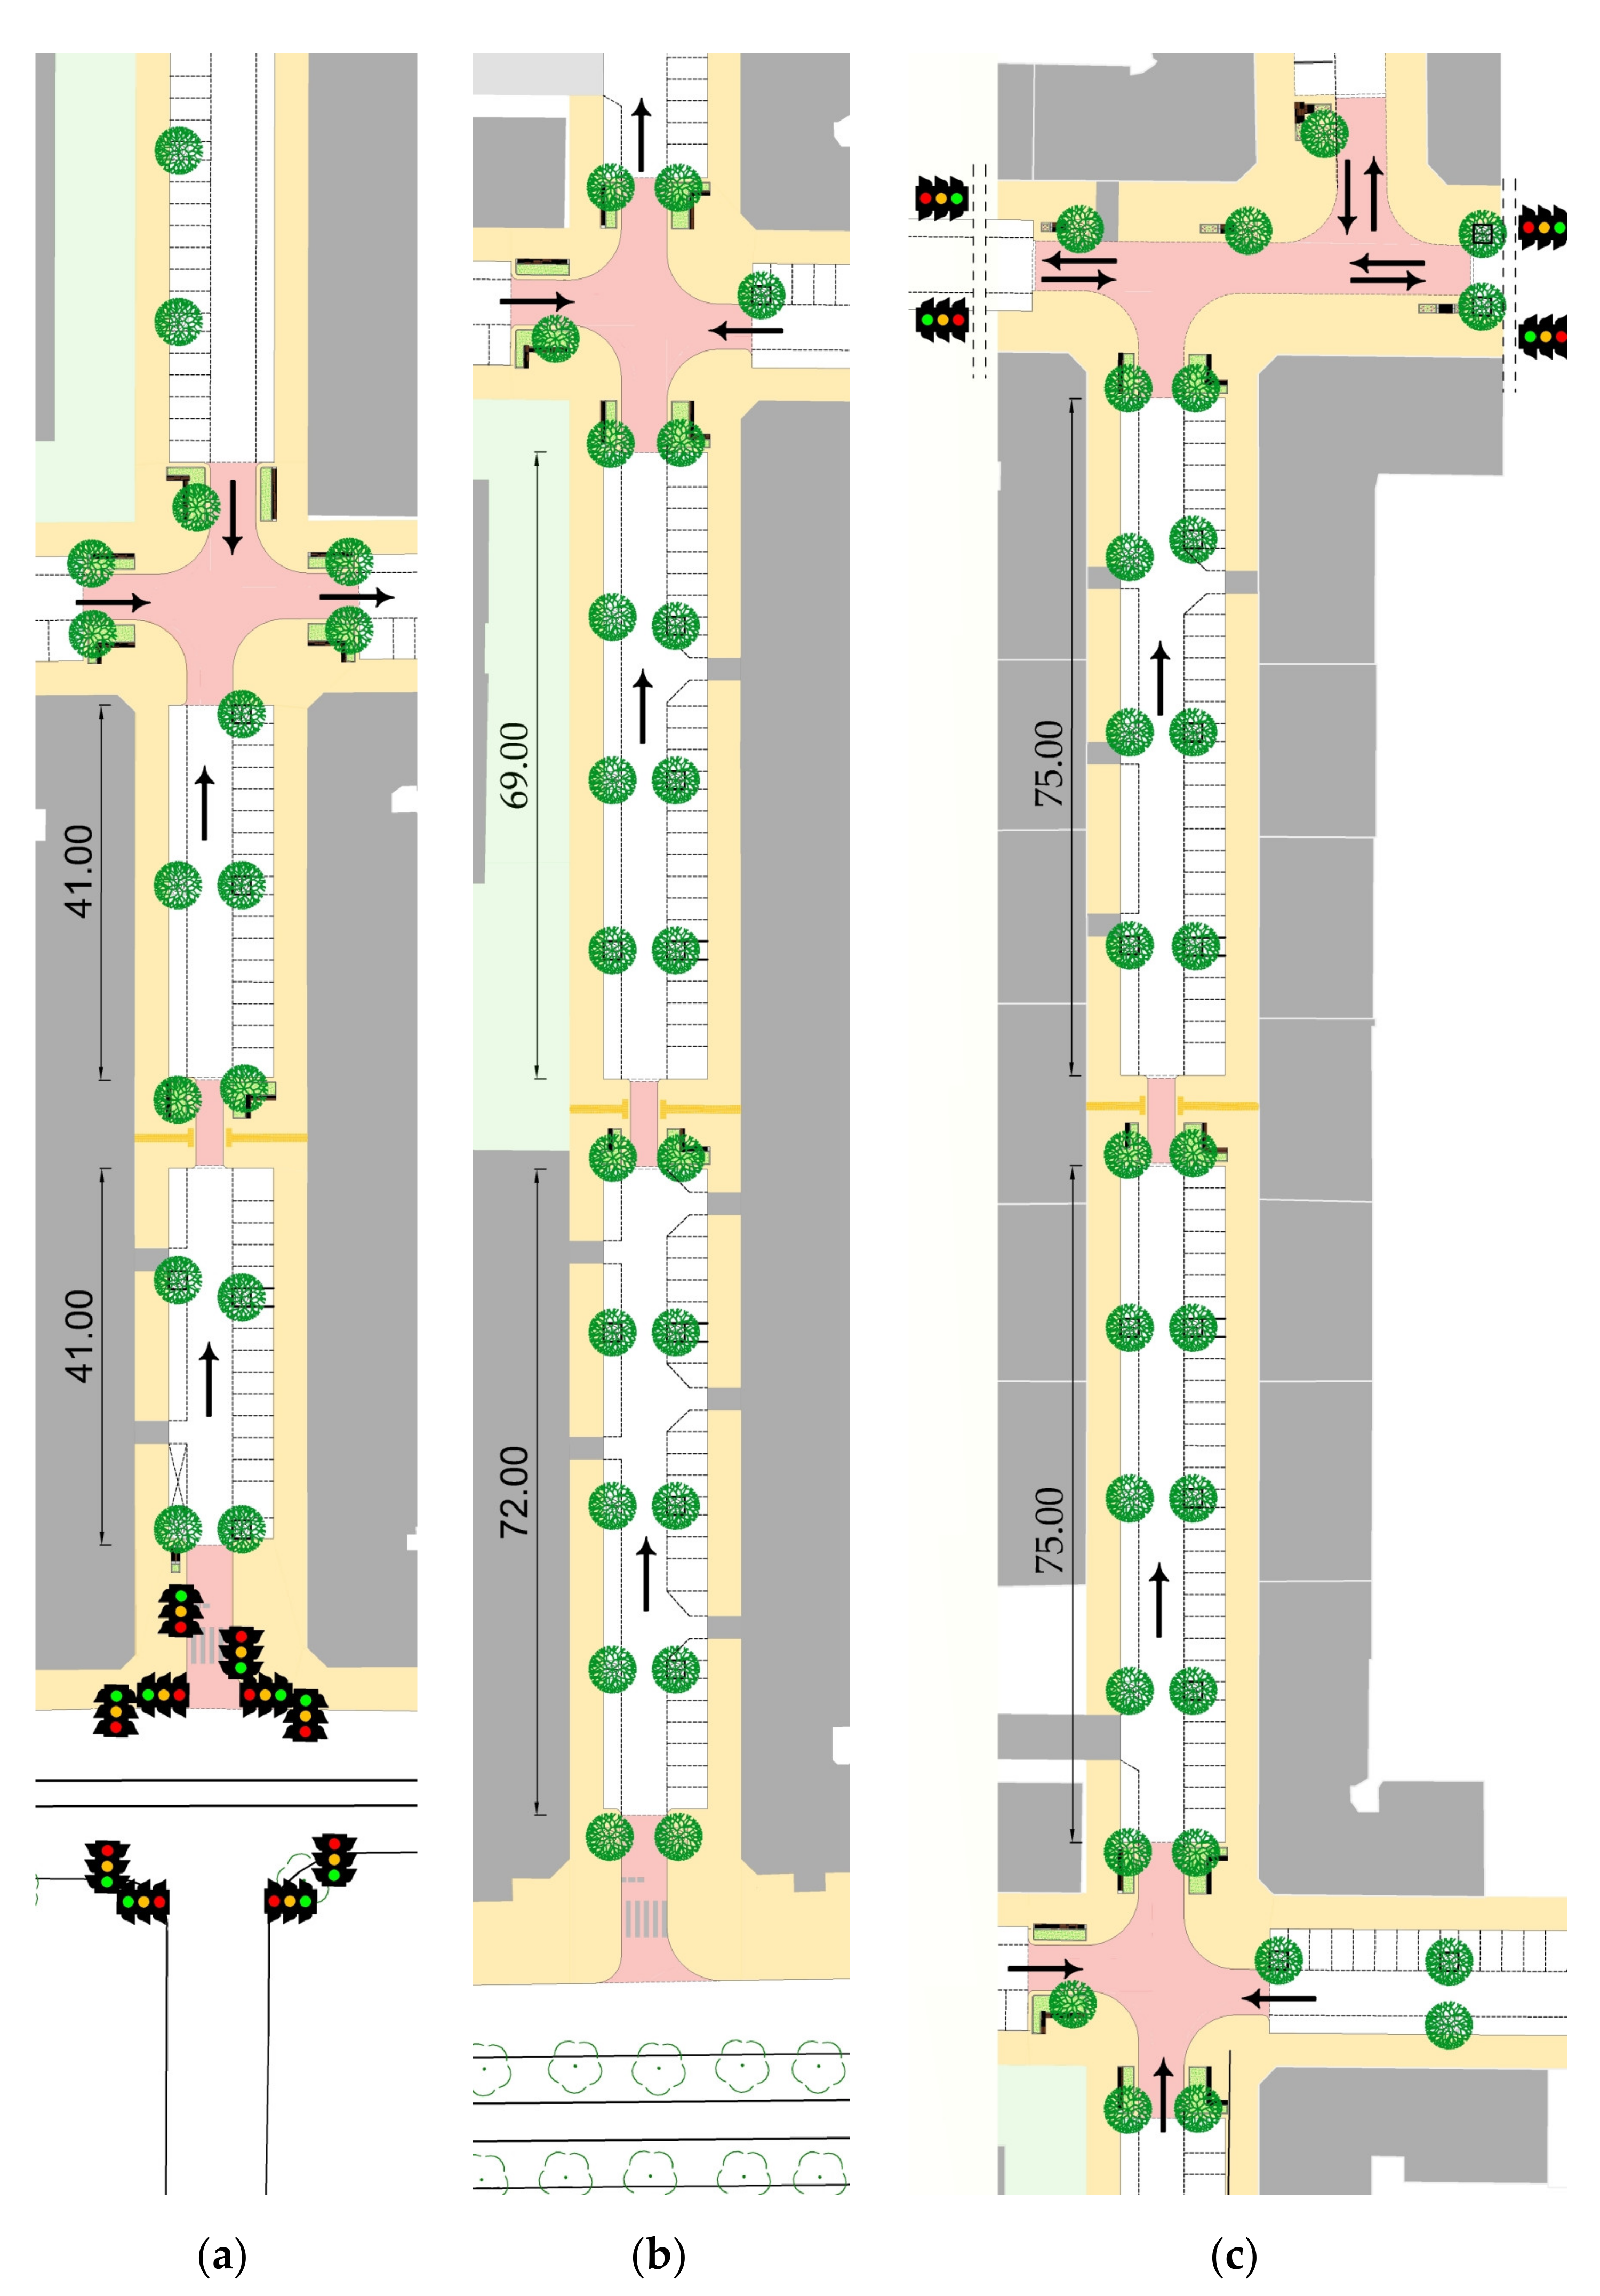
| Analysed Feature | No. 1 | No. 2 | No. 3 | |
|---|---|---|---|---|
| Length of approach to choker, m | 41 | 72 | 75 | |
| Length of approach to intersection, m | 41 | 69 | 75 | |
| Number of street-level businesses | on the left-hand side before choker | 7 | 5 | 3 |
| Number of access points | 2 No. | 2 No. | 1 No. | |
| Number of street-level businesses | on the right-hand side before choker | 5 | 5 | 3 |
| Number of access points | – | 3 No. | – | |
| Number of street-level businesses | on the left-hand side after choker | 2 | 1 | 2 |
| Number of access points | – | – | 3 No. | |
| Number of street-level businesses | on the right-hand side after choker | 3 | 5 | 1 |
| Number of access points | – | 1 No. | 1 No. | |
| Number of trees within the carriageway on the left-hand side before choker | 1 | 3 | 3 | |
| Number of trees within the carriageway on the right-hand side before choker | 1 | 3 | 3 | |
| Number of trees within the carriageway on the left-hand side after choker | 1 | 3 | 3 | |
| Number of trees within the carriageway on the right-hand side after choker | 1 | 3 | 3 | |
| Location of the planter with tree on the choker from the approach edge, m | 5.5 | 0.5 | 0.5 | |
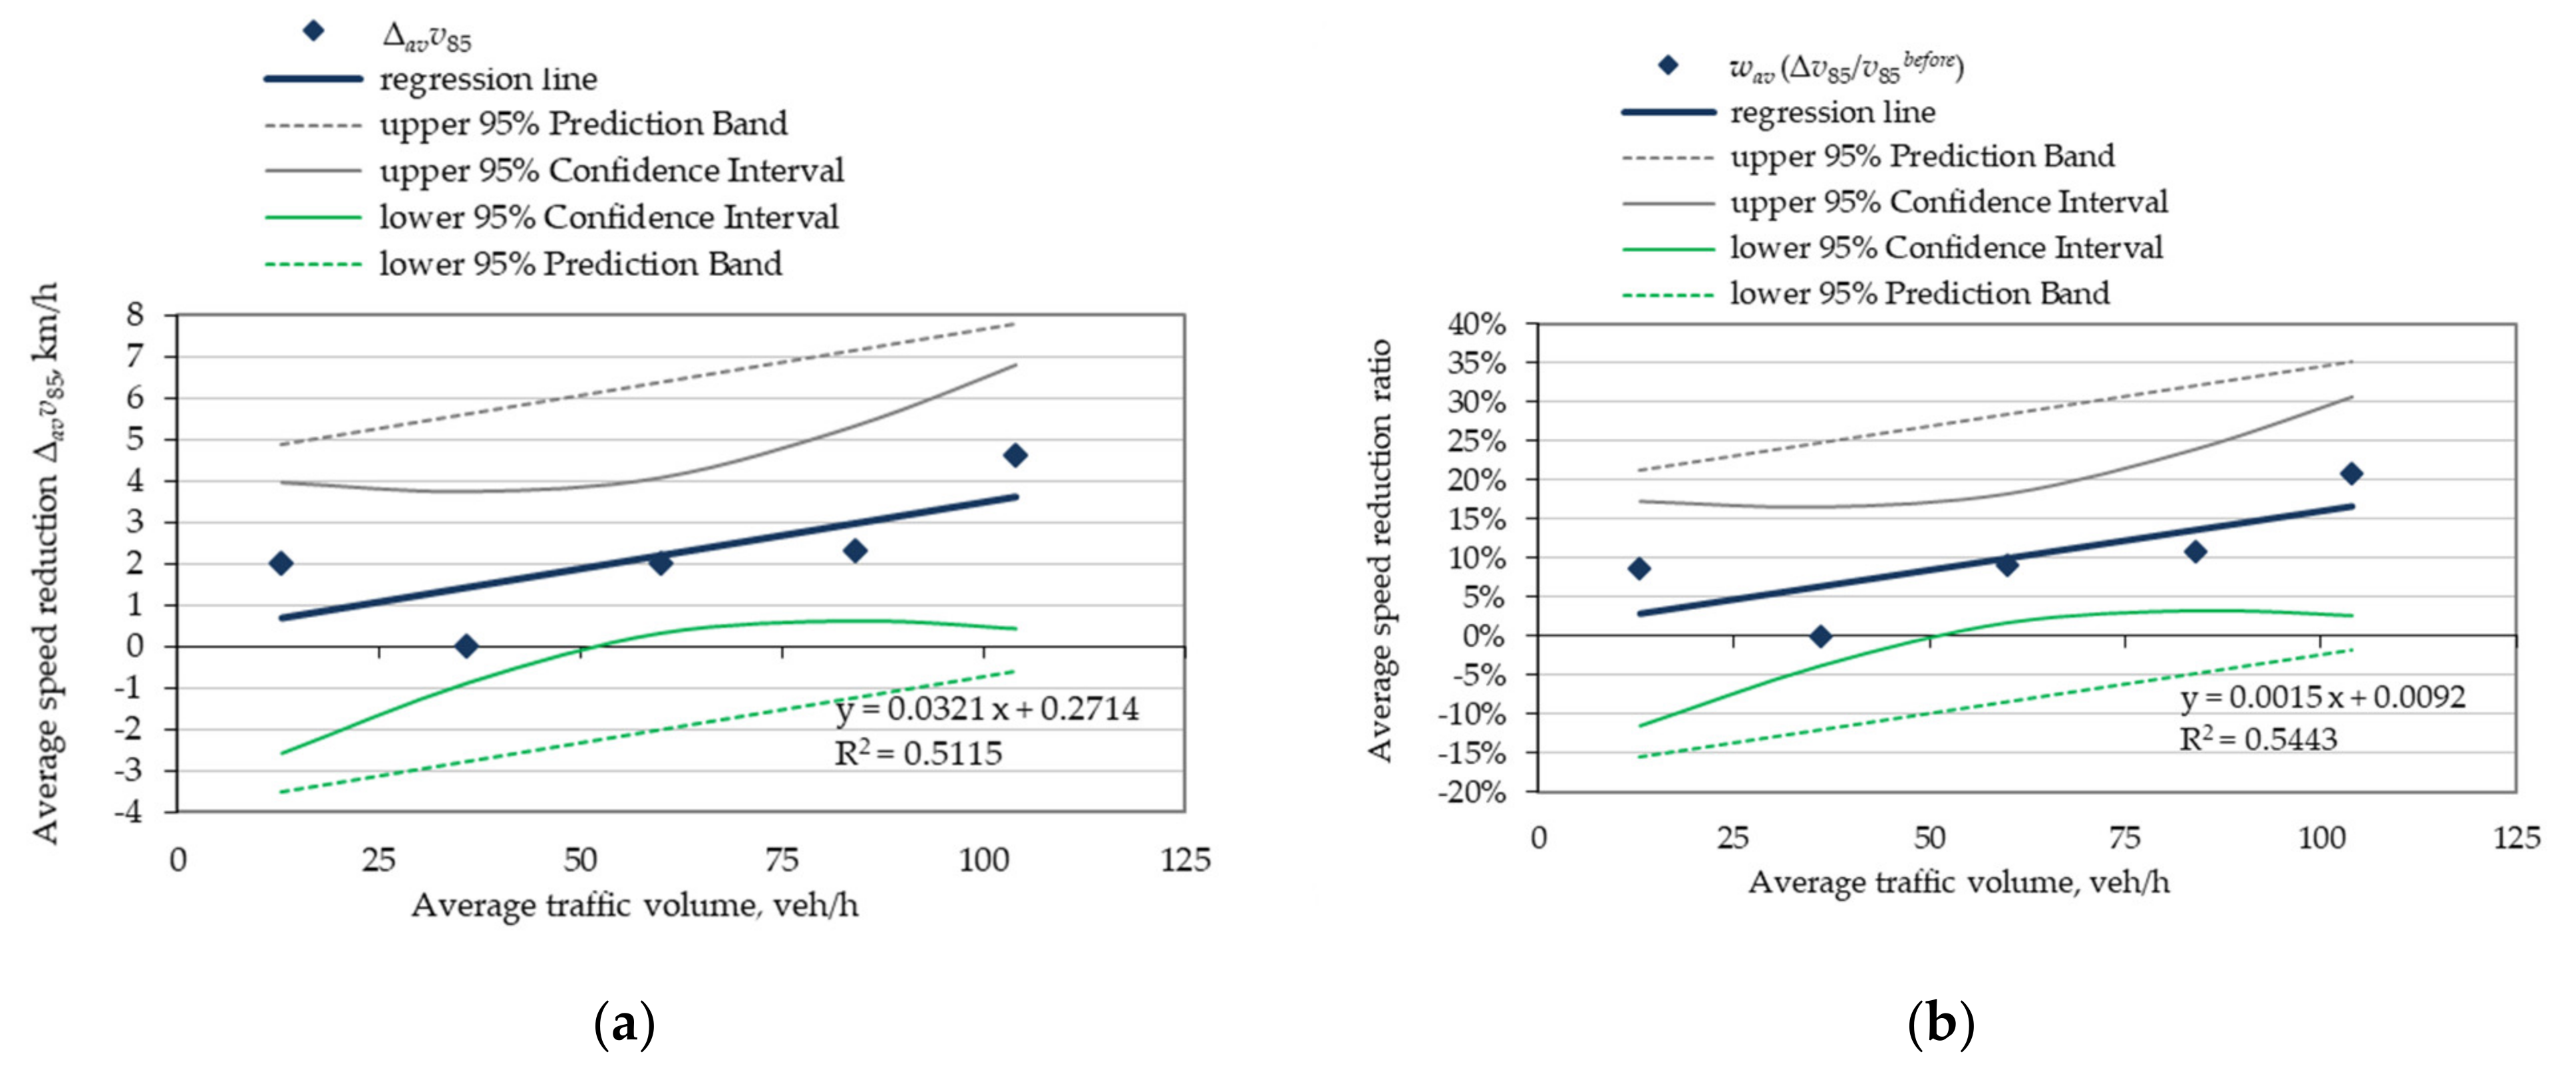
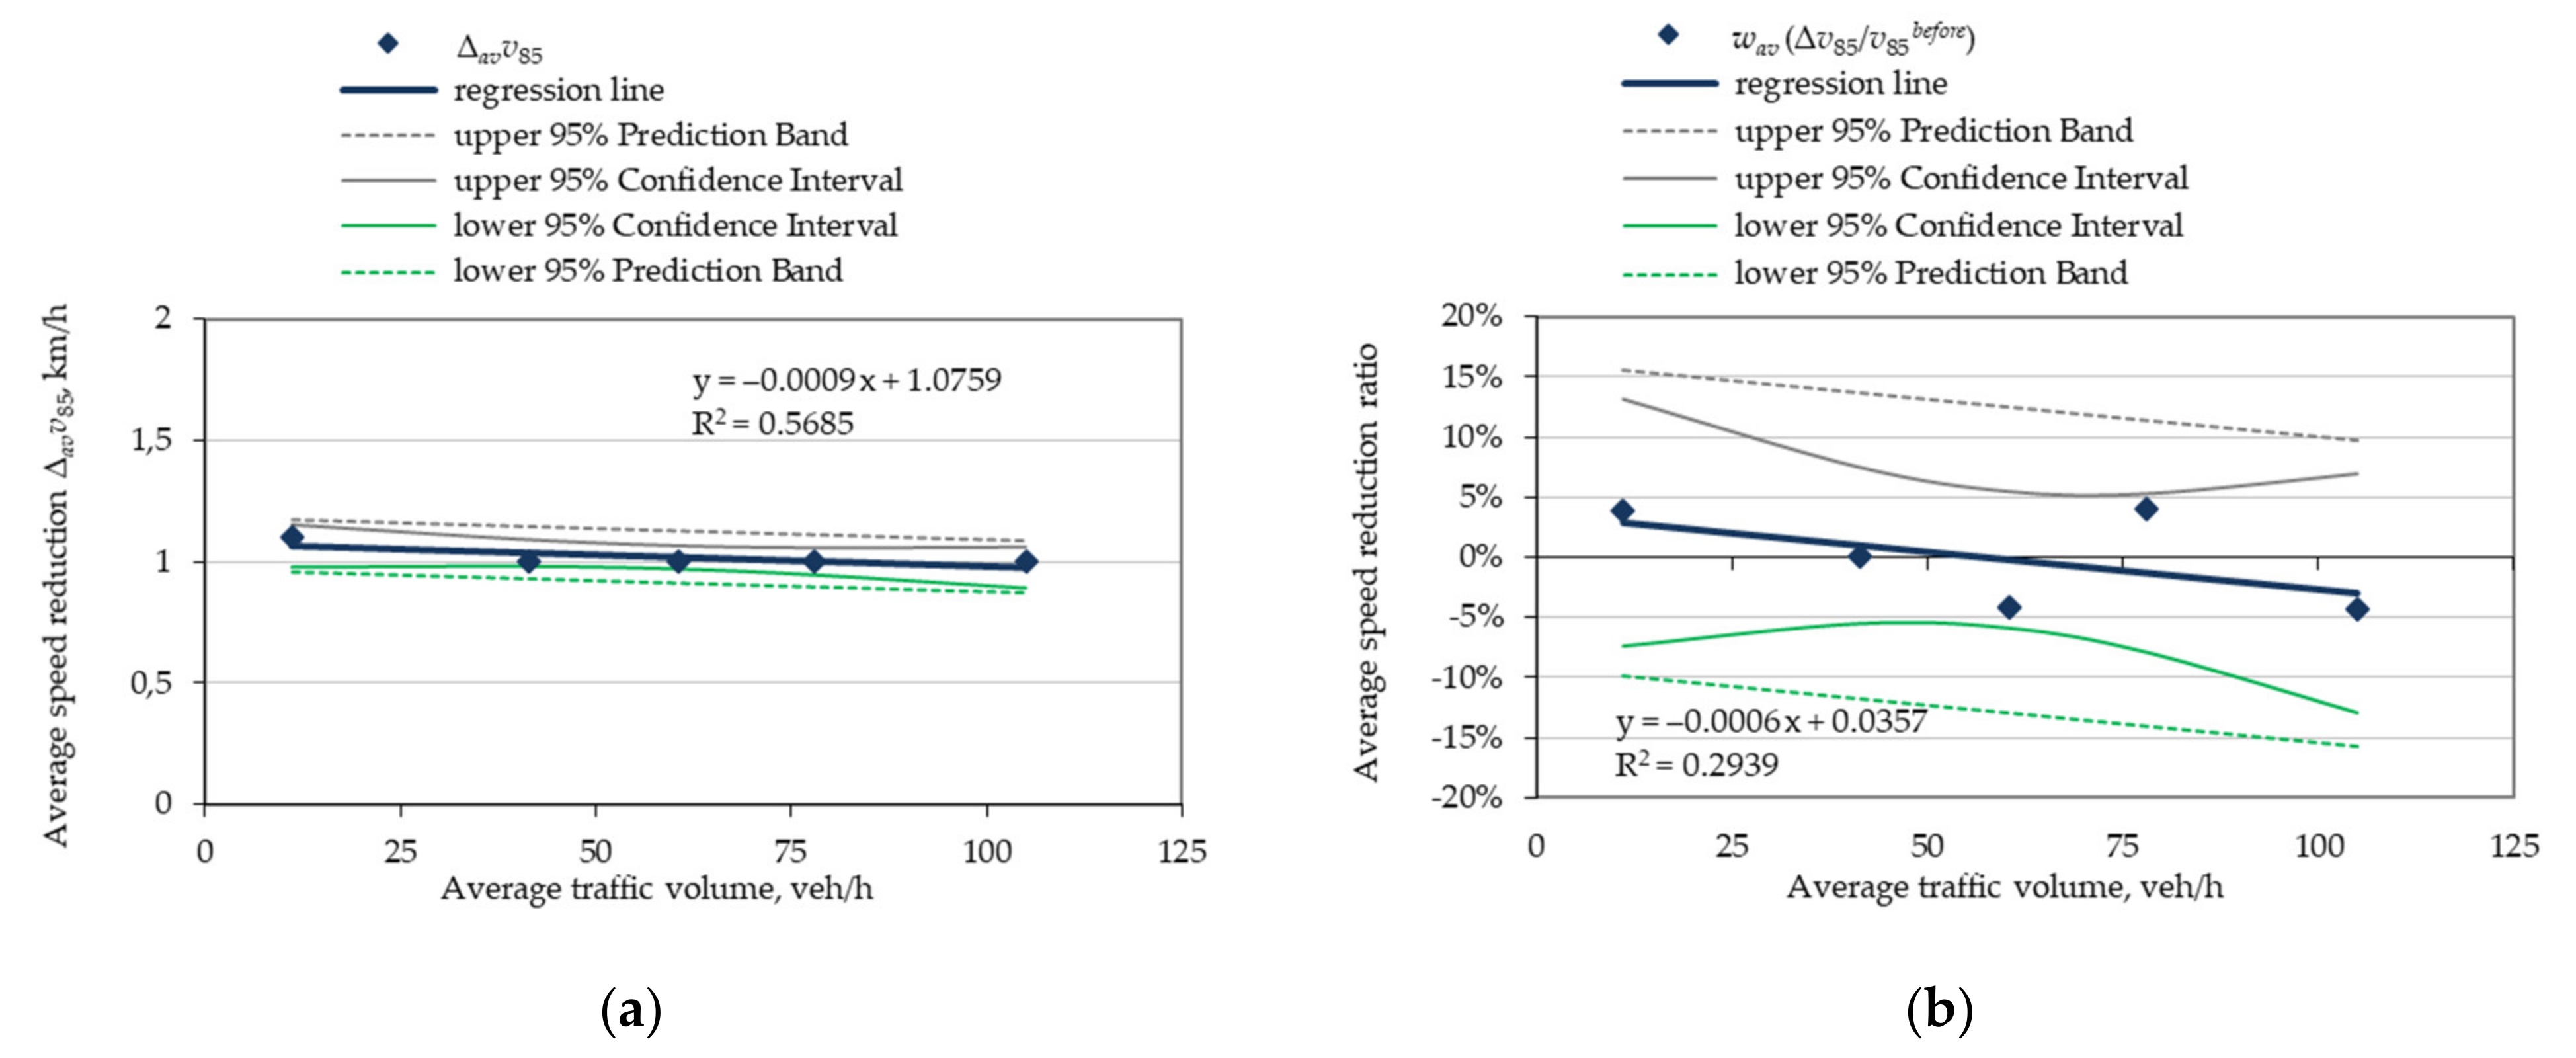
| Testing Ground | Relationship | Coefficients | R | R2 | Guilford’s Interpretation of the Magnitude of Significant Correlations | Pearson’s Interpretation of the Magnitude of Significant Correlations | |
|---|---|---|---|---|---|---|---|
| a | b | ||||||
| No. 1 | ∆avv85 = f(Nav) | 0.0321 | 0.271 | 0.72 | 51% | High correlation | High degree |
| No. 2 | −0.0009 | 1.076 | −0.75 | 57% | High correlation | High degree | |
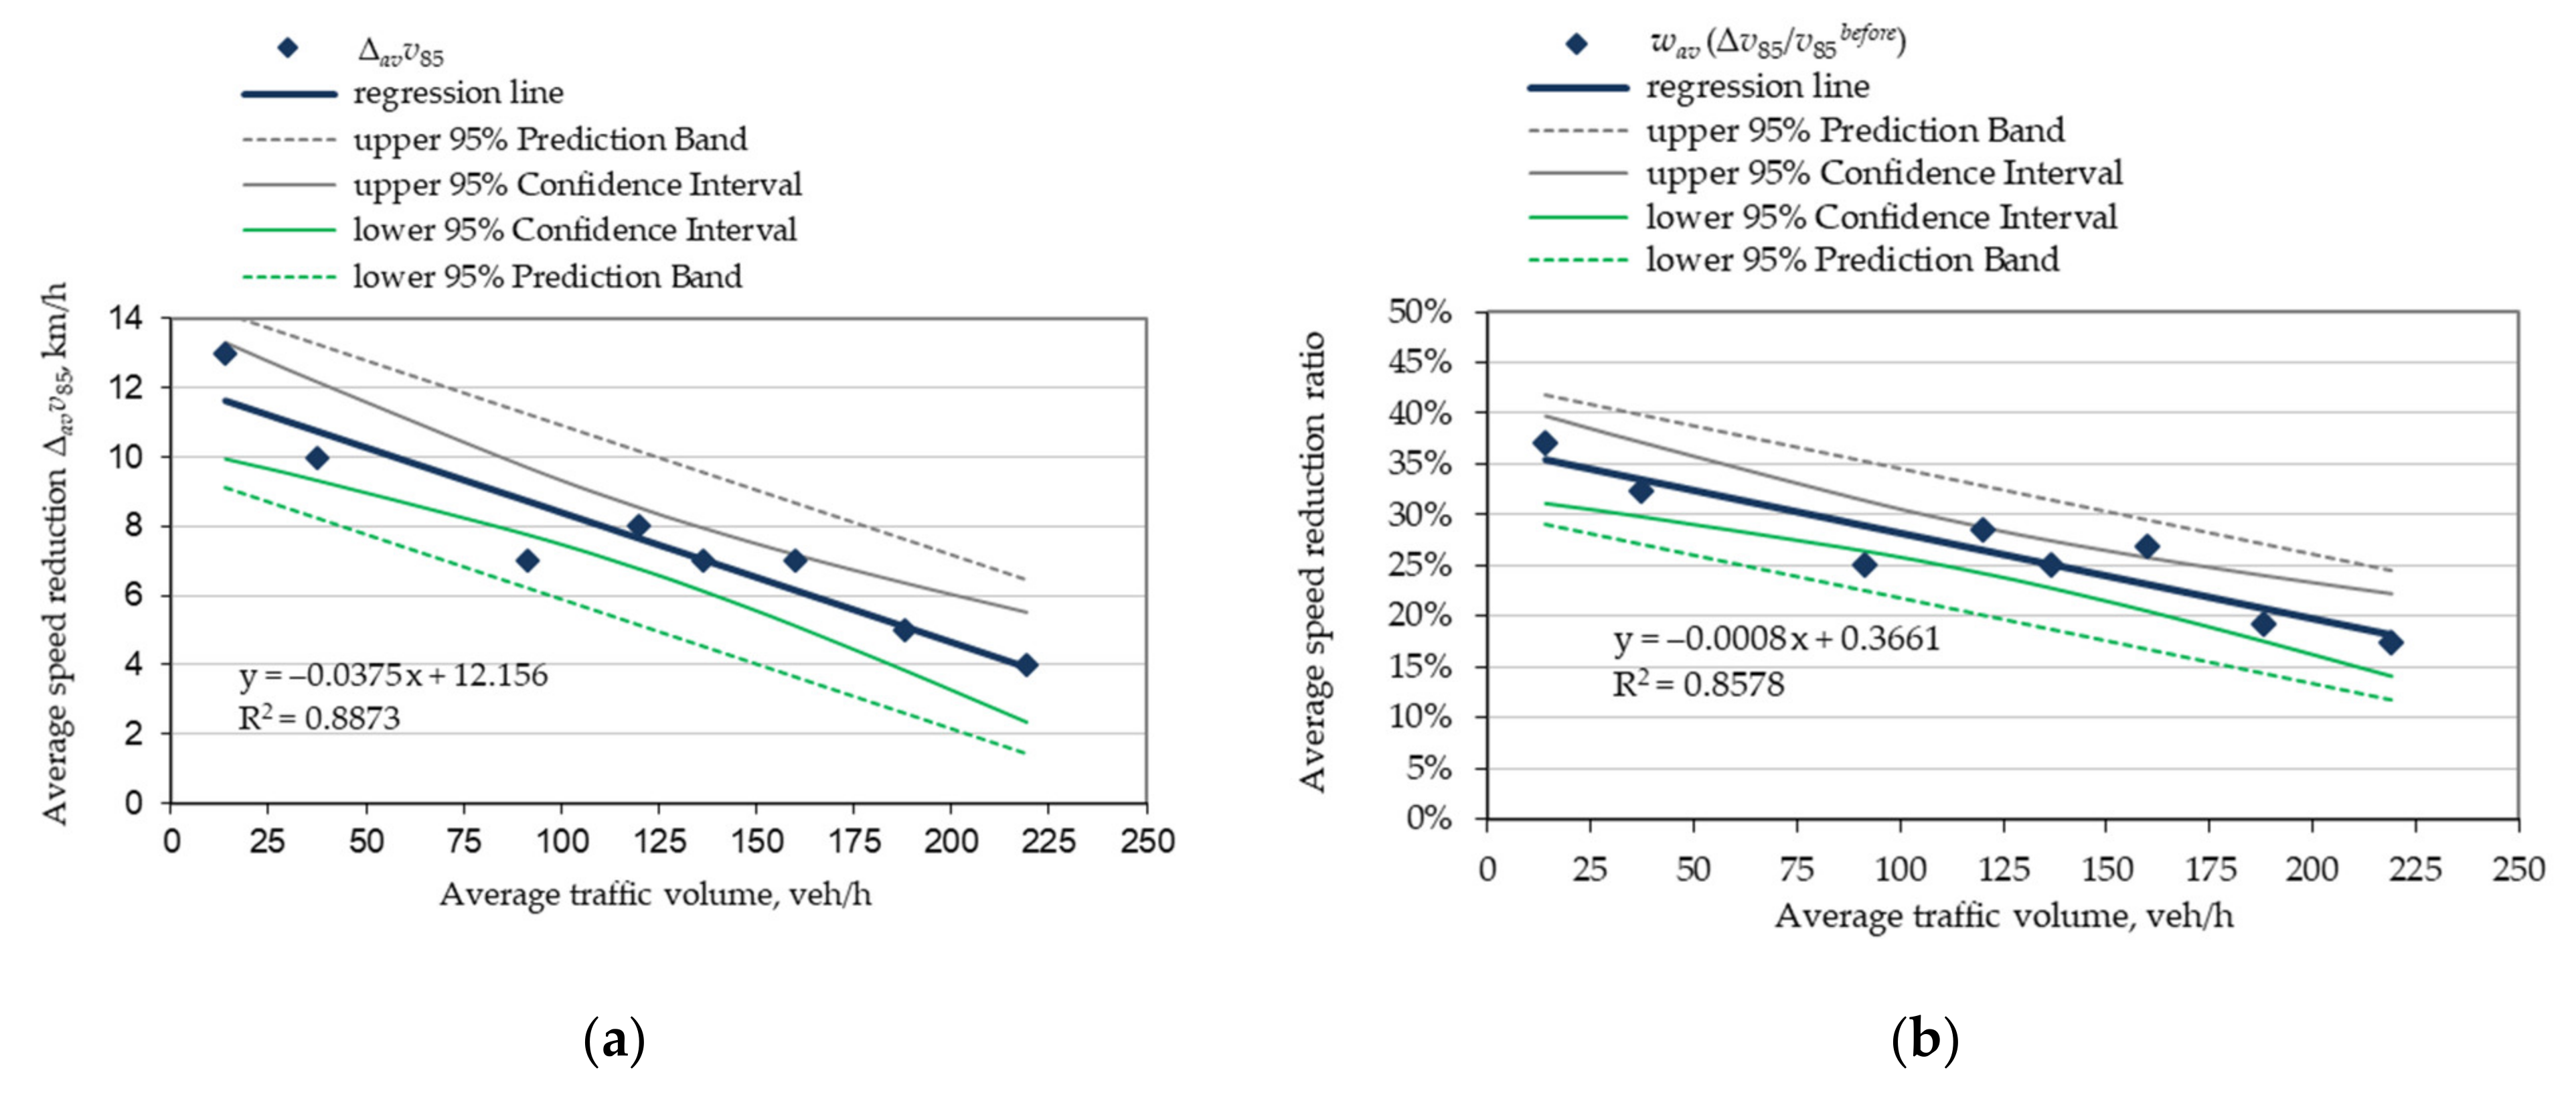
| No. 3 | −0.0375 | 12.155 | −0.94 | 89% | Very high correlation | Perfect | |
| No. 1 | w = f(Nav) | 0.0015 | 0.009 | 0.74 | 55% | High correlation | High degree |
| No. 2 | –0.0006 | 0.036 | −0.54 | 29% | Moderate correlation | High degree | |
| No. 3 | −0.0008 | 0.366 | −0.93 | 86% | Very high correlation | Perfect | |
Publisher’s Note: MDPI stays neutral with regard to jurisdictional claims in published maps and institutional affiliations. |
© 2021 by the author. Licensee MDPI, Basel, Switzerland. This article is an open access article distributed under the terms and conditions of the Creative Commons Attribution (CC BY) license (https://creativecommons.org/licenses/by/4.0/).
Share and Cite
Sołowczuk, A. Effect of Traffic Calming in a Downtown District of Szczecin, Poland. Energies 2021, 14, 5838. https://doi.org/10.3390/en14185838
Sołowczuk A. Effect of Traffic Calming in a Downtown District of Szczecin, Poland. Energies. 2021; 14(18):5838. https://doi.org/10.3390/en14185838
Chicago/Turabian StyleSołowczuk, Alicja. 2021. "Effect of Traffic Calming in a Downtown District of Szczecin, Poland" Energies 14, no. 18: 5838. https://doi.org/10.3390/en14185838
APA StyleSołowczuk, A. (2021). Effect of Traffic Calming in a Downtown District of Szczecin, Poland. Energies, 14(18), 5838. https://doi.org/10.3390/en14185838