Article

Plasma Technology for Phosphogypsum Treatment

by
Imed Ghiloufi
1,2,*,
Miqad S. Albishi
3,
Ahmed A. Alharbi
3 and
Ibrahim A. AlShunaifi
3
1
Department of Physics, College of Sciences, Imam Mohammad Ibn Saud Islamic University (IMSIU), Riyadh 11623, Saudi Arabia
2
Laboratory of Physics of Materials and Nanomaterials Applied at Environment (LaPhyMNE), Faculty of Sciences in Gabes, Gabes University, Gabes 6072, Tunisia
3
Energy and Water Research Institute, King Abdulaziz City for Science and Technology (KACST), Riyadh 11442, Saudi Arabia
*
Author to whom correspondence should be addressed.
Energies 2021, 14(18), 5813; https://doi.org/10.3390/en14185813
Submission received: 17 June 2021 / Revised: 27 July 2021 / Accepted: 19 August 2021 / Published: 14 September 2021
(This article belongs to the Special Issue Application and Development of Pyrolysis Technology)

Abstract

:
The phosphate industry generates a large amount of waste called phosphogypsum (PG). Generally, this waste is discharged without any treatment, and it causes considerable environmental problems. Hence, the objective of this study is the treatment of phosphate waste using thermal plasma technology. First, the waste is characterized using different techniques, such as X-ray fluorescence (XRF), scanning electron microscopy (SEM), energy-dispersive X-ray spectroscopy (EDS), and inductively coupled plasma (ICP). Such characterization shows that the waste contains different toxic elements, such as heavy metals, fluorine, chlorine, sulfur, and phosphorus. For this reason, a plasma reactor is used to separate toxic elements from metals, such as silicon, aluminum, and magnesium, with a pyrolysis/combustion plasma system. In this work, the influence of different parameters, such as time of treatment and plasma current, on the volatility of toxic elements is studied. The obtained results show that after 40 min of treatment and at a plasma current of 160 A, the phosphogypsum completely melts, and the most toxic elements, namely Pb, Cd, V, Cr, and As, are completely vaporized.

1. Introduction

Phosphorus is an essential trace element (in the form of salts) for many living organisms, as well as for plants when in the form of phosphate. For example, it is used in biological processes such as energy transfer, and it is also an important element of fertilizers in agriculture production [1,2,3,4,5]. The production of phosphate is increasing annually around the world due to rapid global development and the increase in energy demand. During the production of phosphoric acid, the phosphate industry pollutes the environment because it generates a large amount of waste called phosphogypsum (PG) [6,7,8,9,10]. Studies show that the production of PG around the world is about 250 million tons per year [11].
The waste treated in this study was collected from the phosphate industry in Gabes (Tunisia), which uses phosphate rocks (phosphorite). These phosphorites were used to produce phosphoric acid. To produce 1 ton of phosphoric acid, this process generates 5 tons of phosphogypsum (PG) [9]. Phosphogypsum contains several pollutants, such as heavy metals, fluorine, phosphorus, and radioelements [7,9,10,12,13,14,15,16]. All of the waste (PG, industrial sludge, and waste water) is directly discharged into the sea through a canal, with a considerable environmental impact [17,18].
PG causes huge environmental problems because most of this waste is discharged without any treatment, and the use of PG treatment methods is limited around the world. Among the methods of valorization and treatment of PG is the use of sodium fluoride (NaF) to transform the waste into sodium sulfate and pure calcium fluoride. This technique allows 15 million tons of PG to be transformed into sodium sulfate (12.383 million tons) and calcium fluoride (6.809 million tons) [19]. Another study showed that phosphate impurities, fluoride, and other elements present in PG cannot be chemically removed and contain a high percentage of calcium sulfate. However, this study proves that it is possible to treat PG using a high-temperature technique, and the impurities present in the waste become inert. It is also possible to valorize this waste by producing anhydrite [20]. Hence, a high-temperature method, such as a plasma furnace, can represent a good solution for the effective treatment of this type of waste.
Plasma technology is used for the treatment of different types of waste. For example, plasma is used for the vitrification of fly ash [21,22,23], radioactive waste [24,25,26], and electronic waste [27]. The choice of this technology to treat these wastes is due to the advantages offered by plasma. In fact, in a thermal plasma furnace, the temperature and energy densities are high, which allows high reactant transfer rates and heat to be achieved. These advantages allow refractory materials to be melted and reduce the installation size for a given waste throughput. Moreover, heat generation is independent of the treated substances, because plasma systems use electricity as an energy source. This advantage increases process controllability and flexibility and provides more options in process chemistry, such as the possibility of generating a valuable product [28,29].
Plasma technology is becoming increasingly attractive for waste treatment, and it can be classified into three categories: plasma gasification, plasma pyrolysis, and plasma compaction and vitrification. For solid wastes containing high fractions of organic materials with high calorific values, plasma gasification combined with vitrification can offer an attractive alternative to treating such wastes and producing a synthesis gas [30,31]. On the other hand, wastes containing inorganic solid materials, such as phosphogypsum, can be treated by retaining their valuable components and reducing their volume. The disadvantage of plasma is the use of electricity, which is an expensive energy source. For this reason, the production of valuable products, such as syngas, electricity, or hydrogen, is necessary to compensate the actual costs.
The objective of this work is the treatment of the waste (phosphogypsum) using thermal plasma. In the first step, the waste is characterized using different techniques to identify its constituents and properties. In the second step, plasma technology is used to separate the toxic elements from the waste and to study the effect of different parameters, such as the time of treatment and the plasma current, on the final product.

2. Materials and Methods

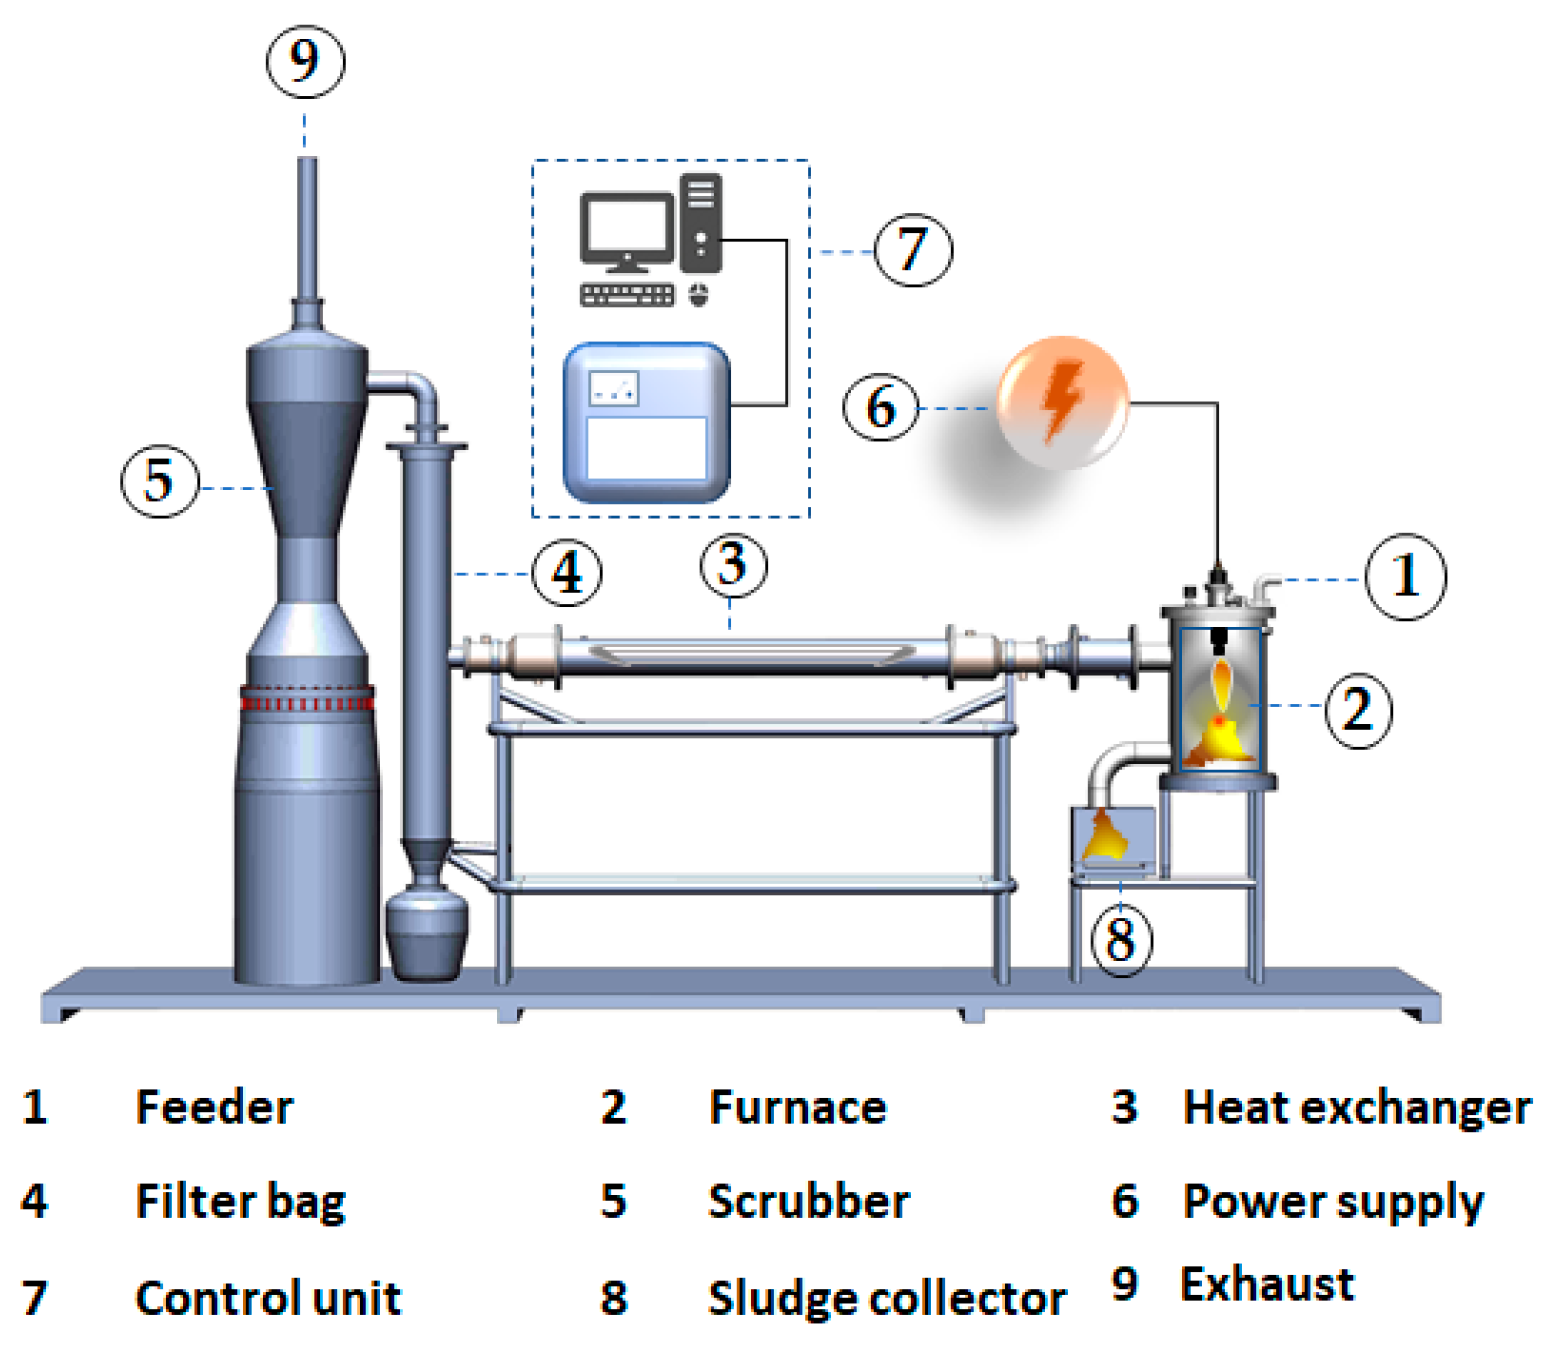
2.1. Experimental Setup

The experimental setup used to treat the waste of phosphate is given in Figure 1. The plasma system contains a plasma torch, furnace, heat exchanger, filter bag, and scrubber. A power supply was designed to supply the torch with the required power. The system contains a remote control with a PC to manage the insulation and monitor the operating parameters and a dispenser that controls the supply of phosphate waste in the furnace. In the plasma reaction chamber, the working gas is air, and it is injected vertically into the plasma torch at a flow rate of 45 m3/h. In the plasma torch, the current intensity varies from 100 to 160 A, whereas the voltage is fixed at 220 V. This torch is powered by a DC source to generate a non-transferred plasma arc. The proprieties of this torch are presented in Table 1. A filter bag is used for purification of the exhaust flow from mechanical impurities, sprays, vapors, and gas impurities. The feeder is filled with phosphate waste and mechanically provides loading of 25 kg/h into the plasma reaction chamber.

2.2. Chemical Qualitative Methods

To determine the waste chemical composition, X-ray fluorescence (XRF) was used. The concentrations of carbon, oxygen, calcium, and sulfur present in the waste were measured using energy-dispersive X-ray spectroscopy (EDS). To measure the concentration of toxic elements, such as Pb, Cd, Zn, Cr, and As, inductively coupled plasma–atomic emission spectroscopy (ICP-AES) was used. The morphology and size of waste were determined using scanning electron microscopy (SEM).

3. Results

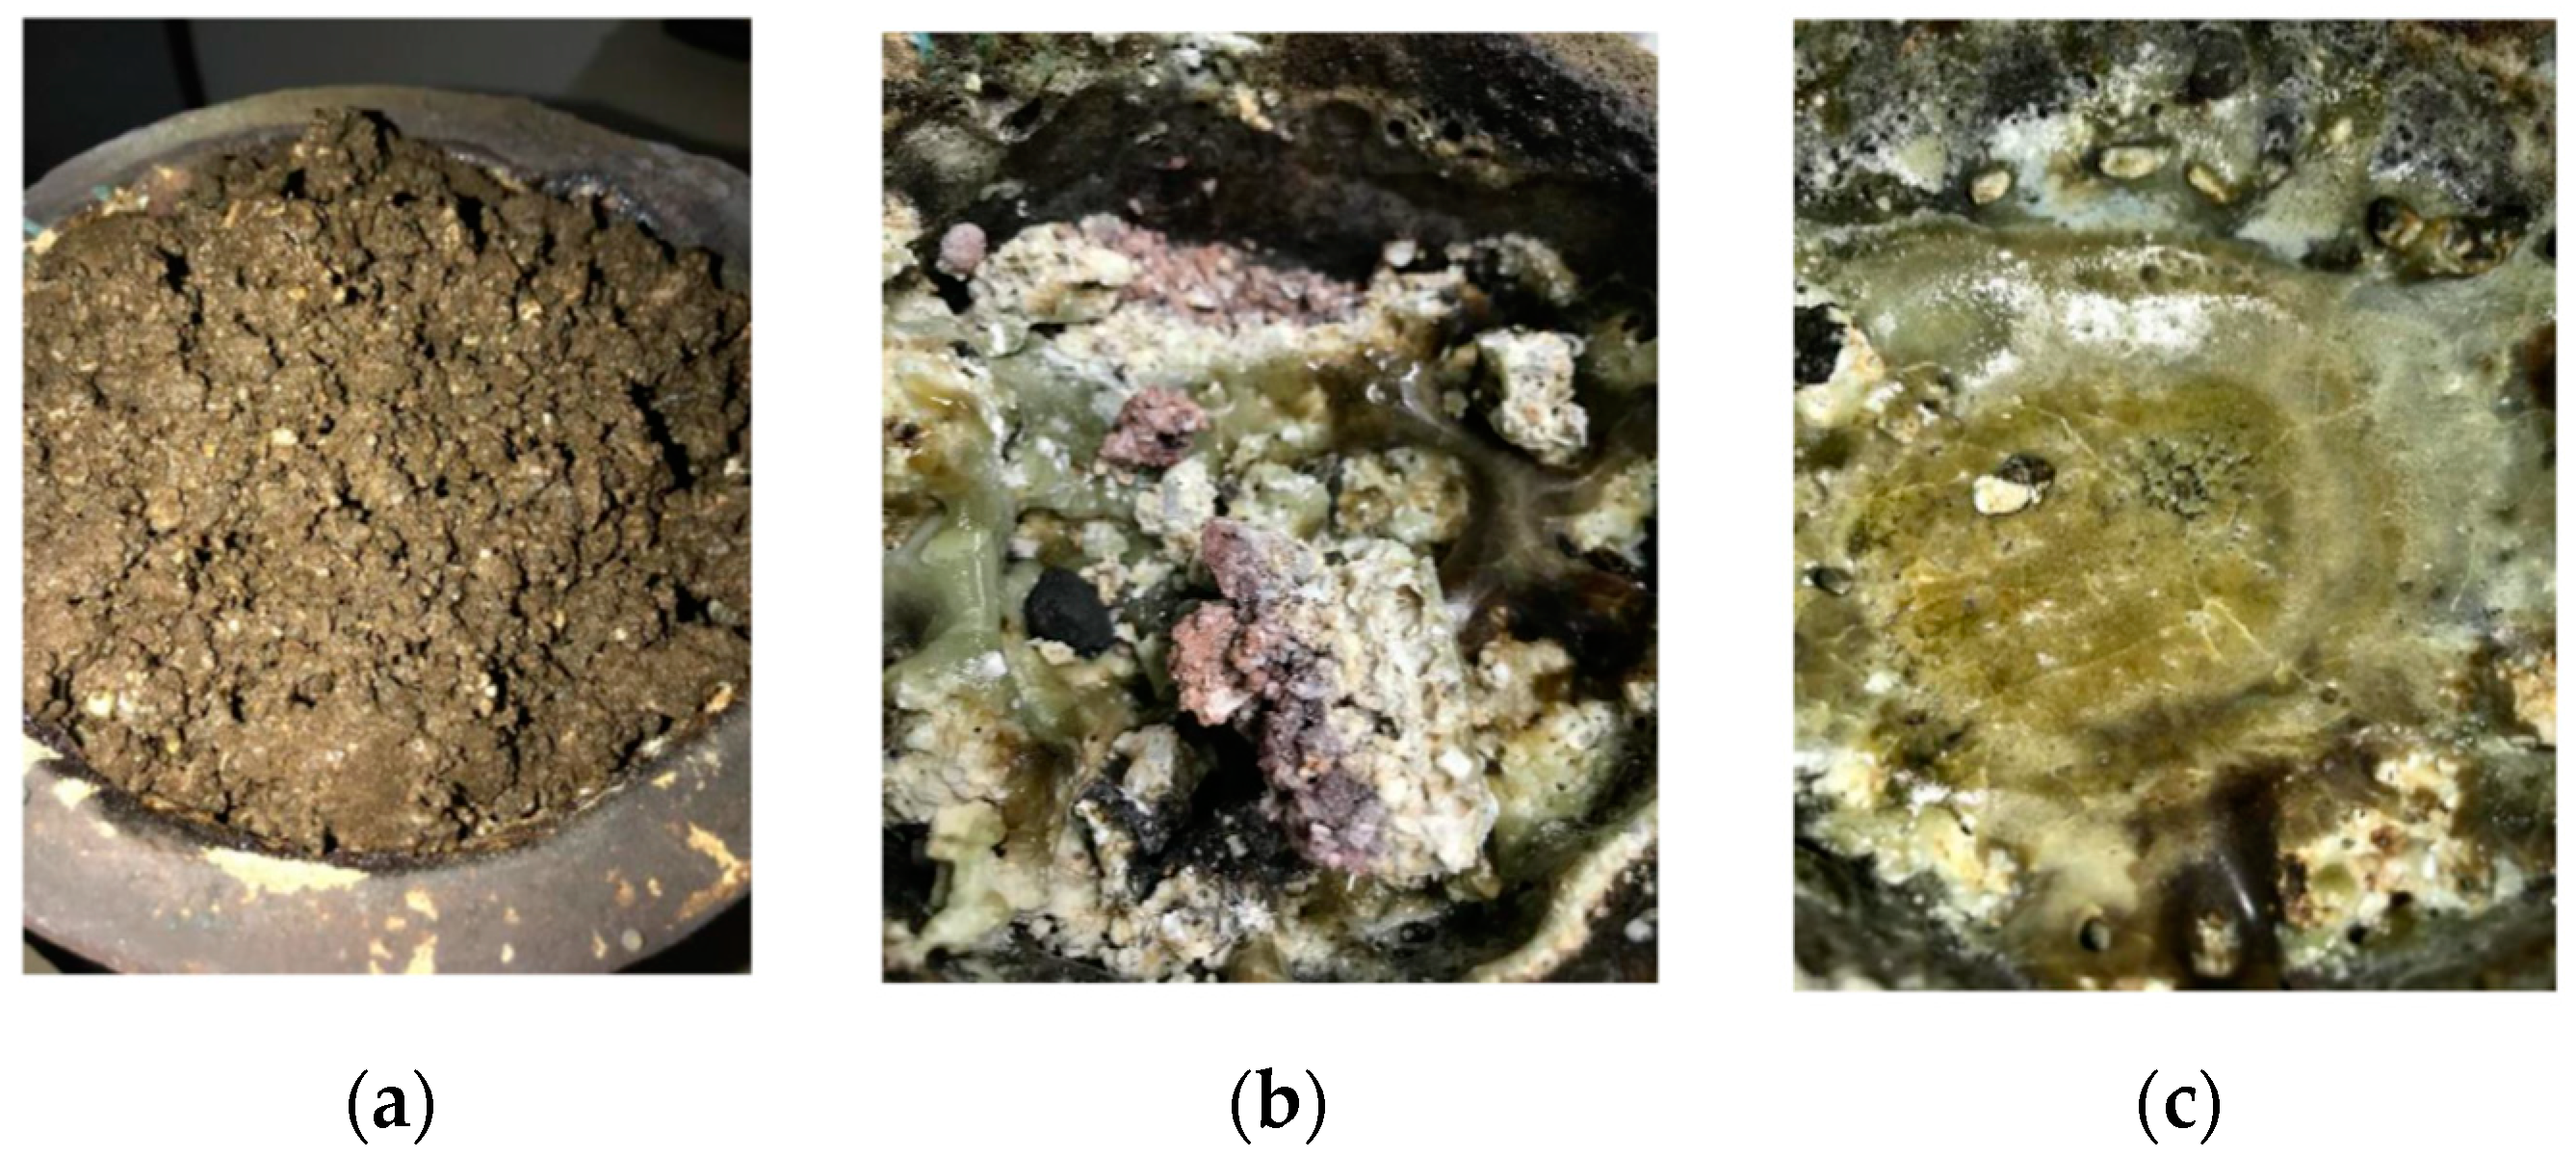
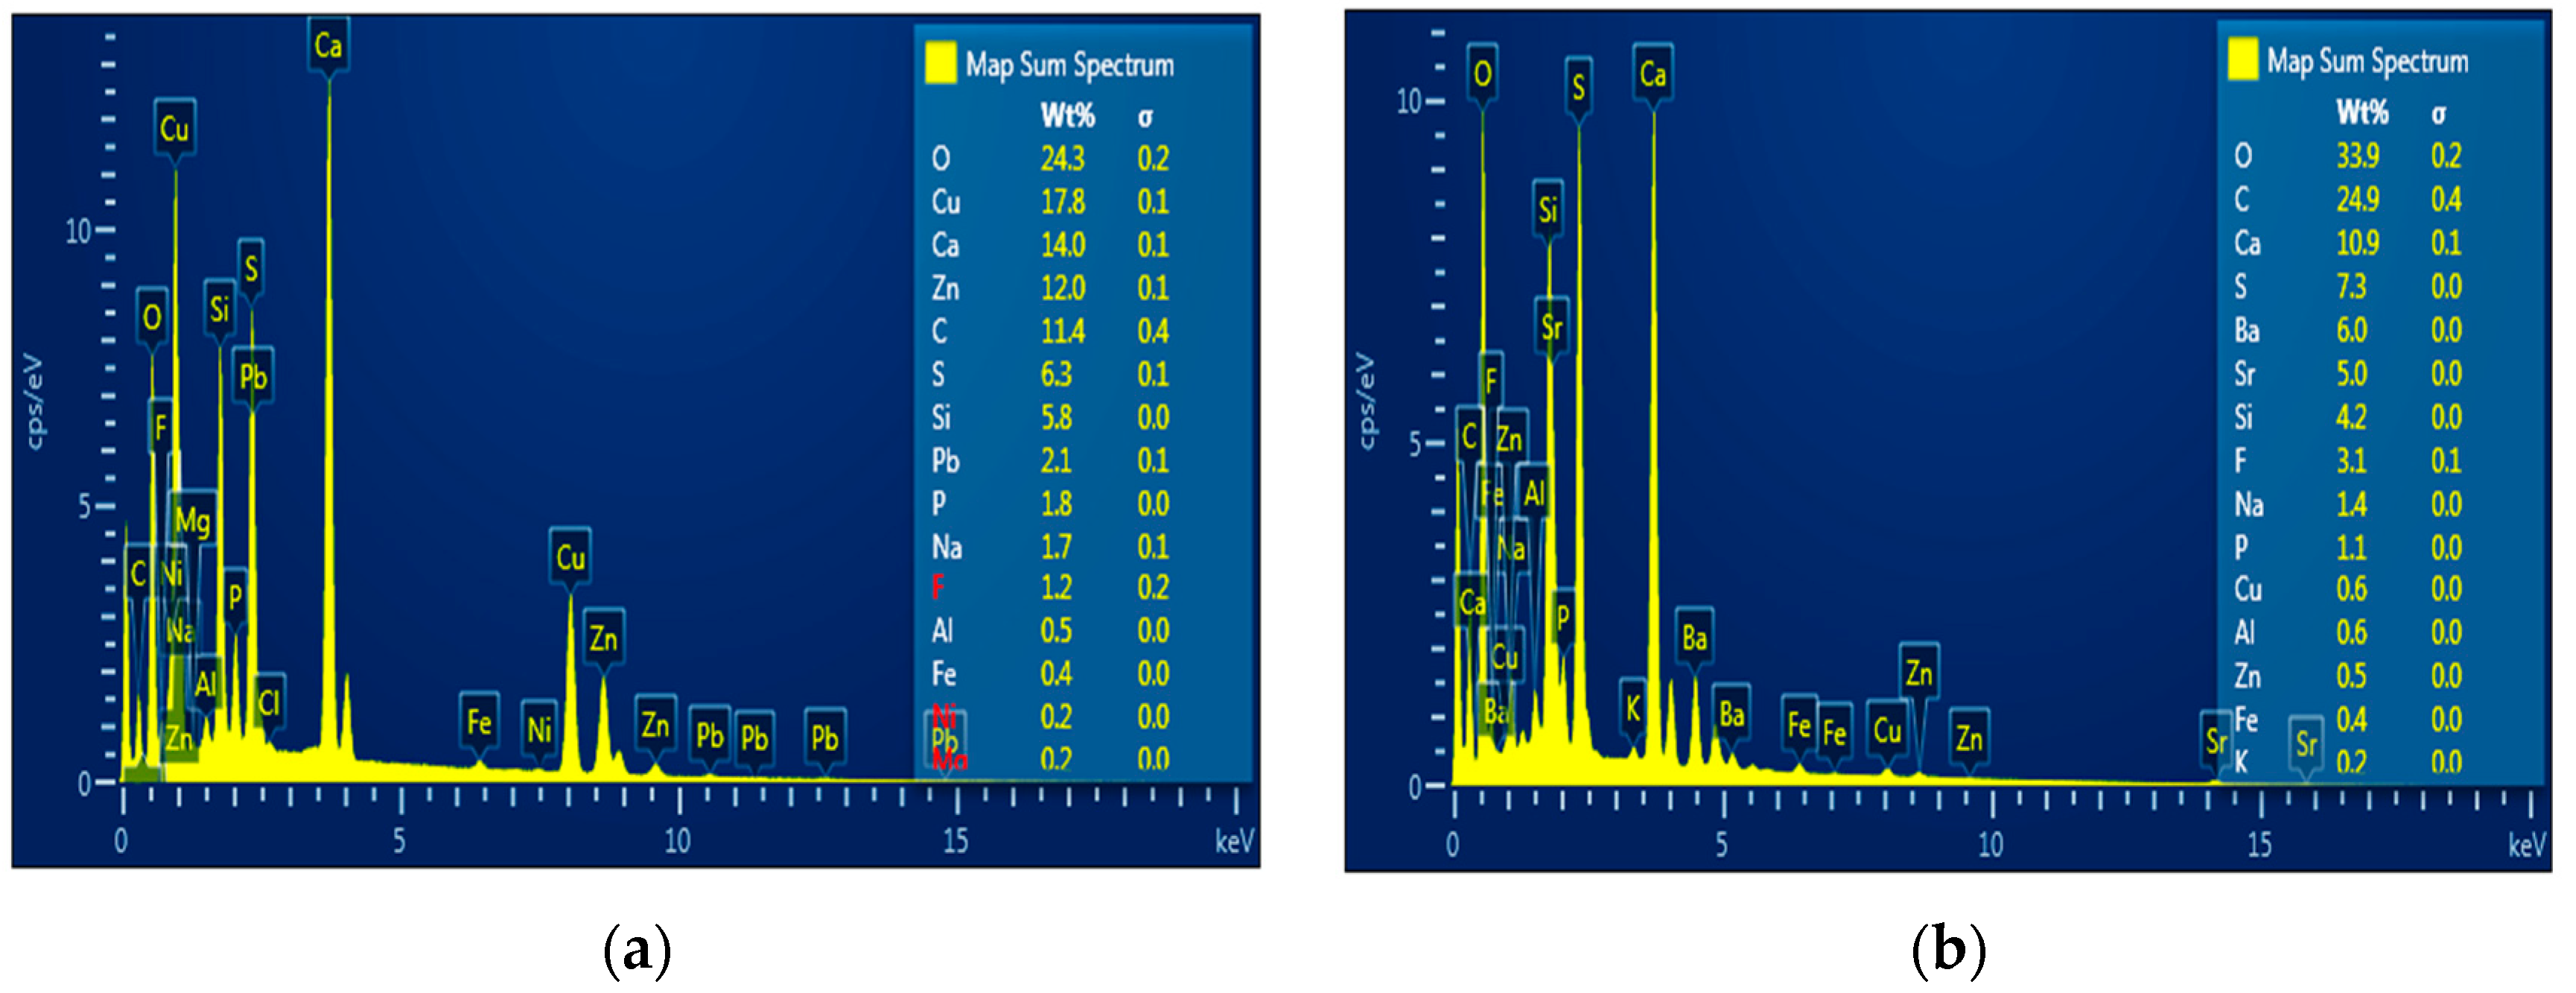
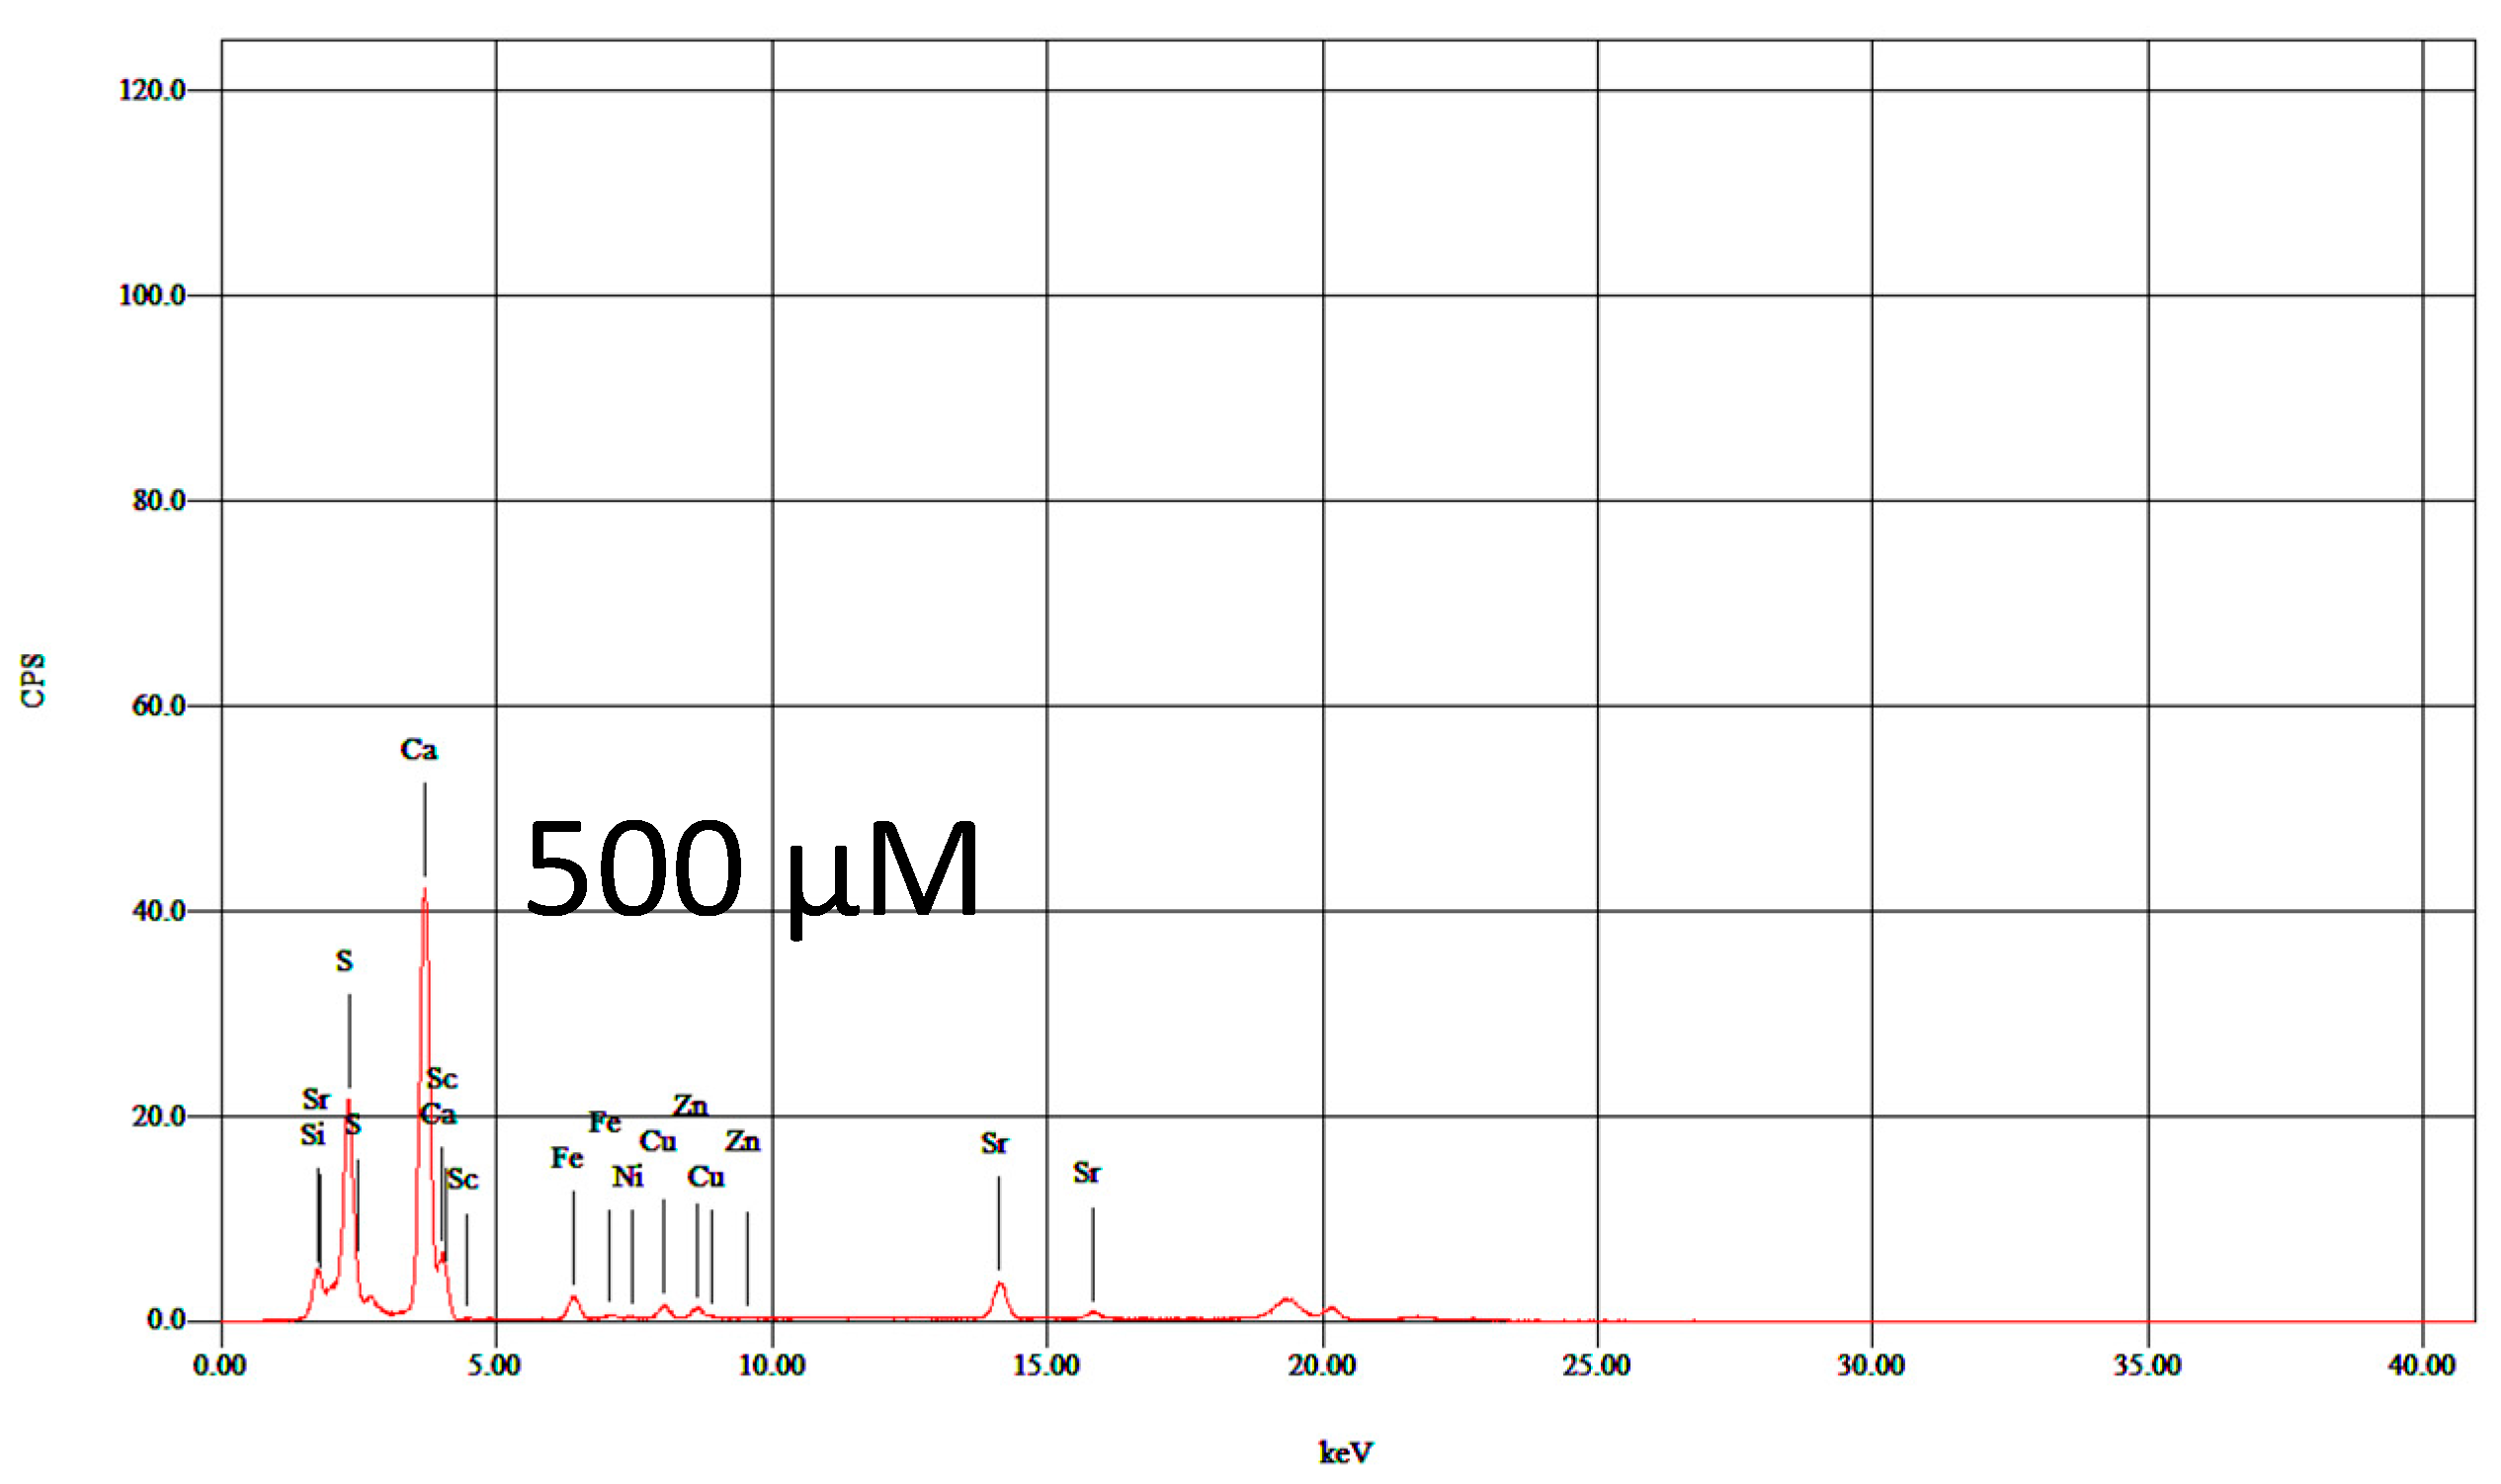
3.1. Characterization of Phosphate Waste before Treatment

The sample collected from phosphate waste was randomly tested. Part of the sample was dried in an oven at 60 °C for 48 h and then pulverized. The dried phosphate waste was characterized by different techniques, such as X-ray fluorescence (XRF), scanning electron microscopy (SEM), energy-dispersive X-ray spectroscopy (EDS), and inductively coupled plasma (ICP).
To gain preliminary information about the chemical composition of phosphate waste, the XRF technique was used, and Figure 2 shows the predictions of the principal elements present in the waste. This figure shows that waste contains many chemical elements, such as Sr, S, Ca, Sc, Fe, Ni, Zn, and Cu. With this technique, some elements cannot be detected, and the concentrations of elements cannot be determined; for these reasons, the EDS technique was used (Figure 3). The conducted analysis showed that the waste was essentially composed of O, Ca, and S, which represent the general composition of gypsum. In addition, the analysis showed the presence of other elements, such as C, F, Na, Mg, Si, P, Al, Fe, Cu, and Cl.
To analyze the phosphate waste using the ICP technique, the waste must be transformed from solid state to liquid state. Table 2 presents the results of the chemical analysis of phosphate waste obtained by ICP. This result shows that the waste is essentially composed of iron and aluminum. This waste is toxic because it contains arsenic and heavy metals, such as lead, chromium, vanadium, zinc, and cadmium. The results of the sample analysis using SEM are displayed in Figure 4, which show that the phosphate waste had random morphology, irregular shapes, and different sizes (20 to 50 μm).

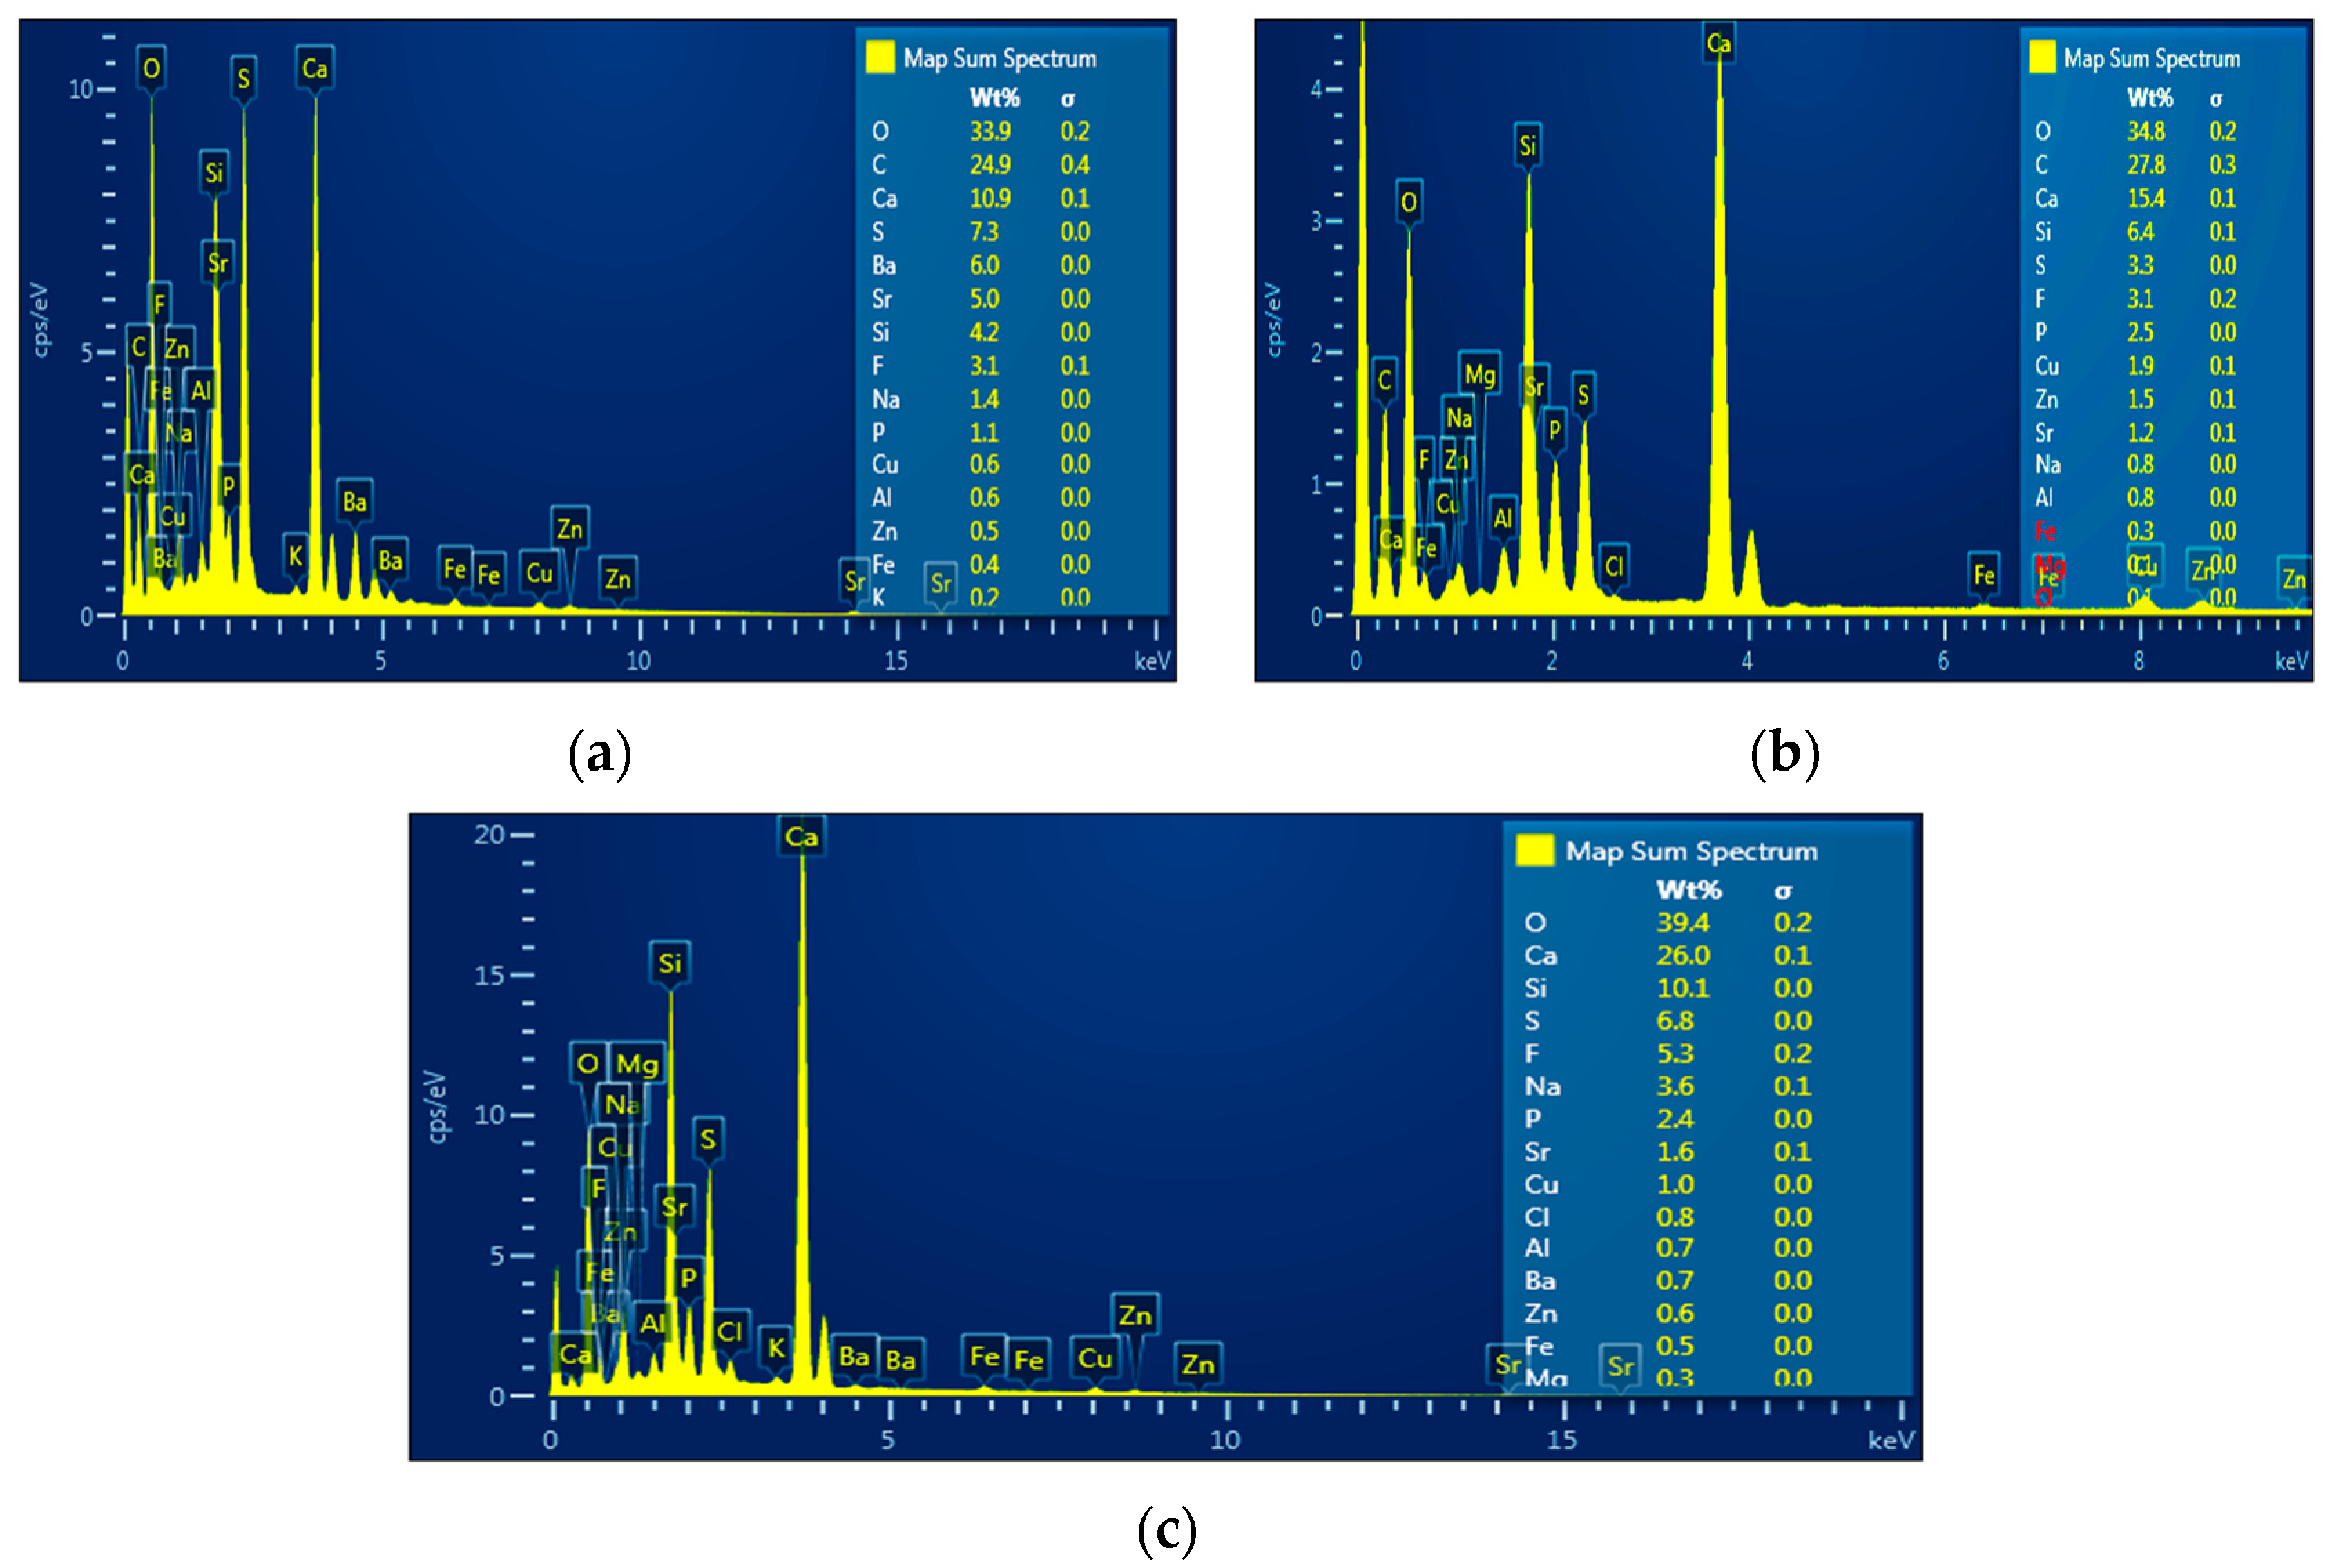
3.2. Treatment of Waste Using Thermal Plasma

3.2.1. Influence of Time of Treatment

To treat the phosphate waste using plasma technology, 750 g of waste was placed into a crucible inside the plasma furnace. We used this quantity of waste because this is the maximum capacity of the crucible used in this study (Figure 5a). The plasma torch was run for 30 min, air was used as a carrier gas, and the plasma current was fixed at 100 A. The color and form of the final product after treatment changed when compared to those of its initial state (Figure 5). The mass of waste after treatment was measured, and it had a value of 414 g; hence, 336 g of waste evaporated during the treatment. Figure 5b shows that the waste was partially melted, because its color did not change at the bottom of the crucible. For this reason, the time of the experiment was increased to 40 min, and Figure 5c shows that the wastes were completely melted after this treatment time. The mass of waste after 40 min of treatment was 400 g.
XRF analysis of waste after 30 and 40 min of treatment is shown in Figure 6. This figure and Figure 2 show that the waste has the same composition before and after treatment. Figure 7 present the EDS analysis of waste after treatment. This figure shows that O, C, S, and Ca remain the principal constituents of phosphate waste before and after treatment. Some elements, such as chromium, were initially present in the waste (Figure 3), but they disappeared after treatment. However, other elements evaporated in large quantities (Ca and Na).
Figure 8 shows the heavy metal masses before and after treatment. These masses were calculated from the concentrations obtained using the ICP technique (Table 3) and according to the following equation:
m i = C i . M T
where Ci and mi represent the concentration and the mass of the element, respectively, whereas MT is the total mass of the waste remaining in the furnace after treatment.
Figure 8 shows that the variations in metal masses are important after the treatment. For example, the initial mass of lead in the waste was 48 mg, whereas after plasma treatment, lead was completely vaporized. The same effect for other toxic elements, such as Cd, As, and Cr, was observed. The time of treatment has an effect on the volatility of metals. For example, after 30 min of treatment, Al remains in the condensed phase, whereas it is completely vaporized after 40 min of treatment. For metals such as Fe, Mg, Be, and Zn, the increase in the time of treatment increases their volatility, and their masses in the condensed phase become weak after 40 min of treatment.

3.2.2. Influence of Plasma Current

In this study, three values of plasma current (100, 130, and 160 A) were used, and the time of treatment was fixed at 40 min. The plasma torch can work with a current voltage equal to 400 V, but in our study, 220 V was sufficient to provide the necessary power. Our current generator can provide current up to 400 A, but in our study, 160 A was sufficient to completely melt the waste. At the end of each experiment, the wastes were analyzed via SEM, EDS, and ICP. The evaporated masses of waste were 350, 400, and 500 g when the plasma current was fixed at 100, 130, and 160 A, respectively. This result proves that the increase in plasma current leads to the vaporization of waste.
Figure 9 present EDS analysis of waste at different plasma currents. The waste had the same principal constituents (O, Ca, C, and S), except in the case where the plasma current was 160 A, as the carbon completely disappeared. This result can be expected, because the increase in the plasma current increases the temperature inside the furnace, and carbon is volatile at high temperatures. Barium had the same behavior as that of carbon when the plasma current varied. In fact, Ba disappeared from the waste when the current had a value of 140 A. However, the concentration of Ca increased when the plasma current increased, and this was due to the decrease in the concentrations of other principal constituents, such as C and S. This effect can be explained by the fact that as Ca is a refractory element, its mass remains the same during treatment. In contrast, the total mass of waste decreases after treatment, so the concentration of Ca (g/kg) must increase after waste treatment.
Figure 10 depicts the masses of heavy metals present in the waste at different plasma currents. These masses were calculated from Equation (1) and using the ICP results (Table 4). Toxic elements, such as Pb and As, were completely vaporized regardless of the used plasma current. Other elements such as V, Cd, and Cr disappeared from the waste when the used plasma current was 130 A. This figure shows that the masses of elements, such as Mg, Fe, and Al, decreased when the plasma current increased, and these elements were completely vaporized when the plasma current was fixed at 160 A.

4. Conclusions

In this study, phosphate waste was treated using plasma technology. The wastes were mainly composed of carbon, calcium, and sulfate. In addition, the analysis shows the presence of other elements, such as C, F, Na, Mg, Si, P, Al, Fe, Cu, and Cl. These wastes are toxic because they contain arsenic and heavy metals, such as lead, chromium, vanadium, zinc, and cadmium. The wastes have irregular shapes and various particle sizes (20 to 50 μm). To separate toxic elements from waste, thermal plasma is used. The obtained results show that 30 min of treatment is not sufficient to completely melt 750 g of waste, whereas 40 min treatment results in the waste being completely melted. The time of treatment has an effect on the volatility of metals. The increase in the plasma current causes an increase in the vaporized quantity. After 40 min of treatment, and with a plasma current of 160 A, the most toxic elements, such as Pb, Cd, V, Cr, As, and Zn, are completely vaporized, and the waste becomes inert. Hence, plasma technology is promising in regard to the separation of toxic elements from phosphate waste.

Author Contributions

Conceptualization, I.G., A.A.A. and M.S.A.; methodology, I.G., I.A.A. and M.S.A.; formal analysis, A.A.A. and I.G.; investigation, M.S.A. and I.G.; resources, A.A.A. and M.S.A.; writing—original draft, M.S.A., A.A.A. and I.G.; writing—review and editing, I.G., M.S.A., A.A.A. and I.A.A. All authors have read and agreed to the published version of the manuscript.

Funding

This research received no external funding.

Institutional Review Board Statement

Not applicable.

Informed Consent Statement

Not applicable.

Data Availability Statement

Data is contained within the article.

Acknowledgments

The authors acknowledge the financial support from the Energy and Water Research Institute, King Abdulaziz City of Science and Technology, project no. 31-461, “Treatment of Waste from Desalination Plants Using Plasma”.

Conflicts of Interest

The authors declare no conflict of interest.

References

  1. Ruttenberg, K.C. Reassessment of the oceanic residence time of phosphorus. Chem. Geol. 1993, 107, 405–409. [Google Scholar] [CrossRef]
  2. FoÈ llmi, K.B. The phosphorus cycle, phosphogenesis and marine phosphate-rich deposits. Earth-Sci. Rev. 1996, 40, 55–124. [Google Scholar] [CrossRef]
  3. Ruttenberg, K.C.; Dyhrman, S.T. Dissolved organic phosphorus production during simulated phytoplankton blooms in a coastal upwelling system. Front. Microbiol. 2012, 3, 274. [Google Scholar] [CrossRef] [Green Version]
  4. Cisse, L.; Mrabet, T. World Phosphate Production: Overview and Prospects. Phosphorus Res. Bull. 2004, 15, 21–25. [Google Scholar] [CrossRef] [Green Version]
  5. El Kateb, A.; Stalder, C.; RuÈggeberg, A.; Neururer, C.; Spangenberg, J.E.; Spezzaferri, S. Impact of industrial phosphate waste discharge on the marine environment in the Gulf of Gabes (Tunisia). PLoS ONE 2018, 13, e0197731. [Google Scholar] [CrossRef] [Green Version]
  6. Zhang, P. Comprehensive recovery and sustainable development of phosphate resources. Procedia Eng. 2014, 83, 37–51. [Google Scholar] [CrossRef] [Green Version]
  7. Pérez-López, R.; Alvarez-Valero, A.M.; Nieto, J.M. Changes in mobility of toxic elements during the production of phosphoric acid in the fertilizer industry of Huelva (SW Spain) and environmental impact of phosphogypsum wastes. J. Hazard. Mater. 2007, 1487, 745–750. [Google Scholar] [CrossRef]
  8. Reta, G.; Dong, X.; Zhonghua, L. Environmental impact of phosphate mining and beneficiation. Rev. Int. J. Hydrol. 2018, 2, 424–431. [Google Scholar] [CrossRef] [Green Version]
  9. Rutherford, P.M.; Dudas, M.J.; Samek, R.A. Environmental impacts of phosphogypsum. Sci. Total Environ. 1994, 149, 1–38. [Google Scholar] [CrossRef]
  10. El Afifi, E.M.; Hilal, M.A.; Attallah, M.F.; El-Reefy, S.A. Characterization of phosphogypsum wastes associated with phosphoric acid and fertilizers production. J. Environ. Radioact. 2009, 100, 407–412. [Google Scholar] [CrossRef] [PubMed]
  11. Rosales, J.; Pérez, S.M.; Cabrera, M.; Gázquez, M.J.; Bolivar, J.P.; de Brito, J.; Agrela, F. Treated phosphogypsum as an alternative set regulator and mineral addition in cement production. J. Clean. Prod. 2020, 244, 118752. [Google Scholar] [CrossRef]
  12. Zairi, M.; Rouis, M.J. Impacts environnementaux du stockage du phosphogypse à Sfax (Tunisie). Bull. Lab. Ponts Chaussées 1999, 219, 29–40. [Google Scholar]
  13. Ajam, L.; Ben Ouezdou, M.; Sfar Felfoul, H.; El Mensi, R. Characterization of the Tunisian phosphogypsum and its valorization in clay bricks. Constr. Build. Mater. 2009, 23, 3240–3247. [Google Scholar] [CrossRef]
  14. Tayibi, H.; Choura, M.; LoÂpez, F.A.; Alguacil, F.J.; LoÂpez-Delgado, A. Environmental impact and management of phosphogypsum. J. Environ. Manag. 2009, 90, 2377–2386. [Google Scholar] [CrossRef] [PubMed] [Green Version]
  15. Ajmal, P.Y.; Bhangare, R.C.; Tiwari, M.; Sahu, S.K.; Pandit, G.G. External gamma radiation levels and natural radioactivity in soil around a phosphate fertilizer plant at Mumbai. J. Radioanal. Nucl. Chem. 2014, 300, 23–27. [Google Scholar] [CrossRef]
  16. Darmoul, B.; Hadj Ali Salem, M.; Vitiello, P. Effets des rejets industriels de la reÂgion de Gabès (Tunisie) sur le milieu marin reÂcepteur. Bull. L’institut Natl. Sci. Tech. D’oceâanographie Pêche Salammbo 1980, 7, 5–61. [Google Scholar]
  17. Nafeh Kassir, L.; Lartiges, B.; Ouaini, N. Effects of fertilizer industry emissions on local soil contamination: A case study of a phosphate plant on the east Mediterranean coast. Environ. Technol. 2012, 33, 873–885. [Google Scholar] [CrossRef] [PubMed]
  18. Ennaciri, Y.; Bettach, M.; El Alaoui-Belghiti, H. Phosphogypsum Conversion into Calcium Fluoride and Sodium Sulfate. Ann. Chim. Sci. Matériaux 2020, 44, 407–412. [Google Scholar] [CrossRef]
  19. Singh, M.; Garg, M. Making of anhydrite cement from waste gypsum. Cem. Concr. Res. 2000, 30, 571–577. [Google Scholar] [CrossRef]
  20. Ghiloufi, I.; Baronnet, J.M. Simulation of Heavy Metals Volatility during the Vitrification of Fly Ashes by Thermal Plasma. J. High Temp. Mater. Process 2006, 10, 117–139. [Google Scholar] [CrossRef]
  21. Ghiloufi, I. Modeling of Chemical System Vaporization at High Temperatures: Application to the Vitrification of Fly Ashes by Plasma. J. High Temp. Mater. Process 2008, 12, 1–10. [Google Scholar] [CrossRef]
  22. Al-Mayman, S.; AlShunaifi, I.; Albeladi, A.; Ghiloufi, I.; Binjuwair, S. Treatment of fly ash from power plants using thermal plasma. Beilstein J. Nanotechnol 2017, 8, 1043–1048. [Google Scholar] [CrossRef] [PubMed] [Green Version]
  23. Ghiloufi, I. Simulation of radioelement volatility during the vitrification of radioactive wastes by arc plasma. J. Hazard Mater 2009, 163, 136–142. [Google Scholar] [CrossRef] [PubMed]
  24. Ghiloufi, I. Study of 239Pu, 144Ce and 90Sr Behavior during Radioactive Wastes Treatment by Thermal Plasma Technology. J. Plasma Chem. Plasma Process. 2009, 29, 321–331. [Google Scholar] [CrossRef]
  25. Ghiloufi, I.; Girold, C. Optical Emission Spectroscopy Measurements and Simulation of Radioelement Volatility during Radioactive Waste Treatment by Plasma. J. Plasma Chem. Plasma Process. 2011, 31, 109–125. [Google Scholar] [CrossRef]
  26. Ghiloufi, I. Chapter’s Name: Electronic Waste Treatment by Thermal Plasma, Book’s Name: E-Waste: Management, Types and Challenges; Nova Science Publishers: Hauppauge, NY, USA, 2012. [Google Scholar]
  27. Samal, S. Thermal plasma technology: The prospective future in material processing. J. Clean. Prod. 2017, 142, 3131–3150. [Google Scholar] [CrossRef]
  28. Heberlein, J.; Murphy, A.B. Thermal plasma waste treatment. J. Phys. D Appl. Phys. 2008, 41, 053001. [Google Scholar] [CrossRef]
  29. Gagnon, J.; Carabin, P. A torch to light the way: Plasma gasification technology in waste treatment. Waste Manag. World 2006, 1, 65–68. [Google Scholar]
  30. Van Oost, G.; Hrabovsky, M.; Kopecky, V.; Konrad, M.; Hlina, M.; Kavka, T.; Chumak, A.; Beeckman, E.; Verstraeten, J. Pyrolysis of waste using a hybrid argon-water stabilized torch. Vacuum 2006, 80, 1132–1137. [Google Scholar] [CrossRef]
  31. Carpinlioglu, M.O.; Sanlisoy, A. Performance assessment of plasma gasification for waste to energy conversión, a methodology for thermodynamic analysis. Int. J. Hydrog. Energy 2018, 43, 11493–11504. [Google Scholar] [CrossRef]
Figure 1. Plasma system used for phosphate waste treatment.
Energies 14 05813 g001
Figure 2. XRF analysis of phosphate waste before treatment.
Energies 14 05813 g002
Figure 3. EDS analysis of waste before treatment.
Energies 14 05813 g003
Figure 4. SEM analysis of phosphate waste before treatment at different magnifications.
Energies 14 05813 g004
Figure 5. Photo of phosphate waste: (a) before treatment, (b) after 30 min of treatment, and (c) after 40 min of treatment.
Energies 14 05813 g005
Figure 6. XRF analysis of phosphate waste after (a) 30 min of treatment and (b) 40 min of treatment.
Energies 14 05813 g006
Figure 7. EDS analysis of phosphate waste after (a) 30 min of treatment and (b) 40 min of treatment.
Energies 14 05813 g007
Figure 8. Mass of elements present in phosphate waste before and after treatment.
Energies 14 05813 g008
Figure 9. EDS analysis of phosphate waste after 40 min of treatment and with a plasma current of (a) 100 A, (b) 130 A, and (c) 160 A.
Energies 14 05813 g009
Figure 10. Mass of elements present in phosphate waste before and after treatment and at different plasma currents.
Energies 14 05813 g010
Table 1. Parameters of arc plasma torch.
ParameterValue
Power (max.)100 kW
Voltage (max.)400 V
Current (max.)400 A
Type of plasma gasAir
Air consumption5–15 g/s
Arc-stabilizing methodVertical gas
Temperature of plasma jet2000–4000 °C
Water consumption (max.)700 g/s
Air supply4.2 g/s
Table 2. Concentrations of elements present in the waste before treatment obtained by ICP.
ElementAlAsBeCdCrFeMgPbVZn
C (mg/kg)60.15.416.54.85.110017.564.81.917
Table 3. Concentrations of elements present in the waste at different treatment times obtained by ICP.
ElementAlAsBeCdCrFeMgPbVZn
C (mg/kg)
t = 30 min
114.8017.82.70.135.0729.603.614.2
C (mg/kg)
t = 40 min
7.6011.73.93.418.2110.803.34.2
Table 4. Concentrations of elements present in the waste at different plasma currents obtained by ICP.
ElementAlAsBeCdCrFeMgPbVZn
C (mg/kg)
I = 100 A
40.5011.73.93.436.336.303.34.2
C (mg/kg)
I = 130 A
34.77024.70.31.69.116.800.310.9
C (mg/kg)
I = 160 A
13.601.20.80.94.517.201.26.3
Publisher’s Note: MDPI stays neutral with regard to jurisdictional claims in published maps and institutional affiliations.

