
A Process-Planning Framework for Sustainable Manufacturing

 , , ,
, , ,  , and
, and
Abstract

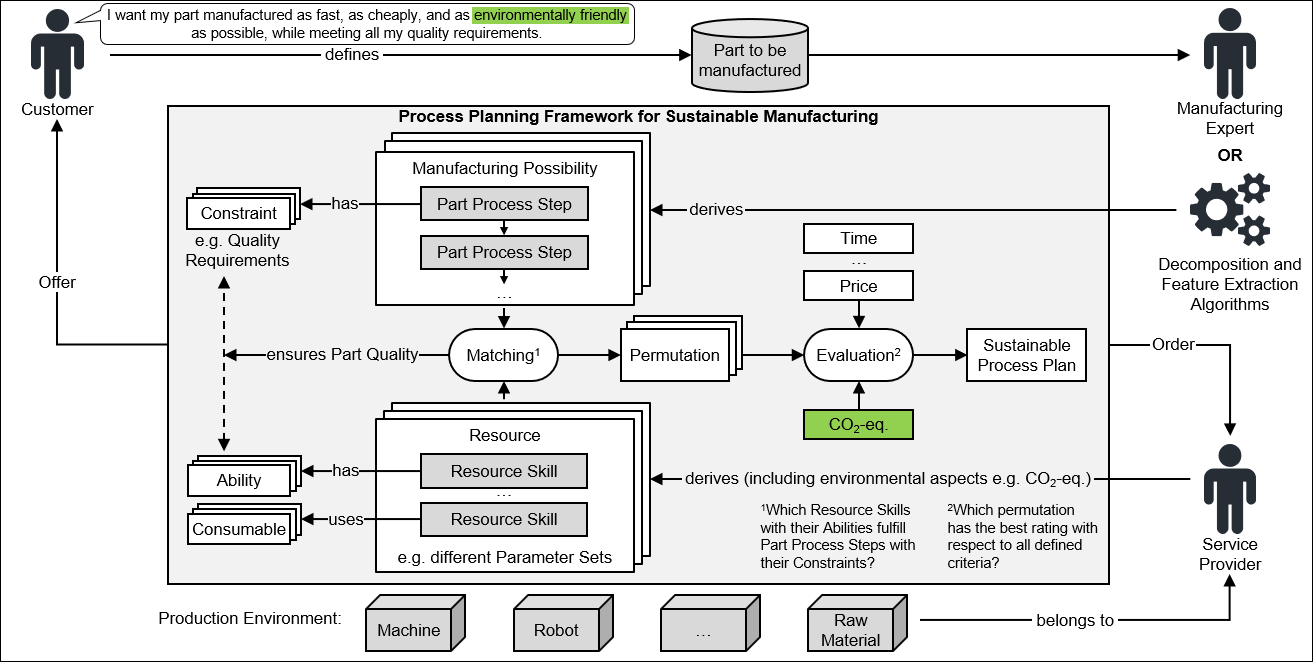
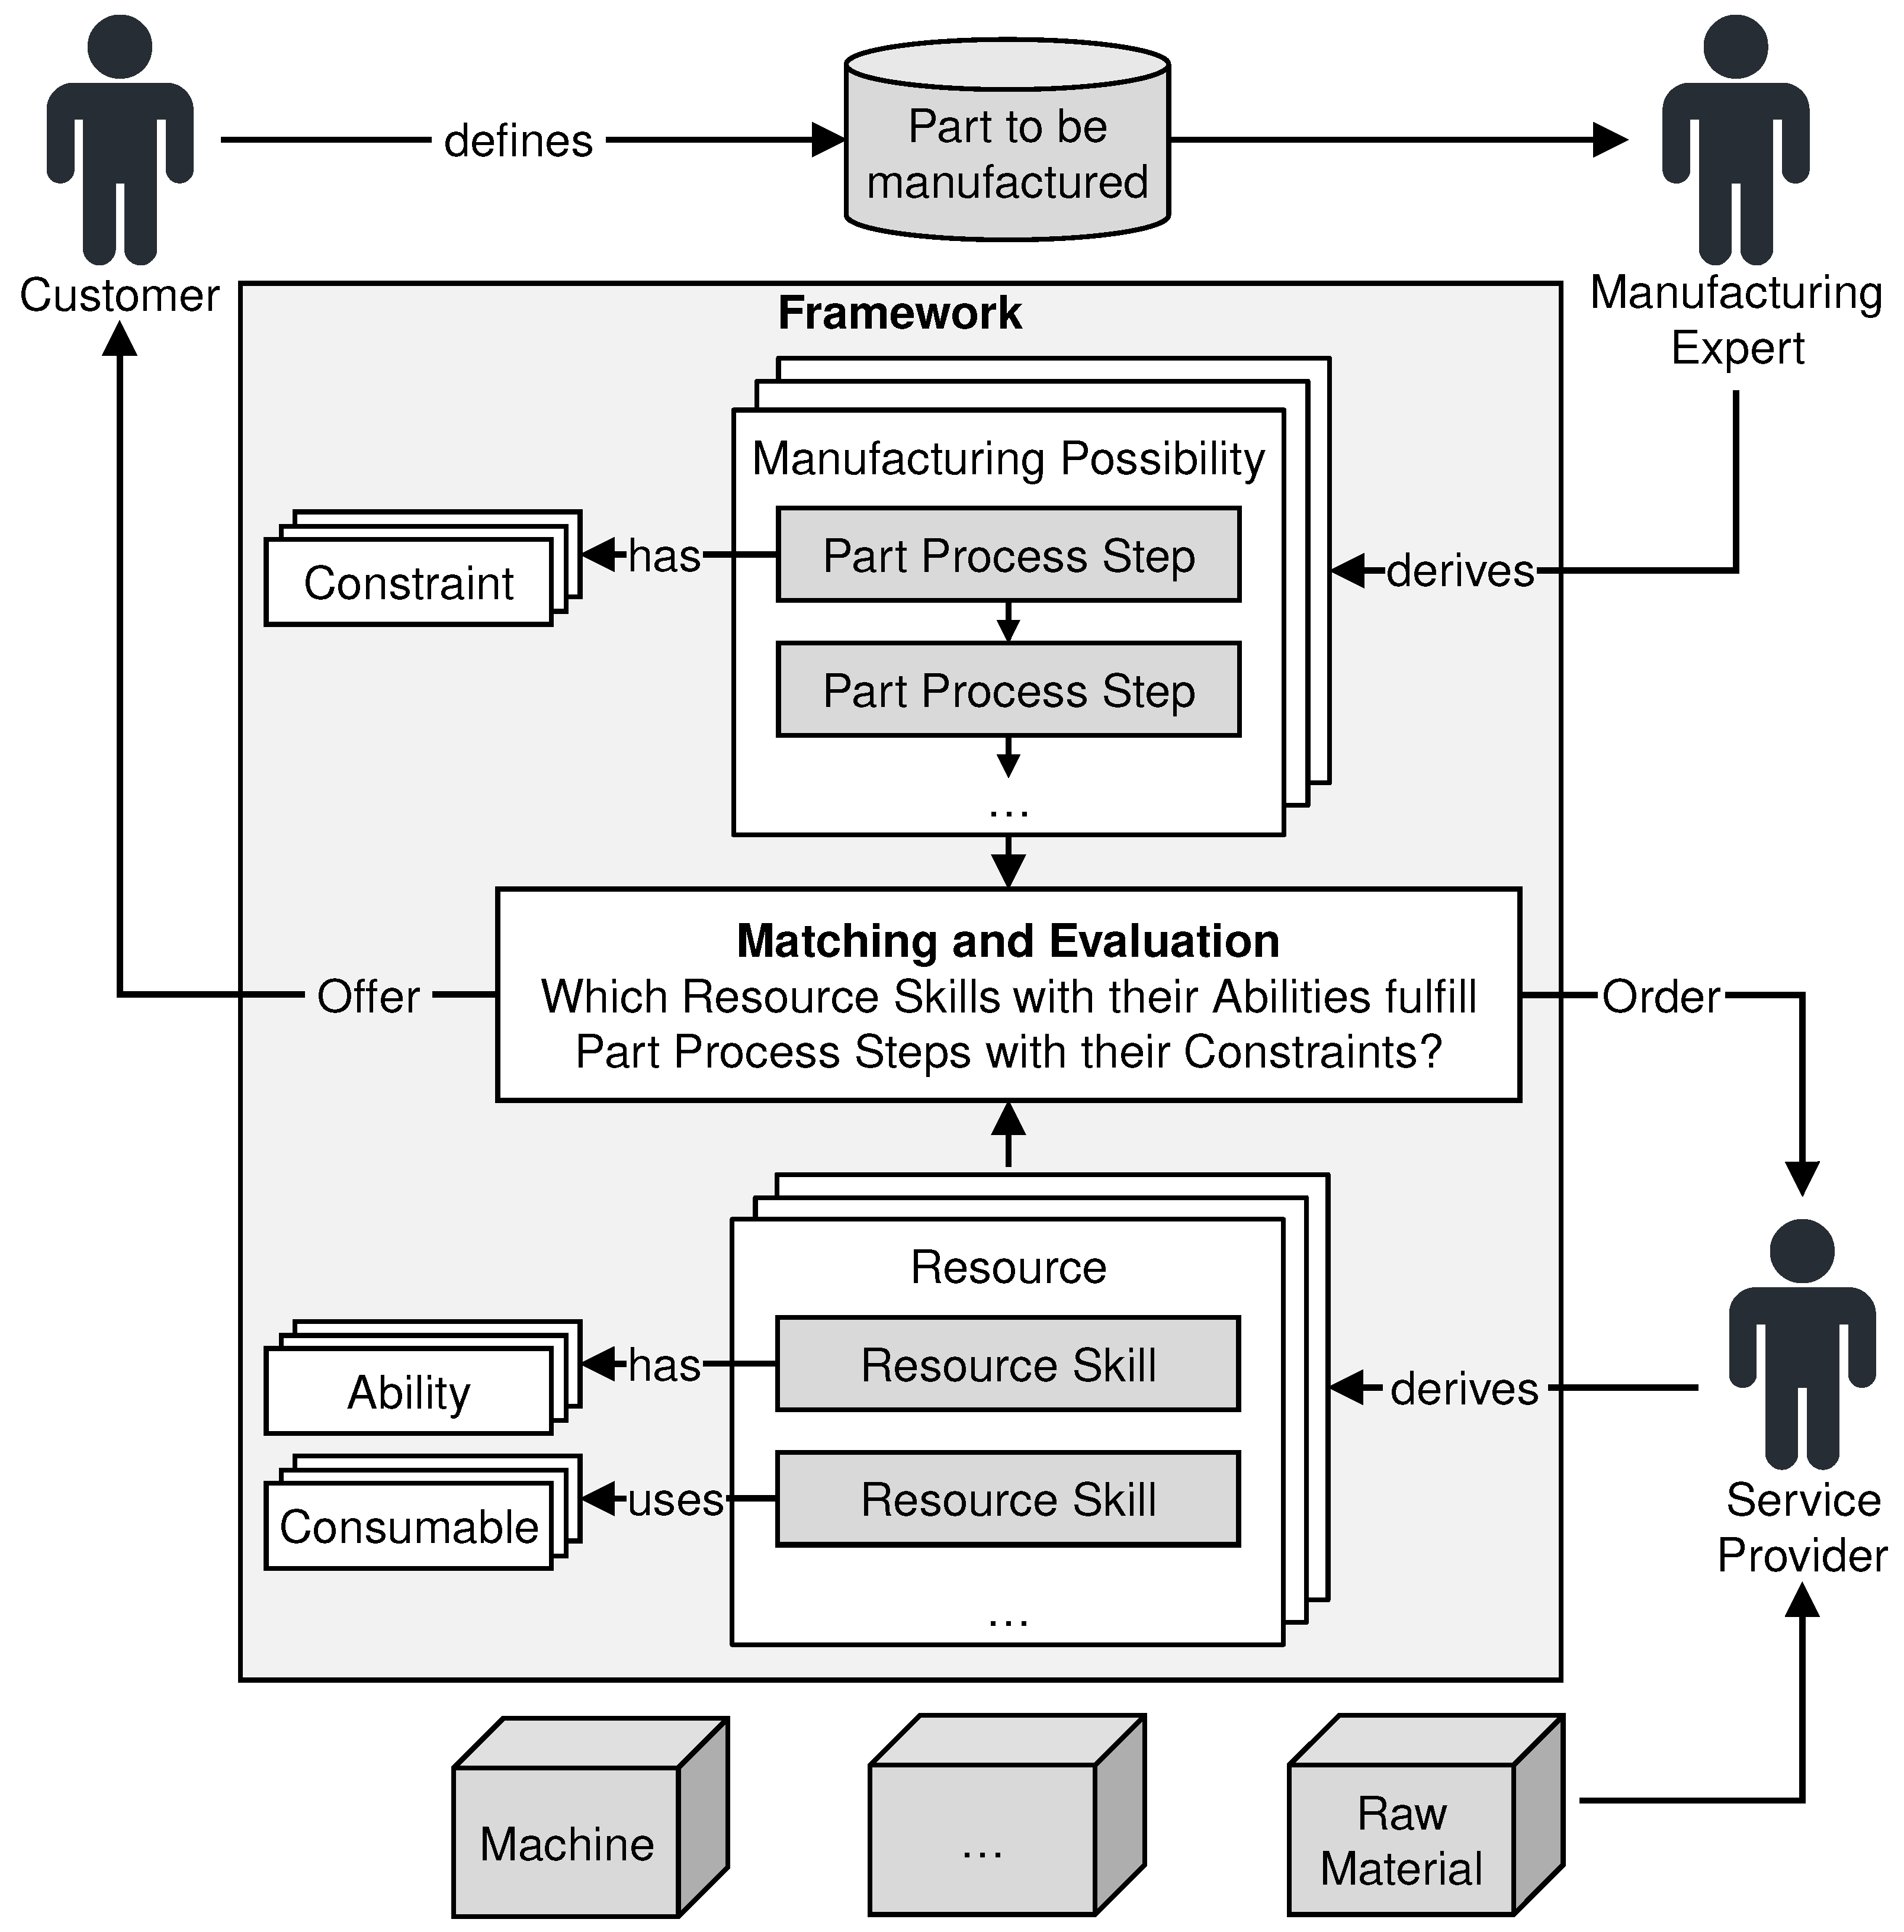
1. Introduction
2. Literature Review
2.1. Computer-Aided Process Planning
2.2. Integration of Energy Consumption into CAPP
2.3. Assessment of Environmental Impacts within Process Planning
2.4. Integration of Environmental Impacts into Manufacturing Systems and Process Planning
3. Materials and Methods
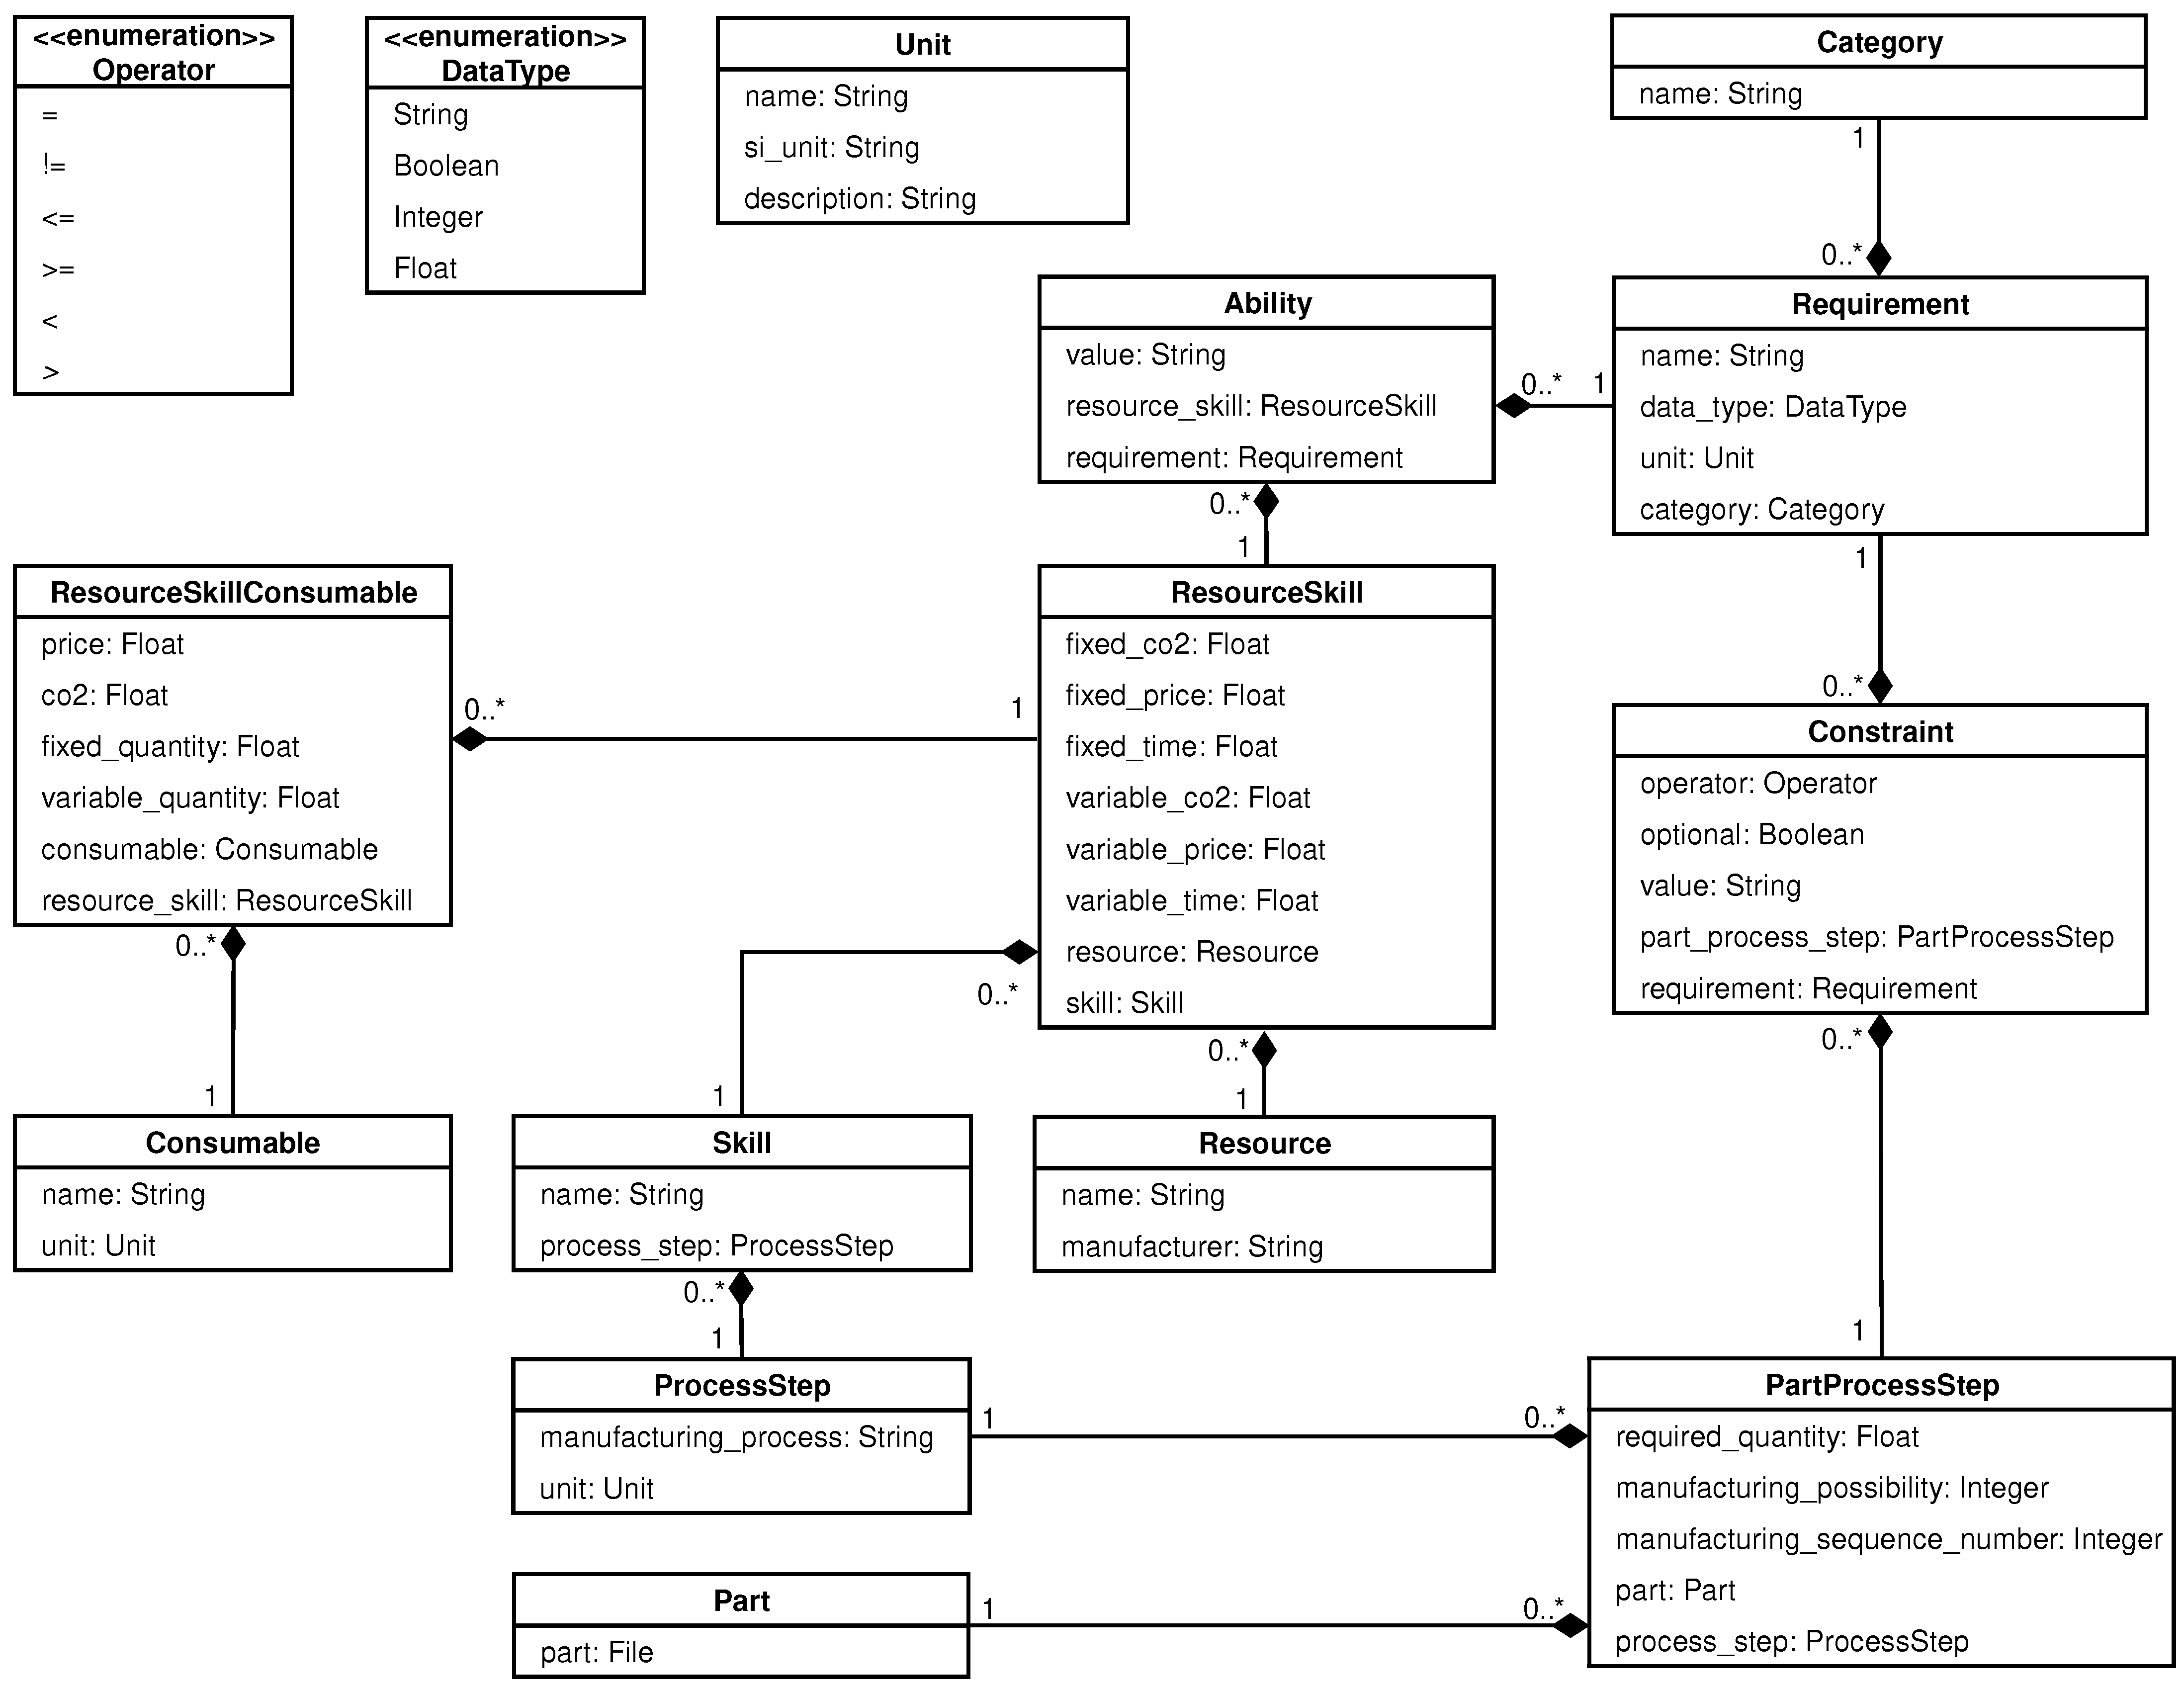
3.1. Ontology for the Manufacturing Framework
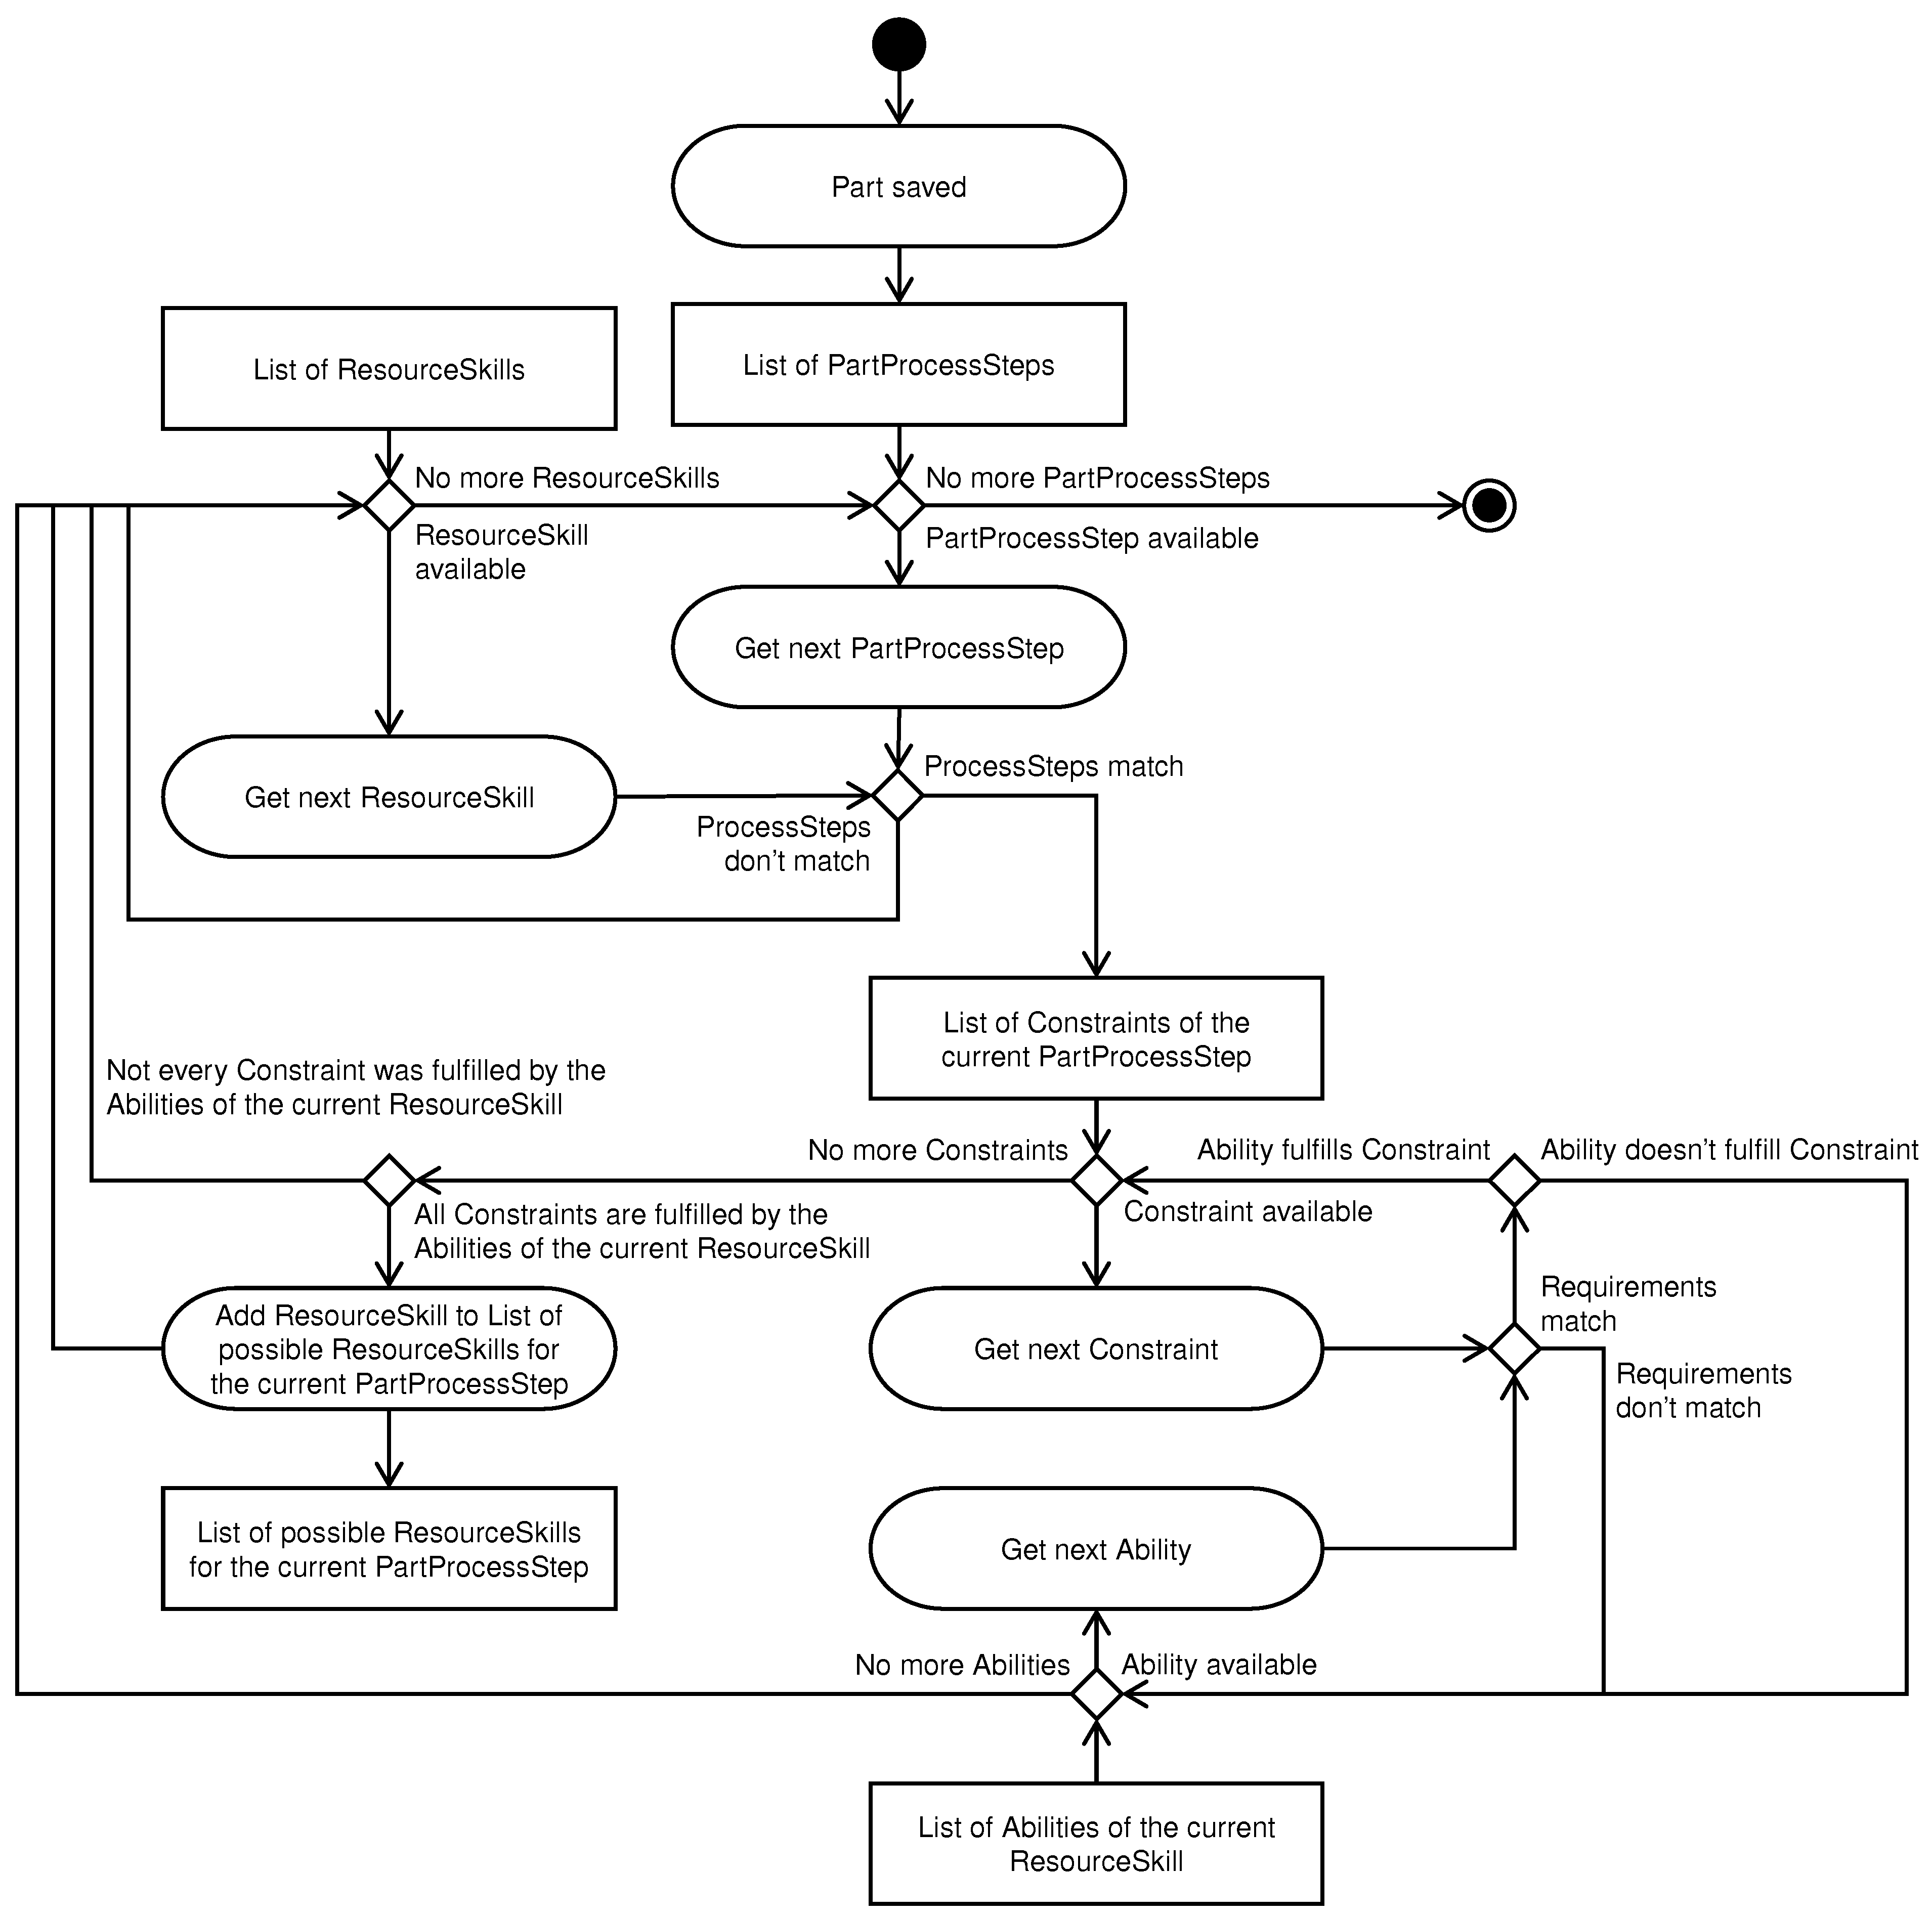
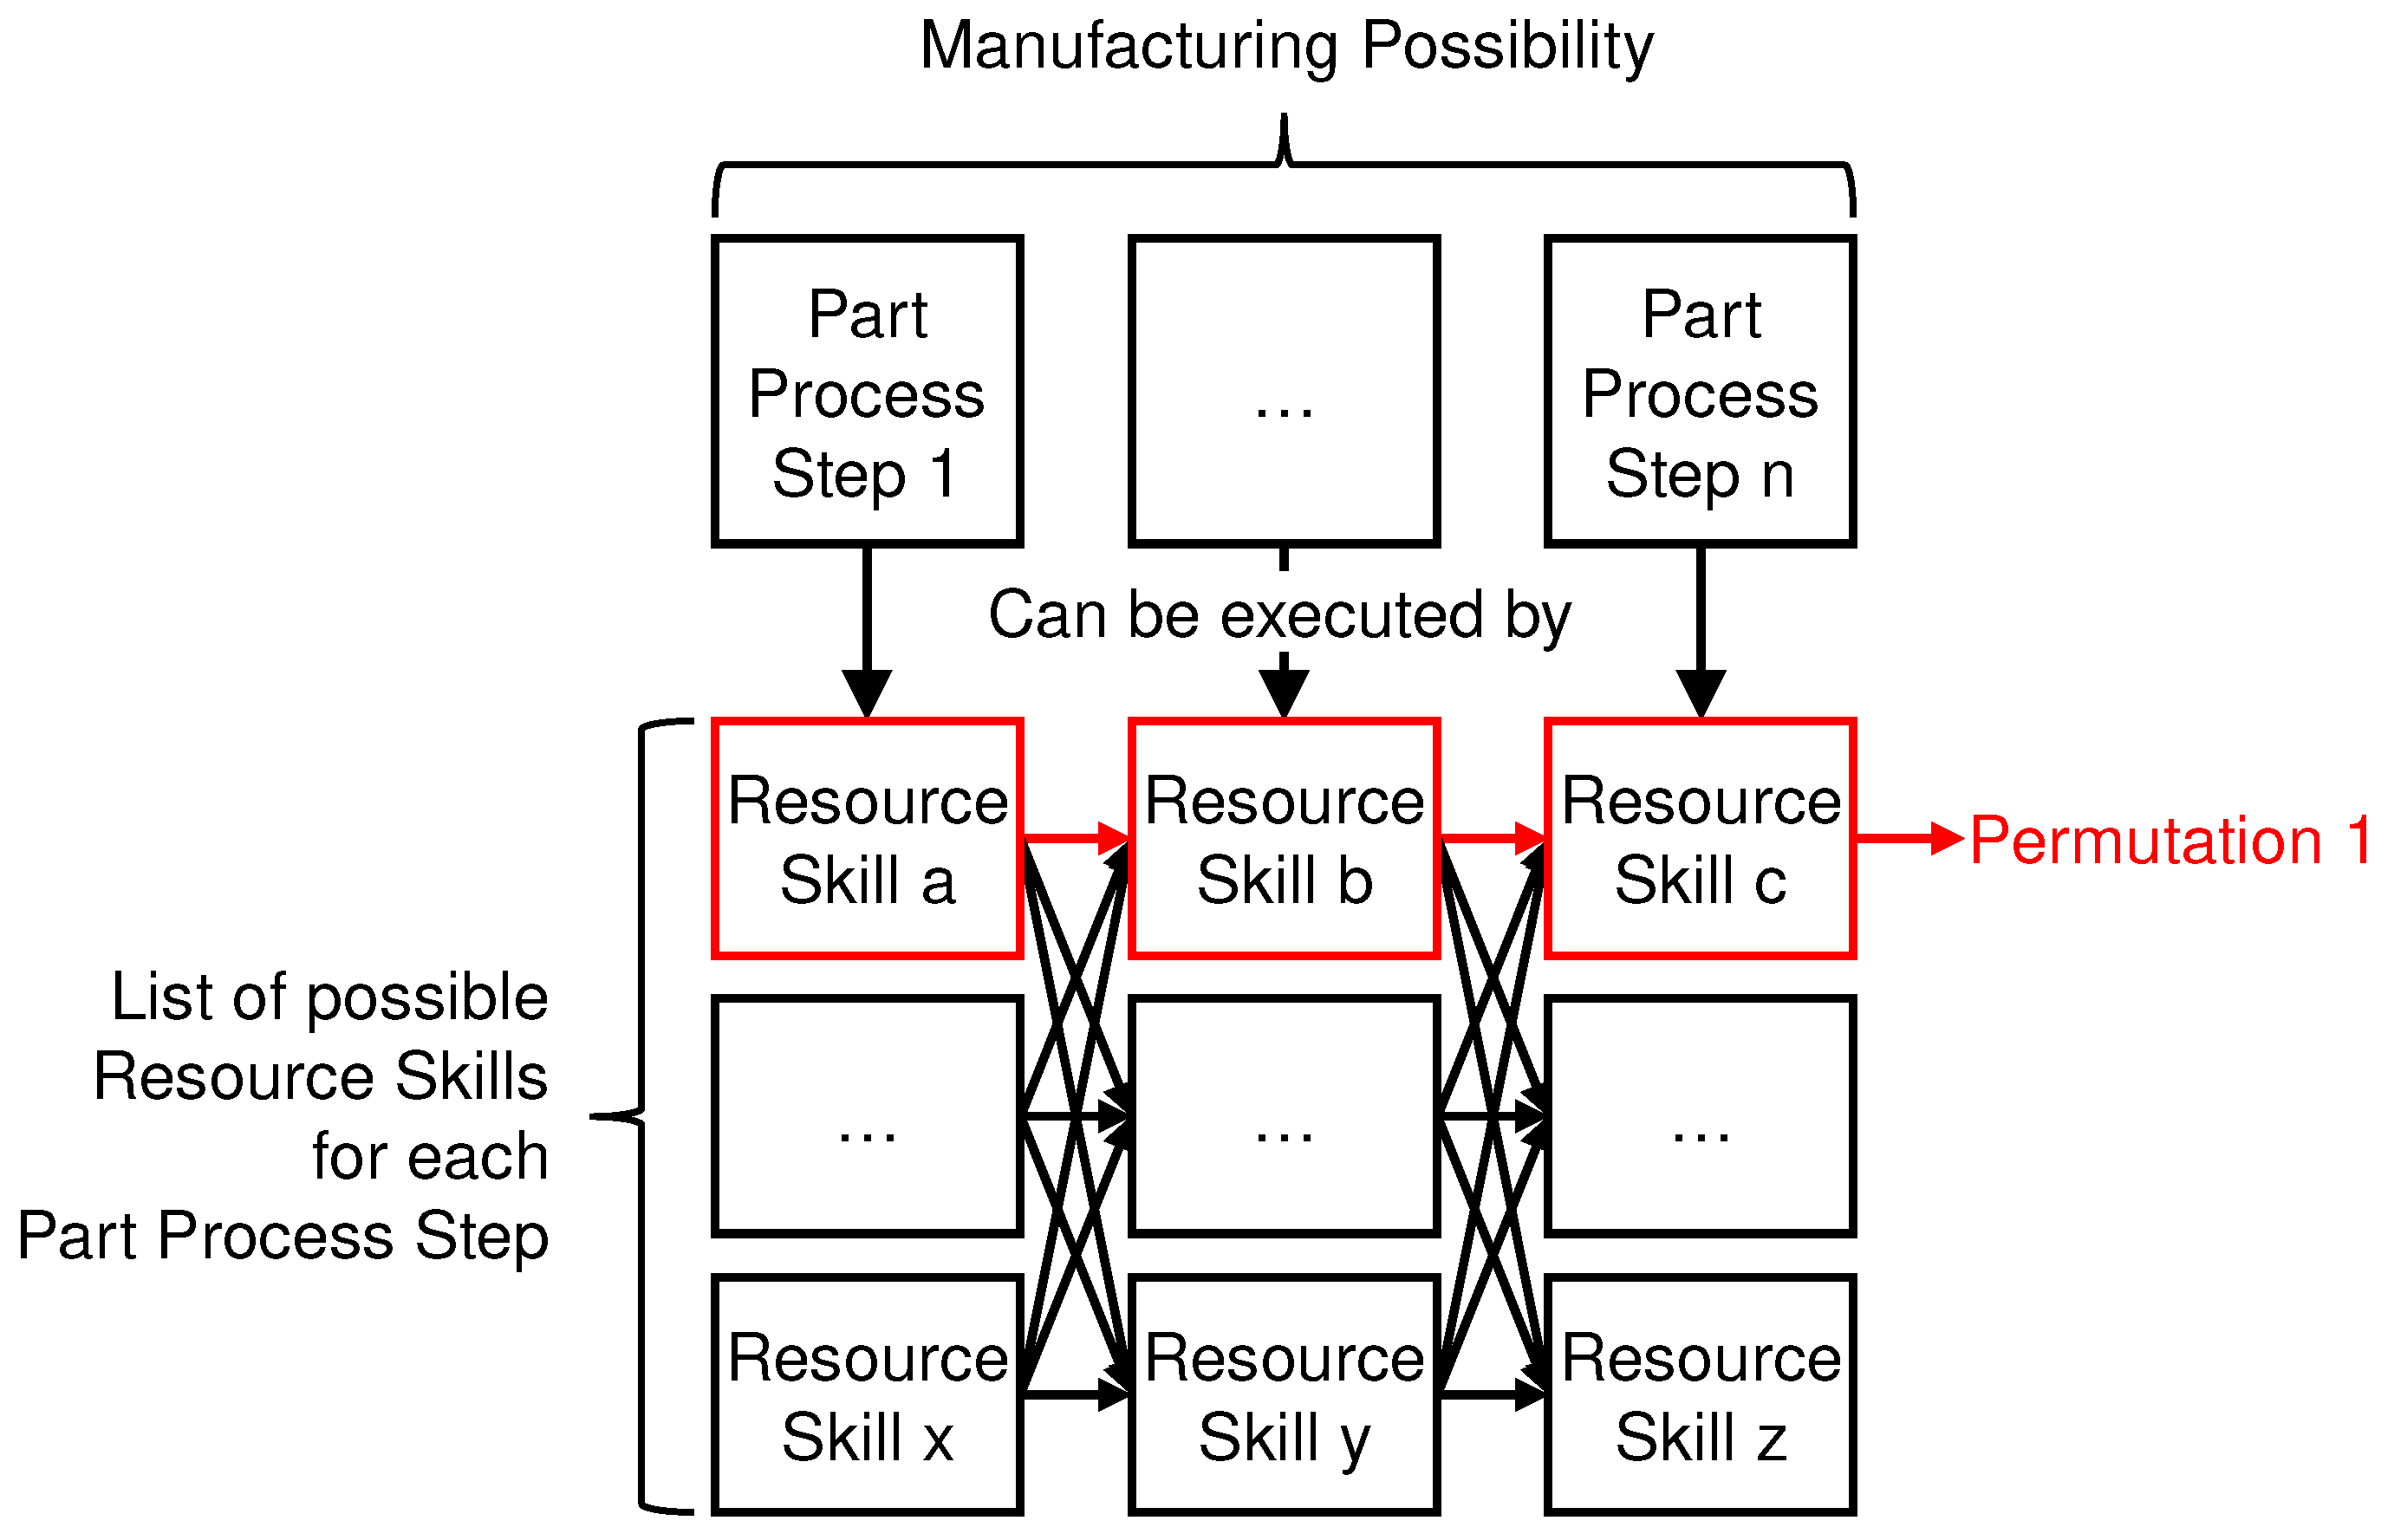
3.2. Solution-Finding Process
3.3. Multiple-Criteria Decision Analysis
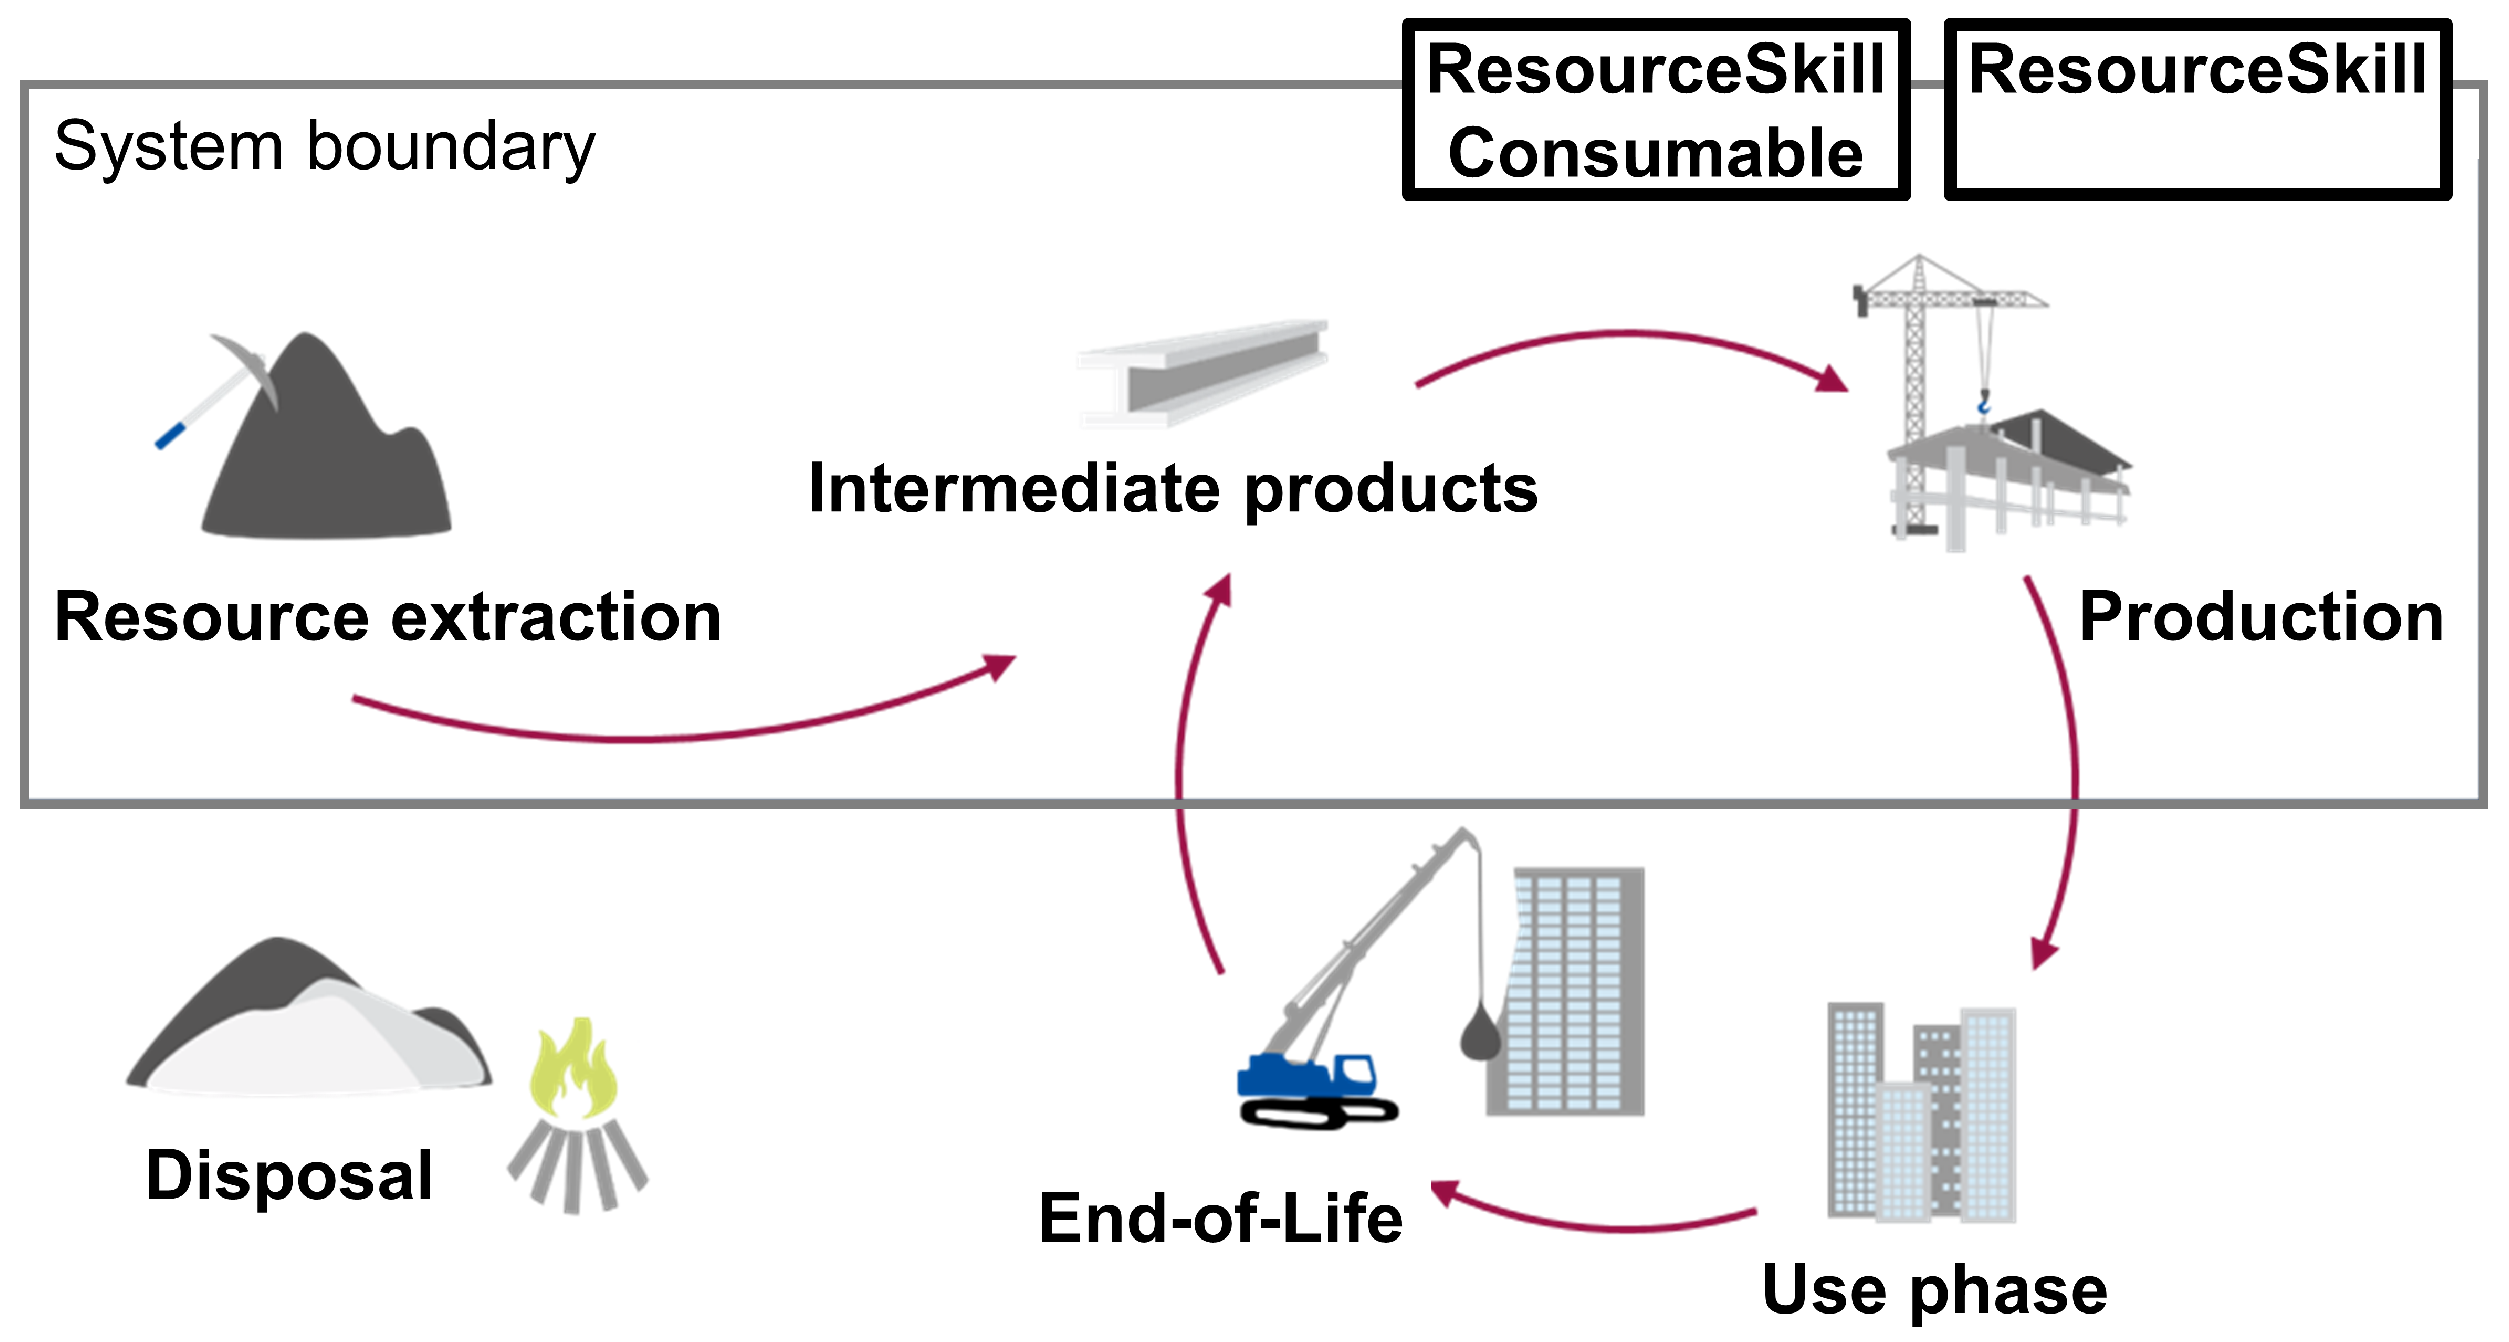
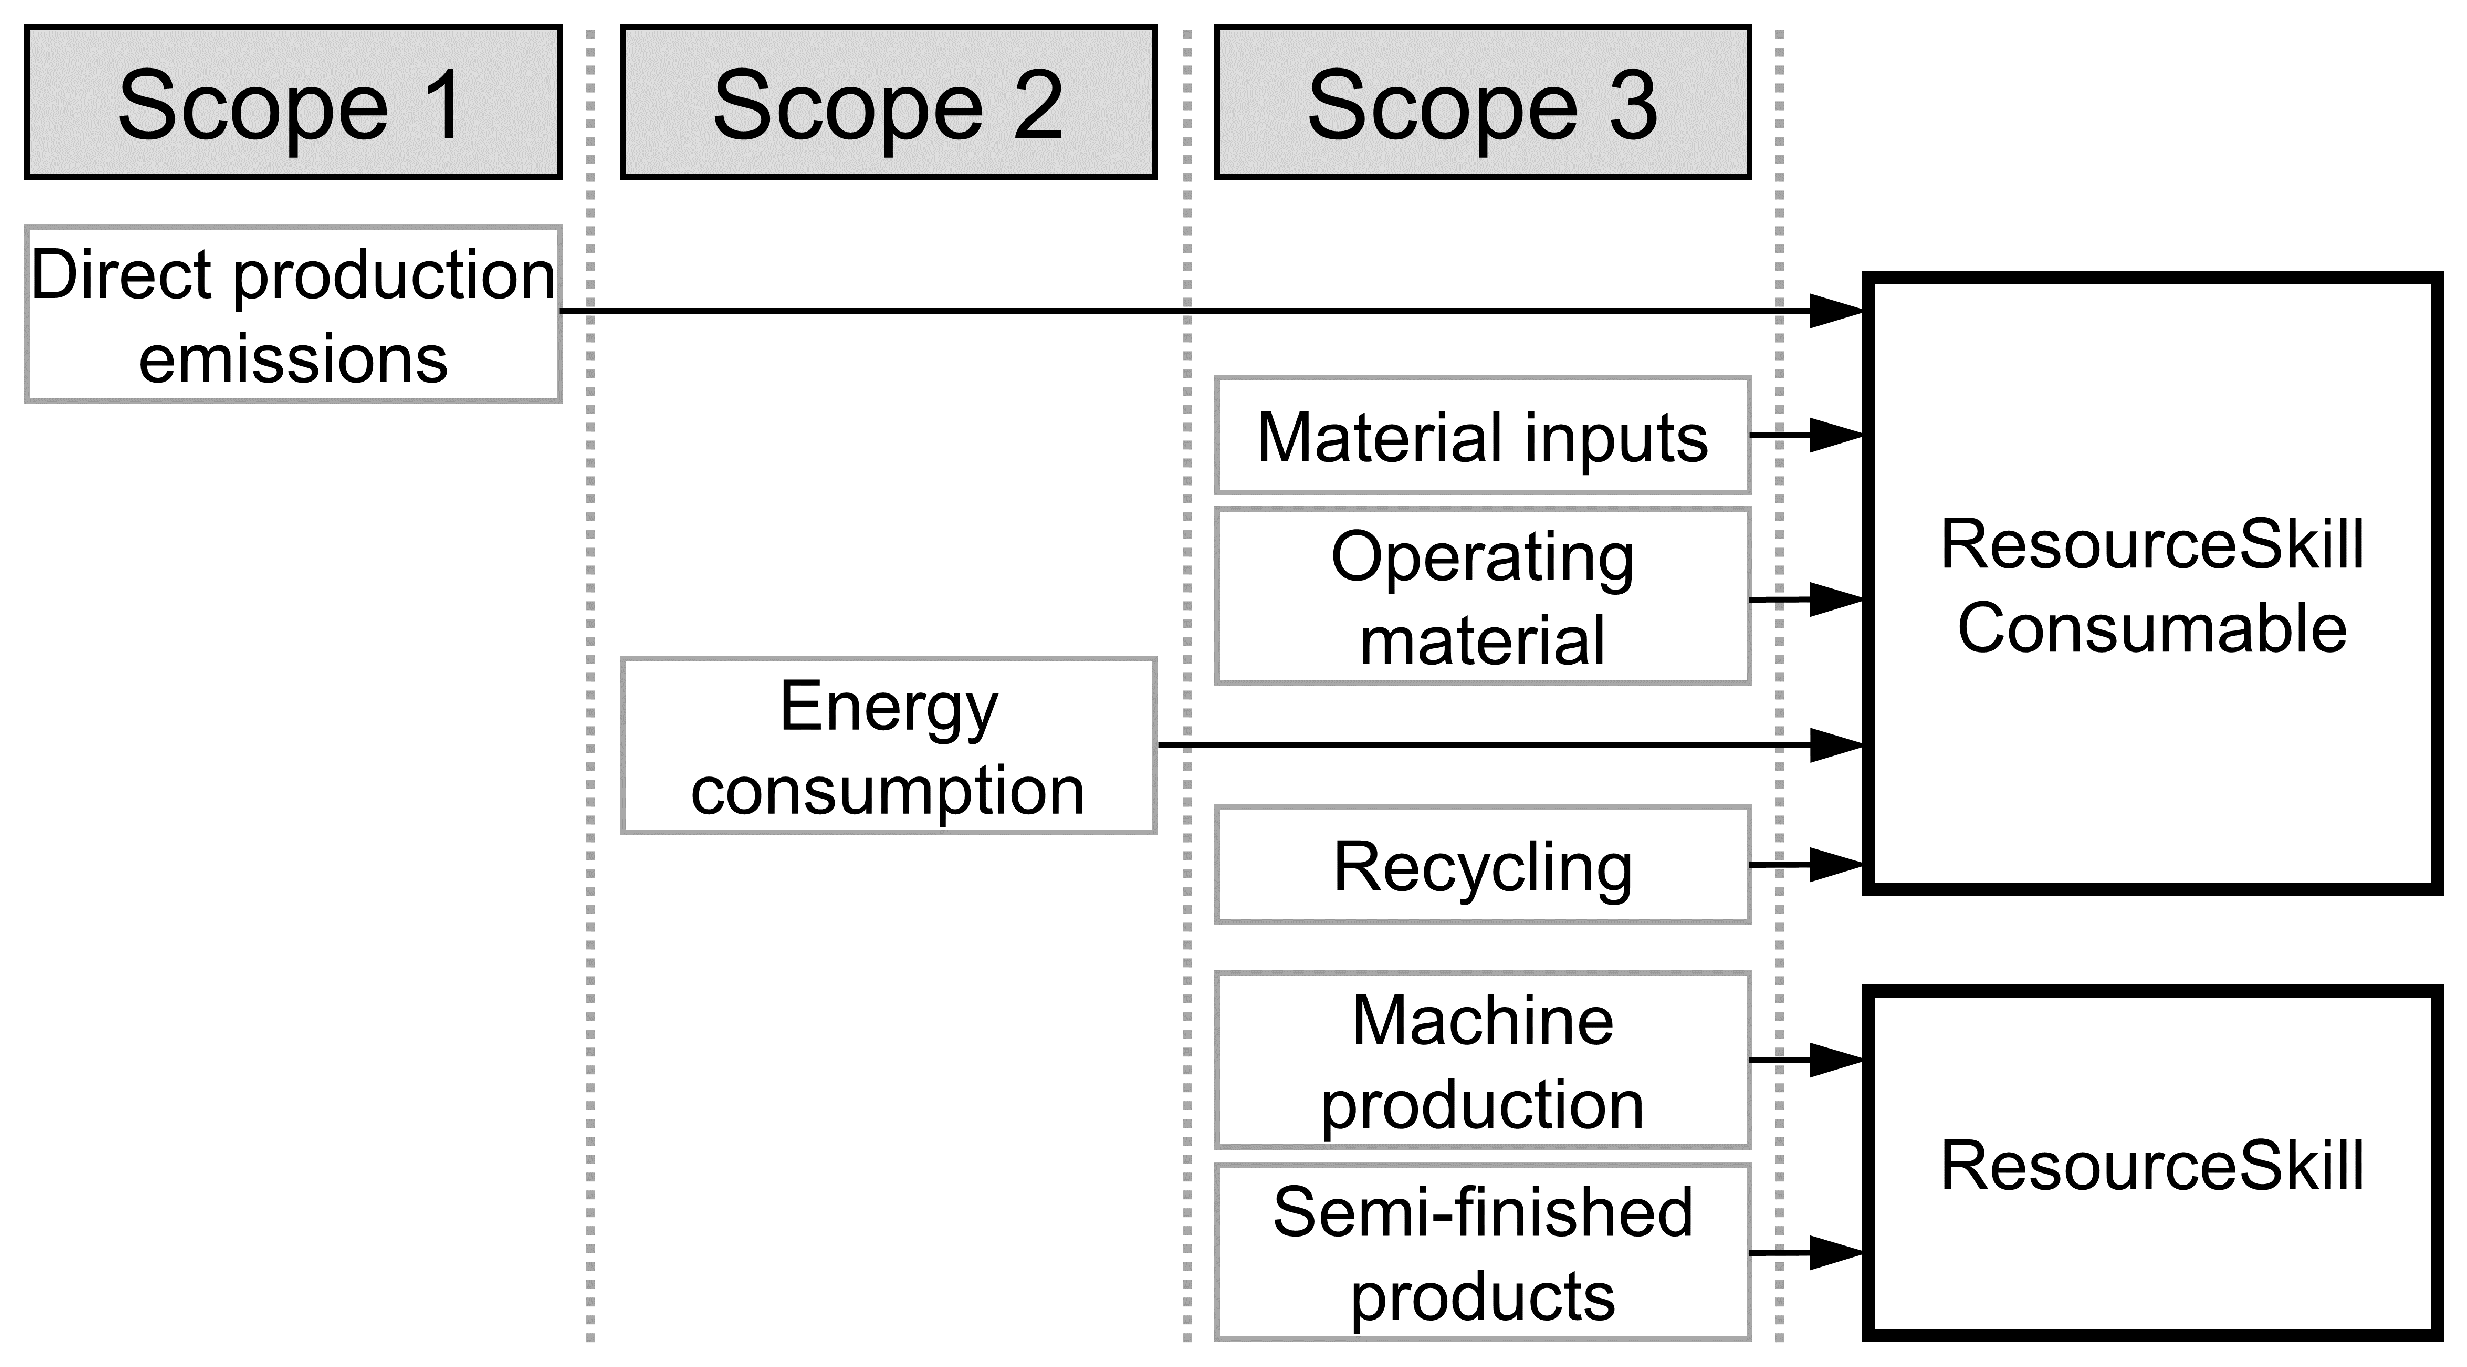
3.4. Identification and Calculation of Environmental Impacts
- Raw material extraction
- Material preparation
- Production
- Post-processing incl. production waste
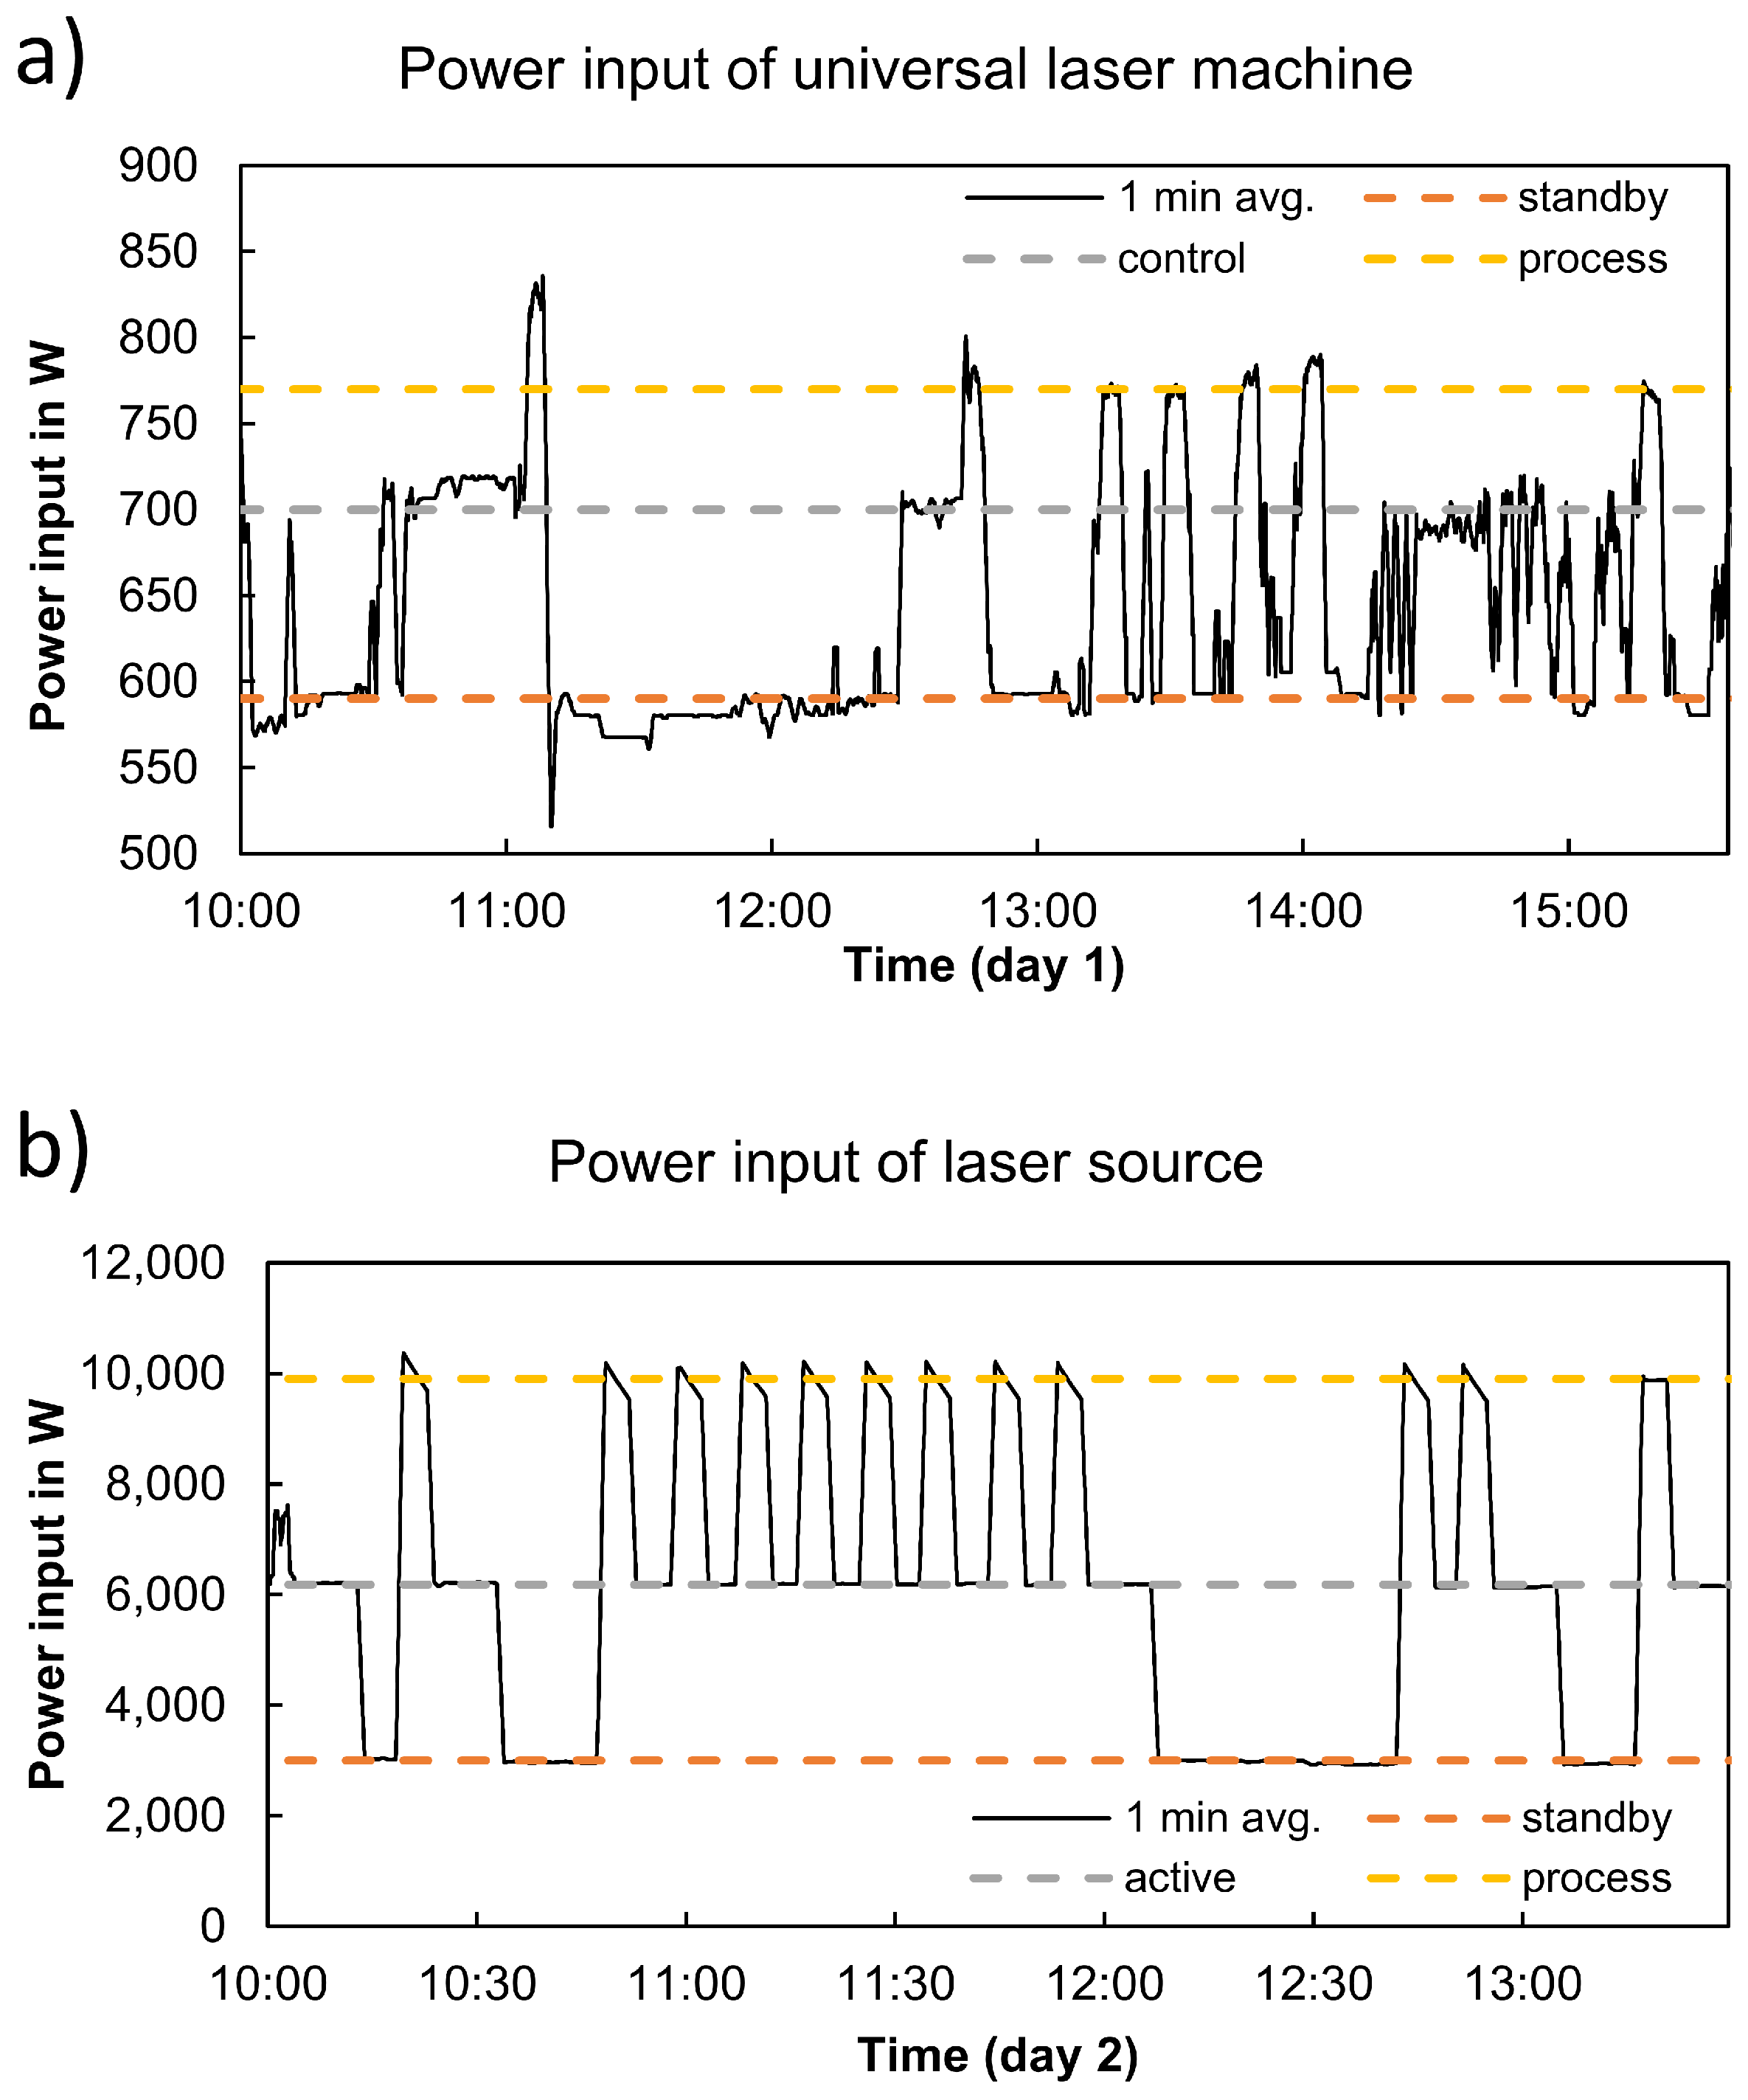
- Process parameters including and focusing on energy consumption,
- Location of manufacturing resources and electricity type,
- Input material type, properties, and quantities, and
- Aspired process quality.
4. Results
4.1. Mapping of Resources
4.1.1. LMWD Consumables
4.1.2. LMWD Abilities
4.2. Determination of the LCA Background Model
- The German electricity grid mix with a carbon footprint of 575 g -eq. was assumed for the generic LMWD process.
- A specific electricity mix based on energy from photovoltaics with a carbon footprint of 69.6 g -eq. was used for the process ’LMWD (eco)’.
- For operational materials, which are used but not consumed in the manufacturing process, the recycling or disposal efforts are considered in combination with the production impacts. Due to the resource and skill specific consumable level, different particularities can be taken into consideration.
- Recyclable material (e.g., mill chippings) is modeled as a skill consumable with negative impacts. Thus, a skill consumable with a negative value can, generally, be considered to be an output, following the process perspective. This is in line with an avoided-burden approach in LCA (see Section 3.4).
- Lifetime: 3 years
- Working days per year: 220 days
- Shift system/working machine hours per day: 8 h
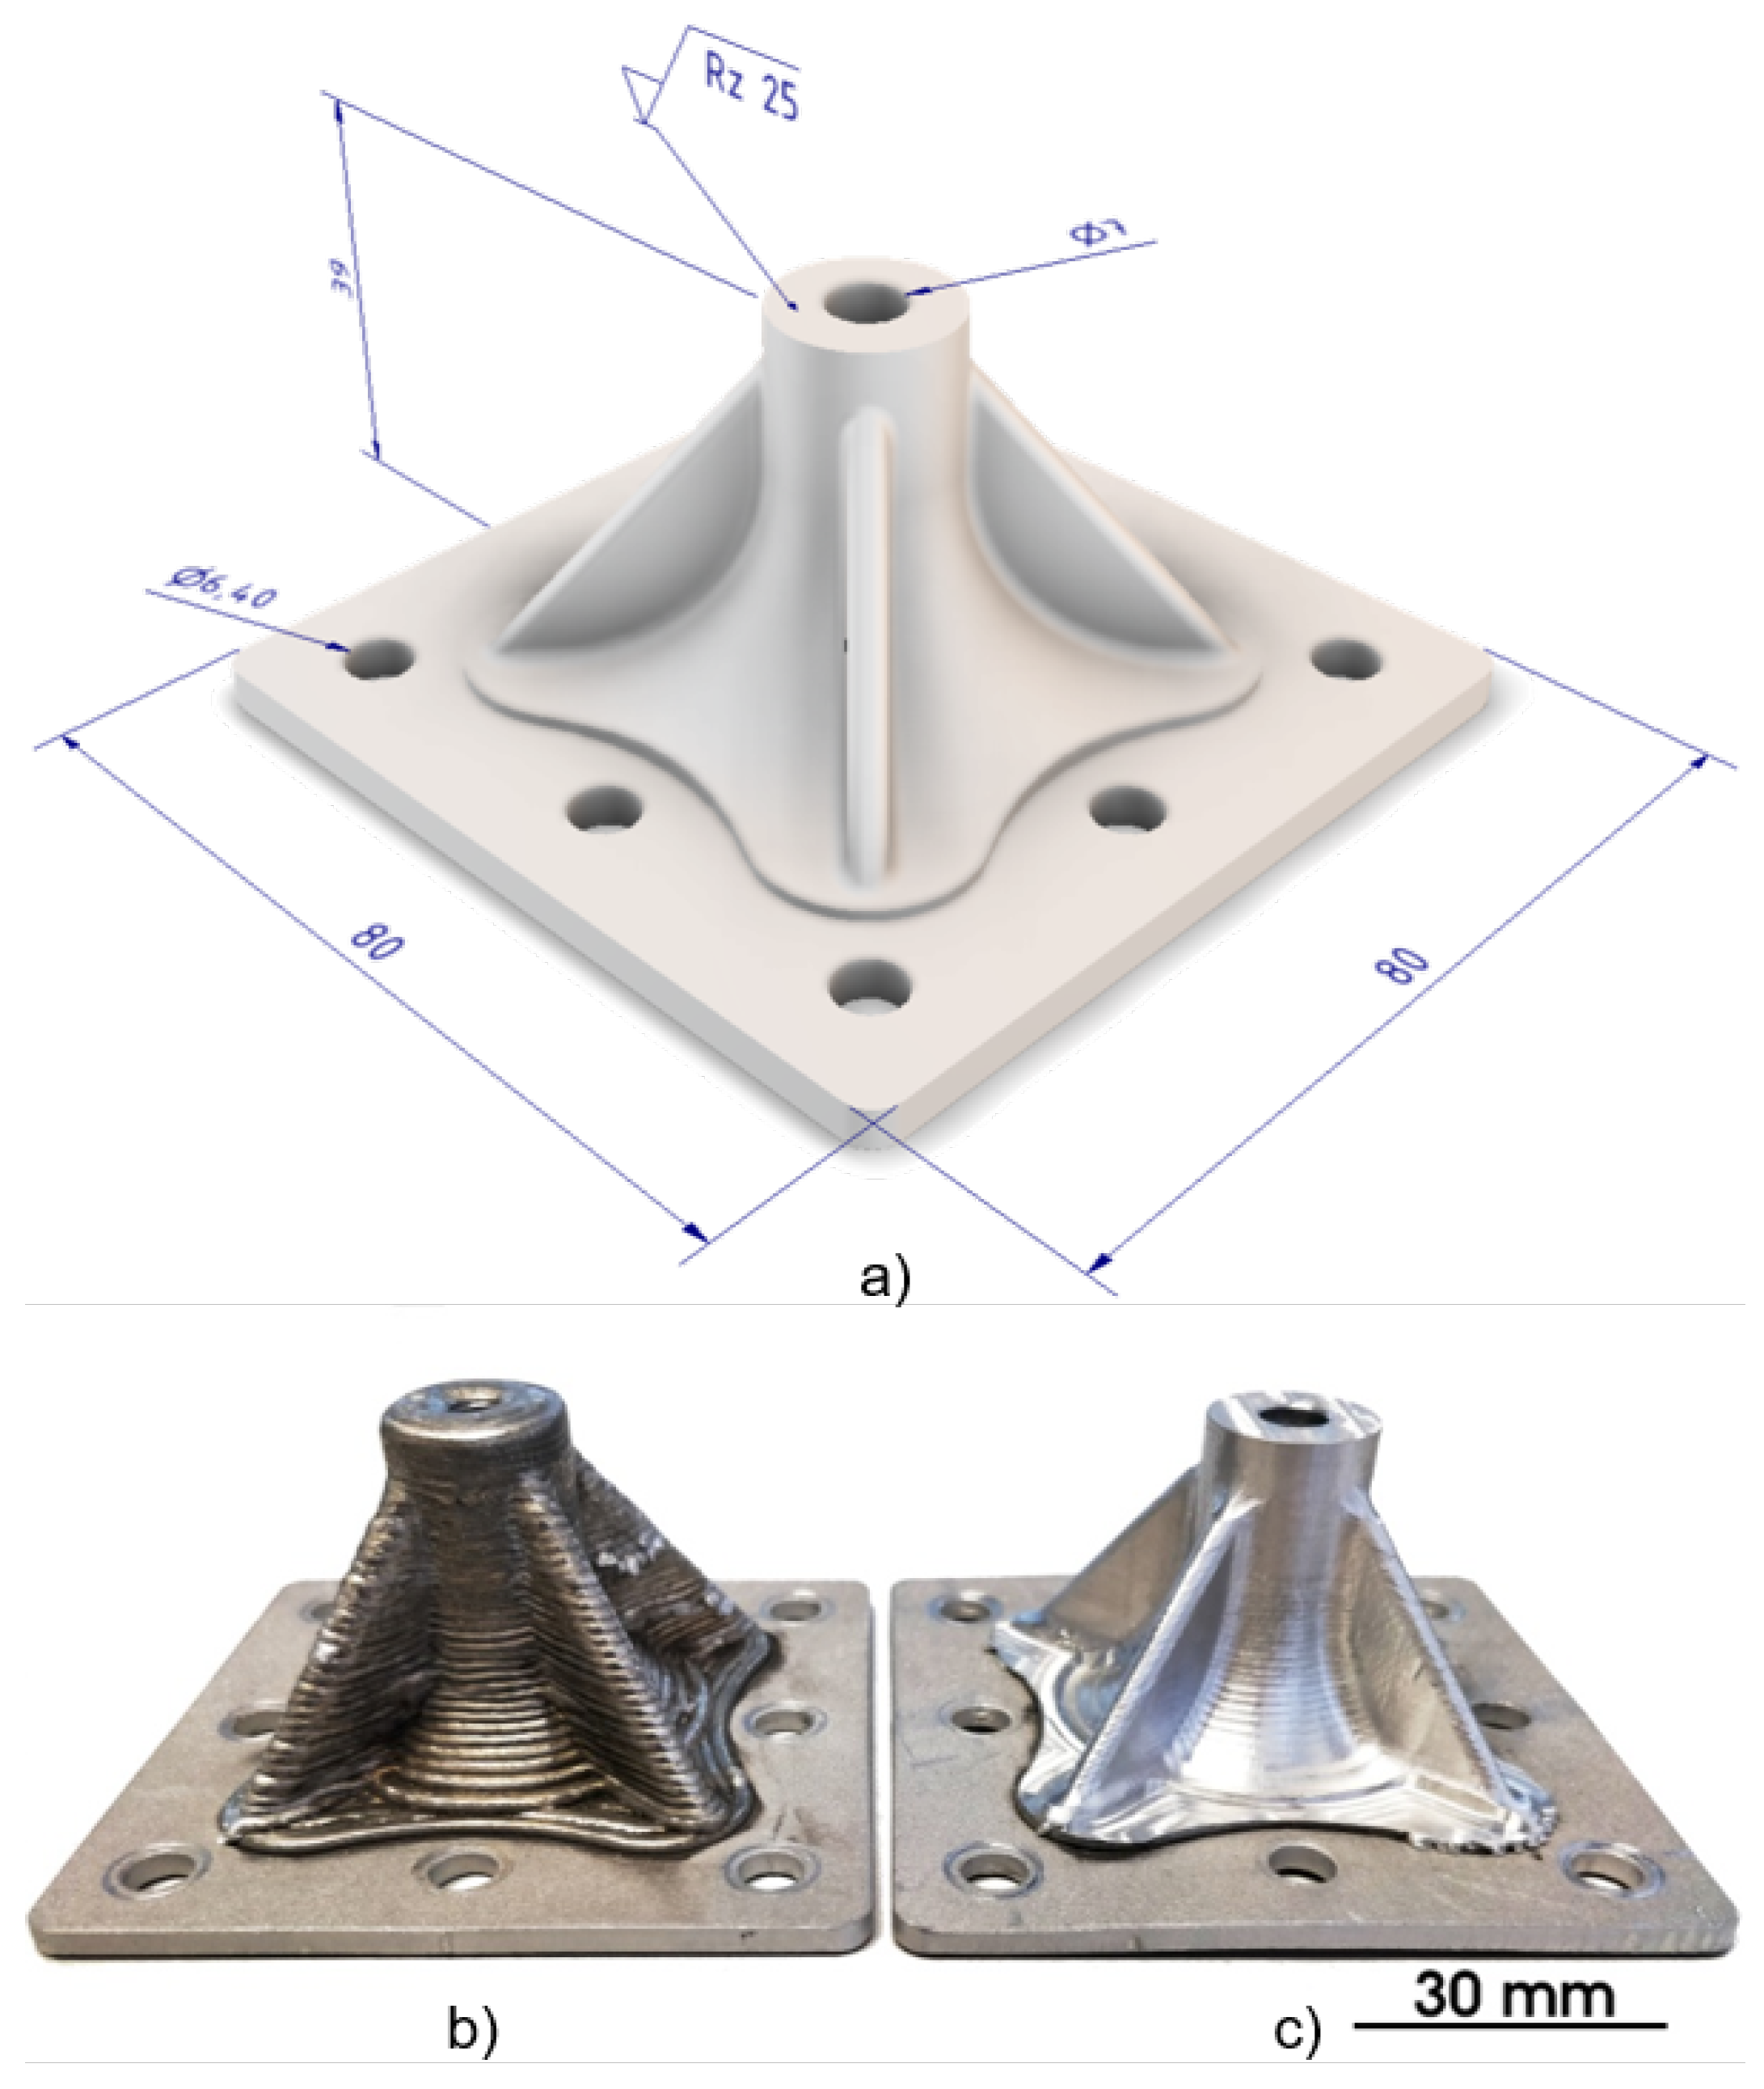
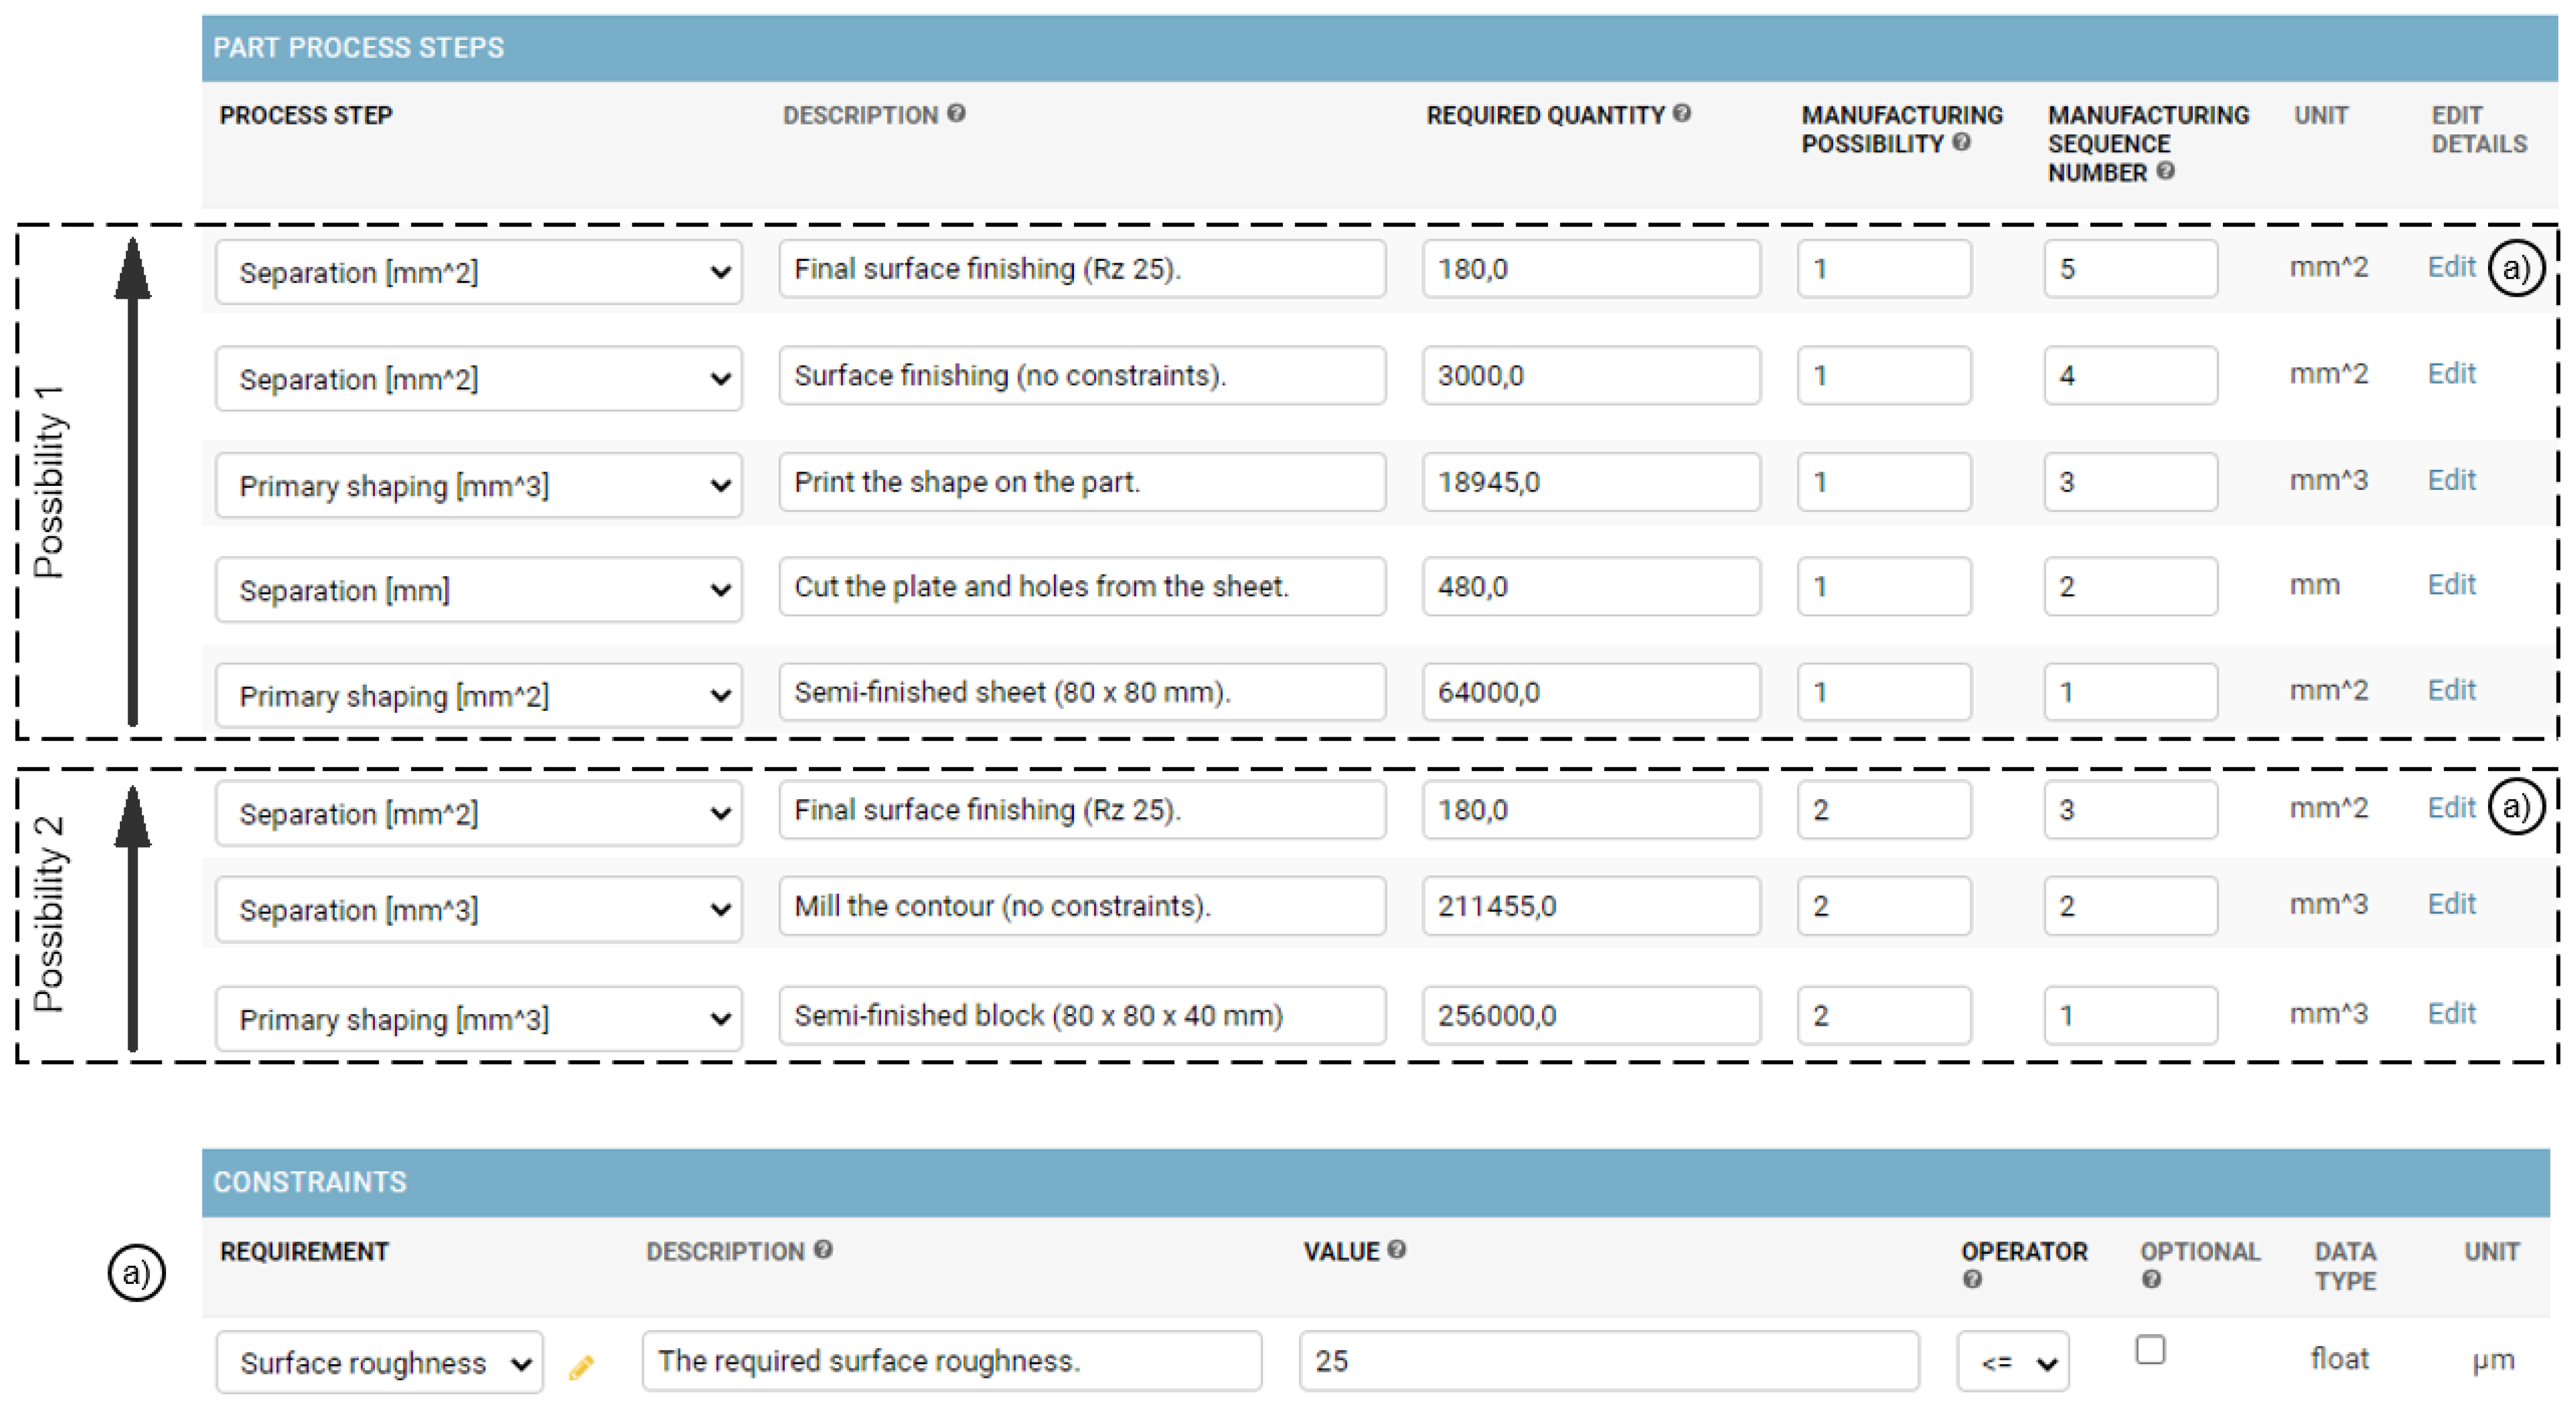
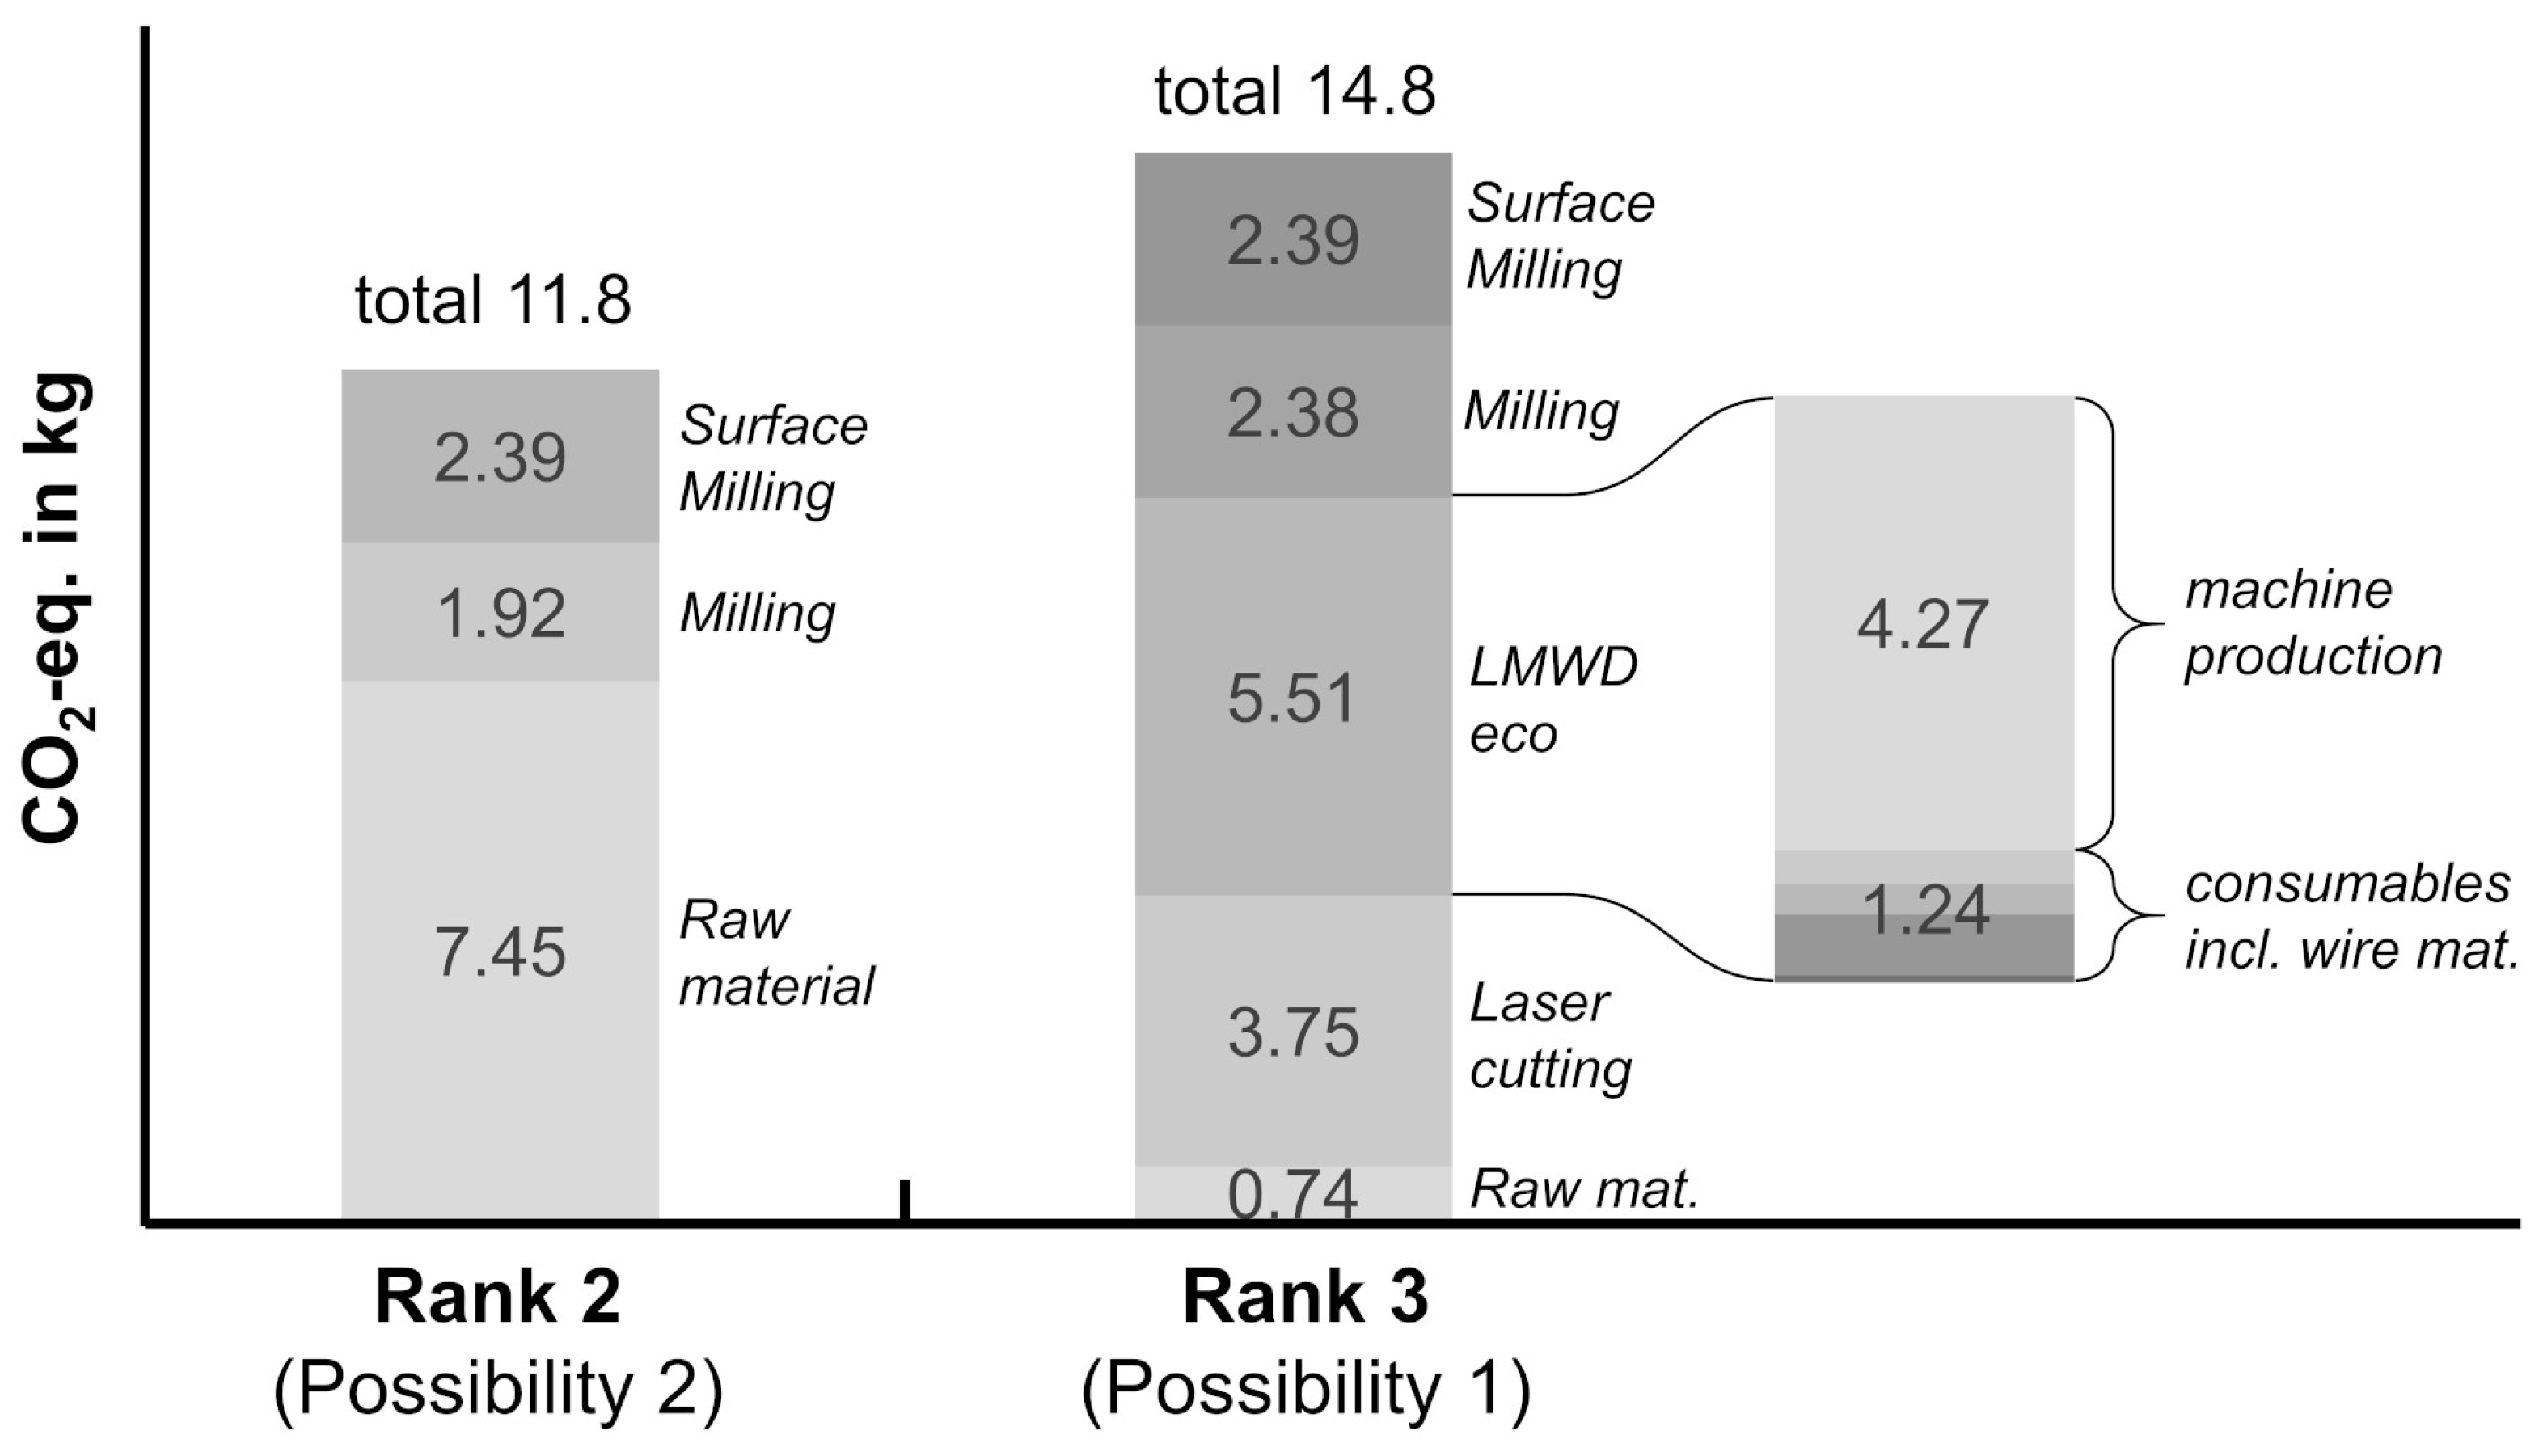
4.3. Use Case
5. Discussion
6. Conclusions
- The data placement, in particular at the start of the framework implementation, relies on the expertise of manufacturing and LCA experts.
- Consumables are not directly geometry dependent (e.g., aluminum wire ’overhead’).
- Waste flows cannot be integrated as outputs for conventional manufacturing (i.e., intermediates as resources).
- Link of process parameters to environmental impacts cannot be shown directly, but must be embedded in the data filled in by experts for every resource skill.
- The scheduling of machining operations is not considered in this work. However, as mentioned in the literature review, this could offer potentials to further improve the overall energy efficiency and thus the environmental impacts.
- The environmental impact is mainly influenced by the background data and cannot be directly influenced and confirmed by the owner of the framework. Thus, the results hold a significant uncertainty.
- The environmental assessment is currently limited to the consideration of the Global Warming Potential (-eq.). This could easily be extended to other impact categories. Yet, due to the goal to cover a wide range of manufacturing possibilities, the used background data would be too unspecific.
Author Contributions
Funding
Institutional Review Board Statement
Informed Consent Statement
Data Availability Statement
Conflicts of Interest
Abbreviations
| -eq. | Carbon dioxide equivalent |
| HSC | High-speed cutting |
| LCA | Life-cycle assessment |
| LMWD | Laser metal-wire deposition |
Appendix A
Appendix A.1. Additional Resources, Resource Skills and Consumables

| Resource | Resource Skill | Unit | Fixed Price in [EUR] | Fixed Time in [s] | Fixed -eq. [kg] | Variable Price | Variable Time | Variable -eq. |
|---|---|---|---|---|---|---|---|---|
| Milling machine | Milling | mm | 0 | 1800 | 2.390 | 1.78 × 10⁻³ EUR/mm | 4.16 × 10⁻⁴ s/mm | 6 × 10⁻⁷ kg/mm |
| Milling machine | Surface milling mode | mm | 0 | 1800 | 2.391 | 1.96 × 10⁻³ EUR/mm | 6 × 10⁻³ s/mm | 7 × 10⁻⁷ kg/mm |
| Laser cutting cell | Quality cut | mm | 7.11 | 300 | 1.275 | 3.55 × 10⁻⁴ EUR/mm | 1.5 × 10⁻² s/mm | 3.03 × 10⁻⁵ kg/mm |
| Raw material | Semi-finished sheet (4 mm) | mm | 0 | 0 | 0 | 1.02 × 10⁻⁴ EUR/mm | 0 s/mm | 1.164 × 10⁻⁴ kg/mm |
| Raw material | Semi-finished block | mm | 0 | 0 | 0 | 2.54 × 10⁻⁵ EUR/mm | 0 s/mm | 2.91 × 10⁻⁵ kg/mm |
| Universal laser machine | LMWD | mm | 71.01 | 1800 | 9.13 × 10⁻⁴ | 9.13 × 10⁻⁴ EUR/mm | 2.31 × 10⁻² s/mm | 4.67 × 10⁻⁵ kg/mm |
| Universal laser machine | LMWD eco | mm | 71.01 | 1800 | 9.13 × 10⁻⁴ | 9.13 × 10⁻⁴ EUR/mm | 2.31 × 10⁻² s/mm | 4.67 × 10⁻⁵ kg/mm |
| Resource Skill | Consumable | Unit | Fixed Quantity | Variable Quantity | Price | -eq. |
|---|---|---|---|---|---|---|
| Milling | Energy consumption | kWh | 0 kWh | 1.76 × 10⁻⁹ kWh/mm | 0.2245 EUR/kWh | 0.575 kg/kWh |
| Surface milling mode | Energy consumption | kWh | 0 kWh | 1.58 × 10⁻⁹ kWh/mm | 0.2245 EUR/kWh | 0.575 kg/kWh |
| Quality cut | Energy consumption | kWh | 4.17 kWh | 2.08 × 10⁻⁴ kWh/mm | 0.2245 EUR/kWh | 0.575 kg/kWh |
| Quality cut | Nitrogen | m³ | 0 m³ | 5 × 10⁻⁶ m³/mm | 12.3 EUR/m³ | 0.108 kg/m³ |
| Milling | Cutting fluid (water) | L | 0 L | 1.322 × 10⁻⁶ L/mm | 0.002 EUR/L | 9.275 × 10⁻⁵ kg/L |
| Milling | Cutting fluid (oil) | L | 0 L | 2.16 × 10⁻⁷ L/mm | 4 EUR/L | 1.807 kg/L |
| Milling | Recyclable AlMgSi0.5 | mm | 0 mm | 1 mm/mm | −3.46 × 10⁻¹¹ EUR/mm | −3.2 × 10⁻⁶ kg/mm |
Appendix A.2. Background Data for the Assessment of the Environmental Impacts
| Resource | Skill | Skill Consumable | LCA Process | Geo Scope | Source | Comment |
|---|---|---|---|---|---|---|
| Universal laser maschine | LMWD + LMWD (eco) | Nitrogen | Nitrogen (gaseous) | DE | Sphera, GaBi DB SP40 | |
| Universal laser maschine | LMWD + LMWD (eco) | Protective glass | Borosilicate glass production | EU | Sphera, GaBi DB SP40 | |
| Universal laser maschine | LMWD + LMWD (eco) | Wire material | Aluminum sheet (AlMg4.5) | EU | Sphera, GaBi DB SP40 | AlMg4.5 as a proxy for AlMg5 |
| Universal laser maschine | LMWD + LMWD (eco) | Wire nozzle | Copper nozzle | DE | Sphera, GaBi DB SP40 | The used dataset is a modeled manufactured copper part. |
| Universal laser maschine | LMWD + LMWD (eco) | Compressed air | Compressed air | EU | Sphera, GaBi DB SP40 | |
| Universal laser maschine | LMWD | Energy consumption (building plate chiller) | Electricity grid mix | DE | Sphera, GaBi DB SP40 | |
| Universal laser maschine | LMWD (eco) | Energy consumption (building plate chiller) | Electricity from photovoltaic | DE | Sphera, GaBi DB SP40 | |
| Universal laser maschine | LMWD | Energy consumption (total energy demand for laser) | Electricity grid mix | DE | Sphera, GaBi DB SP40 | |
| Universal laser maschine | LMWD (eco) | Energy consumption (total energy demand for laser) | Electricity from photovoltaic | DE | Sphera, GaBi DB SP40 | |
| Laser cutting cell | Quality cut | Nitrogen | Nitrogen (gaseous) | DE | Sphera, GaBi DB SP40 | |
| Laser cutting cell | Quality cut | Electical energy | Electricity grid mix | DE | Sphera, GaBi DB SP40 | |
| Milling machine ISW | Milling level 1 | Cutting fluid (water) | Tap water from groundwater | DE | Sphera, GaBi DB SP40 | |
| Milling machine ISW | Milling level 1 | Cutting fluid (oil) | Lubricants at refinery + Used oil | DE | Sphera, GaBi DB SP40 | The modeled oil includes the end-of life treatment. |
| Milling machine ISW | Milling level 1 | Recycable AlMgSi0,5 | Recycling potential aluminum sheet | DE | Sphera, GaBi DB SP40 | |
| Milling machine ISW | Milling level 1 | Energy Consumption | Electricity grid mix | DE | Sphera, GaBi DB SP40 | |
| Milling machine ISW | Surface milling mode | Energy Consumption | Electricity grid mix | DE | Sphera, GaBi DB SP40 |
| Resource | Skill | Skill Consumable | LCA Process | Geo Scope | Source | Comment |
|---|---|---|---|---|---|---|
| Semi-finished raw material | Semi-finished block | AlMgSi0,5 | Aluminum ingot (AlMgSi0.5) | DE | Sphera, GaBi DB SP40 | |
| Semi-finished raw material | Semi-finished sheet | AlMgSi0,5 | Aluminum extrusion profile (AlMgSi0.5) | DE | Sphera, GaBi DB SP40 | Extrusion profile as a proxy for a sheet. |
| Resource | Skill | Machine Weight | Weight Source | LCA Process | Source | Comment |
|---|---|---|---|---|---|---|
| Universal laser machine | LMWD | 6200 kg + 1400 kg Laser unit | IFSW | Metal working machine, unspecified | Ecoinvent DB 3.7 | Allocation based on machine weight |
| Laser cutting cell | Quality cut | 16,000 kg | Estimation based on machinio.de | Metal working machine, unspecified | Ecoinvent DB 3.7 | Allocation based on machine weight |
| Milling machine | Milling level 1 | 5000 kg | Estimation based on machinio.de | Metal working machine, unspecified | Ecoinvent DB 3.7 | Allocation based on machine weight |
References
- Koren, Y.; Shpitalni, M. Design of reconfigurable manufacturing systems. J. Manuf. Syst. 2010, 29, 130–141. [Google Scholar] [CrossRef]
- Schuh, G.; Behr, M.; Brecher, C.; Bührig-Polaczek, A.; Michaeli, W.; Schmitt, R.; Arnoscht, J.; Bohl, A.; Buchbinder, D.; Bültmann, J.; et al. Individualised Production. In Integrative Production Technology for High-Wage Countries; Brecher, C., Ed.; Springer: Berlin/Heidelberg, Germany, 2012; pp. 77–239. [Google Scholar] [CrossRef]
- Hillary, R. Small and Medium-Sized Enterprises and the Environment: Business Imperatives; Routledge: London, UK, 2017. [Google Scholar]
- Ocampo, L.A.; Clark, E.E. Developing a framework for sustainable manufacturing strategies selection. DLSU Bus. Econ. Rev. 2014, 23, 115–131. [Google Scholar]
- Saade, M.R.M.; Yahia, A.; Amor, B. How has LCA been applied to 3D printing? A systematic literature review and recommendations for future studies. J. Clean. Prod. 2020, 244, 118803. [Google Scholar] [CrossRef]
- Barni, A.; Pietraroia, D.; Züst, S.; West, S.; Stoll, O. Digital Twin Based Optimization of a Manufacturing Execution System to Handle High Degrees of Customer Specifications. J. Manuf. Mater. Process. 2020, 4, 109. [Google Scholar] [CrossRef]
- WBGU—German Advisory Council on Global Change. Towards Our Common Digital Future: Flagship Report; WBGU: Berlin, Germany, 2019. [Google Scholar]
- Xu, X. From cloud computing to cloud manufacturing. Robot.-Comput.-Integr. Manuf. 2012, 28, 75–86. [Google Scholar] [CrossRef]
- Gao, J.; Yao, Y.; Zhu, V.C.Y.; Sun, L.; Lin, L. Service-oriented manufacturing: A new product pattern and manufacturing paradigm. J. Intell. Manuf. 2011, 22, 435–446. [Google Scholar] [CrossRef]
- Järvenpää, E.; Siltala, N.; Hylli, O.; Lanz, M. The development of an ontology for describing the capabilities of manufacturing resources. J. Intell. Manuf. 2019, 30, 959–978. [Google Scholar] [CrossRef]
- Ameri, F.; Dutta, D. An Upper Ontology for Manufacturing Service Description. In Proceedings of the 26th Computers and Information in Engineering Conference, ASMEDC, Philadelphia, PA, USA, 10–13 September 2006; Volume 3, pp. 651–661. [Google Scholar] [CrossRef]
- Ameri, F.; Patil, L. Digital manufacturing market: A semantic web-based framework for agile supply chain deployment. J. Intell. Manuf. 2012, 23, 1817–1832. [Google Scholar] [CrossRef]
- Mourtzis, D.; Vlachou, E.; Xanthopoulos, N.; Givehchi, M.; Wang, L. Cloud-based adaptive process planning considering availability and capabilities of machine tools. J. Manuf. Syst. 2016, 39, 1–8. [Google Scholar] [CrossRef]
- Newman, S.T.; Nassehi, A.; Imani-Asrai, R.; Dhokia, V. Energy efficient process planning for CNC machining. Cirp J. Manuf. Sci. Technol. 2012, 5, 127–136. [Google Scholar] [CrossRef]
- He, Y.; Liu, F.; Cao, H.; Zhang, H. Process Planning Support System for Green Manufacturing and its application. Front. Mech. Eng. China 2007, 2, 104–109. [Google Scholar] [CrossRef]
- Gould, O.; Simeone, A.; Colwill, J.; Woolley, E.; Willey, R.; Rahimifard, S. Optimized assembly design for resource efficient production in a multiproduct manufacturing system. Procedia CIRP 2017, 62, 523–528. [Google Scholar] [CrossRef][Green Version]
- Shojaeipour, S. Sustainable manufacturing process planning. Int. J. Adv. Manuf. Technol. 2015, 78, 1347–1360. [Google Scholar] [CrossRef]
- Dai, M.; Tang, D.B.; Xu, Y.C.; Li, W.D. Energy-aware Integrated Process Planning and Scheduling for Job Shops. In Sustainable Manufacturing and Remanufacturing Management: Process Planning, Optimization and Applications; Li, W., Wang, S., Eds.; Springer International Publishing: Cham, Switzerland, 2019; pp. 13–36. [Google Scholar] [CrossRef][Green Version]
- Li, X.X.; Li, W.D.; Cai, X.; He, F. A hybrid optimization approach for sustainable process planning and scheduling. Integr.-Comput.-Aided Eng. 2015, 22, 311–326. [Google Scholar] [CrossRef]
- Alting, D.L.; Jøgensen, D.J. The Life Cycle Concept as a Basis for Sustainable Industrial Production. CIRP Ann. 1993, 42, 163–167. [Google Scholar] [CrossRef]
- Veleva, V.; Ellenbecker, M. Indicators of sustainable production: Framework and methodology. J. Clean. Prod. 2001, 9, 519–549. [Google Scholar] [CrossRef]
- Favi, C.; Germani, M.; Mandolini, M.; Marconi, M. PLANTLCA: A Lifecycle Approach to Map and Characterize Resource Consumptions and Environmental Impacts of Manufacturing Plants. Procedia CIRP 2016, 48, 146–151. [Google Scholar] [CrossRef]
- Duflou, J.R.; Sutherland, J.W.; Dornfeld, D.; Herrmann, C.; Jeswiet, J.; Kara, S.; Hauschild, M.; Kellens, K. Towards energy and resource efficient manufacturing: A processes and systems approach. CIRP Ann. 2012, 61, 587–609. [Google Scholar] [CrossRef]
- Rödger, J.M.; Beier, J.; Schönemann, M.; Schulze, C.; Thiede, S.; Bey, N.; Herrmann, C.; Hauschild, M.Z. Combining Life Cycle Assessment and Manufacturing System Simulation: Evaluating Dynamic Impacts from Renewable Energy Supply on Product-Specific Environmental Footprints. Int. J. Precis. Eng. Manuf.-Green Technol. 2020, 8, 1007–1026. [Google Scholar] [CrossRef]
- Faludi, J.; Baumers, M.; Maskery, I.; Hague, R. Environmental Impacts of Selective Laser Melting: Do Printer, Powder, or Power Dominate? J. Ind. Ecol. 2017, 21, S144–S156. [Google Scholar] [CrossRef]
- Torres-Carrillo, S.; Siller, H.R.; Vila, C.; López, C.; Rodríguez, C.A. Environmental analysis of selective laser melting in the manufacturing of aeronautical turbine blades. J. Clean. Prod. 2020, 246, 119068. [Google Scholar] [CrossRef]
- Peng, T.; Wang, Y.; Zhu, Y.; Yang, Y.; Yang, Y.; Tang, R. Life cycle assessment of selective-laser-melting-produced hydraulic valve body with integrated design and manufacturing optimization: A cradle-to-gate study. Addit. Manuf. 2020, 36, 101530. [Google Scholar] [CrossRef]
- Catalano, A.R.; Lunetto, V.; Priarone, P.C.; Settineri, L. A Survey on Energy Efficiency in Metal Wire Deposition Processes. Sustainable Design and Manufacturing 2019. In Smart Innovation, Systems and Technologies; Ball, P., Huaccho Huatuco, L., Howlett, R.J., Setchi, R., Eds.; Springer: Singapore, 2019; Volume 155, pp. 311–322. [Google Scholar] [CrossRef]
- Wang, Y.; Peng, T.; Zhu, Y.; Yang, Y.; Tang, R. A comparative life cycle assessment of a selective-laser-melting-produced hydraulic valve body using design for Property. Procedia CIRP 2020, 90, 220–225. [Google Scholar] [CrossRef]
- Abdulrahman, K.O.; Akinlabi, E.T.; Mahamood, R.M. Laser metal deposition technique: Sustainability and environmental impact. Procedia Manuf. 2018, 21, 109–116. [Google Scholar] [CrossRef]
- Morrow, W.R.; Qi, H.; Kim, I.; Mazumder, J.; Skerlos, S.J. Environmental aspects of laser-based and conventional tool and die manufacturing. J. Clean. Prod. 2007, 15, 932–943. [Google Scholar] [CrossRef]
- Ribeiro, I.; Matos, F.; Jacinto, C.; Salman, H.; Cardeal, G.; Carvalho, H.; Godina, R.; Peças, P. Framework for Life Cycle Sustainability Assessment of Additive Manufacturing. Sustainability 2020, 12, 929. [Google Scholar] [CrossRef]
- Cerdas, F.; Juraschek, M.; Thiede, S.; Herrmann, C. Life Cycle Assessment of 3D Printed Products in a Distributed Manufacturing System. J. Ind. Ecol. 2017, 21, S80–S93. [Google Scholar] [CrossRef]
- Wehner, D. Ordnungsrahmen und Ansätze für das Ökologische Risikomanagement bei der Produktentwicklung; Forschungsergebnisse aus der Bauphysik; Fraunhofer Verlag: Stuttgart, Germany, 2020; Volume 40. [Google Scholar]
- Bonvoisin, J.; Stark, R.; Seliger, G. Field of Research in Sustainable Manufacturing. In Sustainable Manufacturing; Stark, R., Seliger, G., Bonvoisin, J., Eds.; Sustainable Production, Life Cycle Engineering and Management; Springer International Publishing: Cham, Switzerland, 2017; pp. 3–20. [Google Scholar] [CrossRef]
- Malakuti, S.; Bock, J.; Weser, M.; Venet, P.; Zimmermann, P.; Wiegand, M.; Grothoff, J.; Wagner, C.; Bayha, A. Challenges in Skill-based Engineering of Industrial Automation Systems *. In Proceedings of the 2018 IEEE 23rd International Conference on Emerging Technologies and Factory Automation (ETFA), Turin, Italy, 4–7 September 2018; pp. 67–74. [Google Scholar] [CrossRef]
- Lin, A.C.; Lin, S.Y. A volume decomposition approach to process planning for prismatic parts with depression and protrusion design features. Int. J. Comput. Integr. Manuf. 1998, 11, 548–563. [Google Scholar] [CrossRef]
- Diakoulaki, D.; Mavrotas, G.; Papayannakis, L. Determining objective weights in multiple criteria problems: The critic method. Comput. Oper. Res. 1995, 22, 763–770. [Google Scholar] [CrossRef]
- German Institute for Standardization. Environmental Management—Life Cycle Assessment—Principles and Framework; ISO 14040:2021-02; Beuth-Verlag: Berlin, Germany, 2021. [Google Scholar] [CrossRef]
- German Institute for Standardization. Environmental Management—Life Cycle Assessment—Requirements and Guidelines; ISO 14044:2021-02; Beuth-Verlag: Berlin, Germany, 2021. [Google Scholar] [CrossRef]
- European Commission—Joint Research Centre—Institute for Environment and Sustainability. International Reference Life Cycle Data System (ILCD) Handbook—General Guide for Life Cycle Assessment—Detailed Guidance; EUR (Luxembourg), Publications Office of the European Union: Luxembourg, 2010; p. 24708. [Google Scholar]
- Smith, B. The Greenhouse Gas Protocol: A Corporate Accounting and Reporting Standard, rev. ed.; World Resources Institute and World Business Council for Sustainable Development: Washington, DC, USA; Conches, Geneva, 2004. [Google Scholar]
- EON. Industriestrom: Vergleich für Unternehmen. Available online: https://www.eon.de/de/gk/strom/industriestrom.html (accessed on 1 June 2021).
- Sphera. Gabi Database: Version: SP40. Available online: https://gabi.sphera.com/international/databases/gabi-databases (accessed on 1 June 2021).
- Ecoinvent. Ecoinvent Database: Version: 3.7.1. Available online: https://www.ecoinvent.org/database/database.html (accessed on 1 June 2021).
- Faludi, J.; Bayley, C.; Bhogal, S.; Iribarne, M. Comparing environmental impacts of additive manufacturing vs traditional machining via life-cycle assessment. Rapid Prototyp. J. 2015, 21, 14–33. [Google Scholar] [CrossRef]
- Diaz, N.; Helu, M.; Jayanathan, S.; Chen, Y.; Horvath, A.; Dornfeld, D. Environmental analysis of milling machine tool use in various manufacturing environments. In Proceedings of the 2010 IEEE International Symposium on Sustainable Systems and Technology (ISSST 2010), Arlington, VA, USA, 17–19 May 2010; IEEE: Piscataway, NJ, USA, 2010; pp. 1–6. [Google Scholar] [CrossRef]
- Saric, T.; Simunovic, G.; Simunovic, K. Estimation of Machining Time for CNC Manufacturing Using Neural Computing. Int. J. Simul. Model. 2016, 15, 663–675. [Google Scholar] [CrossRef]


| Consumable | Unit | Fixed Quantity | Variable Quantity | Price | -eq. |
|---|---|---|---|---|---|
| Nitrogen gas | m³ | - | 13.5 m³/L* | 12.3 EUR/m³ | 0.108 kg/m³ |
| Protective glass | - | - | 0.268 /L* | 355 EUR | 0.113 kg |
| Aluminum wire | mm | 785 mm | 1.00 × 106 mm/L* | 3.30 × 10⁻⁵ EUR/mm | 2.91 × 10⁻⁵ kg/mm |
| Energy consumption | kWh | 3.02 kWh | 72.3 kWh/L* | 0.225 EUR/kWh | 0.575 kg/kWh |
| Wire nozzle | - | - | 0.266 /L* | 33.64 EUR | 0.217 kg |
| Cooling | kWh | 0.145 kWh | 1.86 kWh/L* | 0.225 EUR/kWh | 0.575 kg/kWh |
| Compressed air | m³ | - | 77.2 m³/L* | 2.10 × 10⁻² EUR/m³ | 4.67 × 10⁻² kg/m³ |
| Rank | Score | Possibility | Permutation: Resource Skill (Resource) | Price | Time | -eq. |
|---|---|---|---|---|---|---|
| 1 | 0.969 | - | Semi-finished sheet (Raw material) Quality cut (Laser cutting cell) Semi-finished block (Raw material) Milling (Milling machine) Surface milling mode (Milling machine) | 15.1 EUR | 1:05 h | 9.81 kg |
| 2 | 0.499 | 2 | Semi-finished block (Raw material) Milling (Milling machine) Surface milling mode (Milling machine) | 383 EUR | 1:02 h | 11.8 kg |
| 3 | 0.398 | 1 | Semi-finished sheet (Raw material) Quality cut (Laser cutting cell) LMWD eco (Universal laser machine) Milling (Milling machine) Surface milling mode (Milling machine) | 109 EUR | 1:42 h | 14.8 kg |
| 4 | 0.330 | 1 | Semi-finished sheet (Raw material) Quality cut (Laser cutting cell) LMWD (Universal laser machine) Milling (Milling machine) Surface milling mode (Milling machine) | 109 EUR | 1:42 h | 17.1 kg |
Publisher’s Note: MDPI stays neutral with regard to jurisdictional claims in published maps and institutional affiliations. |
© 2021 by the authors. Licensee MDPI, Basel, Switzerland. This article is an open access article distributed under the terms and conditions of the Creative Commons Attribution (CC BY) license (https://creativecommons.org/licenses/by/4.0/).
Share and Cite
Reiff, C.; Buser, M.; Betten, T.; Onuseit, V.; Hoßfeld, M.; Wehner, D.; Riedel, O. A Process-Planning Framework for Sustainable Manufacturing. Energies 2021, 14, 5811. https://doi.org/10.3390/en14185811
Reiff C, Buser M, Betten T, Onuseit V, Hoßfeld M, Wehner D, Riedel O. A Process-Planning Framework for Sustainable Manufacturing. Energies. 2021; 14(18):5811. https://doi.org/10.3390/en14185811
Chicago/Turabian StyleReiff, Colin, Matthias Buser, Thomas Betten, Volkher Onuseit, Max Hoßfeld, Daniel Wehner, and Oliver Riedel. 2021. "A Process-Planning Framework for Sustainable Manufacturing" Energies 14, no. 18: 5811. https://doi.org/10.3390/en14185811
APA StyleReiff, C., Buser, M., Betten, T., Onuseit, V., Hoßfeld, M., Wehner, D., & Riedel, O. (2021). A Process-Planning Framework for Sustainable Manufacturing. Energies, 14(18), 5811. https://doi.org/10.3390/en14185811