1. Introduction
The constant evolution of electrical and electronic components (EEE), especially for information and communication devices such as laptops, computers, and mobile phones, has posed a grave issue for the ever-growing waste of electrical and electronic equipment (WEEE) [
1,
2]. According to the Global E-Waste monitor report for 2020, about 53.6 MT (53.6 mega-tons) of e-waste was generated in 2020. The majority of this e-waste was generated in Asia (24.9 MT) and the American continents (13.1 MT). Europe generated a total of 12 MT of e-waste in the year 2020 [
3]. Government bodies and private companies worldwide are looking for methods to reduce the environmental impact of electronics waste. The constant upgrading of products, rapidly evolving manufacturing technologies, and fast market penetration have been significant factors for the increasing electrical waste as the newer models quickly replace the older products [
1]. The innovation of electrical equipment is one of the critical aspects of the generation of waste electrical and electronic equipment (WEEE) [
1]. Suhariyanto et al. discuss the impact of the evolution speed of various products as a contributing factor towards the generation of waste when these products reach their end-of-life phases. The products are segregated into four groups based on their evolution speeds and lifetimes [
4]. Group 1 consists of the products with a slow evolution speed and a shorter lifetime. This group consists of products like polyethylene terephthalate (PET) bottles, steel cans, etc. These products have a lower cost of manufacturing and can be either reused or recycled without disassembling them. These products are made using a single material for one-time use. Group 2 comprises of the products with a short evolution speed and a long lifetime. Products falling under this category are furniture, automotive parts, etc. These products have a longer lifetime and at the end of their lifetime, these products can be reused or remanufactured, recycled with disassembly to extract the raw materials, or redesigned into a different product with a different function. Group 3 refers to the products with a fast evolution speed and a shorter lifetime. The group consists of consumer electronics such as mobile phones, laptops, computers, etc. These materials can be reused or remanufactured, recycled with disassembly to extract the raw materials, or the parts can be replaced to upgrade the product to be reused. The fast evolution speed and a shorter lifetime of these products make these products one of the primary reasons for the generation of waste. Group 4 comprises of the products with a fast evolution speed but a longer lifetime. The products under this category are lightings, photocopying machines, display products, etc. Even though these products have a fast evolution speed, due to the longer lifetime of these products, the waste treatment methods used are reuse or remanufacturing, or upgradation of products using better parts and recycling of the products to extract raw materials.
Various products have different lifetimes which include the extraction of raw materials, production, usage, and end-of-life product phases. This process shows the product life cycle for various products. Products coming from various market product life cycle (M-PLC) phases have other service times and end-of-life routes [
1]. For example, a product sold during the decay process of the M-PLC seems to have a shorter operational life than one sold during the implementation period [
1].
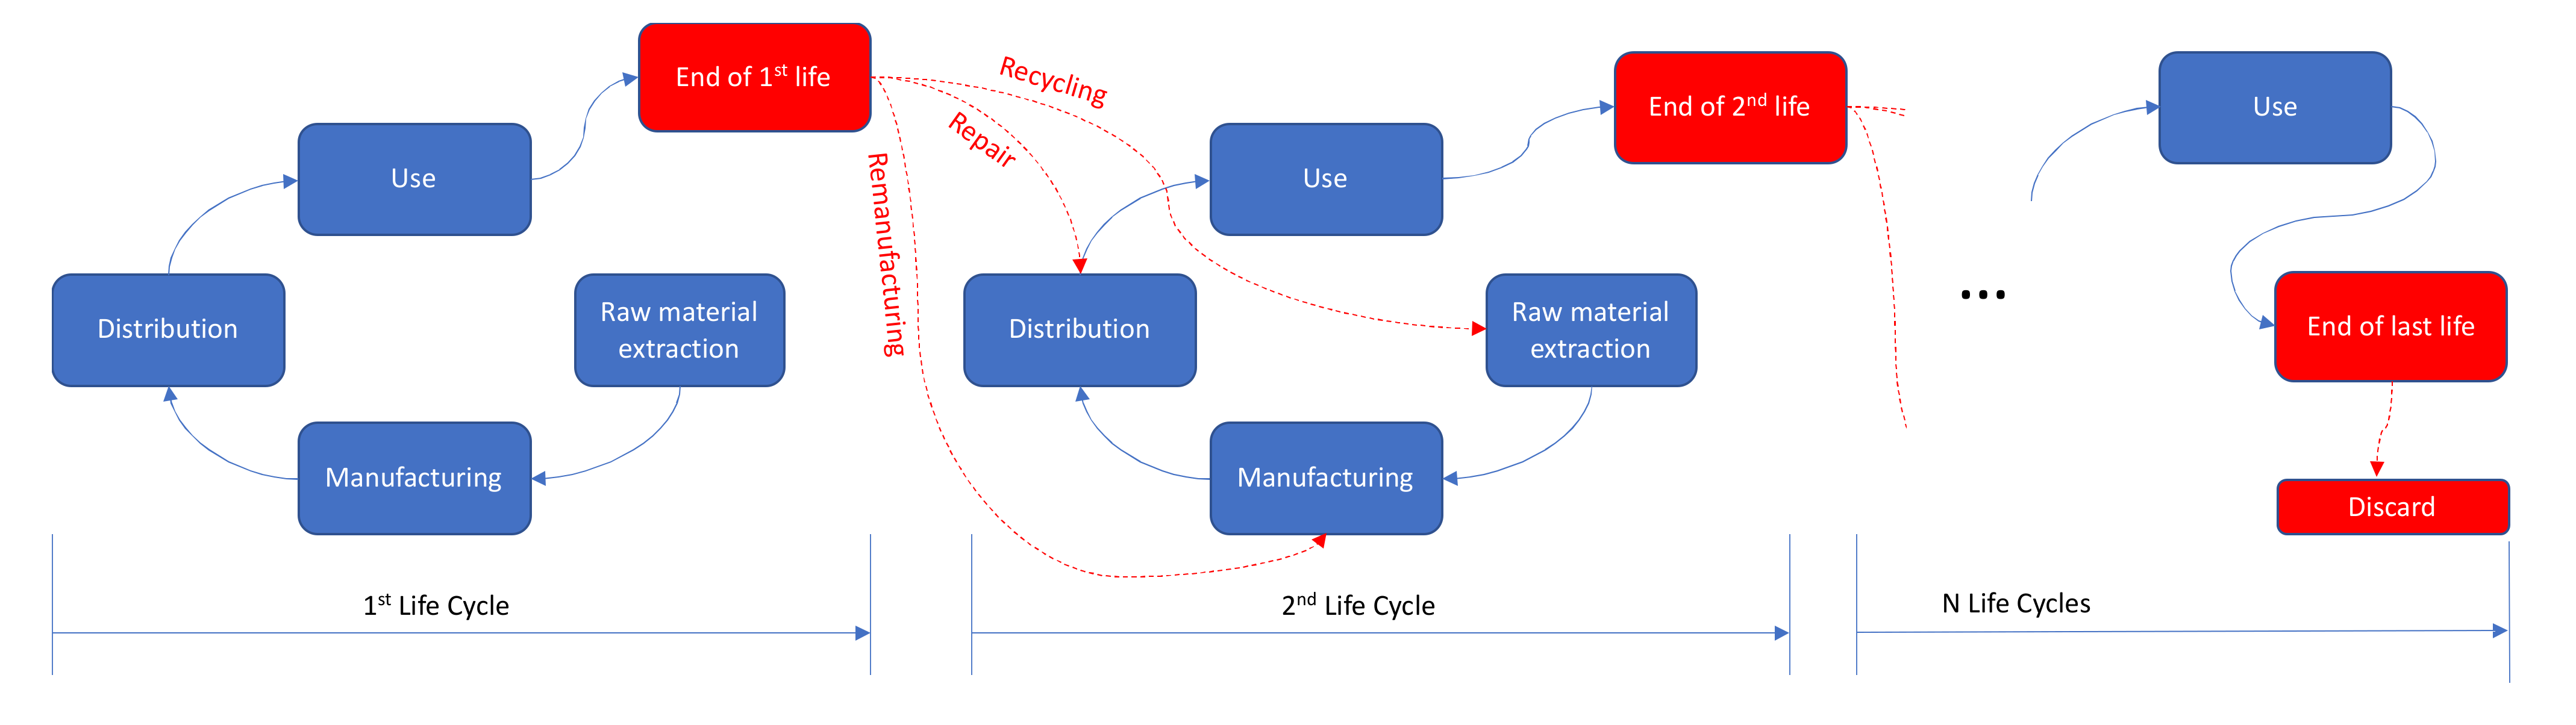
Figure 1 shows the path of a multi life cycle product for its “N” life cycles. When the product reaches the end-of-life phase for its first life cycle, the product can go through different routes depending on the condition of the product. If the product is in highly good condition, the product is sold to another user after some minor repairs to have the same quality as its first life cycle. This route is defined as repairing the product. Another route that the product may take is remanufacturing. Remanufacturing refers to reconditioning and replacing IT hardware and restoring the efficiency to that of a newer model, with a warranty matching an equivalent new product [
5]. Products that can be reused and/or remanufactured are classified as multi life cycle (MLC) products [
4].
In 2003, Williams and Sasaki evaluated the end-of-life (EOL) options for desktop and laptop computers. The authors compared three EOL options: resell to secondary markets, upgrade the key components, and recycle to obtain primary materials. The authors concluded that the options of reselling and upgrading are far more beneficial from an environmental standpoint as compared to recycling, as the decline of lifetime naturally leads to higher savings than recycling, since the majority of the energy input is in the shape of the product, not its materials content [
6].
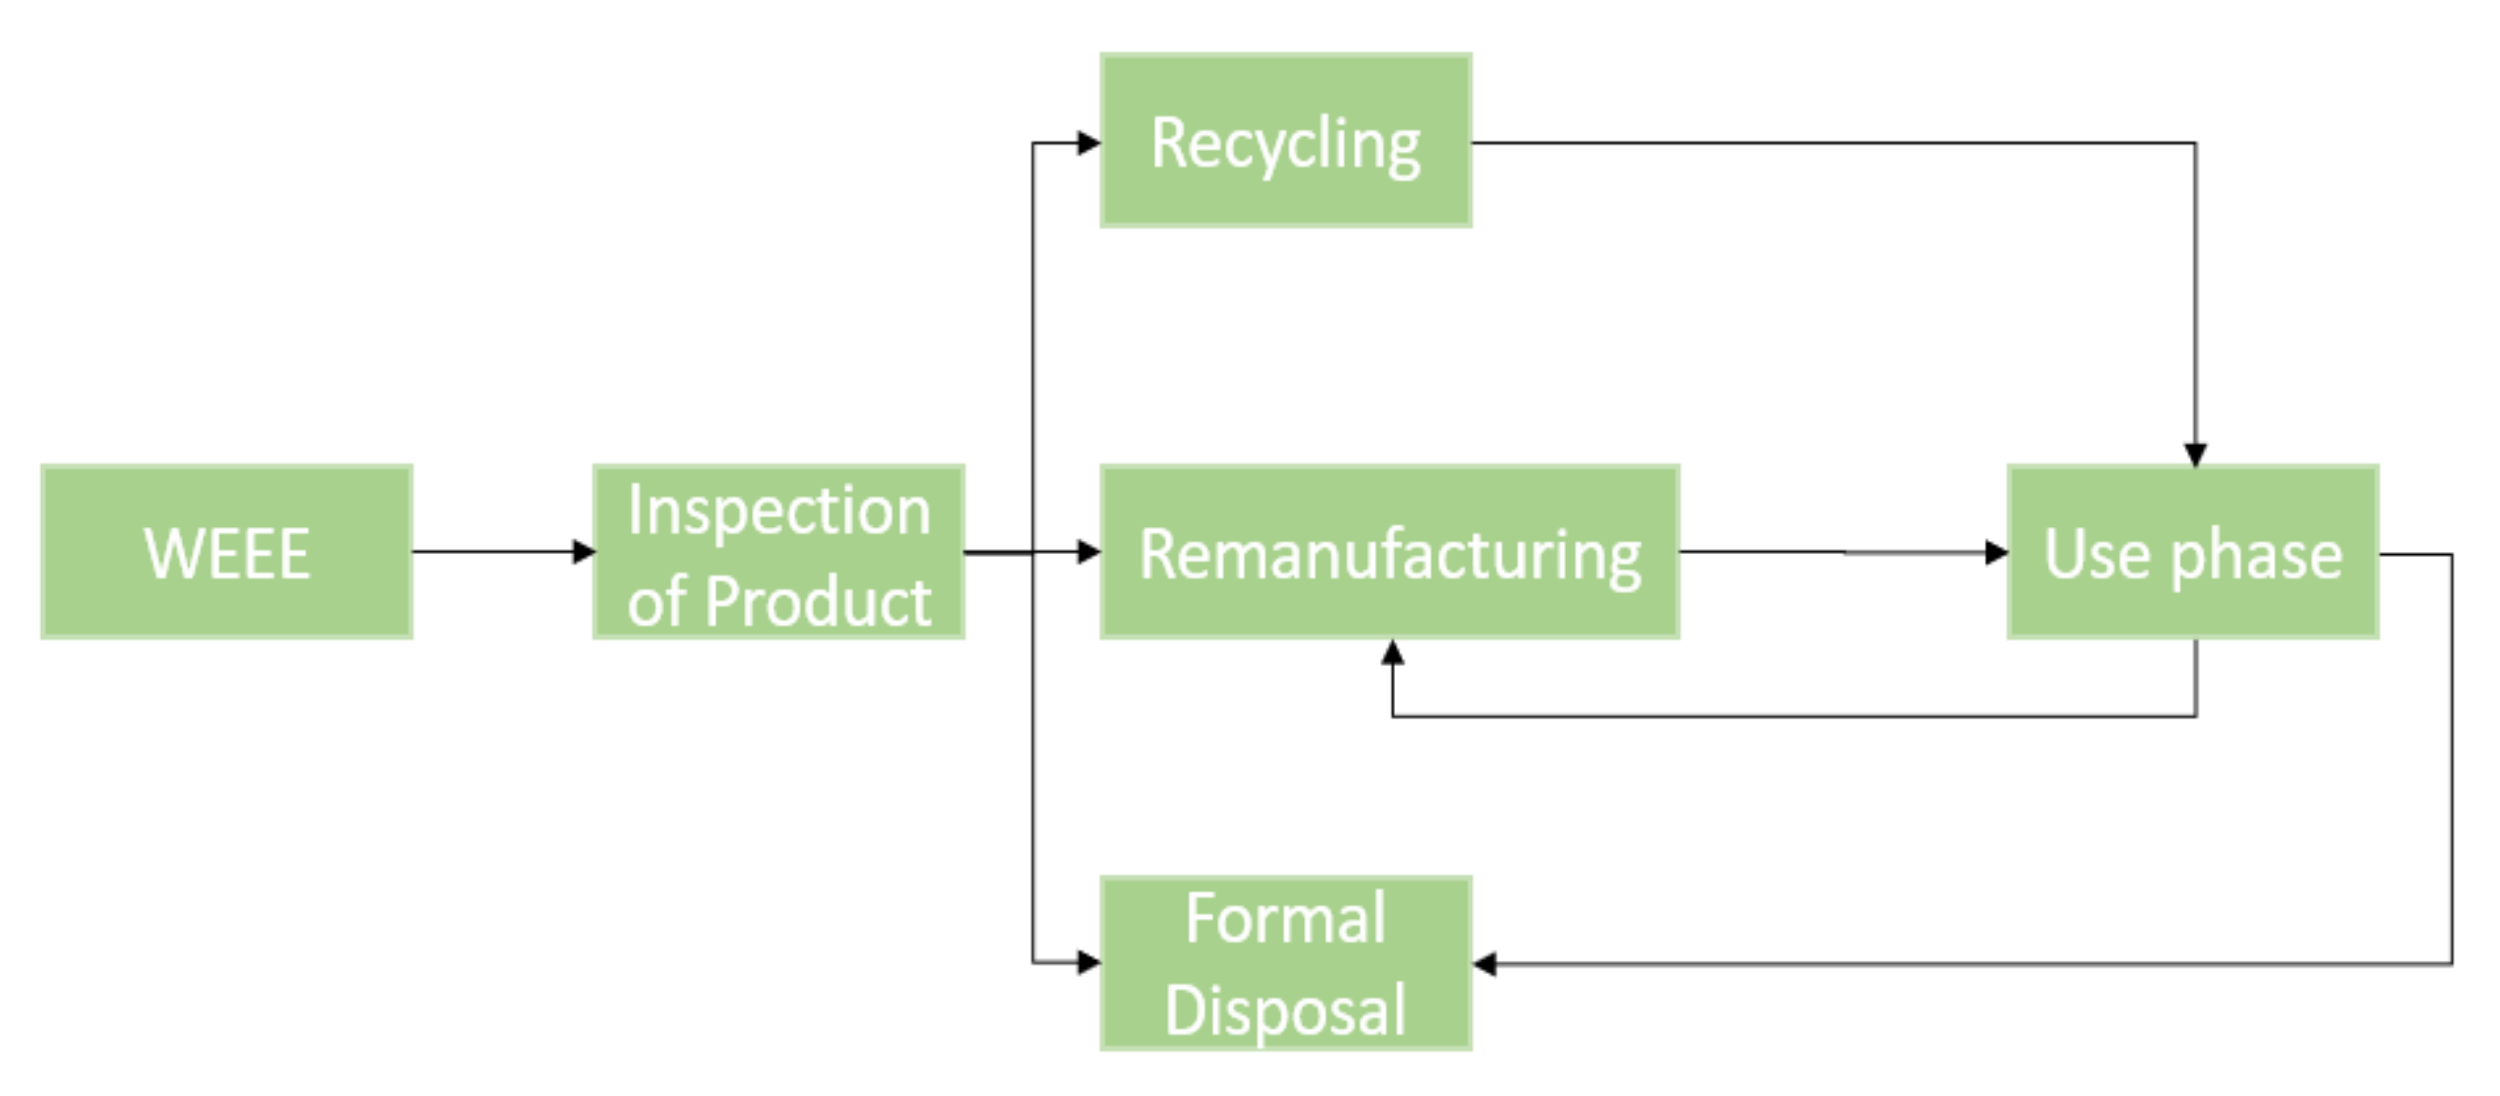
Figure 2 shows the different paths waste user electronics can follow before being formally disposed of. One of the ways is reuse, by which the computer is sold or donated to the next user, as it no longer fulfills the requirements of the customers. One of the other methods is formal disposal, by which the laptop or desktop is disassembled and destroyed to recover the parts and materials. Metals recycling technology is useful, as developed facilities can recover steel, aluminum, copper, nickel, lead, zinc, silver, platinum, gold, and other highly precious metals and non-metals from computer waste [
6].
The next method of treatment for the waste electronics is remanufacturing, in which specific components of the computer are replaced with newer versions of the respective parts to increase the total efficiency of the computer. Often, the user discards the laptop or desktop due to dissatisfaction with the laptop when running on original software [
6]. A typical up-gradation of a laptop or desktop PC would involve replacing microprocessors, hard-drive, operating software, random access memory (RAM), and graphics card. Remanufacturing is one of the more preferred end-of-life options for a desktop or laptop computer from an environmental standpoint [
6]. Much of the energy is invested during the manufacturing phase of the laptop; hence, the ecological payback of recycling materials is low compared to that of remanufacturing [
6].
Green technology is gaining crucial importance to maximize awareness of computing’s environmental influence. Due to rising energy consumption, global warming, and e-waste, governments and public companies have factored the notion of Green Computing into the equation as a contribution to good practices for environmental sustainability [
7]. The concept of Green Computing refers to the accountable and resourceful production, usage, and disposal of computing devices while sustaining financial feasibility and improving performance in a green manner [
8]. Piotr Pazowski [
8] defines the fundamental approaches in green technology by using four concepts: Green Use, Green Disposal, Green Design, and Green Manufacturing. Green Use refers to the use phase of the electronic, focusing on reducing the power consumption of electronics. Green Disposal refers to a greener method of disposal where the original equipment manufacturers (OEMs) can obtain the used product based on a return policy to avoid any damage to the environment. This method focuses on the refurbishment and reuse of existing computers and other electronic devices. The process of green disposal provides an opportunity for the IT vendors for a “take-back” policy to ensure the full life cycle of a given product. Green Design refers to the designing of power-efficient and eco-friendly products that consume less power and can produce the same output on the given power supply. The design process involves connecting companies, government bodies, and environmental organizations for the development of inventive techniques and businesses for designing computer models that can improve environmental quality and enhances economic growth. Finally, Green Manufacturing focuses on the use of a greener method of manufacturing with reduced waste and the use of recycled materials to produce computers and laptops. This approach generates income, such as long-term cost savings, and generates developments to the efficiency of the business processes.
Ayres [
9] conducted a case study based on the life cycle assessment (LCA) technique. The author concluded that LCA is one of the most important decision-making tools for an organization. The LCA provides the opportunity to assess the total environmental footprint for a given product accurately. Apart from the multiple benefits put forward by the methodology, it faces dire challenges. LCA does not give a detailed report; instead, it acts as a compass to direct the decision of an organization. Many LCA cases may show merely trade-offs. It can only occasionally point confidently towards the “best” technological preference. However, the author also points out that there are more challenges in front of an LCA. One of the aspects of this problem is non-comparable units of measurement for emissions and results. This gives rise to an ambiguity in the validation of the result for assessing the given product. The second aspect of the problems with data deficiency is its universal reliance on either open-source theoretical process data (such as chemical engineering, publications, or literature on patents). Some of those “data” are physically impossible. Also, different authors analyzing the same rather standard product commonly differ by orders of magnitude regarding specifics.
The rapid proliferation of new technology products means low reusability of EEE components for the next product generation, and more open-loop materials (materials that can be recycled into other items) available for recycling. Reuse or remanufacturing levels and more open-loop recycling will eventually affect the energy efficiency of the multi-generation product system, as closed-loop recycling such as remanufacturing or reuse is often seen as the higher level in the waste management hierarchy. The traditional LCA process, however, cannot fully assess such a dynamic impact. The standard LCA focuses on one product or one generation of a given product with a static view. While the recycled materials and components are usually included in the conventional LCA, there is still no room for their reuse or reuse processes in the new products or any industrial application [
1]. LCA does not specifically cover the economic or social aspects of the product. However, the approach to the life cycle and methodologies discussed in the International Standard is applied to these other aspects [
10]. Fatimah and Biswas use a framework that can be applied in determining remanufacturing strategies to achieve sustainability of remanufactured computers [
11]. To assess the sustainability of the remanufactured computers, they followed a framework introduced by Fatimah et al. [
12]. Firstly, the authors assessed the current sustainability of the situation through direct observation from economic, social, and environmental standpoints. The result is then compared with threshold values of sustainable manufacturing criteria extracted from national and international values. The authors further discuss several options for improving these numbers to elevate the sustainability of remanufacturing of computers to propose strategies and policies. The authors compared three scenarios to find the most sustainable option. Fitzpatrick et al. described the life cycle engineering of an integrated computer system from the perspective of a small-to-medium enterprise (SME) [
13]. The authors assess the different decision points for an integrated computer system from an SME perspective to help increase the possibility of a more environmentally positive outcome. The authors discussed the features of the iameco-integrated PC, which is categorized under the Energy Star 5.0 specification. However, the authors concluded that an SME is incapable of engineering the life cycle of a computer to produce positive environmental outcomes. Although with careful design considerations, it is possible to provide an incentive for the stakeholders to encourage them towards the environmentally preferred option [
13].
In this paper, the problems related to the remanufacturing of the products in group 3 (electricals and electronics) is dealt with. Such products have a fast evolution speed and a short lifetime. These are distinguished, based on their characteristics, into two types: M-PLC Products by Design Innovation and M-PLC Products by Technology Innovation. The former aim to enhance value by not only providing satisfactory design functionality of their life cycle, but also by providing appropriate EOL treatments and an extension of their life cycle (e.g., photocopying machines). On the other hand, the latter refers to new products with upgrades that are produced to perform the same essential functions as the older models. Usually, a new generation of products can increase the value by offering a more satisfying performance with updated technology (e.g., mobile phones, laptops, and graphic cards).
Using the different methods and results found in the literature, for this paper, an integrated model of DES and LCA is used to study and compare the environmental impact of a centralized and decentralized remanufacturing network.
Section 3,
Section 4 and
Section 5 provide the methodology used to achieve the aim of the paper.
Section 6 consists of a detailed discussion of the results of the assessment and the comparison between the two networks. Lastly,
Section 7 and
Section 8 consist of concluding remarks and the gaps in the research, along with possible future research on determining the total environmental footprint of computers.
2. Environmental Impact of Remanufacturing
The generation of waste consumer electronics poses grave problems for the environment, such as increases in the landfills due to consumer electronic waste, which can result in increased toxin generation, and which can have a serious detrimental effect on the humans. The computer consumes a lot of energy in its various phases during its life cycle. life cycle assessment, as the name suggests, is a simple approach for evaluating all of a product’s (or service’s) environmental impacts, from “cradle to grave” [
14]. The estimation of the total energy consumed during the production, use, and remanufacturing phase of laptop computers is measured using the LCA methodology. In this paper, the various energies involved with the remanufacturing of a computer in a centralized, as well as a decentralized, remanufacturing scenario are tracked. The two scenarios are assessed using the LCA methodology based on an integration with discrete event simulation (DES).
Table 1 depicts the bill of materials for a laptop, along with the total weight of the material used. The material bill reflects an average of the best-selling laptop computers fitted with a 15-inch LCD screen in 2005. According to data derived from the IVF Industrial Research and Development Corporation survey in 2006, the average physical weight of a laptop computer is 2.9 kg, with a lifetime of 5–6 years [
15]. Electrical and electronic equipment, such as laptops, has a significant environmental impact during its various stages of manufacturing, use, remanufacturing, and disposal [
16]. The energy consumed during the manufacturing of a laptop will remain the same for a particular type of product; however, the energy consumed during its use phase depends on whether the product is being used for office or home purposes [
14].
Figure 3 below shows the energy consumption during the stages of manufacturing, use, and remanufacturing. The data is adapted from [
11,
13]).
During the manufacturing phase of a laptop, 1266 MJ of energy is consumed in transforming heavy-duty metals into the desired product (manufacturing phase), and 5832 MJ of energy is consumed in the form of electricity for an office laptop (use phase). In contrast, a home computer consumes 3627 MJ of energy. In the remanufacturing phase of the laptops, 1867 MJ of energy is consumed for the repair and upgrade of the system (remanufacturing phase) [
6].
4. Life Cycle Assessment
The assessment was conducted using the openLCA software for the life cycle assessment of the supply chain models integrated, along with WITNESS Horizon from Lanner Group for discrete event simulation (DES). The LCA was carried out based on the LCA framework provided in ISO 14040:2006 as a skeleton. The ISO framework acts as a guide for all general LCA [
10]. For this assessment, DES has been integrated along with LCA, and a suitable framework is created. The framework helps in understanding the different steps included in the assessment. The assessment begins with establishing a scope for the required assessment; the next steps include populating the life cycle inventory and then conducting a discrete event simulation and assessment. The final step is to interpret the result of the assessment.
The DES of manufacturing systems is a proven method for planning and evaluating the efficiency and effectiveness of manufacturing systems. DES has proven its usefulness in job-order-related and time-sensitive planning of output flows [
17]. It has proven to be a very successful solution to troubleshoot and optimize output processes [
18]. Material Flow Analysis (MFA) implemented to a company’s manufacturing framework typically focuses on increasing the performance of the production processes, i.e., in such a way that the most effective use of materials and resources is achieved [
19]. Integrated the application of DES and MFA in the manufacturing systems context adds to the usually-static MFA a dynamic, job-order related perspective [
17].
One of the goals most discussed in DES is the optimization of benefits, i.e., determining which of the alternative solutions is the most effective over time. In the past, the emphasis has been on profitability. However, environmental issues are becoming more critical, and if people want to make use of natural resources, they need more focus. DES and LCA are a powerful combination for assessing the cause and effect of different circumstances in which time, energy, location, and random input variables affect sustainable production design [
18].
4.1. Integration of DES with LCA
The application of DES has become increasingly common and significant in the last decade in the sustainability analysis of production systems [
20]. For this study, a model of the entire network was created using DES. In the evaluation and development of any production system, the combination of DES and life cycle assessment (LCA) data and analysis techniques have been developed and evaluated. This combined approach (DES and LCA) has also been assessed in recent research regarding its feasibility for environmental goods assessment.
Andersson, Skoogh, and Johansson [
21] discussed three projects which aim at the successful integration of LCA with DES. The authors compare the three integration projects and talk about the different scopes, applications, and challenges faced by these integration projects.
Another big project in the integration of LCA with DES is the Milan/Eco factory, which aims to combine DES with MFA and LCA [
17]. This reimplementation aimed to compose the simulation software of several independently developed parts, such as the simulation service, the components of the simulation, the persistence backend, and the graphical user interface. With this structure, the current simulation components are augmented with new functionality (such as the accounting of materials during a simulation run), and brand-new simulation components are added.
4.2. Scope and Boundary
To achieve the goal of the paper and to gain a detailed knowledge of the ecological footprint of the supply chains, an integrated model of LCA and DES is used. The boundaries for the centralized and decentralized remanufacturing networks for the LCA are shown in
Figure 5a,b. The boundaries were drawn to facilitate consistent and functionally equivalent comparisons between the two supply chains.
4.3. Life Cycle Inventory
Life cycle inventory refers to collecting data on the total inputs and outputs of the system. All the data used in the life cycle inventory have been extracted from past literature. In this project, three processes have an environmental impact transported via truck, ship, and the complete process of remanufacturing inside the remanufacturing plant.
4.3.1. Life Cycle Inventory Data for Remanufacturing
The inputs for the life cycle inventory for the remanufacturing process are taken to be the bill of materials for a laptop (refer to
Table 1). Apart from the several metallic and non-metallic materials that are used in the process of remanufacturing, a few more resources are required to complete the remanufacturing process. These inputs have been listed in
Table 2. The values are derived from the report from Swerea IVF Industrial Research and Development Corporation, Sweden, based on the environmental impact of the manufacturing, use, and disposal of personal desktop computers and laptops [
15].
The outputs listed in
Table 3 are used in the LCI for the LCA of the remanufacturing process.
The quantities of waste produced have been assumed to be 30% of the total weight of laptops brought into the remanufacturing facility. The total amount of waste and emissions produced are extracted from literature, or the values have been assumed.
4.3.2. Life Cycle Inventory Data for Transportation
The transportation of laptops has a significant impact on the environment. These laptops are transported from the pickup locations to the port and then shipped to the Middle East for remanufacturing for the centralized remanufacturing scenario. In this case, we must evaluate the total emissions produced during the transit of laptops from one continent to another. For the evaluation of emissions, values have been extracted from previous literature, and aspects of the transportation process have been assumed. For the assessment, we have assumed that the ship and the truck move at a constant speed, maintaining a constant fuel average. We have assumed that the fuel consumption average provided by the ship is 55.2 L of ship fuel per 100 km.
Similarly, the average fuel consumption for the trucks is assumed to be 28.6 L per 100 km. The LCI data have been calculated using assumptions and values for the emission per kilogram of fuel, and have been extracted from previous literature.
Table 4 and
Table 5 list the total emissions produced by 1 kg of fuel for trucks and ships, respectively. Values taken for emissions from a ship for 1 kg of fuel are assumed for a load of 85–90 percent.
5. Discrete Event Simulation of the Centralized and Decentralized Remanufacturing
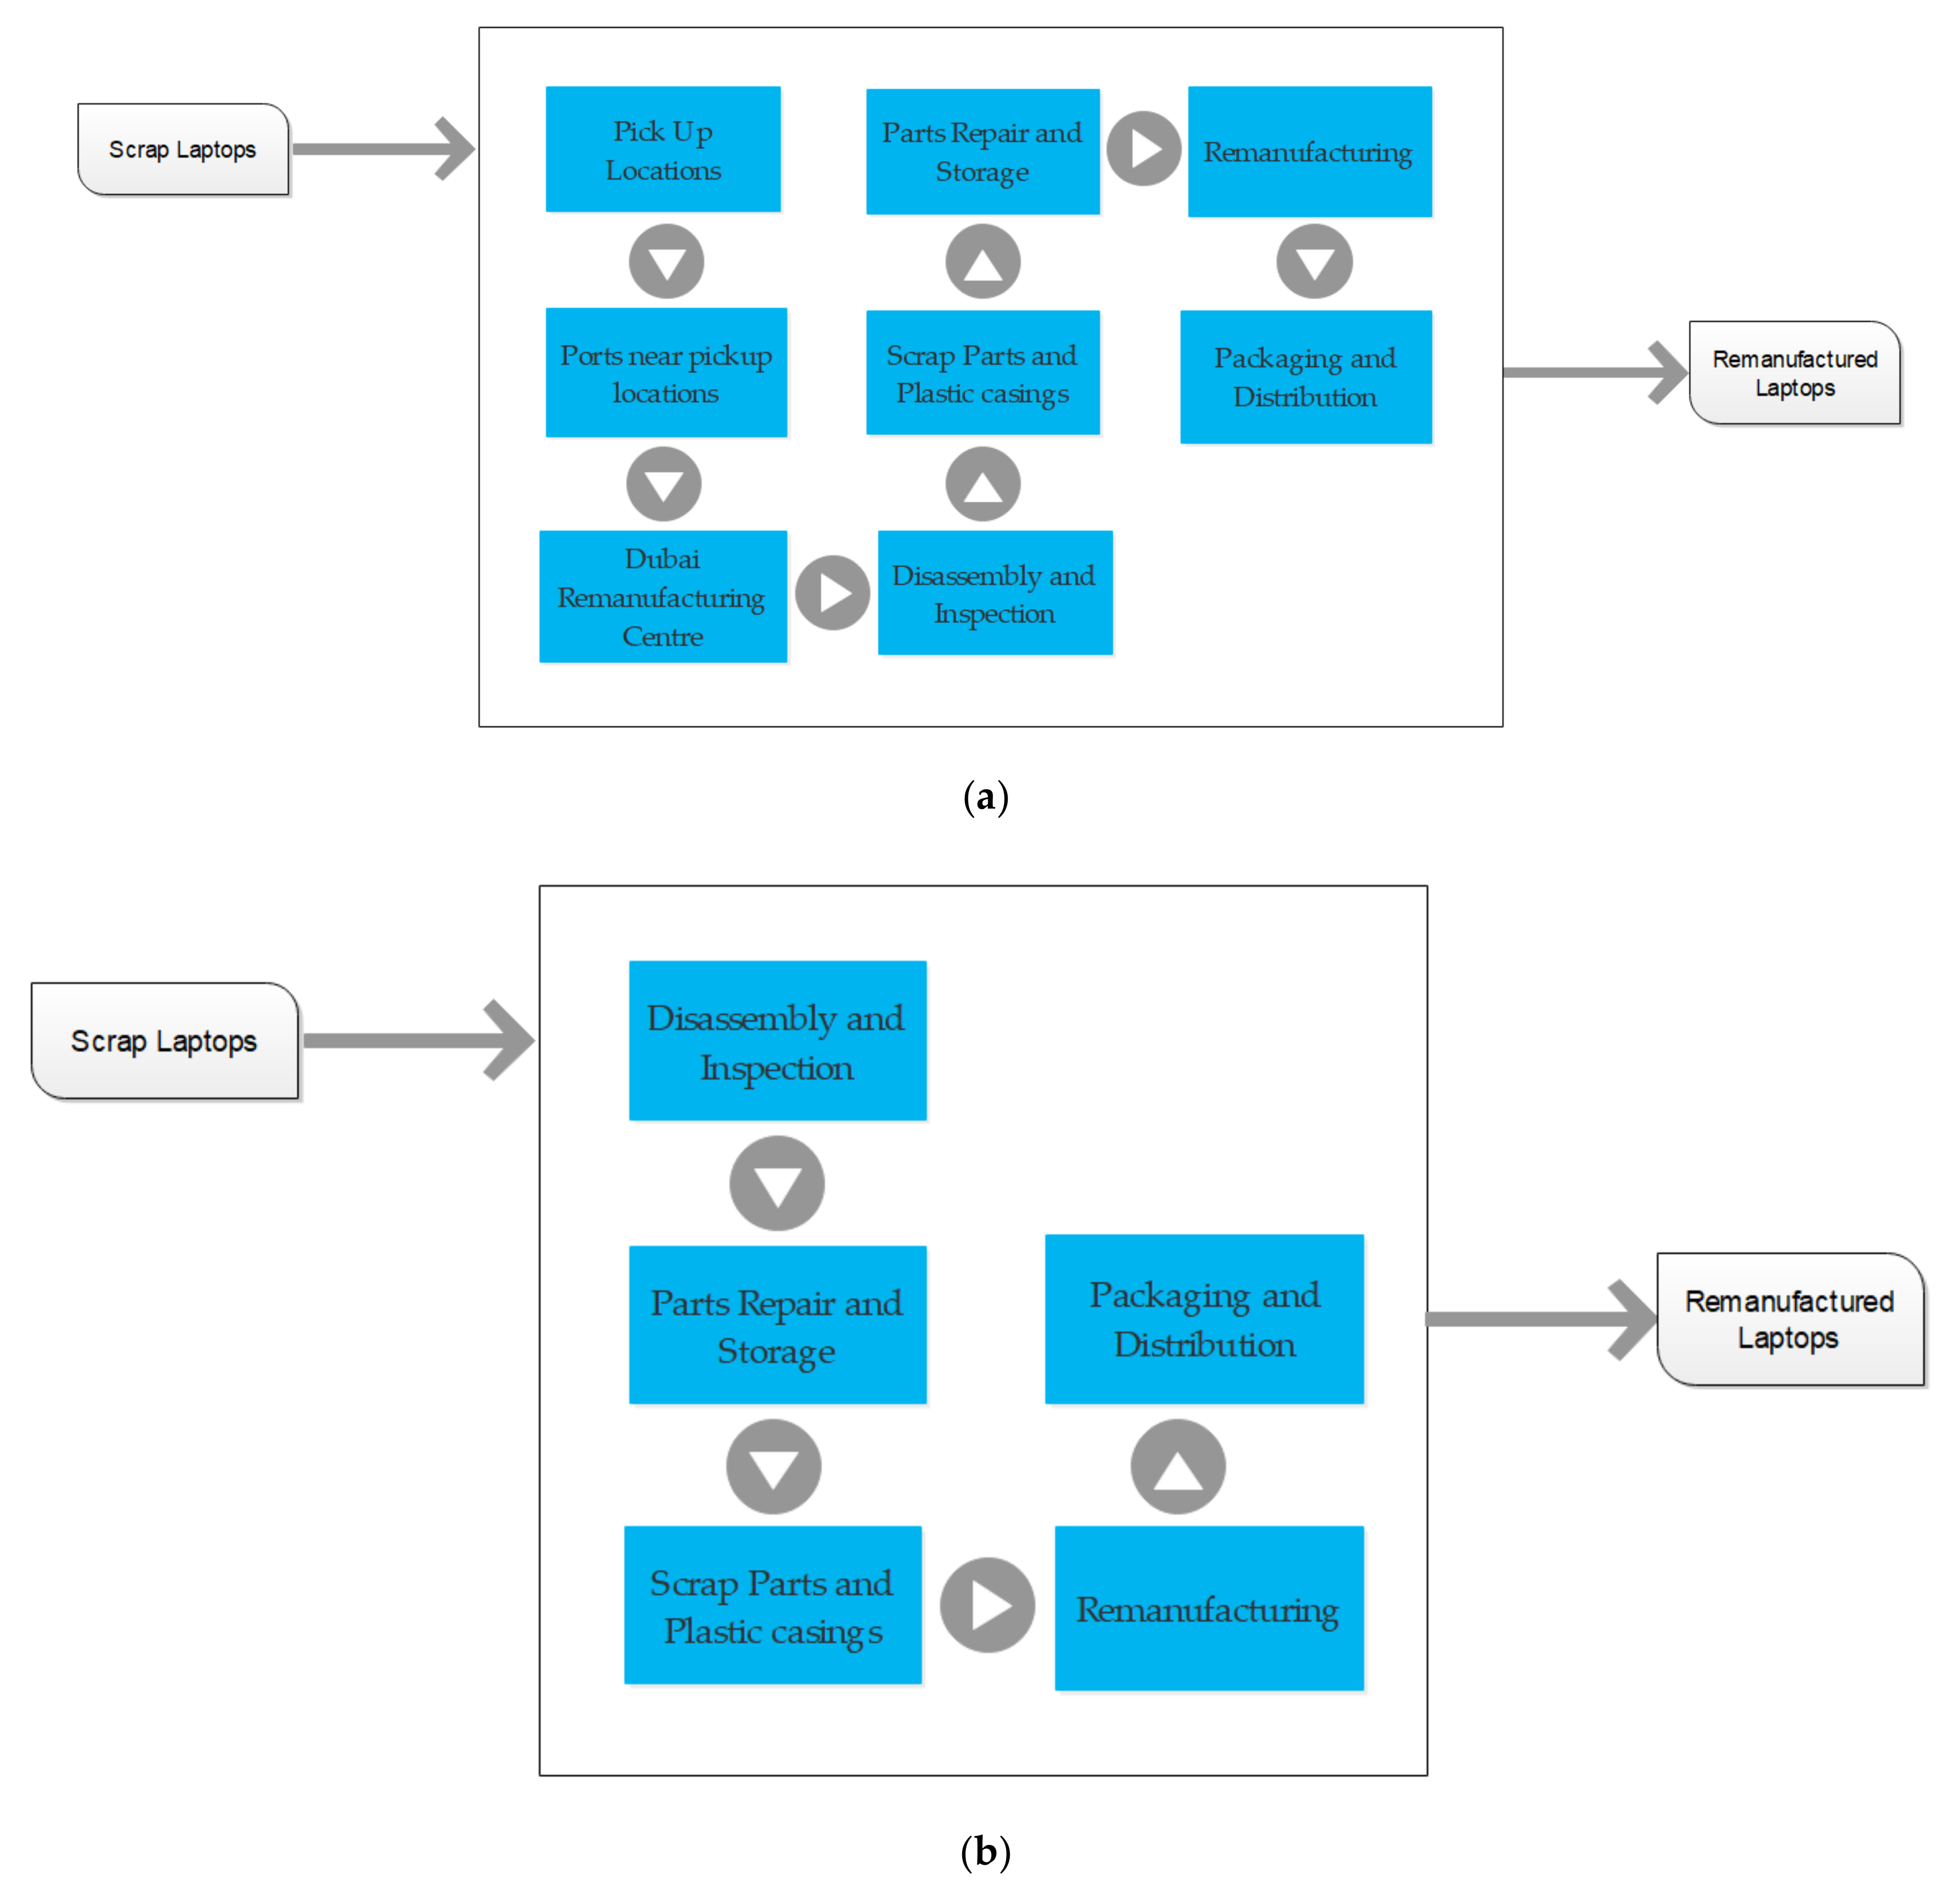
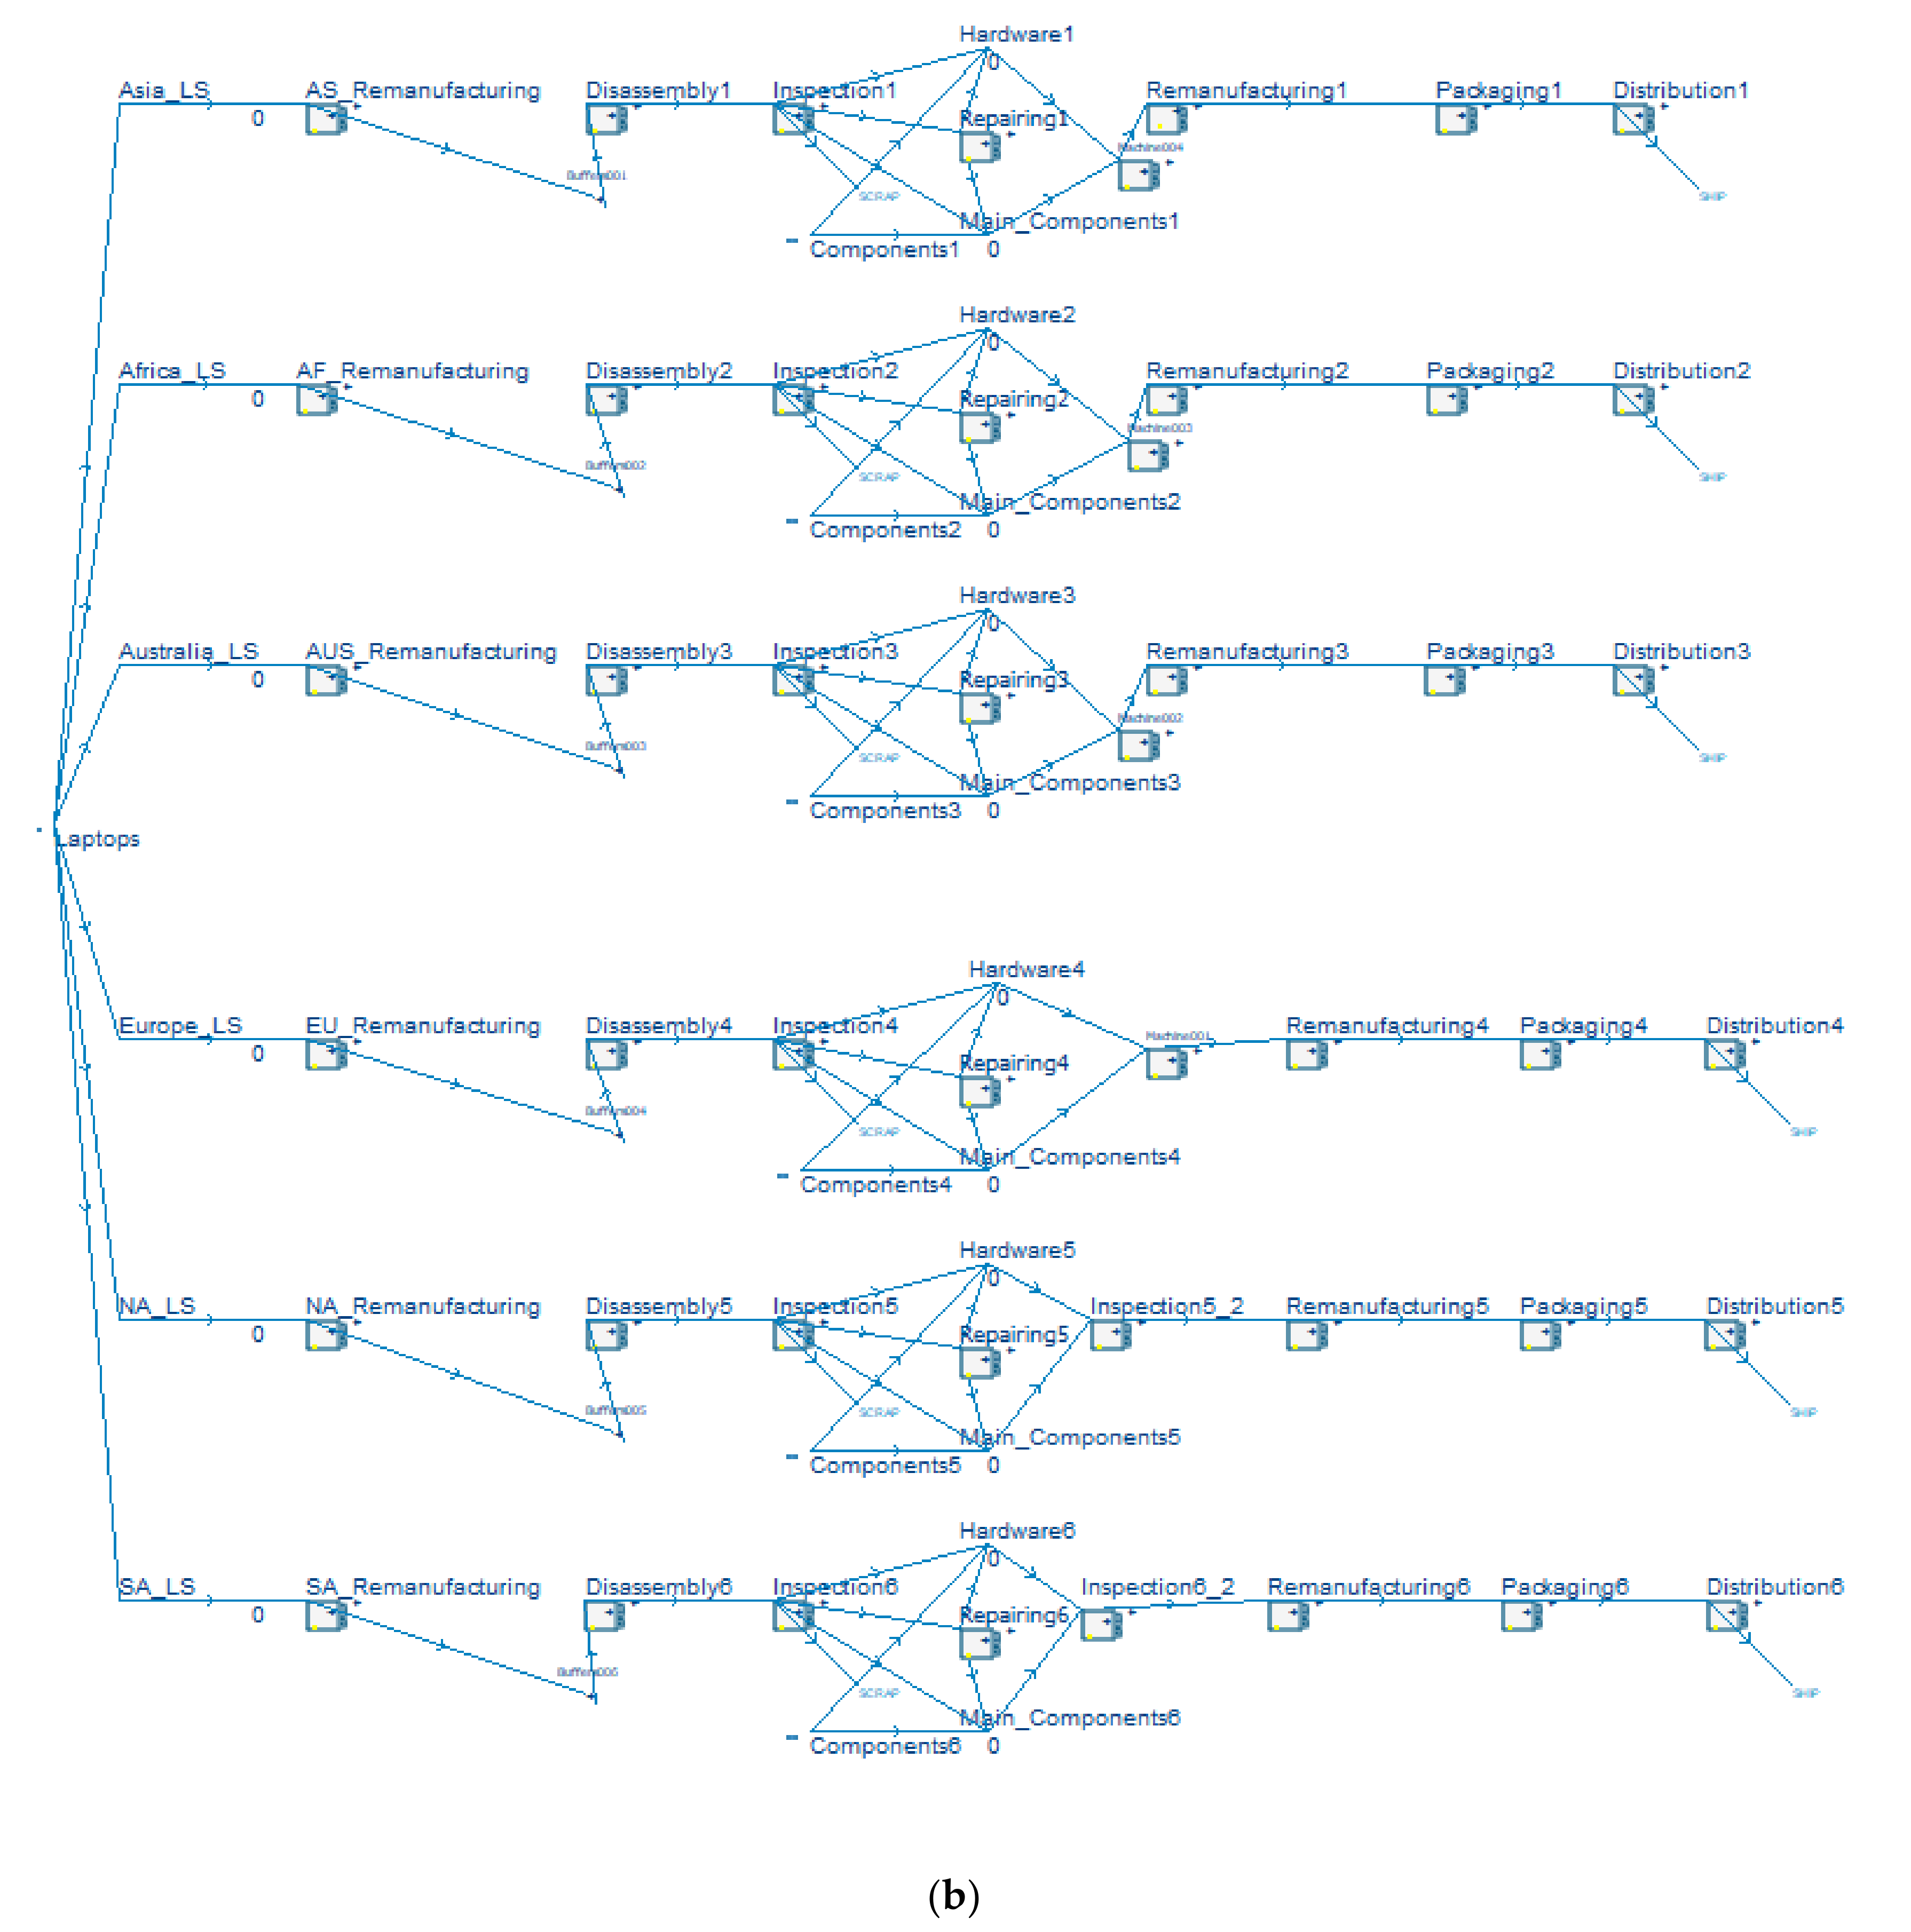
The simulation model is created on WITNESS Horizon software from Lanner Group that maps out the entire network for the centralized and decentralized remanufacturing of computers. The simulation models for the centralized and the decentralized remanufacturing network are shown in
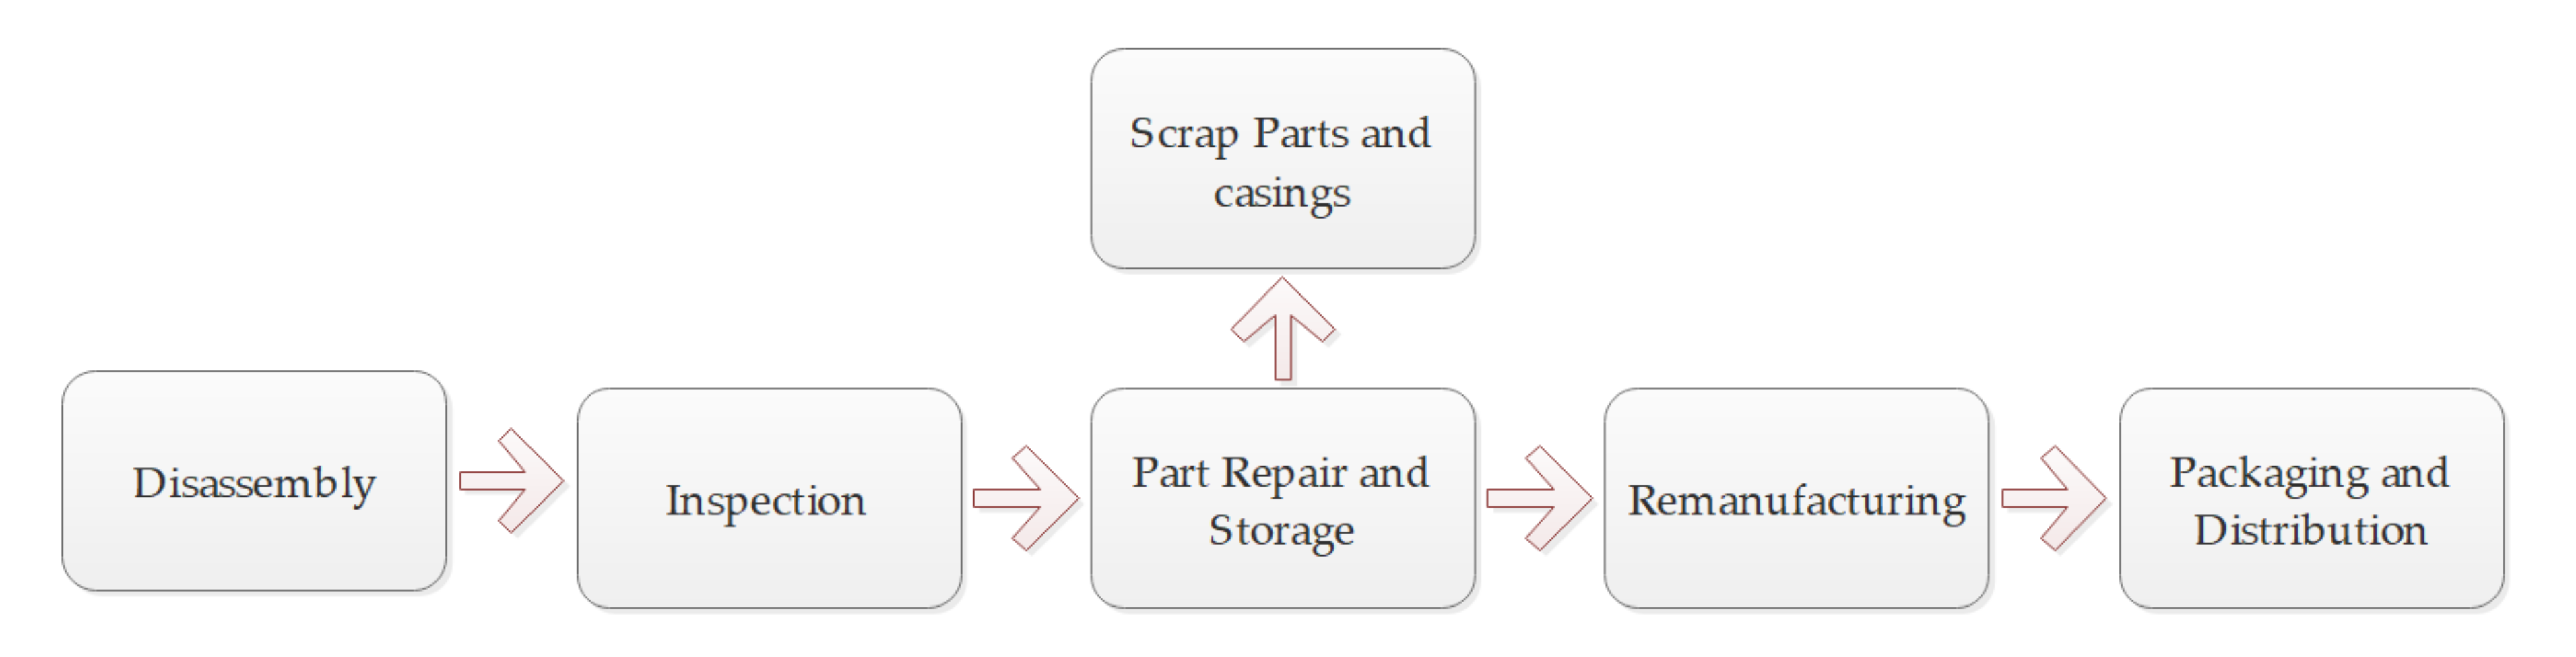
Figure 6a,b, respectively. The laptops are taken from the port of the Middle East to the remanufacturing center, where each type of laptop undergoes a standardized process. The process starts with disassembly, during which the laptops are stripped down to their parts and moved on to the next step, inspection. In this step, the current condition of the part is mapped. The parts in good condition are pushed to the storage, and the parts that require repair are pushed for repair. The parts that cannot be used are discarded as scrap.
The laptops are forwarded to remanufacturing step, in which each laptop is assembled with upgraded parts and peripherals. These remanufactured laptops are packaged and then shipped for sale.
The process of DES provides the opportunity of studying a given process and evaluating its efficiency, to get a closer and detailed view of the process. The simulation model has been constructed based on a few assumptions which are listed as follows:
The total weight for the container that is shipped from the pickup location is assumed to be 750 kg (functional unit). The average weight of a laptop is assumed to be 2.9 kg. As a result, a total of 250 laptops are assumed to be shipped in a single shipment.
The laptops are shipped from the pickup locations every ten days.
The total distance between the port and the pickup location is assumed based on the probable prime geographical locations of pickup centers that are located all over the globe.
The total distance between these pickup locations and the Middle East port is assumed based on the locations of the pickup locations.
The cycle times for every process in the remanufacturing of a laptop are assumed.
A 9-h shift for the day is assumed with being off on weekends.
For this assessment, DES is used to recreate a real-life supply chain scenario for both cases. Through DES, the total throughput and the utilization of each labor instance and machine are evaluated. This data assist in calculating the total emissions produced during the process of remanufacturing. As a result, the energy inputs in the life cycle inventory are much more accurate. They measure the emission rates, the weight of the raw materials, and the overall energy consumption during the remanufacturing process using the data derived from the simulation, and comparing them with the data in the life cycle inventory.
The calculated values extracted with the help of DES are used to assess the total environmental impact of the two supply chain models. For the assessment, the ReCiPe method of assessment is used. The ReCiPe is a life cycle impact assessment (LCIA) process, first established in 2008 through collaboration between RIVM, Nijmegen University of Radboud, University of Leiden, and Pré Sustainability [
23]. ReCiPe is used for the environmental analysis of products when a higher consistency in midpoint and endpoint method application is needed, since it was created as an updated version of CML 2 and Eco-indicator 99 [
24]. The key objective of the ReCiPe method is to transform the long list of life cycle inventory results into a limited number of indicator scores (such as “Damage to human health”, “Damage to ecosystems” and “Damage to resource availability”). These indicator scores express the relative severity of an environmental impact category. In ReCiPe, indicators are determined at two levels [
23]:
The assessment is carried out for different cases and different scenarios for six different laptops. The scenarios taken into consideration for this are as follows:
Assessment for a single laptop that arrives from different pickup locations located around the globe to a remanufacturing center in the Middle East for the centralized remanufacturing scenario;
The assessment of a laptop that is remanufactured in the remanufacturing plants located in each continent.
Based on the assumptions mentioned in the earlier sections. The following assessment of the remanufacturing operations for the variety of laptops for one month.
6. Results
The inventory data were input using
Table 2,
Table 3,
Table 4 and
Table 5. The software analyzes the given input values for the resources used and the emissions generated to calculate the values for the mid-point categories. The values of the midpoint categories for each scenario of the assessments have been compiled in
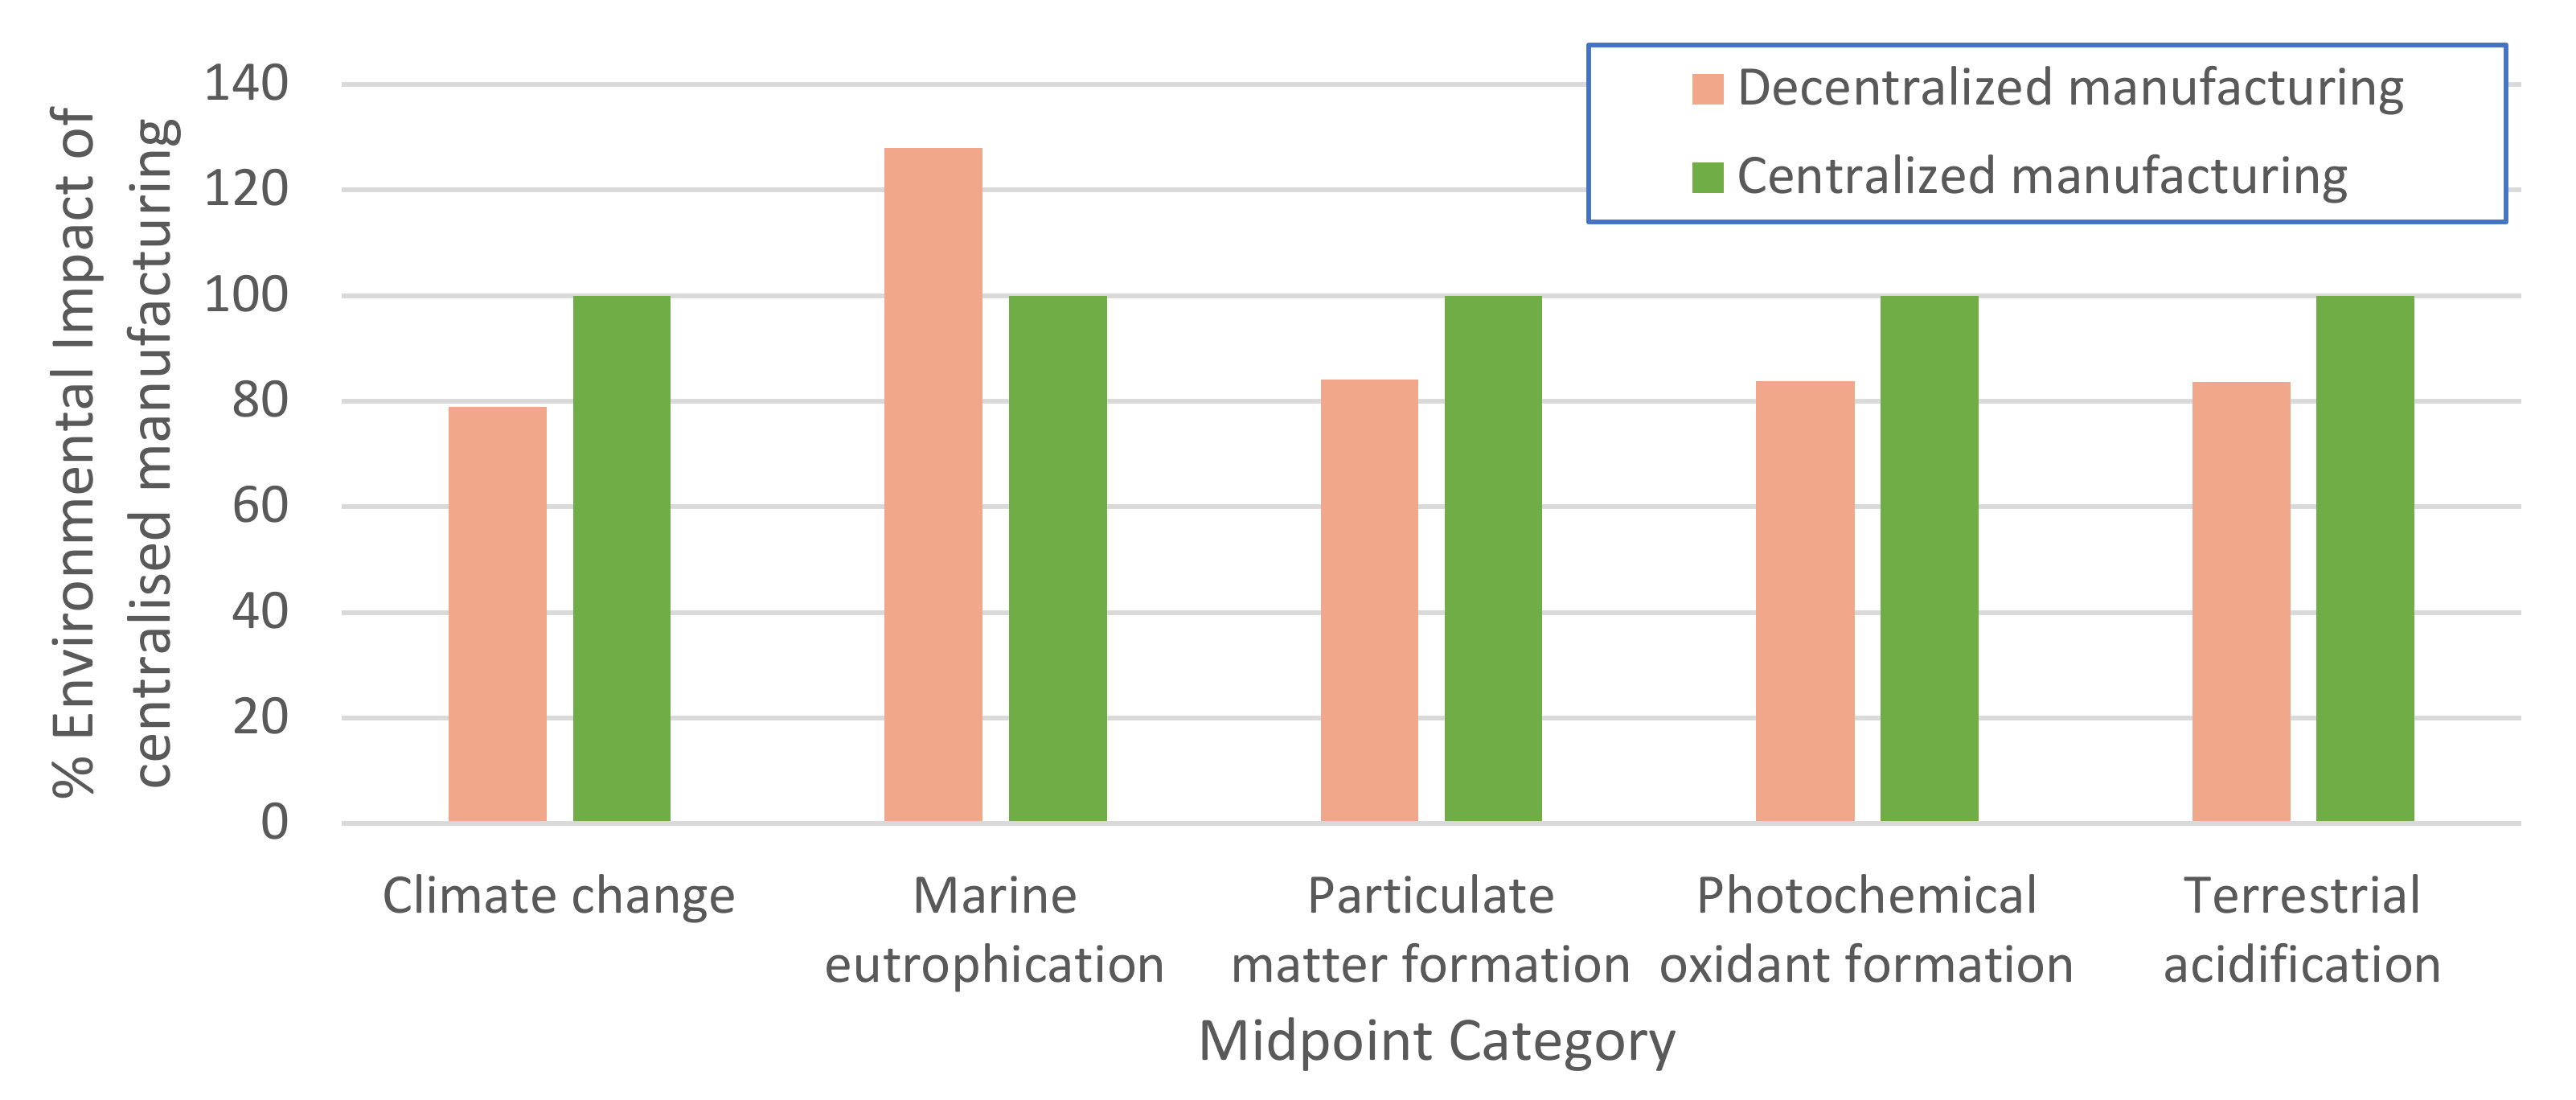
Table 6. The values of the midpoint categories from the LCA are compared to get a detailed understanding of the impact of the two supply chains to aid in decision making. In centralized remanufacturing, the values for each midpoint category are comparatively much higher than those of decentralized remanufacturing. This means that the present supply chain scenario’s overall environmental effect is greater than the environmental impact of the alternative supply chain. The results of the assessment of the supply chain network when the network is operated for one month as bar graphs are shown in
Figure 7a,b.
The supply chain networks are assessed for two scenarios as mentioned above, in the result obtained for the life cycle assessment of the centralized and decentralized remanufacturing. In the first scenario, in which the LCA results of the two supply chain scenarios over a month are compared, there is a significant difference in the different fields of impact. The impact is calculated using equivalent units for a given category. The centralized remanufacturing scenario has a climate change impact of 1035.19 kg of CO2-Eq, as compared to the decentralized remanufacturing scenario with an impact of 816.12 kg of CO2-Eq. The decentralized remanufacturing was found to have a lower impact in terms of impact on human health, the impact on the ecosystem, and the impact on the resources. The decentralized remanufacturing network has a higher impact on marine life, with a quantified value of 0.28 kg of N-Eq, as compared to the impact on the marine life of the centralized remanufacturing (0.22 kg of N-Eq).
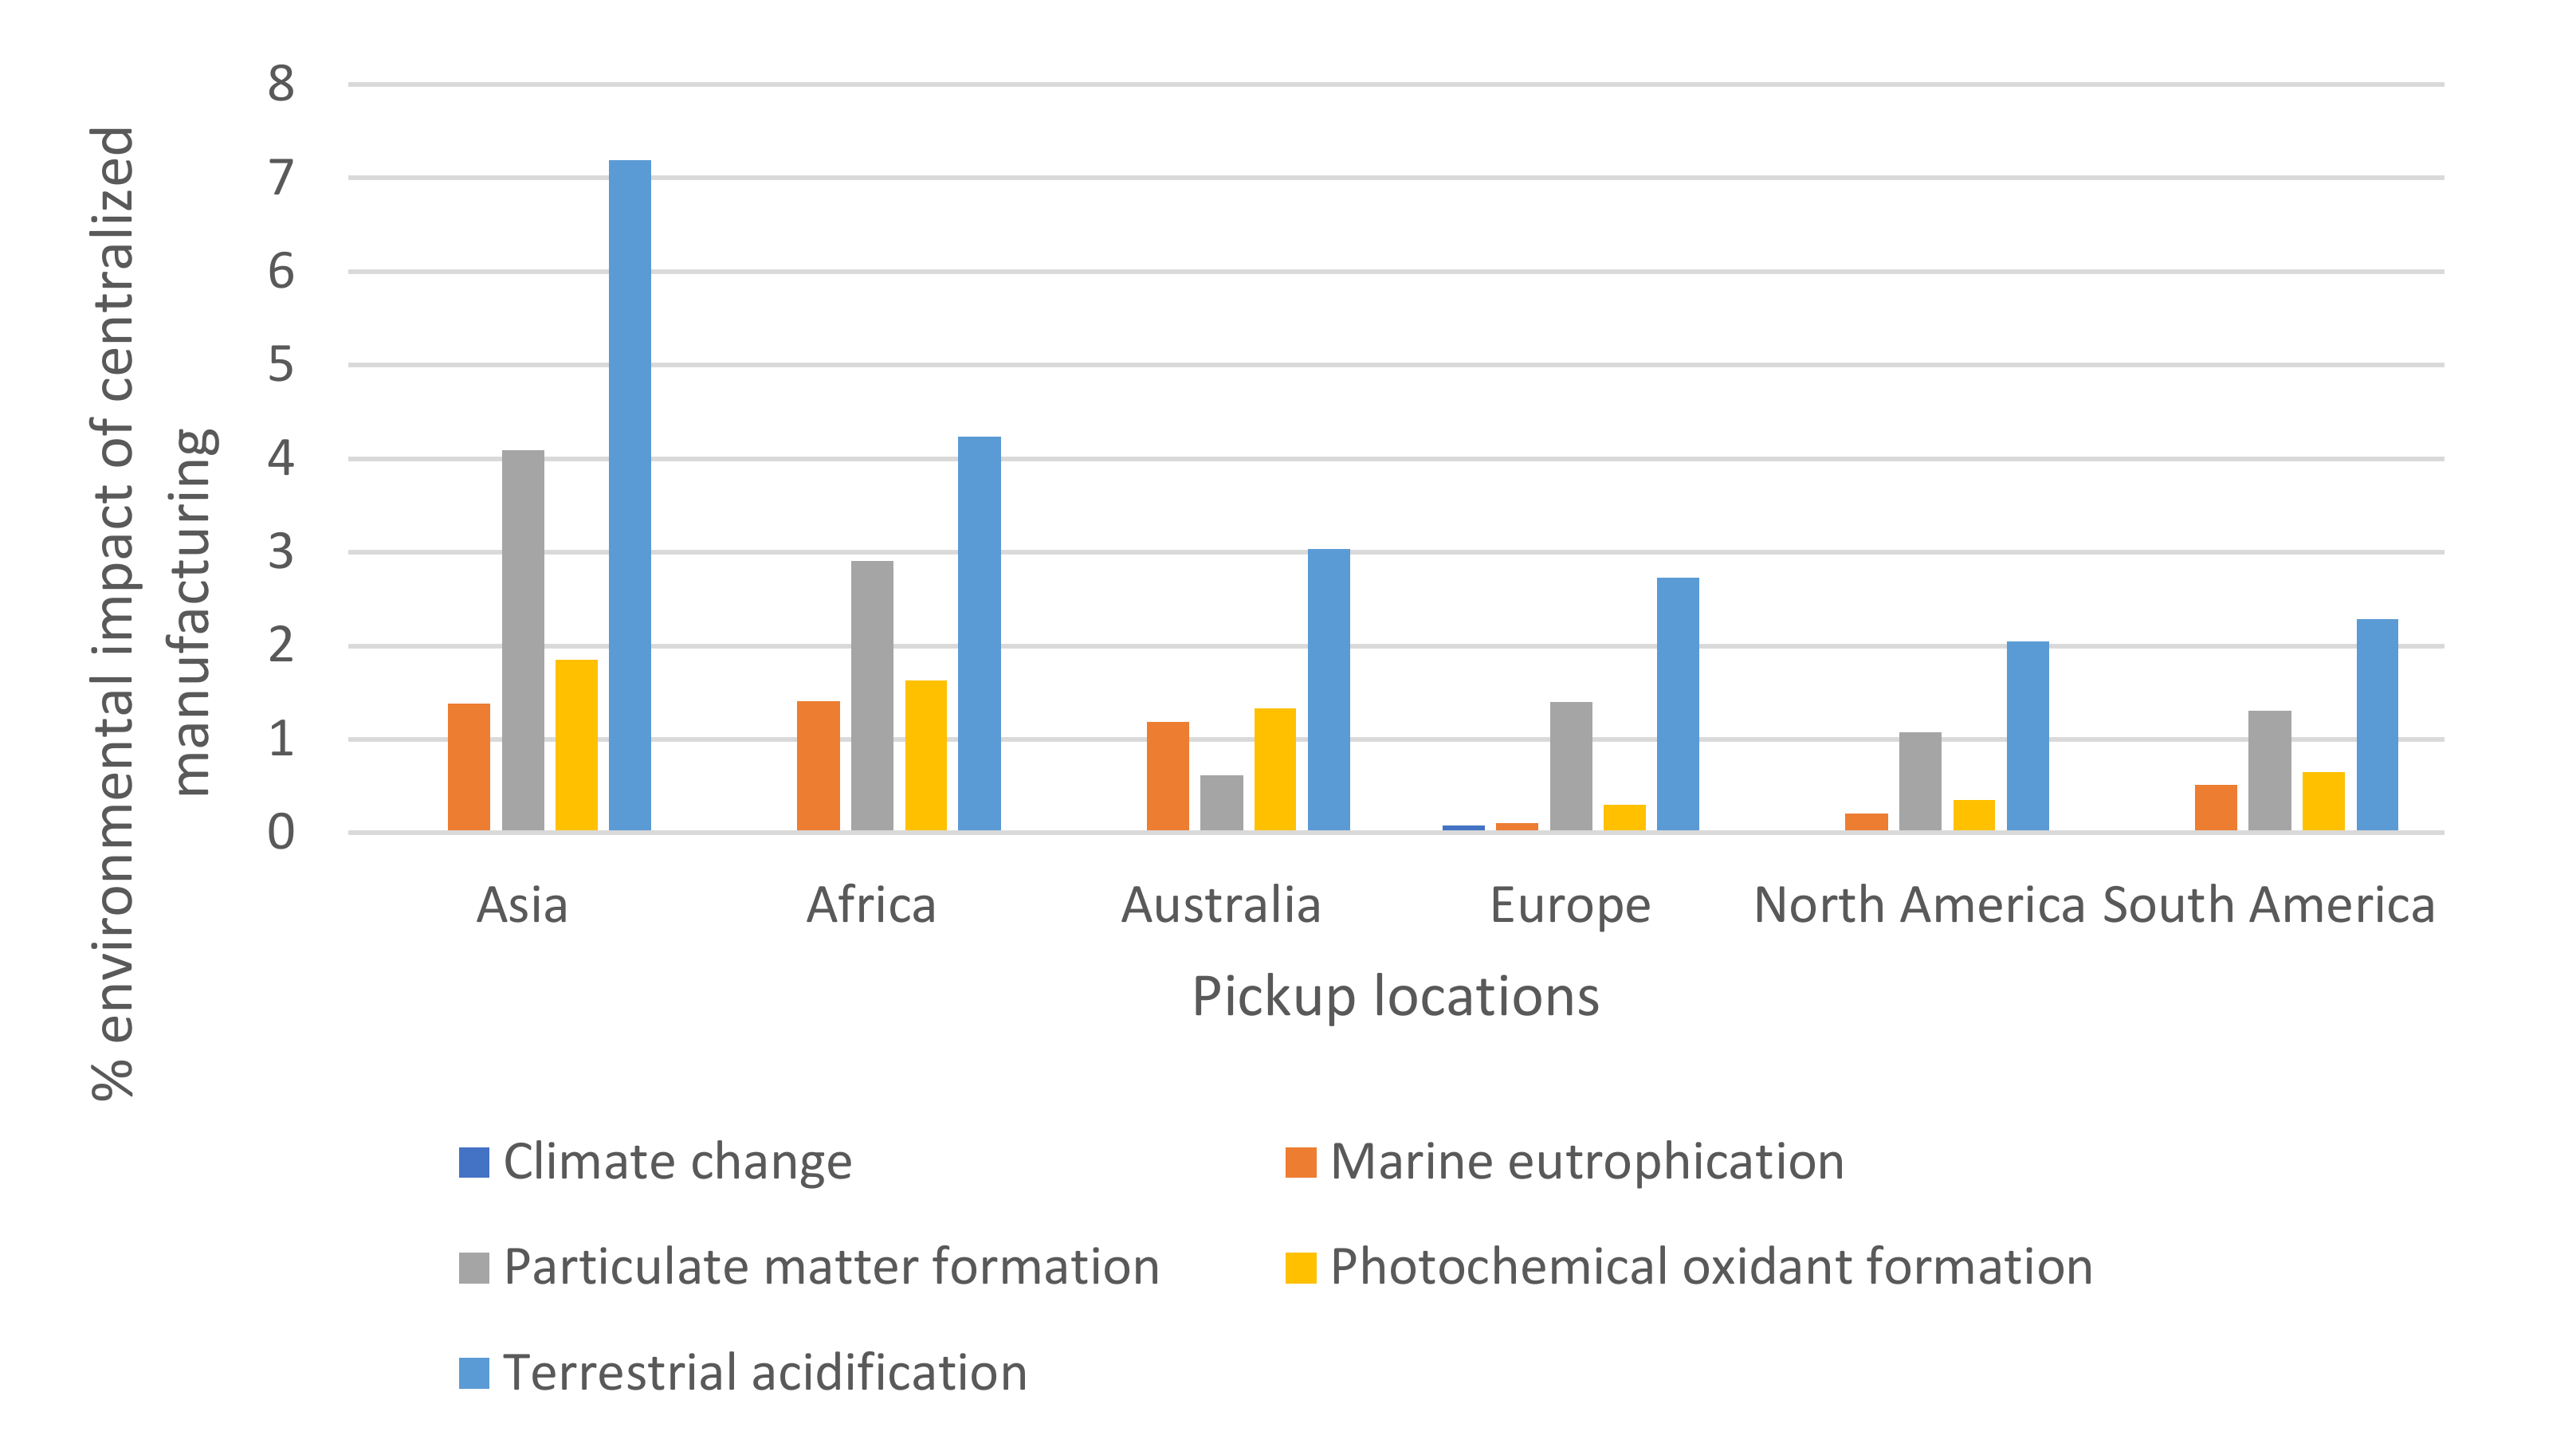
The centralized remanufacturing network poses a threat to human health and ecological life. The network had a greater environmental impact when viewed from a God’s eye view. However, in the second scenario, the results are seen for the environmental impact of remanufacturing a single laptop which is dispatched from different pickup locations. It is assumed that the same laptop model is used for all the assessments; the results are tabulated in
Table 7. In the table, the five midpoint categories with the highest impact are presented.
The results are compared for both the supply chain models. The results of
Table 7 show the impact caused by the respective supply chain network for the midpoint categories discussed above. The decentralized remanufacturing had a lower impact than centralized remanufacturing for each of the categories.
Figure 8 shows the environmental impact of the decentralized manufacturing supply chain network as a percentage of a given impact for the centralized manufacturing for a given pick up location.
In the first case, the laptop is dispatched from an Asian pickup center and goes through the process of remanufacturing. The impact of the laptop from an Asian pickup center is assessed for both centralized and decentralized remanufacturing. The results show that the decentralized remanufacturing network had a very low impact on the environment, as compared to the centralized remanufacturing network.
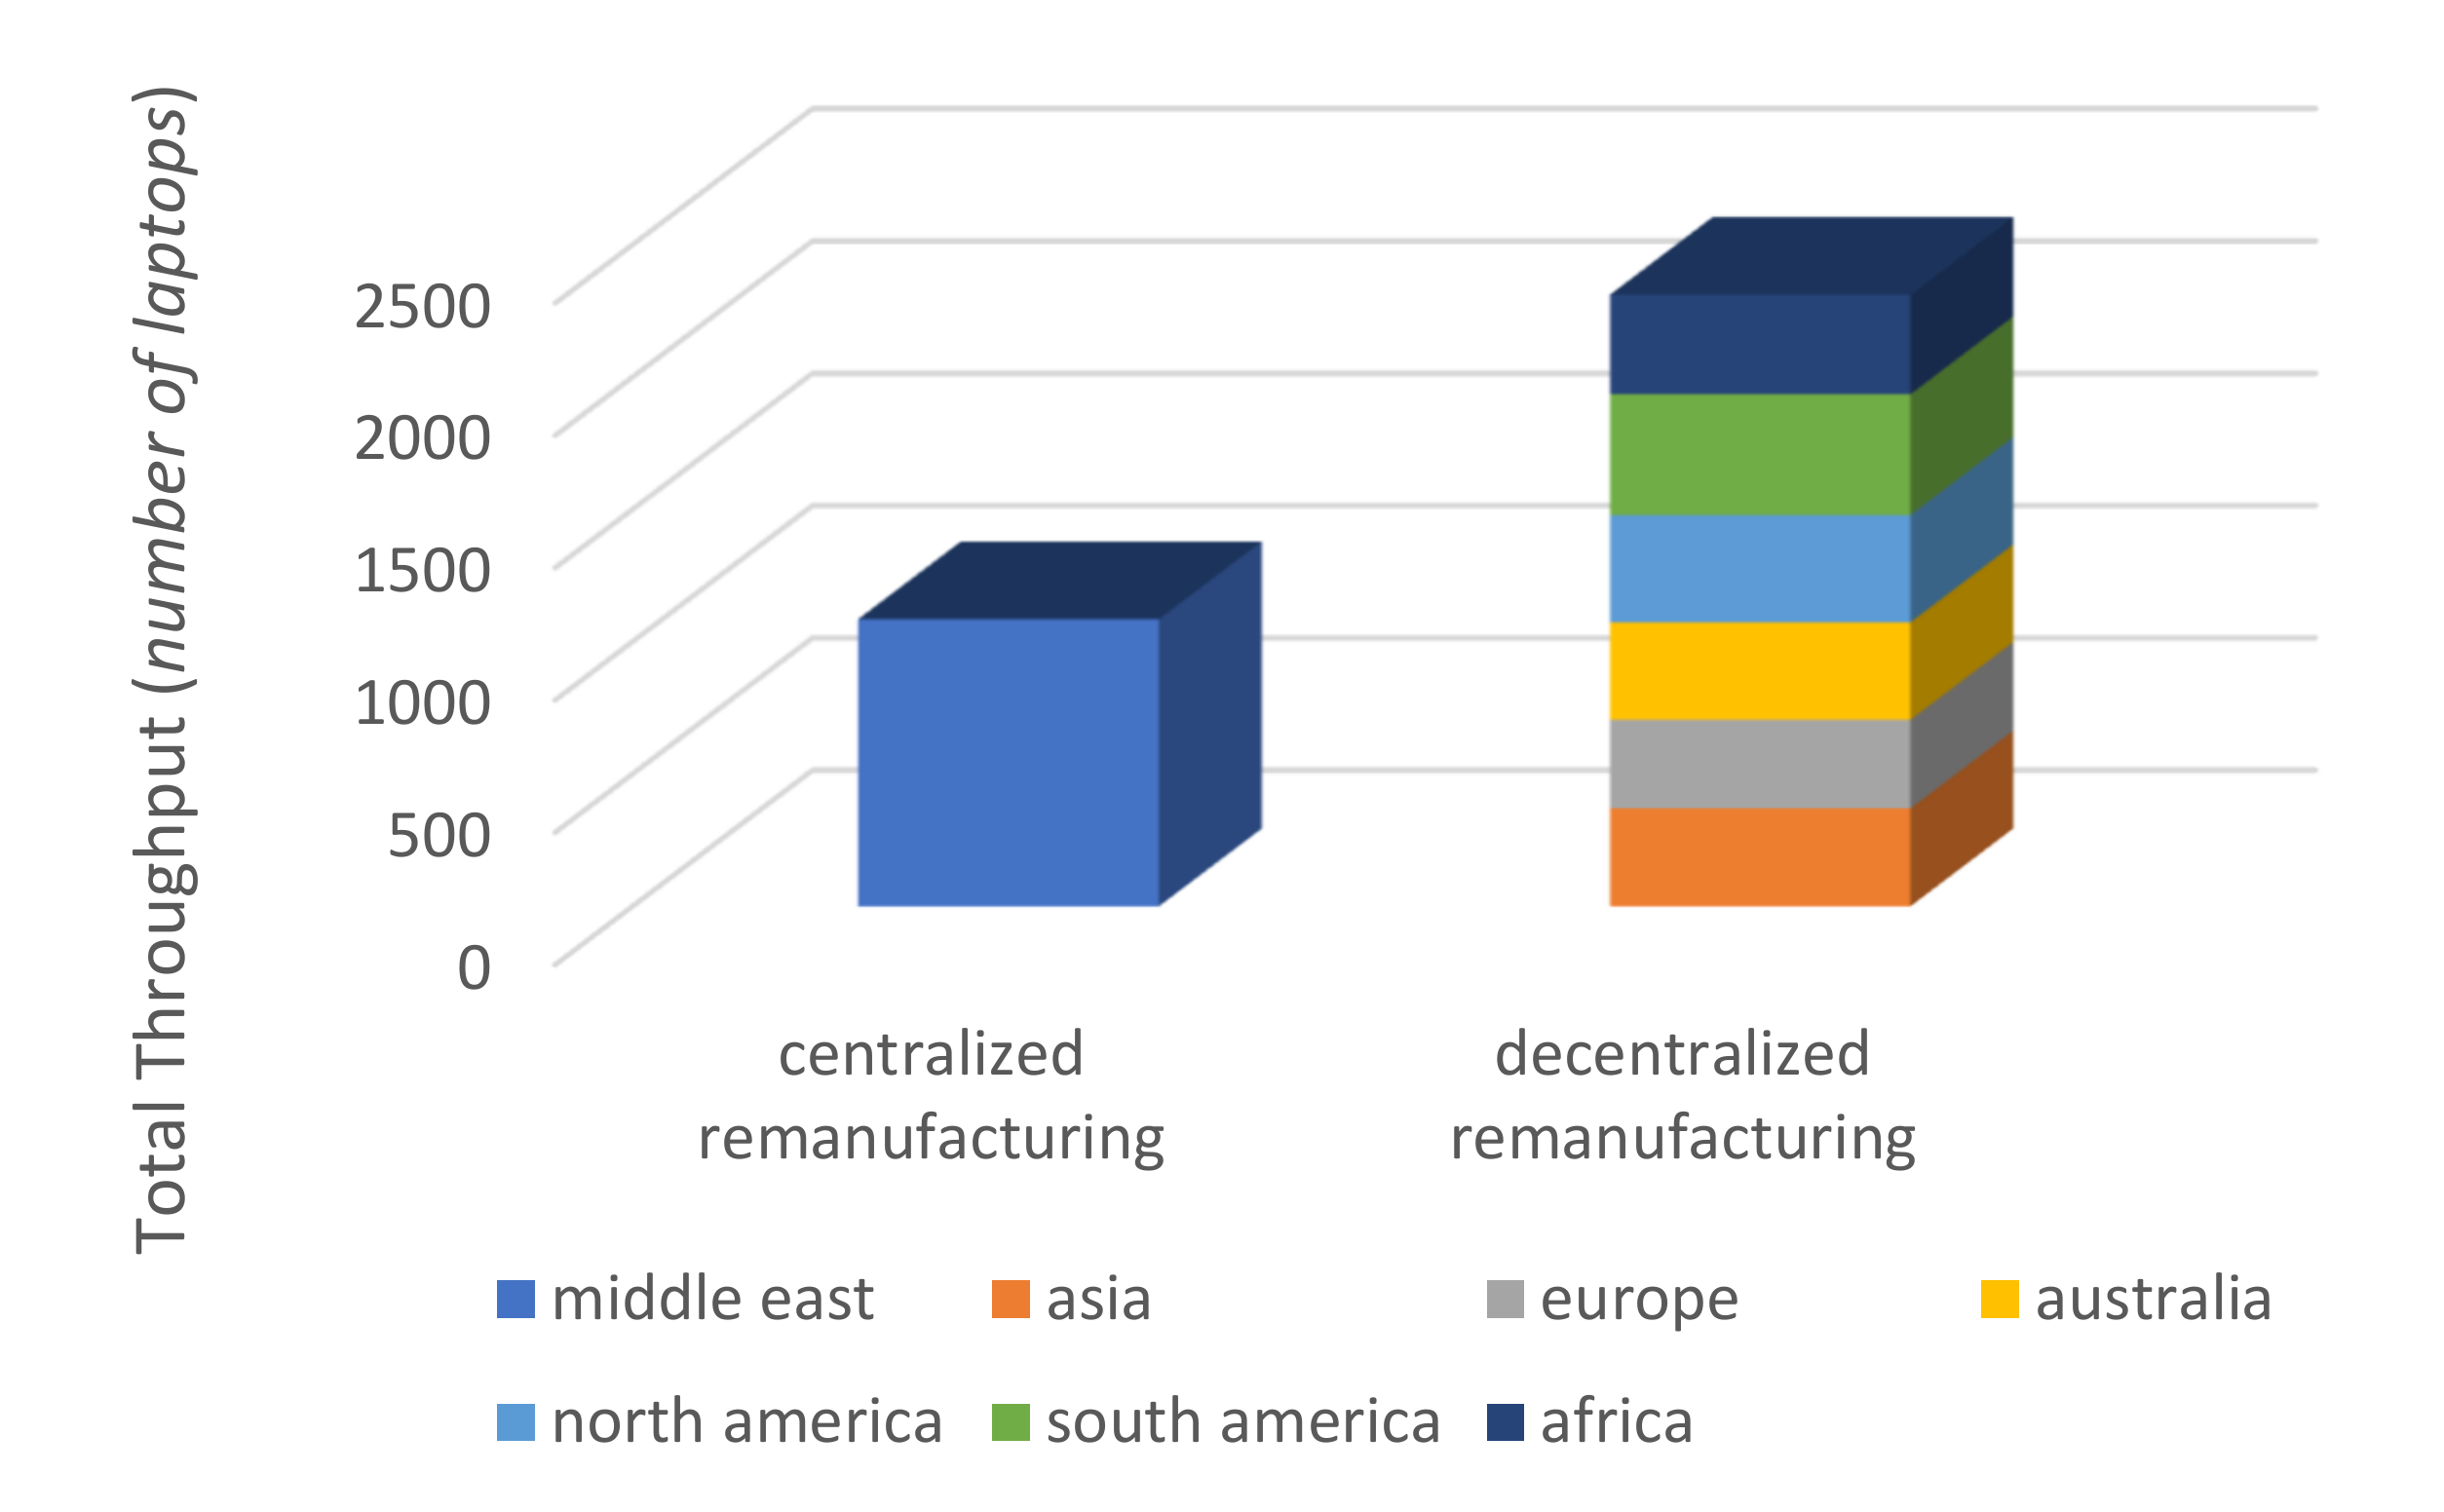
Apart from having a lower environmental impact than the centralized remanufacturing network, the decentralized remanufacturing network is more efficient. The decentralized remanufacturing network had a total throughput of 2311 remanufactured laptops from six remanufacturing plants, whereas the centralized remanufacturing network had a throughput of 1085 remanufactured laptops.
Figure 9 shows a bar graph depicting the total throughput of the two remanufacturing cases. A total lot size of 3000 laptops is dispatched over a month. The simulation is designed to mimic the real-life supply chain network, to precisely assess the total environmental impact; as a result, the laptops are assumed to be dispatched in two lots of 1500 laptops. In the centralized remanufacturing network, the two lots of laptops are sent to the remanufacturing plant located in the Middle East, whereas the decentralized remanufacturing network receives these laptops in all remanufacturing facilities located near the pickup locations. The Middle East remanufacturing plant has higher utilization than the utilization of each plant in the decentralized network. This implies that the decentralized network has much more room, which allows the organization to increase the total amount of discarded laptops that are received and increase the throughput of each of these plants.


 ,
, 


