Abstract
Industrial environments are heterogeneous systems that create challenges of interoperability limiting the development of systems capable of working collaboratively from the point of view of machines and software. Additionally, environmental issues related to manufacturing systems have emerged during the last decades, related to sustainability problems faced in the world. Thus, the proposed work aims to present an interoperable solution based on events to reduce the complexity of integration, while creating energetic profiles for the machines to allow the optimization of their energy consumption. A publish/subscribe-based architecture is proposed, where the instantiation is based on Apache Kafka. The proposed solution was implemented in two robotic cells in the automotive industry, constituted by different hardware, which allowed testing the integration of different components. The energy consumption data was then sent to a Postgres database where a graphical interface allowed the operator to monitor the performance of each cell regarding energy consumption. The results are promising due to the system’s ability to integrate tools from different vendors and different technologies. Furthermore, it allows the possibility to use these developments to deliver more sustainable systems using more advanced solutions, such as production scheduling, to reduce energy consumption.
1. Introduction
Conventional manufacturing systems can deliver high quantity products but are not able to adapt to market changes rapidly. Furthermore, they do not make special efforts to achieve an ecological balance, since there is a huge consumption of resources associated with global warming, environmental degradation and pollution [1].
Over the past few years, the application of concepts such as Cyber-Physical Production Systems (CPPS) [2,3], Internet of Things (IoT) [4], Artificial Intelligence (AI) [5,6] or Digital Twins (DT) [7,8] has led to the emergence of the creation of systems known as Industry 4.0 [9]. These systems aim to introduce more connected and intelligent environments capable of dealing with various contexts to optimize themselves concerning various indicators [10]. In order to efficiently present systems that fully implement the concepts of Industry 4.0, it relevant that vertical integration (in the factory space) and horizontal integration (between factories, suppliers and consumers) is a reality, and that the various systems, whether software or hardware, are interoperable and work collaboratively. This would improve competitiveness and growth and bring more novelty to the industry, while improving the development of system sustainability. Sustainability is one of the areas where Industry 4.0 approaches have been widely studied [11,12,13,14]. Sustainability is supported by three fundamental pillars. The economic pillar focuses on the need to develop systems that can generate profitable businesses over the long term. The social pillar aims to ensure that new systems positively impact society, such as improving working conditions. The environmental pillar focuses on the design of environmentally friendly manufacturing systems, for example, by reducing waste and consumption [1,14,15]. Industry 4.0 will be able to address several ecological and social restrictions associated with most common practices and technologies by using decision support tools and evaluation methods to implement and understand newer concepts and technologies associated with smart manufacturing. This will allow building of successful business models, achieving greater levels of efficiency and quality, and improving working conditions [1]. However, the adoption of the Industry 4.0 paradigm does not necessarily mean sustainable manufacturing, since the adoption of these technologies may have a negative impact on the environment as a result of air pollution, poor discharge of waste, and intensive use of raw materials and energy [13]. Thus, it is imperative to adopt methods to reduce the environmental footprint.
Energy consumption is undoubtedly a crucial topic in the development of these systems. The adoption of Industry 4.0 technologies may help to reduce energy and resource consumption by analyzing data during the production process and across the supply chain. However, disadvantages including lack of understanding, lack of standardization, high initial costs and legacy system changes. In addition, potential energy disadvantages have made the decision for adoption and evaluation difficult [1,16].
Some research activities in recent years have explored the application of emerging technologies to reduce energy consumption. In [17], the authors present a study of the application of simulation and learning to optimize the use of heating, ventilating, and air conditioning (HVAC) and machinery, so that their use maintains the necessary production indicators and reduces energy consumption. The results are quite promising, even though the scenarios have only been done offline, i.e., separately from the running system. Using learning techniques, an approach to reduce energy consumption in additive manufacturing is presented in [18]. This approach focuses essentially on optimizing the product’s design to reduce consumption during its production. Production scheduling is also one of the approaches found in the literature on energy consumption optimization. In [19], a Manufacturing Execution System (MES) design is presented that takes into account objectives related to sustainability. This approach can deal with production objectives together with sustainability-oriented indicators. Hence, performing the production scheduling ensures the production indicators are fulfilled, and optimizing indicators are related to sustainability, such as energy consumption. In [20], the scheduling is specifically focused on energy optimization. The proposed system considers pricing policy in the calculation of scheduling. It thus reduces not only consumption but also the costs associated with energy consumption.
Other studies explore concepts like energy flexibility for the same purpose, mainly for high energy-consuming processes. For example, the production of battery cells is a process that requires a large amount of energy. Thus, study [21] presents the possibility of applying energy flexibility to reduce energy consumption by assessing the energy consumption of existing processes and the need for power at each stage.
Some studies introduced servitization to share information among the different energy consumption-related data to combine the already presented concepts. For example, [22] shows a framework exploring the importance of having various sources of information to improve the energy consumption inside the factory. The framework explores the idea of having services related to energy consumption optimization. However, the use case presented focuses on demonstrating the benefits of predicting energy-demand and not how the integration among the different energy data sources is connected and interacts.
Cyberphysical systems (CPS) appear as candidates to develop all these types of systems. In the literature, it is possible to verify the association of these approaches with the design of CPS. In [23], is presented an architecture of an energy cyberphysical system focused on energy management in industries with high consumption, making these factories more intelligent.
The presented studies demonstrate interesting and promising benefits in reducing energy consumption. These studies also focus mainly on studying system data, developing systems capable of reducing consumption and generating new knowledge, whether through learning or simulation. However, the studies do not explore the interoperability of the approaches with the hardware on the shop floor, although it is crucial to extract data from the hardware and, if necessary, close the loop with the same hardware, otherwise this limitation often makes it impossible to implement these solutions, or their results are limited.
Thus, it is essential to explore approaches to interoperate all the hardware and software present in an ecosystem with this complexity, allowing the exchange of information and collaboration among them while remembering that these environments are highly heterogeneous, with hardware and software from different vendors, different communication protocols and technologies [24].
Hence, it becomes necessary to demonstrate how it is possible to make use of Industry 4.0 technologies and integrate them with real manufacturing systems in order to extract energy consumption data and provide it in real-time to workers and other resources that can make use of it to improve energy efficiency.
CPS may improve and enable this integration of heterogeneous components [25]. The possibility of having a logical representation of the physical components reduces the complexity of implementing these systems. The utilization of cyberspace has been widely demonstrated and tested. Although the good ability of cyber representations to deal with different components through hardware abstraction, the main difficulty is integrating the physical components with the logical representations [26], especially if the physical system already exists and is in operation. Several studies have presented the integration of the Internet of Things (IoT) [27] solutions, in which new sensors are integrated for data extraction. However, valuable information, both on the process and the execution of each component is only accessible by connecting to Programmable Logic Controllers (PLCs) or controllers responsible for controlling these components. Although the information taken from the sensors is relevant, it is necessary to find strategies and approaches to extract data from the existing hardware and make this information available in a harmonized way with these new sensors.
The proposed work aims to design an integrated approach for the industrial environment in which the integration is event-driven to reduce the complexity of the same and increase the reactivity of the system [28]. With this solution’s use, the authors believe that the adoption of these systems may increase because the effort required to integrate these solutions is greatly reduced. The proposed solution also aims at the interoperability between the various software tools. Thus, the proposed approach allows data sharing between the shop floor and high-level databases or tools, and interoperability among software tools to reduce energy consumption. Such tools include those for creating energy profiles using AI, or production optimizers that use these energy profiles and real data on the factory floor to optimize production, reducing consumption. In order to create the event-driven infrastructure, the utilization of a broker is proposed [29,30,31].
A broker is a system responsible for sending and receiving messages on a large scale. This intermediate system is responsible for mediating the exchange of messages, minimizing the need for applications that need to be aware of the receiver or sender. In addition, brokers can have many other functions and features, but as a rule, they ensure safe and orderly delivery of messages to the recipient and can also be responsible for ensuring sending rates, saving message logs, or even responding to errors or events [29]. Due to the nature of brokers, they usually operate based on the publish/subscribe type of architecture, in which the message producers create topics and in which they can be subscribed by the recipients who wish to receive messages from this topic. In this case, the broker can manage all topics by replicating messages to all recipients who wish to receive them.
It is possible to find several solutions based on brokers. The choice of the solution depends on several factors concerning the type of system desired for integration and the main features of the software. Some characteristics include the fact that they allow transmitting large volumes of data in a fast way, even when a large volume of entities communicate simultaneously, in addition to the fact that an easy integration of the broker in these entities is still essential.
Thus, according to [32,33] the following aspects can be identified as fundamental aspects in choosing the most suitable broker.
- Throughput: the maximum throughput that the broker can execute.
- Scalability: how the increase in publishers/subscribers affects the transmission rate and latency.
- Latency: time it takes for the entire process of exchanging a message.
- Integration: support for the integration of different systems and languages.
- Extras: this parameter considers the community, continuity of the development and support of potentially useful features, among others.
In this article is presented an overview of the infrastructure, with the description of the components, as well as the interaction among them, together with an implementation description using an Apache Kafka broker. Subsequently, one laboratory scenario is presented to demonstrate the integration of different data sources and receivers of this information. In a second demonstration scenario, data is extracted from two robotic cells from the automotive industry stored in a database. This data is posteriorly preprocessed and showed in a dashboard where the user can consult the energy consumption of the different cells. This data indicates the energy consumption of these cells as well as the consumption of some of their components, and different production tasks.
2. Materials and Methods
In this section, the concepts and specifications of the approach proposed in this work are presented. The first step of this work is the definition of the global view of the proposed architecture. This architecture is based on a publish/subscribe approach. Hence, and in order to understand how the entire architecture works, each of its key components is presented and described. These generic components which constitute the architecture are the broker, standard interfaces, and gateways. After the definition of each component, it is necessary to understand how these components interact and work together. Hence, a sequence diagram shows how interactions are made and how the data is sent from the sources to the applications that wish to receive it. With the architecture and its components defined, studying which broker best suits the desired implementation is necessary. The characteristics taken into account for choosing the broker and the chosen broker are also detailed throughout this section. In the end, a laboratory case study is presented that demonstrates the basic functionalities of the proposed approach, taking into account that the main focus of the proposed work is to collect data and deliver them between hardware and software with different characteristics. The case study is designed to simulate the communication between data sources and receivers implemented using various technologies, such as Python and Java.
2.1. System Architecture
The architecture presented in Figure 1 demonstrates how the different machines, devices (such as sensors and PLCs), databases, or even collaborative factories, can publish and receive data from the message broker system. The message broker now becomes the essential pillar of the data flow between devices and software tools. It is responsible for managing all the data flow, giving the shopfloor devices freedom to send the information when it is more convenient. Furthermore, the information is now available for high-level tools to utilize. It can be stored, displayed or processed, allowing it to return the processed results to the message broker-specific topic in which the shopfloor devices connected to the topic can alter their behavior or parameters. With this information, it is now possible to have optimized and real-time monitoring of the different processes on the shop floor.
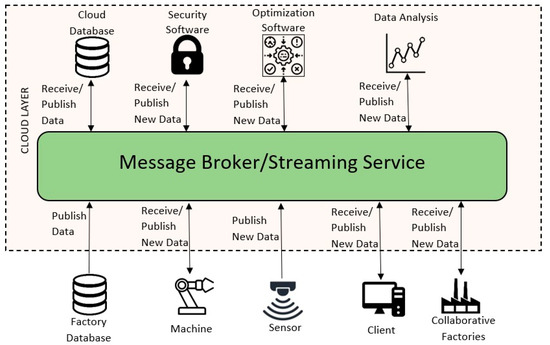
Figure 1.
System Architecture.
2.1.1. Publish/Subscribe
A publish/subscribe approach allows systems to announce events to multiple consumers by asynchronously broadcasting messages to different system components.
Each system component (machine or software) that generates and shares data is known as a publisher. These generated data are then published and sent to all the components that are subscribed to receive that type of data. A publisher translates changes in the system or actions into event messages using a generic message format. These messages are subsequently published into specific topics in the broker through a standard interface. On the other hand, the subscribers are the components interested in receiving and using data from one or more elements [34]. When subscribing to one or more topics, subscribers are automatically notified by the message broker about new data published on these topics, as exemplified in Figure 2.
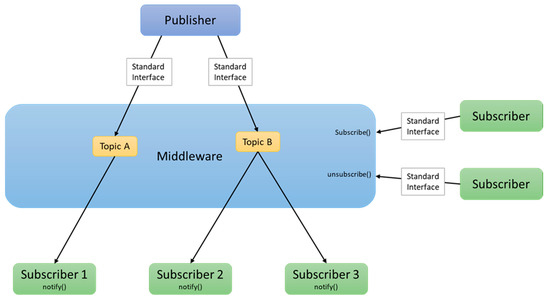
Figure 2.
Publish/Subscribe Model.
A publish/subscribe model is an effective way to decouple subsystems and manage communications independently. Thus, this model avoids blocking subsystems (e.g., by waiting for responses) and quickly returns to primary processing responsibilities, increasing the scalability and responsiveness of the overall system.
Moreover, this model offers improved reliability under increased loads, handles recurrent failures more effectively and provides a straightforward integration between systems using different platforms, programming languages, communication protocols, and between factory systems and cloud applications.
A few options to implement publish/subscribe model are Apache Kafka, RabbitMQ, or Message Queue Telemetry Transport (MQTT), depicted in Section 2.2. Different frameworks may have different advantages regarding scaling, reliability, latency, bandwidth, message handling and security, among others [35].
2.1.2. Standard Interfaces
One crucial challenge in smart manufacturing is dealing with the representation and whole exchange of data coming from different entities from different operating levels. The entire collaboration of hardware resources, such as working stations and robots, and software applications like Enterprise Resource Planning (ERP), databases, or MES applications, is a major goal in this context.
Following this line of thought, standard interfaces as the core drivers for pluggability and interoperability enables the interaction between hardware devices and software applications in a transparent manner. The standard interfaces should support devices, tools and applications to completely expose and describe their services in a standardized and transparent way to increase interoperability. These standard interfaces should provide a set of common functionalities, namely:
- the definition of the list of services to be implemented by the interface.
- the description of each service (name, input, and output parameters).
- the definition of the data model handled by the services.
Regarding the overall system, the standard interface abstracts its fundamental functions, making transparent how the different components interact and operate. Additionally, an essential requirement for developing standard interfaces is the use of service-orientation approaches to expose the corresponding devices and application functions as services.
However, to incorporate legacy devices and systems with their data models and specific requirements, it is necessary to translate legacy data into a uniform system representation. Hence, it may be necessary to add gateways as middlemen that translate the legacy data and allow those devices and systems to have additional intelligence and be integrated into the smart manufacturing paradigm.
2.1.3. Gateways
Manufacturing companies are characterized by using legacy components and systems to manage and execute their production processes. Examples of this can be robots, PLCs and Human Machine Interfaces (HMIs) at the factory level, or ERP, MES and databases at higher levels. Thus, when developing smart manufacturing systems, it is crucial to integrate them with legacy systems. Consequently, gateways are vital to connect those legacy systems to the smart system and then convert the legacy data model into the standard interface data model. Hence, the gateways are only needed when there is the necessity to connect a legacy module to the smart system.
2.2. Broker
For the proposed work, several brokers were analyzed and compared, taking into account the four main parameters (throughput, scalability, latency, and integration) important in comparisons of brokers for the use case. The brokers compared were Pulsar, NATS Streaming, RabbitMQ, Apache ActiveMQ and Apache Kafka. Apache Kafka, Pulsar and NATS Streaming have very similar throughputs in an environment with a low number of publishers and subscribers, but when the number of publishers and subscribers increases, or the size of the message increases, the Pulsar message broker cannot scale its output as well as Apache Kafka. Besides, Pulsar needs to use Apache Zookeeper and Apache Bookkeeper while Apache Kafka only needs to use the ladder [29,30,31,36]. Compared with NATS Streaming, this technology has a severe problem with latency, which originates from the fact that NATS Streaming always needs to connect to the server before any action [30,36]. Compared with the RabbitMQ message broker, RabbitMQ has very low latency for low throughputs, but when more information is sent and the number of publisher/subscribers grow, the latency and the throughput cannot keep up, making this broker useful for localized and small applications but not suitable on a bigger scale [30,36]. Apache ActiveMQ is similar to RabbitMQ, having the same strong points and defects.
For this use case, Apache Kafka was used as the broker. Apache Kafka is an open-source software with a growing community. It has several libraries that support almost all programming languages for communication between the receiver/producer and Apache Kafka. It is a technology with a high-speed transmission rate. This speed is mainly due to Apache Kafka not needing to receive an acknowledgement from the receiver, and using a pull technology with the receiver asking for the next message or set of messages. Apache Kafka allows a large number of publishers/subscribers without a significant loss in transmission rate or latency regarding scalability. An example of this capacity is that Netflix uses Apache Kafka to support around five hundred billion events and totaling about 1.3 petabytes of information per day [37]. Apache Kafka has other advantageous features, such as the persistence of messages kept in a log for a predetermined time by the administrator. Apache Kafka also supports message ordering, having a key that allows messages to be delivered to the client in the same order as received at the broker. The message delivery protocols used by Apache Kafka are (1) at most one delivery, (2) exactly one delivery and (3) at least one delivery (i.e., At most once, Exactly once, At least once delivery) [30,36]. Finally, Apache Kafka also has a Confluent platform that allows the user to interpret and configure all broker parameters easily. This platform is like a layer that involves all the processes necessary to run Apache Kafka, easing its interaction with the outside world.
Apache Kafka allows each subscriber to receive the data of the topics to which they are subscribed. This reception of data can be done through connectors provided by Apache Kafka or through services called whenever new data is received in the topic. In Figure 3 is presented the possible interactions among publishers, Apache Kafka and subscribers.
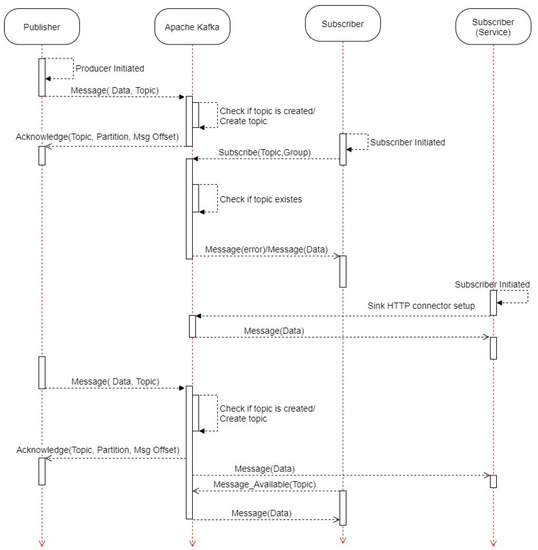
Figure 3.
Sequence Diagram.
To test these functionalities before integration in an industrial environment, a demonstration with different technologies (Java and Python) for publishers and subscribers was implemented. In addition, the subscribers were also tested in the laboratory using both approaches, with connectors and services.
2.3. Laboratorial Demonstration
In this demonstration is presented a simple publisher/subscribe, with three sensors generating data, each one in a specific topic named “Sensor”, “SensorB” and “SensorC”. Then two consumers choose which topics they can subscribe to to read the data sent by the sensors (Figure 4). Finally, as presented in Figure 5, a simple HTTP connector is used. With the help of an API, it is possible to use Kafka as a service and to easily check the data of “SensorA” (for which the connector was specified).
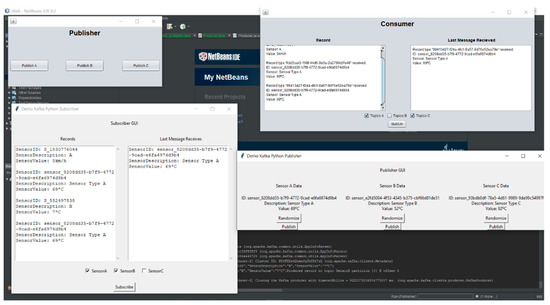
Figure 4.
Demonstration using Java and Python Publishers and Subscribers.
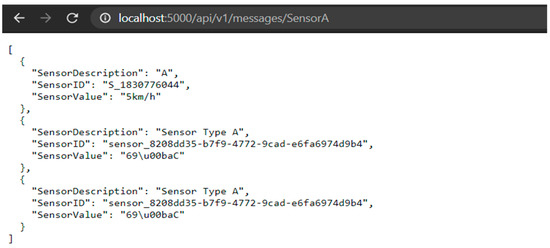
Figure 5.
Call of an HTTP connector.
In Figure 4 shows the use of two different software platforms: a publisher and a consumer developed in Java, and a publisher and consumer developed in Python. The consumers are both connected to the topic “SensorA”, and it is possible to see the same data in both consumers. Only one consumer is subscribed to the topic “SensorB” and the other consumer to “SensorC”. The specific information of the topics is only presented to the consumer subscribed to the topic.
After making a connector to the topic “SensorA” it is possible to use this topic’s information as a service. The connectors can also be used the other way around to send information, for example, via “POST” to the topics, or to use different plugins to connect them to databases or other applications that can benefit from real-time streaming information provided by the topics.
3. Results
For demonstration and testing purposes, the following experiment was created. This scenario aimed to validate the integration of two robotic cells from the automotive industry with the higher manufacturing levels. Each cell was composed of different hardware components (robots, grippers, PLCs, etc.), from different manufacturers. These cells were integrated in order to send data related to the energy consumption of the execution of the cells during the execution of different tasks. This approach made these same data available to a Postgrés database that was subsequently provided to an HMI that allowed the user to consult the cell’s various component’s energy consumption data.
3.1. Robotic Cells Scenario Demonstration
The demonstration scenario was based on the current robotic assembly cells used in Introsys SA installations, in Quinta do Anjo, Portugal, for testing and training (Figure 6). These cells represent the reality of actual production lines regarding equipment, safety, and control standards used and approved by the automotive industry. Each one implements a spot-welding process and comprises a 6-DoF robotic arm with a custom gripper attached, a fixture into which the operator inserts and removes the product before and after the process, and a stationary welding gun. Both the fixture and the gripper include several sensors to detect the presence of the product and pneumatic clamps to grasp the product in place.
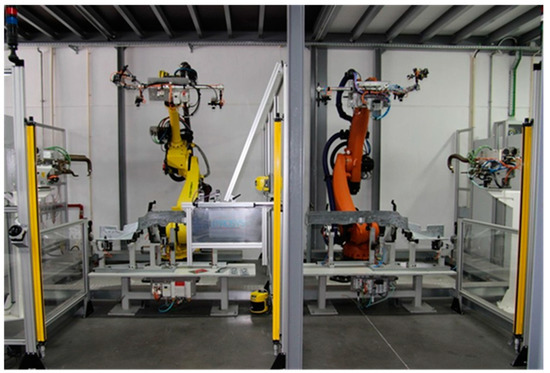
Figure 6.
Introsys Welding Industrial Robotic Cells.
The workstations were designed to automatically manipulate and simulate spot welding on a side member of a car part, and both of them can perform the exact same process. The difference between them consists of compliance with two different car manufacturer standards that rule the adoption of equipment suppliers, control systems, safety approaches, and programming methods and tools. Bearing this in mind, the use case provides ideal conditions to show the interoperability of the system when deployed in actual execution processes from different end-users. Having multiple welding programs available, these cells can handle multiple product variants (types).
The process may be described as follows: (i) the operator deploys the car part on the fixture; (ii) the robot moves the part from the fixture to a stationary welding gun; (iii) the part is moved to a vision-based quality inspection system; (iv) the part is moved back to the fixture. When simulating spot welding, several different welding spots need to be set; therefore, the robot needs to reposition the product in relation to the welding gun for each spot. The objective of the vision-based quality inspection system is to guarantee the presence and correct positioning of each welding spot, according to the production specifications, i.e., the current welding program.
These robotic cells are abstracted by an integration layer implemented at local premises and coded in Java. At the device level, this integration layer implements an OPC-UA-based communication protocol to exchange data with the automation equipment.
3.2. Implementation
For the specific implementation of the architecture in Figure 1, two robotic cells were connected to the chosen message broker, in this case, Apache Kafka. These robotic cells were connected through two different methods. One of them was connected using a Java program responsible for collecting the data from a data bus (Figure 7–left machine). The other robotic cell was connected by an API and connector (Figure 7–right machine). By implementing these two links, it was possible for the different robotic cells to run simultaneously and to send the energy-relevant data to Apache Kafka. Subsequently, Apache Kafka sends the data to the software that is subscribed to this data. In this implementation, the cells were constantly operating and generating data. The platform could collect all this data from the two sources. The Apache Kafka utilized a sink connector JDBC (Java Database Connectivity) to stream the information directly to a Postgres database. Grafana was then connected to the Postgres database allowing display of the data in an easy-to-read HMI.
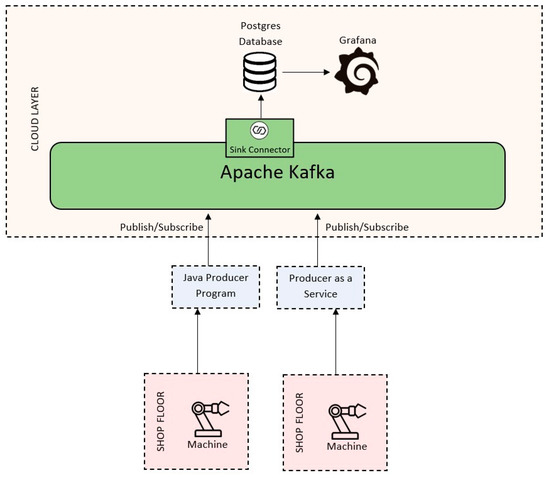
Figure 7.
Implementation Overview.
Under the scope of this work, it was necessary to configure and instantiate the broker (Apache Kafka) and the Sink Connector. Then, the two producers (the two software platforms responsible for writing the data generated by the cells into the Apache Kafka), were implemented with the Postgres database and the HMI using Grafana.
3.2.1. Publisher
To publish the data received from the robotic cells to a specific topic, a Java producer program was created. This program utilizes the Apache Kafka Java library to first connect to the Kafka broker and then publish the information in the existing topic or create one in case the topic does not exist.
To connect the program to the Kafka broker, it is necessary to give the IP address where the Kafka is running (or localhost:port in case running locally) and configure several other parameters as the “max send retry”, i.e., the waiting time between each retry or any other parameter that the default value may not suit the implementation.
To create the topic, the name, partitions, replication and IP address of the Kafka broker are needed. The topic is not created if it utilizes the same name as an already existing one.
After all the previously described processes are created, the information sent to the topic can range from several different formats. For the specific implementation shown in Figure 7, a JSON format is utilized allowing passage of different parameters that can be easily stored, or the data read by several programs.
3.2.2. Data Model
Figure 8 shows the data model used in the implementation of the system, representing the four tables and the respective columns and data types, that are created in the Postgres database. This data model contains a series of data produced by the shopfloor level relevant for the systems on the higher level. In this demonstration only a human-machine interface is shown, but data can be processed by different programs as referred to previously.
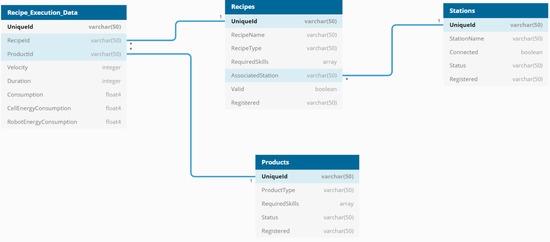
Figure 8.
Data Model.
The data model allows visualization of the information about the consumption of each robotic cell, being the primary objective of the demonstration, and it is possible to see which recipe and product were responsible for the consumption. The recipe is then attributed to a unique station with all the information of the robotic cell.
3.2.3. Connectors
One of the big advantages of Apache Kafka is the Kafka streaming services and the utilization of connectors. These connectors can be quickly set up to move large data sets in and out of Kafka, removing the necessity for an intermediate program and keeping the flow of data with low latency. These connectors can be configured in several different ways to change the data in case some specific case occurs, or to rename entire data sets that flow through the connector. The Apache organization, and the community that supports it, work together to provide an ever-growing range of connectors optimizing the integration and different approaches of how connectors can be used.
In the implementation of the demonstration, a JDBC (Java Database Connectivity) sink connector is used to connect the topics where the data is written to the database, allowing the automatic creation of the tables in the Postgres database and population with the respective topic data.
3.2.4. Kafka Instantiation
The instantiation of Kafka can be made in several different ways. In this demonstration, it was used as a container in a Docker software. Using a YAML file it was possible to setup all the components necessary to run Kafka and the correspondent streaming services. For this demonstration, it was used a YAML also with the initialization of the Postgres database and the Grafana.
After the initialization of Kafka, it was necessary to setup the streams and connectors in the ksqlDB streaming application of Apache Kafka, these streams transform the reception of the data in the topic in JSON format to an Avro format so that the JDBC (Java Database Connector) can then read the stream information and automatically write SQL commands in the Postgres database. These streams need to be specified for the type and format of data they receive and any modification or alteration that the stream is supposed to do in the data.
After all these processes were completed, it was possible to use the confluent platform to see the final flow of data that passed through all the different streams. It was possible to see the first stream that received the raw data (ProductStream, StationStream, RecipesStream, and REDStream). These data were then converted in the Avro format in the second streams represented (ProductsData, StationData, RecipesData, and REDData) (Figure 9). After being converted, the information was sent to the previously created sink connector.
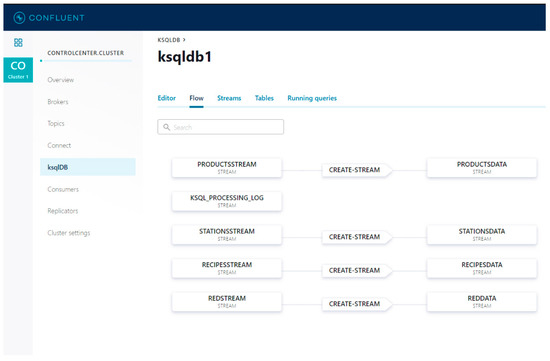
Figure 9.
Overview of all created streams and their connections.
3.2.5. Confluent
Another advantage of Apache Kafka is the Confluent User Interface that can be initialized with Kafka message broker. This tool allows easy and intuitive control of several parameters besides having statistical data and graphs that can help understand which topics are being used the most, the flow of data, and the health of the infrastructure (Figure 1).
In this user interface, it is also possible to create and check the existent topic, allowing complete control of the individual topics by checking the publish/subscribers of each one and the volume and flow of data (Figure 10). It is also possible to see the broker’s overall status, or several brokers in the cases that need such an approach.
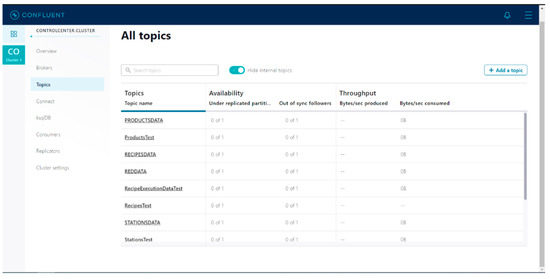
Figure 10.
Topics View.
Another important point to mention regarding confluent is the possibility to see all the connectors (plug-in specific connections made in Kafka). The ability to track is offered by the KsqlDB, an event streaming database developed to create stream processing applications on top of Apache Kafka (Figure 11).
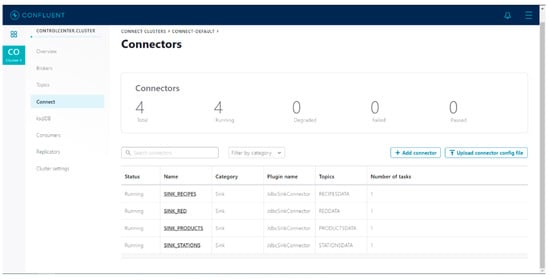
Figure 11.
Connectors View.
The last confluent functionality worth mentioning is the overview of all the consumers and connectors shown in the consumer’s tab. This tab gives valuable information regarding the existence and consumption of messages for each consumer, besides useful graphs to easily track the data flow.
3.3. Data Visualisation
As mentioned previously the connectors are an important part of the flow of the data, mainly to the database. Figure 11 shows the different JDBC (Java Database Connectivity) sink connectors created, one for each table in the Postgres database. These connectors automatically populate the database as soon as new information arrives to the topic (Figure 12). It is important to note that several databases can be used with this specific connector, such as MySql or Oracle, or a different connector for other types of databases like MongoDB, and others for different types of applications. Finally, Grafana is used as an analytic and interactive web application connected to Postgres, allowing easy analysis of the database’s content.

Figure 12.
Database structure and sample of stored data.
A Grafana-based user interface was developed and integrated in order to easily check the data stored. Using SQL type queries Grafana allows different graphs and shows the information organized via thresholds and color schemes. This form of data demonstration facilitates reading and comprehension of the data.
Figure 13 shows part of the interface coded in Grafana. The consumption of the entire cell is shown in yellow, while in green, it is possible to check the evolution of the consumption of the robot that operates in that cell over time. Hence, it is possible to identify the evolution of consumption during operations. It is also possible to assess the relationship between the robot and the consumption of the cell. As previously described, this presentation was made for the two cells regardless of whether they use different hardware and different programming standards.

Figure 13.
Energy Consumption Evolution in one Robotic Cell.
A graphical interface was also made as presented in Figure 14. This screen shows the average energy consumption of each robotic cell as a whole, as well as the consumption of each task. Hence the operator can analyze which tasks are more efficient in each cell and which robotic cell is more efficient.
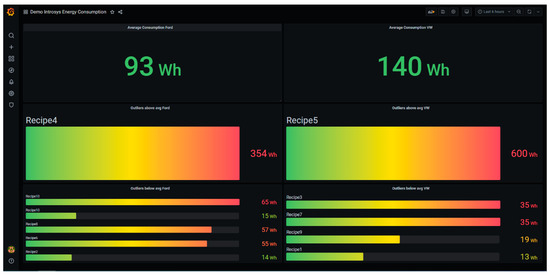
Figure 14.
Energy Consumption Human Machine Interface.
4. Discussion
It is necessary to effectively apply the concepts of Industry 4.0 in industrial systems since they can take advantage of numerous benefits, not only economic growth but also environmental and social improvement. Nevertheless, the implementation of the Industry 4.0 concept by itself may compromise the environment due to the intensive use of raw materials and energy consumption. Although the developments occurring in recent years offer exciting and important advantages, and gains for the vast majority of the companies, the potential for improvement and optimization of the system as a whole is far beyond these approaches and is limited to one or a few targets, mainly because these approaches tend to work independently and offline, which may not reflect the current status of the production line. As seen before, some studies oriented to energy consumption optimization at different levels can be found in the literature. Some studies explore the importance of having different sources of information to improve energy consumption within the factory. However, it is fundamental to explore the interoperability of software tools with the hardware located on the shop-floor. Based on literature reviews, there is still much work to be done in this area [24].
Consequently, it is necessary to explore the challenges inherent with the integration of these solutions with existing systems, as well as new software and hardware, making them interoperable. It is necessary to create a system capable of functioning as a whole and not with separate solutions that solve specific problems and brings benefits that only focus on one part of the system, such as energy consumption optimization, quality control or production optimization.
This study aims to integrate different factors to work in a harmonized way, and as a single system, through the sharing of data and knowledge related to energy consumption. This will allow different important factors, such as simulation or scheduling, to make use of these data in real-time and improve the energy consumption process that can afterwards be used by Lifecycle Assessment, ERP or MES tools. The proposed approach aims not to depend on the technology used for the implementation of each software platform. In this way, easier, faster, and effective integration is possible. A broker-based approach is presented where Apache Kafka is used as a solution for implementation. In the first phase, tests were carried out in the laboratory. It was demonstrated that it is possible to smoothly integrate different software tools using different technologies, in this case, Java and Python. In the second testing and demonstration environment, the solution was implemented in a real environment where two cells from the automotive industry sent data regarding execution and energy consumption to the respective topics of Apache Kafka, which immediately made this data available to a database. Then, a graphical interface showed this data at an interface where the operator can check and evaluate the performance of each cell in real-time.
The authors believe that these two tests demonstrate the potential for using these approaches in industrial environments, and that the approach is promising for future work in energy efficiency.
In future work, it is possible to verify the availability of data for each machine and station so that the system may be optimized to reduce energy consumption and increase sustainability. Solutions such as creating machines energy profiles using AI, software for production optimization, or even developing new Life-Cycle Assessment approaches are facilitated with the proposed approach. Besides the development of each solution, it is important to note that with the proposed approach, different solutions can share their generated knowledge with other tools to be more comprehensive and efficient.
Besides integration with more software tools, it is important to explore different industries with different hardware, software, and requirements to evaluate applicability in more scenarios.
Another relevant aspect that must be addressed in future activities relates to the utilization of existing data models to demonstrate that the proposed approach is not data model-dependent. However, all the software tools must be able to manage data shared and sent by the data providers. Hence, it is necessary to understand and explore approaches and solutions to overcome this issue, or to mitigate it.
5. Conclusions
The concepts of smart manufacturing will play a core role in the industrial systems of the future. One of the major challenges is to integrate hardware tools and software applications from different vendors for systems to operate efficiently over time, while different factors interoperate smoothly. At the same time, the growing concern about environmental challenges has led to greater efforts from communities to improve energy efficiency.
Thus, it becomes necessary to explore the challenges related to the integration of existing systems with software tools that can make use of energy consumption data extraction. It is crucial that data are made available in near to real-time, to have an online perspective of what is happening within the factory. Despite some studies done in this area, as described in the Introduction section, most focus on systems capable of reducing energy consumption and generating new knowledge through learning or simulation but lack exploring the interoperability of their approaches with the hardware on the shop-floor. However, it is necessary not only to analyze the data extracted from the hardware but also to extract these data. If not, this limitation makes it almost impossible to implement these solutions in real environments.
Hence, this work proposes an approach to sharing data between the shop floor and higher-level applications with the main goal of providing energy consumption information. This will allow creation of energy profiles of working cells and reduce and optimize energy consumption. The proposed approach does not rely on the technology used for implementation, and thus a more effective integration is possible.
For this implementation, a publish/subscribe model was adopted, which allows the development of an event-driven infrastructure able to announce events to multiple subscribers simultaneously. The implementation of a broker allows sending and receiving messages on a large scale, which is a vital process in industrial environments. In this work was used the Apache Kafka broker that is capable of handling large amounts of data, removing the necessity of an intermediate program and keeping maintaining data flow with low latency.
Furthermore, a laboratory scenario was presented to demonstrate the integration of different data sources and receivers, and a real scenario was described in which two robotic cells were used to extract energy consumption data from the automotive industry and store it in a Postgres database to be visualized in Grafana. It was possible to access the robotic cell data and also the data from its individual components.
Author Contributions
Conceptualization, A.D.R., D.A. and J.B.; methodology, A.D.R.; D.A., M.G. and J.B., software, N.F., D.A. and R.M.; validation, N.F., D.A. and R.M.; formal analysis, A.D.R., D.A., M.G. and J.B., investigation, A.D.R., N.F., D.A. and M.G., writing—original draft preparation, A.D.R., N.F., D.A. and R.M., writing—review and editing, A.D.R., D.A., M.G. and J.B., project administration, A.D.R. and J.B.; funding acquisition, A.D.R. and J.B. All authors have read and agreed to the published version of the manuscript.
Funding
This work was partially supported by the EU Project AVANGARD. This project received funding from the European Union’s Horizon 2020 research and innovation program under grant agreement No 869986.

Institutional Review Board Statement
Not applicable.
Informed Consent Statement
Not applicable.
Data Availability Statement
The data presented in this study are available on request from the corresponding author. The data are not publicly available due to privacy.
Conflicts of Interest
The authors declare no conflict of interest. The funders had no role in the design of the study, in the collection, analysis or interpretation of data, in the writing of the manuscript or in the decision to publish the results.
References
- Bai, C.; Dallasega, P.; Orzes, G.; Sarkis, J. Industry 4.0 technologies assessment: A sustainability perspective. Int. J. Prod. Econ. 2020, 229, 107776. [Google Scholar] [CrossRef]
- Ribeiro, L. Cyber-physical production systems’ design challenges. In Proceedings of the 2017 IEEE 26th International Symposium on Industrial Electronics (ISIE), Edinburgh, UK, 19–21 June 2017; pp. 1189–1194. [Google Scholar] [CrossRef]
- Monostori, L. Cyber-physical production systems: Roots, expectations and R&D challenges. Procedia CIRP 2014, 17, 9–13. [Google Scholar] [CrossRef]
- Liu, X.; Qian, C.; Hatcher, W.G.; Xu, H.; Liao, W.; Yu, W. Secure internet of things (IoT)-based smart-world critical infrastructures: Survey, case study and research opportunities. IEEE Access 2019, 7, 79523–79544. [Google Scholar] [CrossRef]
- Rocha, A.D.; Lima-Monteiro, P.; Parreira-Rocha, M.; Barata, J. Artificial immune systems based multi-agent architecture to perform distributed diagnosis. J. Intell. Manuf. 2019, 30, 2025–2037. [Google Scholar] [CrossRef]
- Li, B.; Chai, X.; Hou, B.; Zhang, L.; Zhou, J.; Liu, Y. New generation artificial intelligence-driven intelligent manufacturing (NGAIIM). In Proceedings of the 2018 IEEE SmartWorld, Ubiquitous Intelligence Computing, Advanced Trusted Computing, Scalable Computing Communications, Cloud Big Data Computing, Internet of People and Smart City Innovation (SmartWorld/SCALCOM/UIC/ATC/CBDCom/IOP/SCI), Guangzhou, China, 8–12 October 2018; pp. 1864–1869. [Google Scholar] [CrossRef]
- Zhuang, C.; Liu, J.; Xiong, H. Digital twin-based smart production management and control framework for the complex product assembly shop-floor. Int. J. Adv. Manuf. Technol. 2018, 96, 1149–1163. [Google Scholar] [CrossRef]
- Rolo, G.R.; Rocha, A.D.; Tripa, J.; Barata, J. Application of a simulation-based digital twin for predicting distributed manufacturing control system performance. Appl. Sci. 2021, 11, 2202. [Google Scholar] [CrossRef]
- Gilchrist, A. Introducing industry 4.0. In Industry 4.0; Apress: New York, NY, USA, 2016; pp. 195–215. [Google Scholar] [CrossRef]
- Alemão, D.; Rocha, A.D.; Barata, J. Smart manufacturing scheduling approaches—Systematic review and future directions. Appl. Sci. 2021, 11, 2186. [Google Scholar] [CrossRef]
- Machado, C.G.; Winroth, M.P.; da Silva, E.H.D.R. Sustainable manufacturing in industry 4.0: An emerging research agenda. Int. J. Prod. Res. 2020, 5, 1462–1484. [Google Scholar] [CrossRef]
- Stock, T.; Seliger, G. Opportunities of sustainable manufacturing in industry 4.0. Procedia CIRP 2016, 40, 536–541. [Google Scholar] [CrossRef]
- Oláh, J.; Aburumman, N.; Popp, J.; Khan, M.A.; Haddad, H.; Kitukutha, N. Impact of industry 4.0 on environmental sustainability. Sustainability 2020, 12, 4674. [Google Scholar] [CrossRef]
- Chen, X.; Despeisse, M.; Johansson, B. Environmental sustainability of digitalization in manufacturing: A review. Sustainability 2020, 12, 298. [Google Scholar] [CrossRef]
- Koren, Y.; Gu, X.; Badurdeen, F.; Jawahir, I.S. Sustainable living factories for next generation manufacturing. Procedia Manuf. 2018, 21, 26–36. [Google Scholar] [CrossRef]
- Müller, J.M.; Buliga, O.; Voigt, K.-I. Fortune favors the prepared: How SMEs approach business model innovations in industry 4.0. Technol. Forecast. Soc. Chang. 2018, 132, 2–17. [Google Scholar] [CrossRef]
- Mawson, V.J.; Hughes, B.R. Optimisation of HVAC control and manufacturing schedules for the reduction of peak energy demand in the manufacturing sector. Energy 2021, 227, 120436. [Google Scholar] [CrossRef]
- Qin, J.; Liu, Y.; Grosvenor, R.; Lacan, F.; Jiang, Z. Deep learning-driven particle swarm optimisation for additive manufacturing energy optimization. J. Clean. Prod. 2020, 245, 118702. [Google Scholar] [CrossRef]
- Larreina, J.; Gontarz, A.; Giannoulis, C.; Nguyen, V.K.; Stavropoulos, P.; Sinceri, B. Smart manufacturing execution system (SMES): The possibilities of evaluating the sustainability of a production process. In Proceedings of the 11th Global Conference on Sustainable Manufacturing, GCSM 2013: Innovative Solutions, Berlin, Germany, 23–25 September 2013; pp. 517–522. [Google Scholar] [CrossRef]
- Golpîra, H. Smart energy-aware manufacturing plant scheduling under uncertainty: A risk-based multi-objective robust optimization approach. Energy 2020, 209, 118385. [Google Scholar] [CrossRef]
- Grimm, J.; Köse, E.; Weeber, M.; Sauer, A.; Birke, K.P. Energy flexibility in battery cell manufacturing. Procedia CIRP 2021, 99, 531–536. [Google Scholar] [CrossRef]
- Mourtzis, D.; Boli, N.; Alexopoulos, K.; Różycki, D. A framework of energy services: From traditional contracts to product-service system (PSS). Procedia CIRP 2018, 69, 746–751. [Google Scholar] [CrossRef]
- Ma, S.; Zhang, Y.; Lv, J.; Yang, H.; Wu, J. Energy-cyber-physical system enabled management for energy-intensive manufacturing industries. J. Clean. Prod. 2019, 226, 892–903. [Google Scholar] [CrossRef]
- Zeid, A.; Sundaram, S.; Moghaddam, M.; Kamarthi, S.; Marion, T. Interoperability in smart manufacturing: Research challenges. Machines 2019, 7, 21. [Google Scholar] [CrossRef]
- Monostori, L.; Kádár, B.; Bauernhansl, T.; Kondoh, S.; Kumara, S.; Reinhart, G.; Sauer, O.; Schuh, G.; Sihn, W.; Ueda, K. Cyber-physical systems in manufacturing. CIRP Ann. Manuf. Technol. 2016, 65, 621–641. [Google Scholar] [CrossRef]
- Hehenberger, P.; Vogel-Heuser, B.; Bradley, D.; Eynard, B.; Tomiyama, T.; Achiche, S. Design, modelling, simulation and integration of cyber physical systems: Methods and applications. Comput. Ind. 2016, 82, 273–289. [Google Scholar] [CrossRef]
- Botta, A.; de Donato, W.; Persico, V.; Pescapé, A. Integration of cloud computing and internet of things: A survey. Future Gener. Comput. Syst. 2016, 56, 684–700. [Google Scholar] [CrossRef]
- Qaisar, S.M.; Alsharif, F.; Subasi, A.; Bensenouci, A. Appliance identification based on smart meter data and event-driven processing in the 5G framework. Procedia Comput. Sci. 2021, 182, 103–108. [Google Scholar] [CrossRef]
- Stoja, S.; Vukmirovic, S.; Jelacic, B. Publisher/Subscriber implementation in cloud environment. In Proceedings of the 2013 Eighth International Conference on P2P, Parallel, Grid, Cloud and Internet Computing, Compiegne, France, 28–30 October 2013; pp. 677–682. [Google Scholar] [CrossRef]
- Sharvari, T.; Sowmya Nag, K. A study on Modern Messaging Systems-Kafka, RabbitMQ and NATS Streaming. Available online: http://arxiv.org/abs/1912.03715 (accessed on 13 May 2021).
- Renart, E.; Balouek-Thomert, D.; Parashar, M. Pulsar: Enabling dynamic data-driven IoT applications. In Proceedings of the 2017 IEEE 2nd International Workshops on Foundations and Applications of Self* Systems (FAS*W), Tucson, AZ, USA, 18–22 September 2017; pp. 357–359. [Google Scholar] [CrossRef]
- Rüßmann, M.; Lorenz, M.; Gerbert, P.; Waldner, M.; Justus, J.; Engel, P.; Harnisch, M. Industry 4.0: The Future of Productivity and Growth in Manufacturing Industries. Boston Consult. Group. 2015. Available online: https://www.bcg.com/publications/2015/engineered_products_project_business_industry_4_future_productivity_growth_manufacturing_industries (accessed on 13 May 2021).
- Liu, C.; Jiang, P. A cyber-physical system architecture in shop floor for intelligent manufacturing. Procedia CIRP 2016, 56, 372–377. [Google Scholar] [CrossRef]
- Lv, P.; Wang, L.; Zhu, H.; Deng, W.; Gu, L. An IOT-oriented privacy-preserving publish/subscribe model over blockchains. IEEE Access 2019, 7, 41309–41314. [Google Scholar] [CrossRef]
- Dobbelaere, P.; Esmaili, K.S. Kafka versus RabbitMQ. In Proceedings of the 11th ACM International Conference on Distributed and Event-based Systems, New York, NY, USA, 8 June 2017; pp. 227–238. [Google Scholar] [CrossRef]
- Benchmarking Kafka vs. Pulsar vs. RabbitMQ: Which Is Fastest? Available online: https://www.confluent.io/blog/kafka-fastest-messaging-system/ (accessed on 13 May 2021).
- Posta, C. What is Apache Kafka? Why Is It so Popular? Should I Use It? Available online: https://techbeacon.com/app-dev-testing/what-apache-kafka-why-it-so-popular-should-you-use-it (accessed on 13 May 2021).
Publisher’s Note: MDPI stays neutral with regard to jurisdictional claims in published maps and institutional affiliations. |
© 2021 by the authors. Licensee MDPI, Basel, Switzerland. This article is an open access article distributed under the terms and conditions of the Creative Commons Attribution (CC BY) license (https://creativecommons.org/licenses/by/4.0/).