Article

Non-Contact High Voltage Measurement in the Online Partial Discharge Monitoring System

by
Krzysztof Walczak
and
Wojciech Sikorski
*
Faculty of Electrical Engineering, Poznan University of Technology, 60-965 Poznan, Poland
*
Author to whom correspondence should be addressed.
Energies 2021, 14(18), 5777; https://doi.org/10.3390/en14185777
Submission received: 30 July 2021 / Revised: 3 September 2021 / Accepted: 10 September 2021 / Published: 14 September 2021
(This article belongs to the Special Issue Advances in Online Partial Discharge Monitoring Systems)

Abstract

:
The article presents an innovative system for non-contact high voltage (HV) measurement, which extends the measurement capabilities of a portable partial discharges (PD) monitoring system intended for diagnostics of power transformers. The proposed method and the developed measuring system are based on the use of a capacitive probe, thanks to which the high voltage measurement is safe (galvanic separation from the objects at ahigh potential). It is also flexible because the voltage ratio of this system can be configured in a wide range by changing the probe’s position. The proposed solution makes the portable PD monitoring system fully autonomous and independent of the substation systems and devices. The article presents both the concept of the non-contact HV measurement system and its practical implementation. The procedure for determining the voltage ratio and measurement uncertainty, which is at an acceptable level of 1–5% in laboratory conditions, was discussed in detail. In addition, the article discusses the digital filtering and wavelet de-noising methods implemented in the software of the monitoring system, which makes it possible to measure the voltage in the presence of strong electromagnetic disturbances occurring at the substation. Finally, the results of field tests carried out on a 250 MVA power transformer are presented, which confirmed the high accuracy of the HV measurement using a capacitive probe and the advantages of this technique.

1. Introduction

The electrical power system belongs to a special type of critical infrastructure, as it determines the security of society and the economy. The key devices that ensure the proper functioning of this system are large power transformers. Unfortunately, a common problem in most countries is that a significant part of these transformers either exceed the lifetime predicted by manufacturers (estimated at about 30–35 years) or are close to this limit. Numerous reports and statistical analyses indicate more and more frequently occurring transformer failures [1,2,3]. These failures not only cause electrical power cuts but can also lead to oil leaks and fires (environmental contamination) and damage to high voltage (HV) devices associated with them at a substation or power plant. Replacing a large power transformer is extremely costly and time-consuming, and the lead time is generally over a year [4]. The main causes of transformer failures are mechanical winding defects and defects in the insulation system [5,6,7,8]. The mechanisms of the formation and development of these defects are accompanied by certain symptoms, which, if recognized quickly enough, can provide valuable information on the current technical condition, the expected life of the device, and the possibility of its failure. One of the main and unambiguous symptoms indicating the deteriorating technical condition of the transformer and the impending failure is the partial discharge (PD) phenomenon in its insulation system [1]. With such an advanced degree of transformer overexploitation, relying only on periodic diagnostics is insufficient and generates too high a risk. For this reason, in the last dozen or so years, the intensity of work on the development of online partial discharge monitoring systems has been increased [9,10,11,12,13]. These systems most often use the acoustic emission (AE) method or electromagnetic methods for recording signals in the high frequency (HF), very high frequency (VHF), and ultrahigh frequency (UHF) radio frequency bands [14,15,16,17,18,19]. However, due to the high purchase and maintenance costs, monitoring systems are relatively rarely installed permanently. From an economic point of view, it is much more advantageous to use them in the short-term (temporary) monitoring mode, i.e., for several days or weeks. This is usually long enough to confirm the PD phenomenon’s presence and assess its intensity and trend. A significant problem of the implemented PD monitoring systems is their diagnostic reliability related to the need to evaluate whether the source of the recorded signals is the occurrence of partial discharges or external disturbances. Unfortunately, both the acoustic emission method and electromagnetic methods are exposed to numerous external disturbances. In the case of the acoustic method, these can be environmental noises (e.g., rain, hail, thunderstorms, sandstorms, wind), oil circulating pumps and fan noises, noise generated by magnetostriction in the core steel laminations, load noise produced by electromagnetic forces in the windings, or acoustic signals produced by switching operations in a substation [20]. In electromagnetic methods, the sources of interference may be corona discharge in HV transmission lines, switching operations, FM radio stations, aerial navigation systems, civilian and military aviation, transmitters of civil services, transmitters of digital video broadcasting-terrestrial (DVB-T) digital television, or transmitters of the Global System for Mobile Communications (GSM) and Long-Term Evolution (LTE) wireless internet [21,22]. One way to improve the diagnostic reliability is to use a technically advanced system capable of recording pulses simultaneously with at least two methods, e.g., UHF and AE. If the system registers acoustic and electromagnetic pulses simultaneously, it can be assumed with a high probability that their source is partial discharges. Figure 1 shows the result of an eight-day PD monitoring carried out on a 31.5 MVA power transformer [12]. The Pearson correlation coefficient between the hourly distribution of the UHF and AE pulses was r = 0.87 with significance p = 0.001, which means a very strong positive correlation and confirms the presence of partial discharges.
Unfortunately, portable short-term PD monitoring systems that rely on more than one method of PD detection are not yet commonly available on the market. For this reason, another approach may be used to increase the diagnostic reliability of the system. It consists of assessing the correlation between the voltage value on the transformer and the intensity of the partial discharges (or more precisely: the number of pulses registered by the PD detectors). This is due to the fact that the higher the voltage value, the greater the electrical stress in the insulating system, and thus the probability of partial discharges ignition increases. Figure 2 shows the average values of voltage and AE pulse rate (per minute) over the period of one month, which were recorded on the monitored 330 MVA power transformer [23]. The Pearson correlation coefficient for these two parameters was r = 0.90 with significance p = 0.001, which allows us to assume with a high probability that the source of the recorded AE pulses was the phenomenon of partial discharges, the intensity of which strongly depends on the voltage level.
For a monitoring system permanently installed on a power transformer, obtaining information about the instantaneous voltage value is not difficult. Such a stationary system is usually integrated with a superior substation supervisory control and data acquisition (SCADA) system that reads the voltage values directly from the voltage transformers. The communication and data transmission between devices is usually carried out using the IEC 61850 standard. In the case of portable systems for temporary (e.g., several days) PD monitoring, obtaining information about the voltage value from the SCADA system or directly from the substation voltage transformers is a much more complicated task, often time-consuming and economically unjustified. This is due to the fact that each new installation and even the smallest interference in the infrastructure of a power substation (e.g., laying new signal cables) requires the preparation of a construction design, which must then be approved by the owner of the substation. This generates additional costs and delays the launch of the PD monitoring system. In addition, the monitoring system, in order to integrate with a supervisory SCADA system, must be equipped with a communication module compliant with the IEC 61850 standard or another data transmission protocol used at the given substation. In addition, the system firmware should be compatible with older versions of communication protocols. In some cases, it may even be necessary to use an additional protocols conversion module.
The solution that eliminates the above-mentioned problems is the non-contact method of measuring high voltage discussed in this article. Currently, non-contact measurement techniques are most often based on the use of a Hall effect voltage sensor [24], fiber-optic voltage sensor [25], or capacitive probe [26,27,28], the advantage of which is the simple construction and low production cost. For the first time, the concept of using a capacitive probe as a sensor for measuring high voltage was proposed by K. Walczak [29]. Initially, this method was recommended mainly for use in laboratory conditions. In recent years, attempts have been made to adapt this method to field conditions. The works focused mainly on the voltage measurement on the high-voltage overhead line [26,27,28] and the high-voltage direct current (HVDC) converter station components [30].
This article describes the assumptions of the non-contact high voltage measurement method using a capacitive probe and the construction of a measuring module specially designed for a portable PD monitoring system. The diagnostic reliability of the system has been increased thanks to the possibility of correlating the number of recorded pulses by PD detectors with the voltage value on the monitored transformer. Additionally, when using electromagnetic PD sensors (UHF antennas or high-frequency current transformers (HFCT) sensors), it is possible to create phase-resolved partial discharge (PRPD) patterns that can be used to recognize the type of defect or identify the sources of interference. Equipping the portable PD monitoring system with a voltage measurement module based on a capacitive probe allows it to be fully independent of the substation systems and devices, and at the same time, ensures a high flexibility and ease of installation on the transformer. It is worth noting that the proposed solution is the first of its kind in the world.

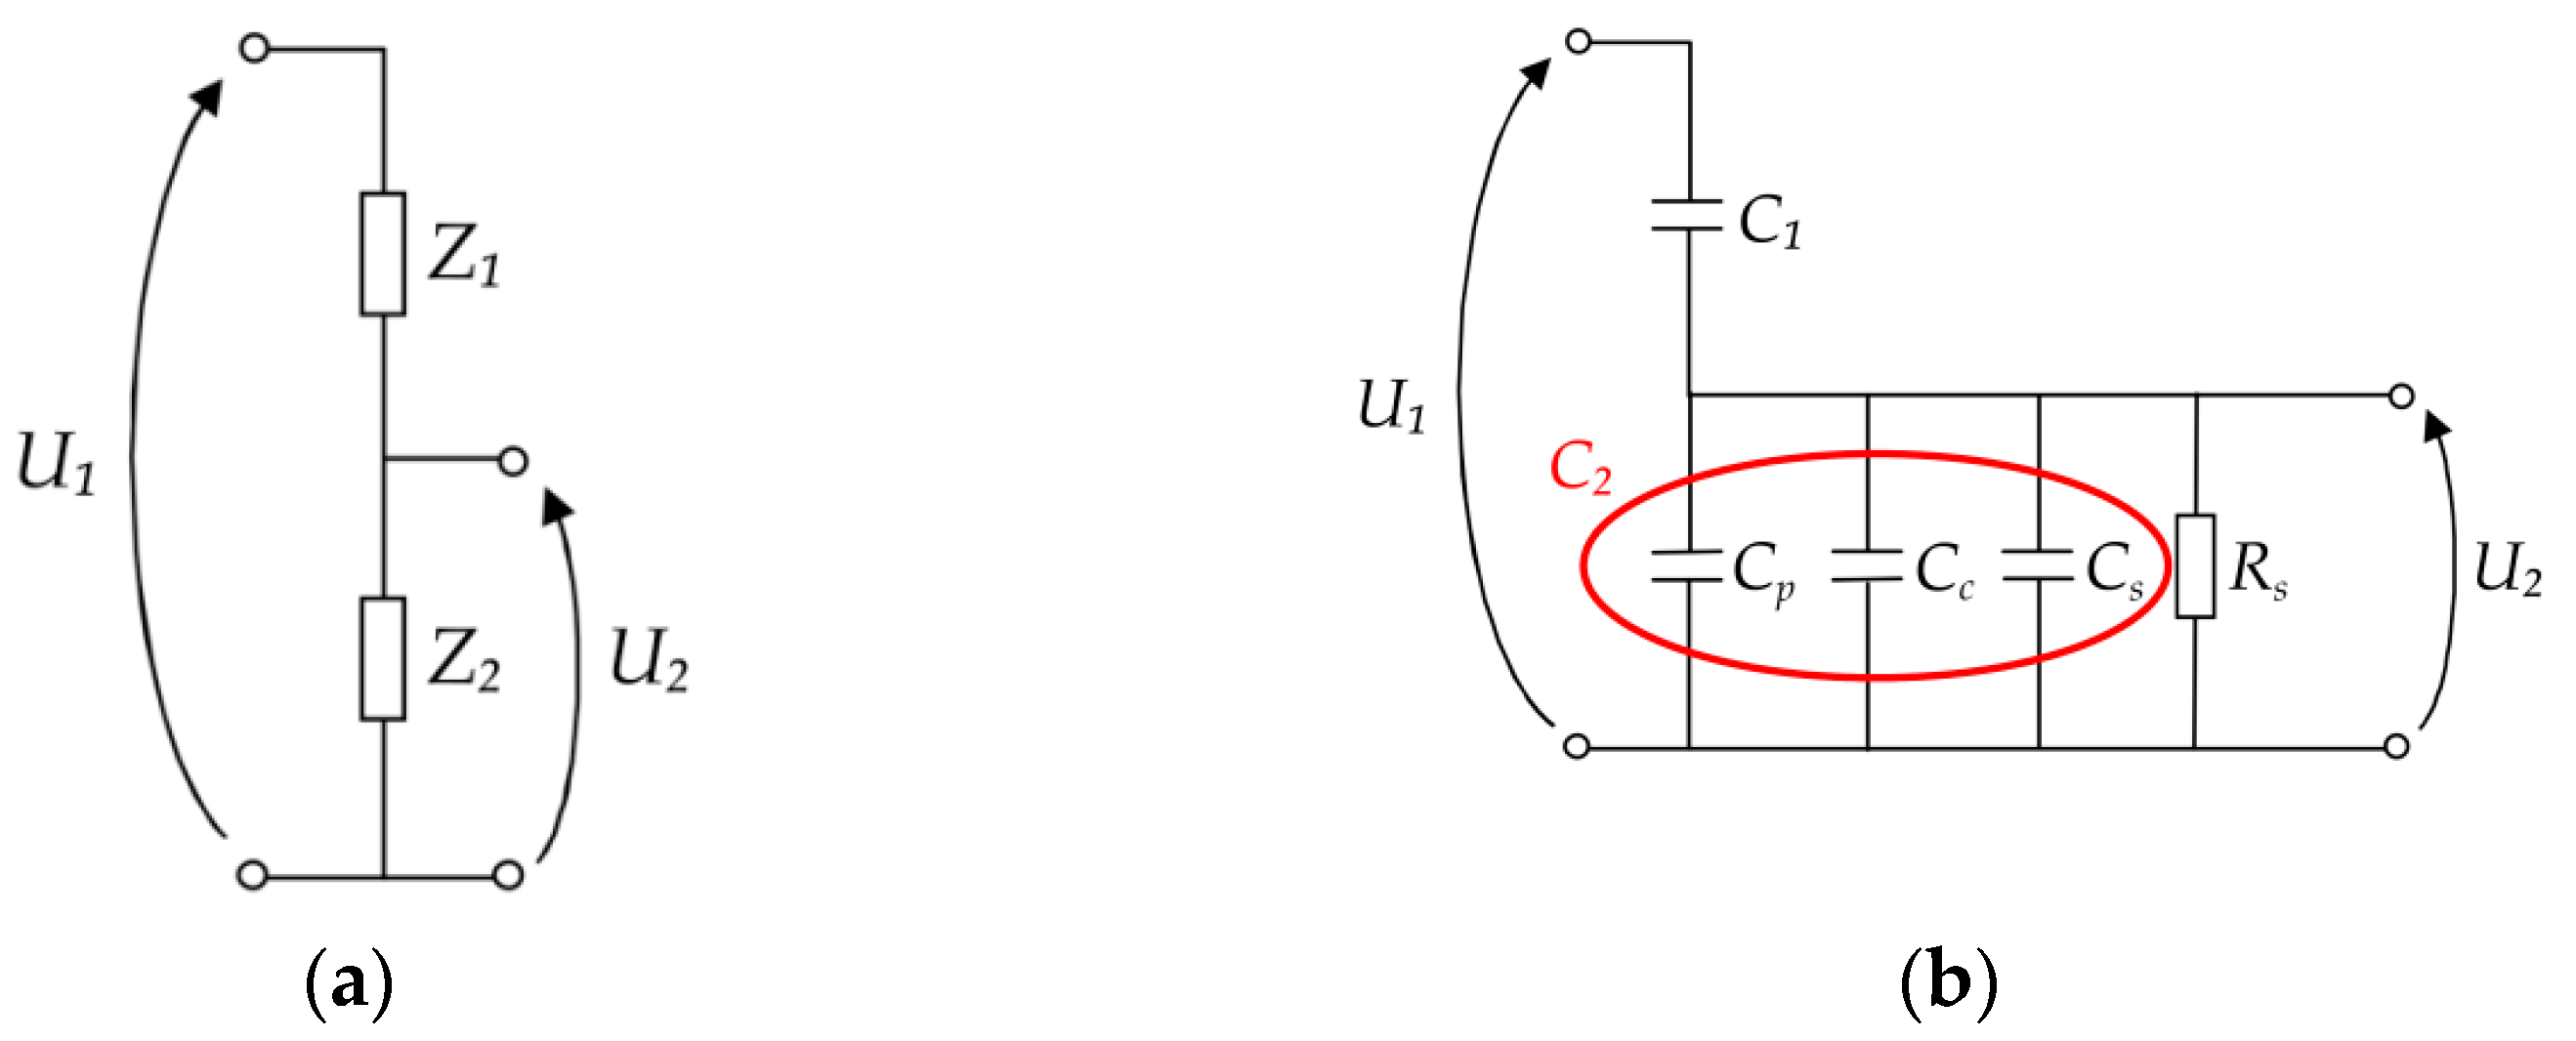
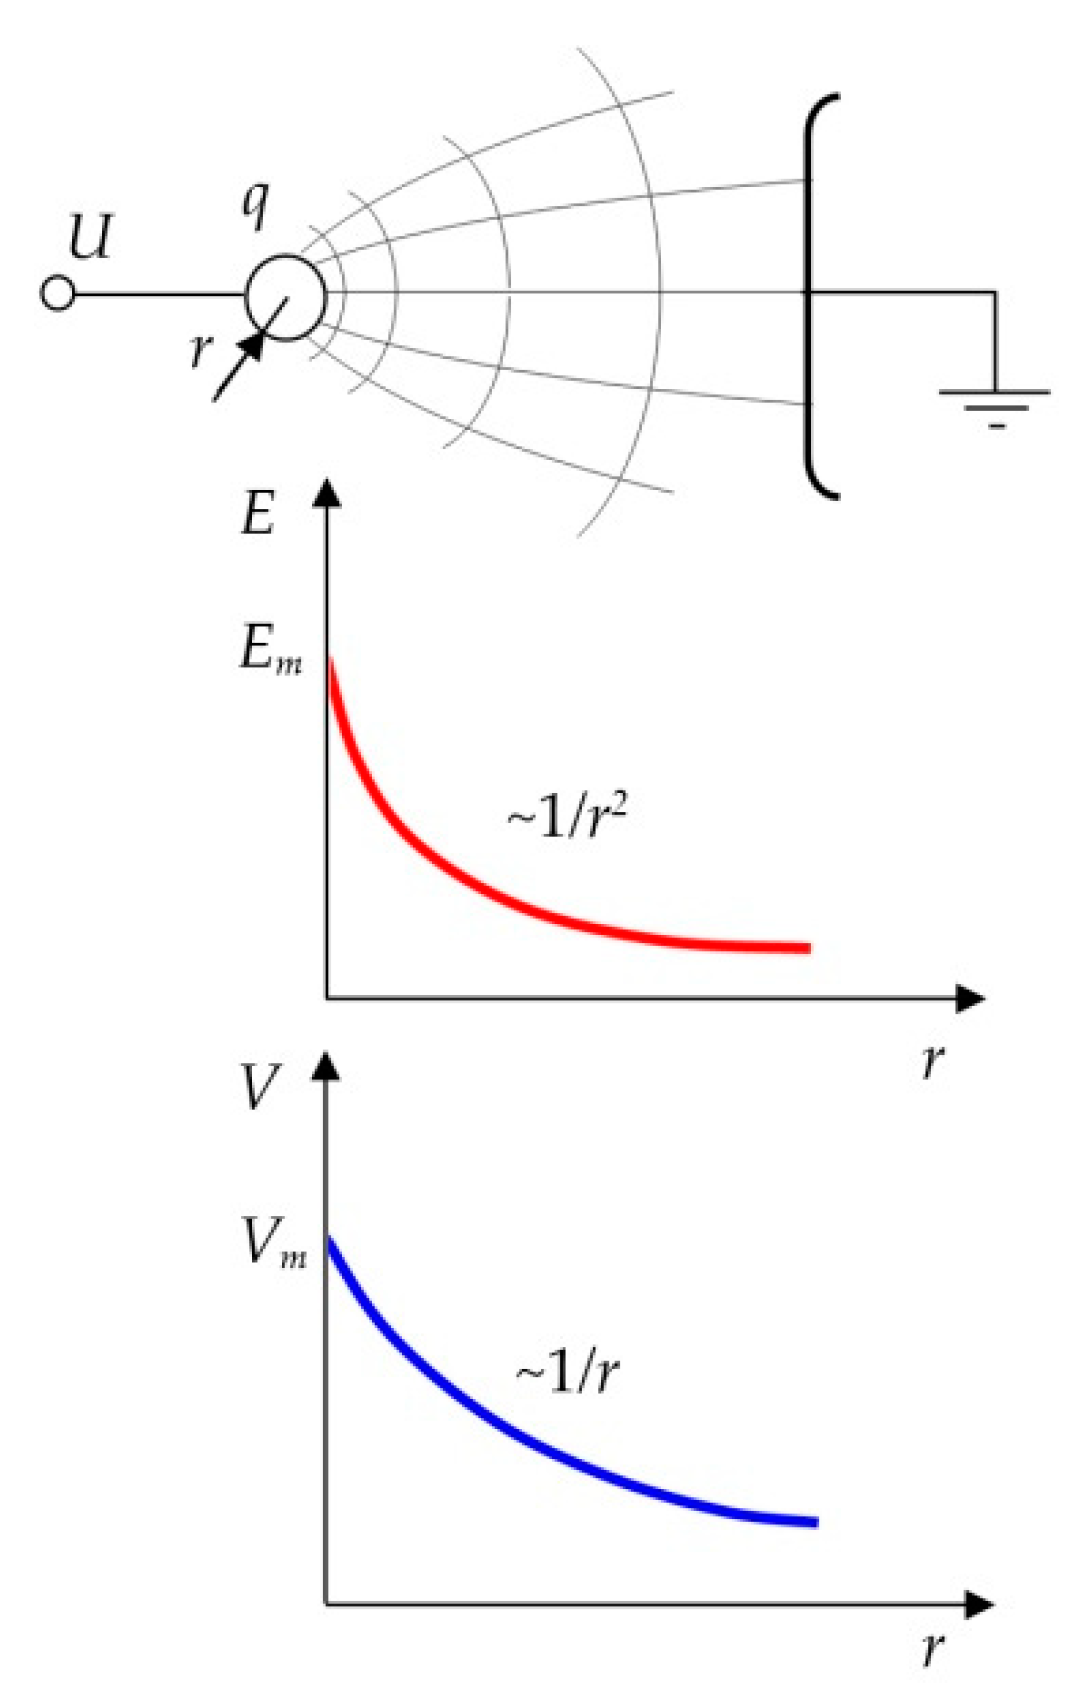
2. Concept of High Voltage Measurement with the Use of a Capacitive Probe

The measurement of high voltage with the use of a capacitive probe is similar to the measurement using a capacitive divider, which is commonly used in high voltage laboratories [31]. Of course, this similarity results primarily from the nature of the coupling of the measuring system with the test object. In both cases, we are dealing with a high-voltage coupling capacitance with a high impedance and a low-voltage measuring capacitance with a lower impedance, on which the voltage drop is measured and properly calculated taking into account the so-called divider ratio, which is a function of both of these capacitances (Figure 3). While the main idea of measurement in both systems is similar, the specificity of their performance and the nature of certain dependencies are radically different. In the case of a capacitive divider, we deal with the constant parameters of individual components (and thus a constant voltage ratio) and a galvanic connection of the measuring system with the test object. The system using a capacitive probe is portable, easy to install, low cost, and the value of the coupling capacity (directly influencing the value of the voltage ratio) is determined dynamically by changing the probe’s position. Importantly, the measurement is performed in a completely non-contact manner, i.e., without a galvanic connection to the high-voltage circuit. Thanks to this, it is a safe method for both the personnel and measuring equipment. In addition, measurement with a capacitive probe does not load the voltage source and does not interfere with the distribution of the electric field in the vicinity of the tested object.
The accuracy of the high voltage measurement using a capacitive probe depends mainly on the precise determination of the voltage ratio, and therefore primarily the value of the capacitive coupling C1 between the HV test object and the probe. The value of the voltage ratio is described by a slightly more complicated relationship than it is for a typical capacitive divider because a number of elements that are part of the measurement chain itself should be taken into account, such as the input impedance of an acquisition card or an oscilloscope, cable capacitance, etc. If, in accordance with the diagram shown in Figure 4, it is assumed that the maximum voltage (peak value) can be calculated using the formula:
U 1 = v U 2
where v is the voltage ratio, and U2 is the voltage measured with the capacitive probe, then the formula for the voltage ratio can be written as:
v = Z 1 + Z 2 Z 2 = 1 j ω C 1 + R s 1 + j ω C 2 R s R s 1 + j ω C 2 R s
where ω is the angular frequency, Rs is the voltmeter (or oscilloscope, digital acquisition card, etc.) input resistance, C1 is the coupling capacitance, and C2 is the resultant capacitance which is the sum of the probe capacitance Cp, the coaxial cable capacitance Cc, and the voltmeter input capacitance Cs:
C 2 = C p + C c + C s
After simplifying Equation (2), the voltage ratio can finally be written as:
v = C 1 + C 2 C 1 j 1 ω C 1 R s
The individual elements of the equivalent circuit shown in Figure 4 are determined in the laboratory, except for the value of the capacitive coupling C1, which is determined at the power substation after installing the PD monitoring system and the probe calibration procedure. This procedure consists of obtaining information about the instantaneous voltage value from the substation SCADA system (to which the voltage transformers are connected) and performing calculations using Equations (1) and (4).

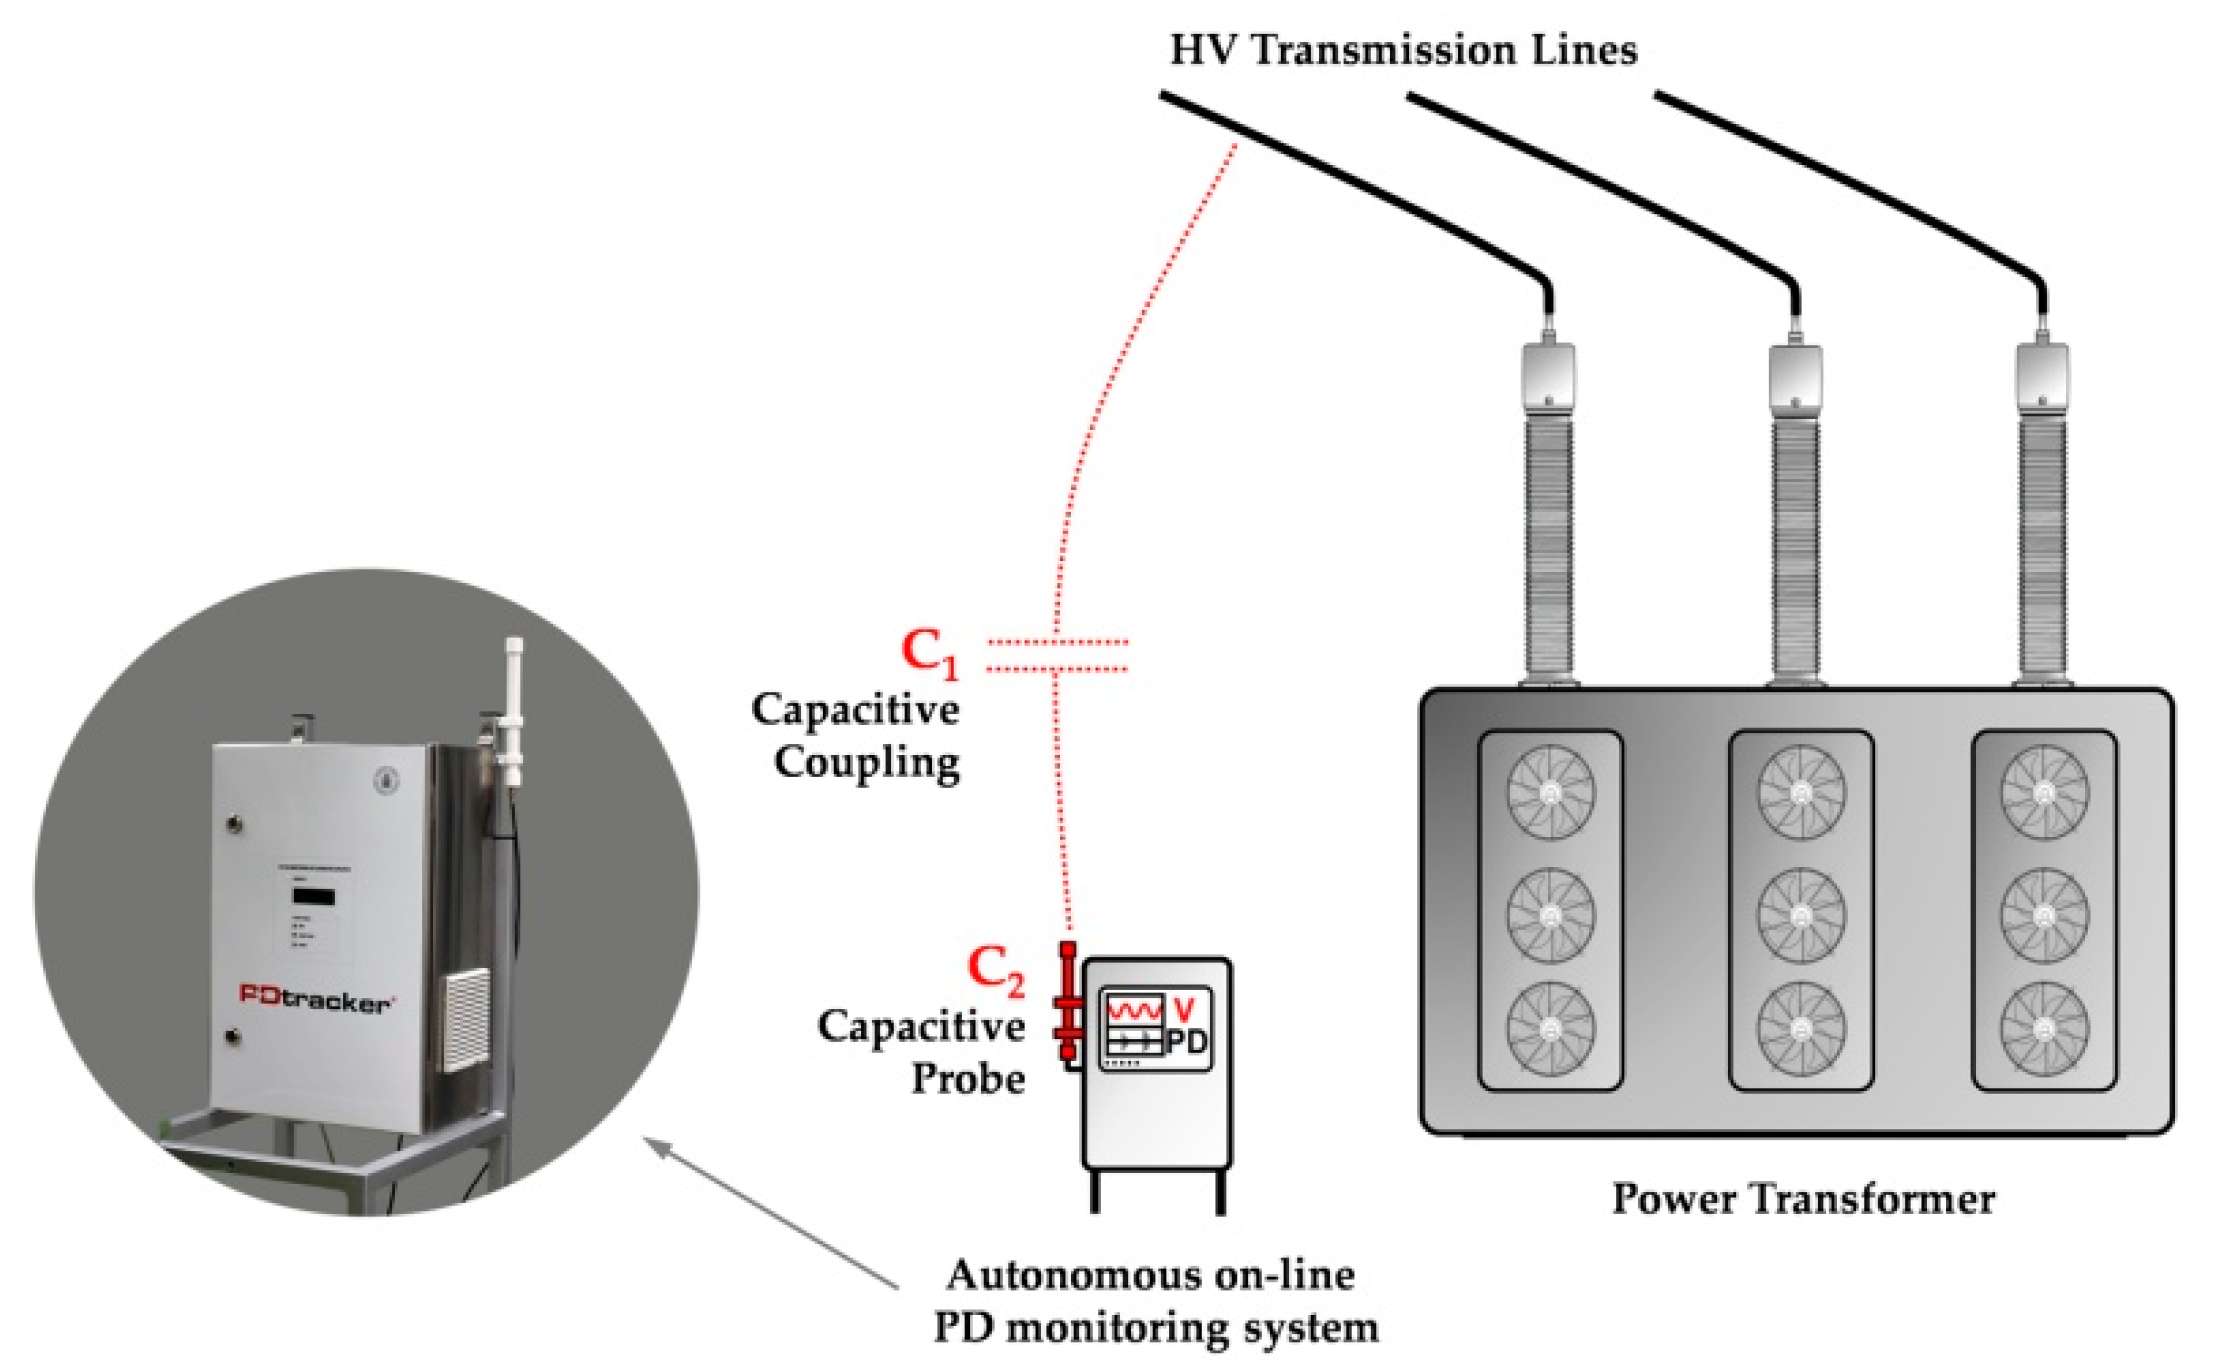
3. System Architecture for Non-Contact High Voltage Measurement

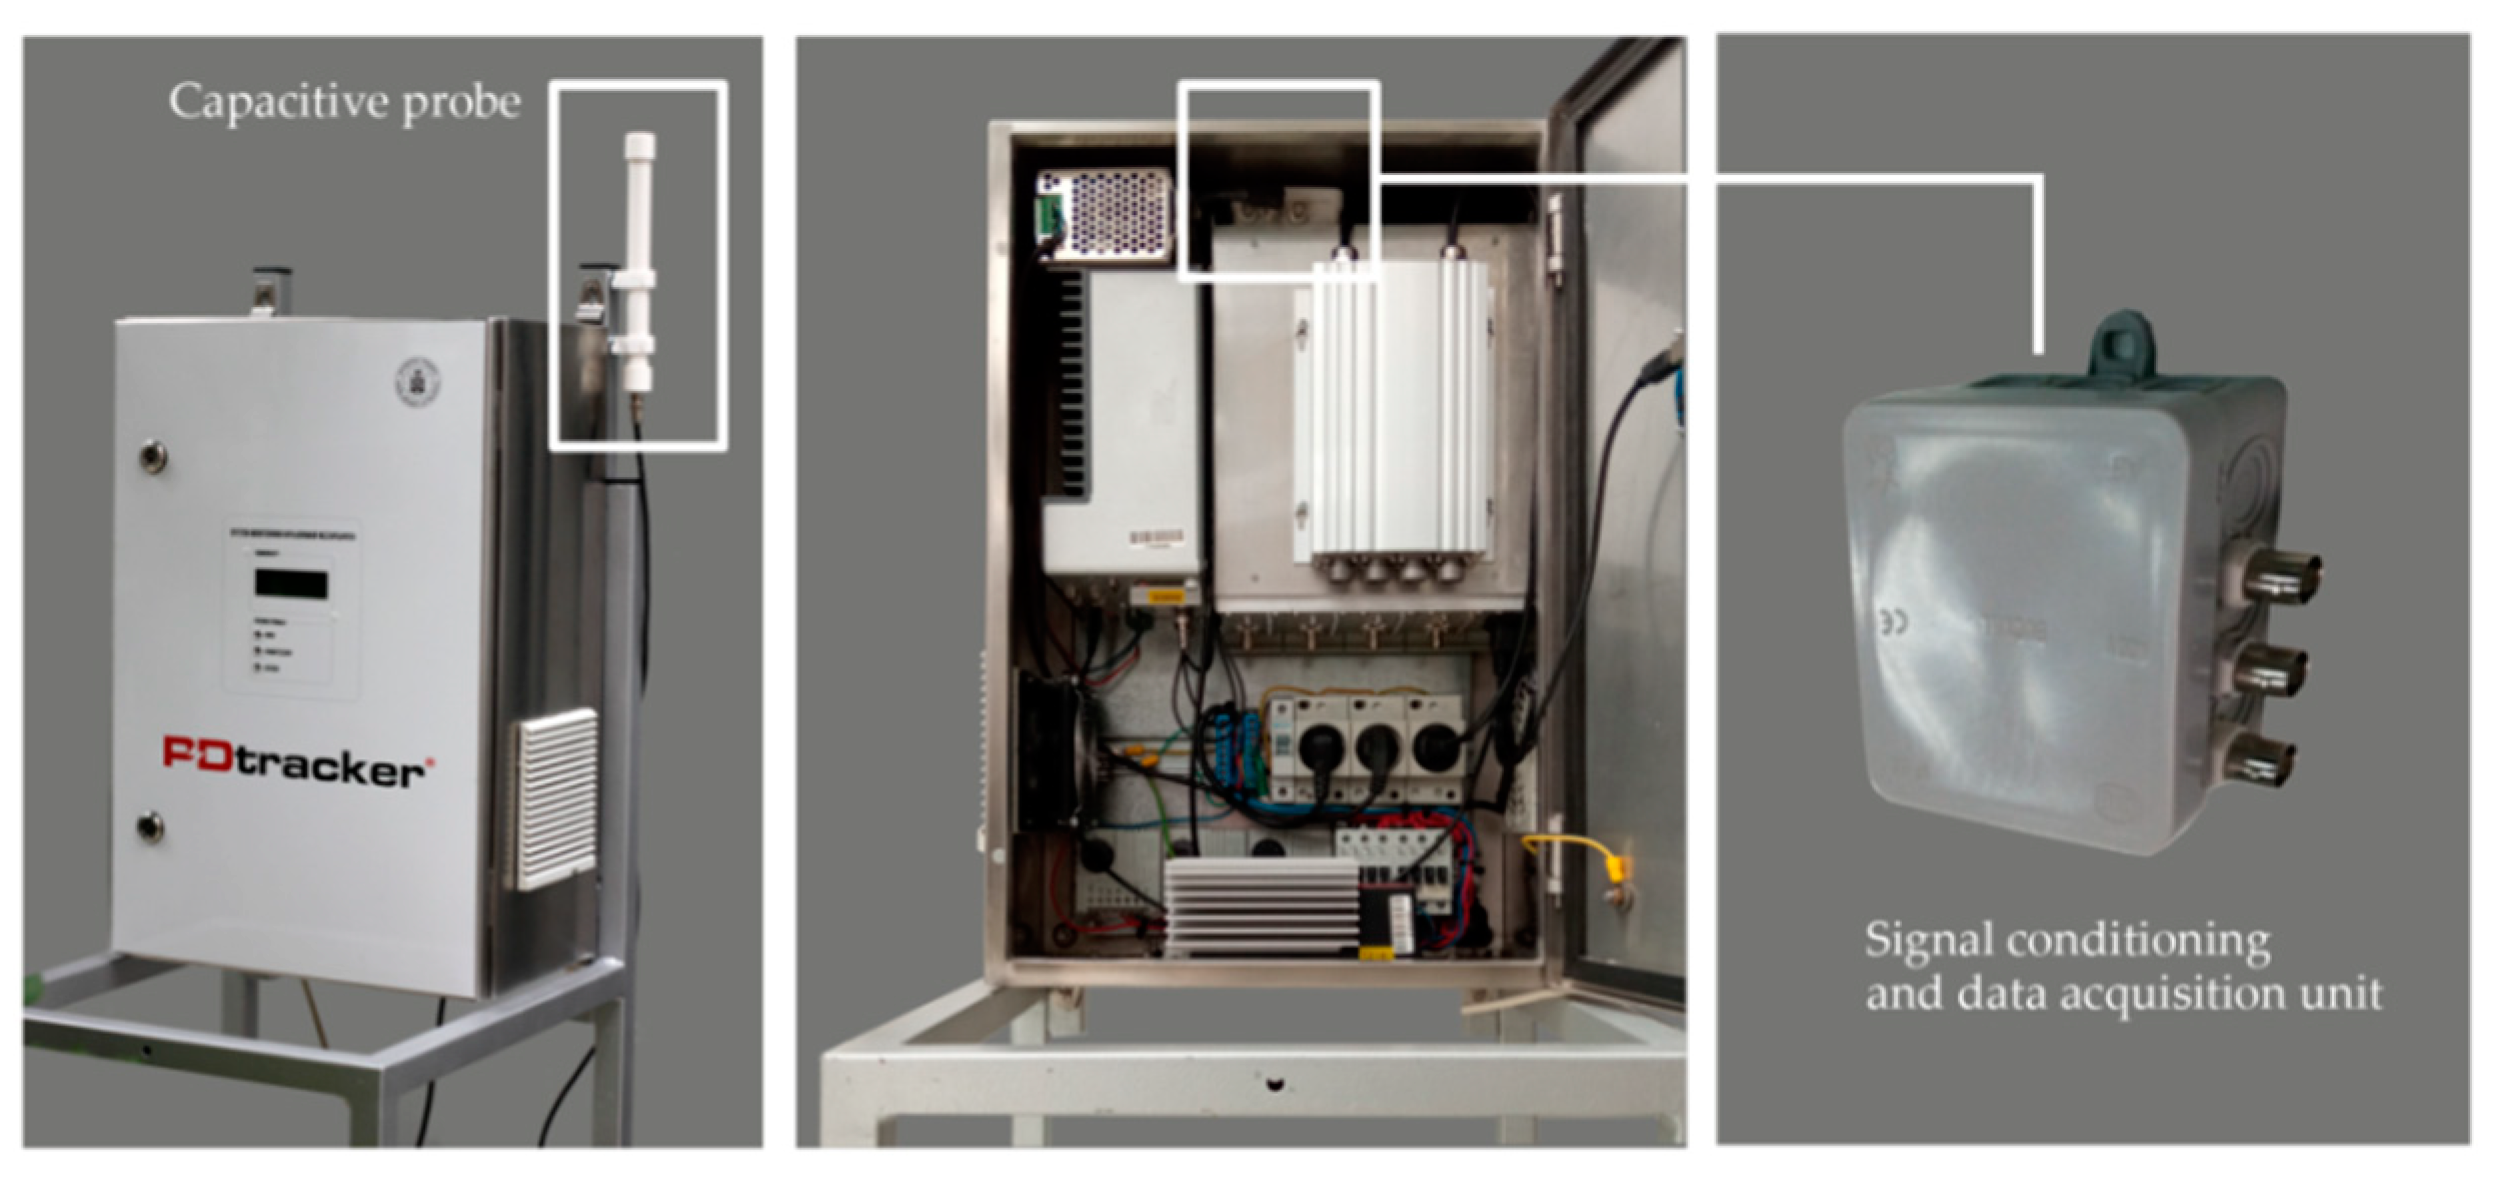
3.1. Capacitive Probe

When designing the probe for field applications, the possibility of using both a monopole and disk probe was analyzed. The technical and environmental conditions were primarily taken into account. The arguments in favor of choosing a monopole probe were as follows. Firstly, the monopole probe capacitively interfaces with the test HV object to a much lesser extent than the disk probe, thanks to which it can be installed relatively close to the live device and there is no risk of exceeding the limit value for the digital equipment connected to its output. Secondly, the monopole probe has a more compact structure, thanks to which it is easier to ensure the tightness of its housing, which is important from the point of view of the operation in changing weather conditions (the influence of moisture). In addition, laboratory tests have shown that this type of probe, the active part of which is surrounded mainly by air, is less exposed to changes in the properties (probe capacitance Cp) due to moisture than a disk probe. As shown in [32], the dielectric constant of air in the range of relative humidity from 25% to 75% changes only by about 0.012%. Due to the fact that its active part is filled with a solid dielectric, the disk probe significantly changes its parameters in contact with moisture. This, in turn, will result in significant errors during the measurements as the voltage ratio of the measuring system changes. This type of probe is also more difficult to protect against the ingress of moisture, due to the larger dimensions and specificity of the structure. Therefore, it was decided to use a monopole probe, the structure of which is presented below.
The probe consists of a receiving element made of copper wire, 20 cm long and 2 mm in diameter. It is equipped with a Bayonet Neill–Concelman (BNC) coaxial connector and a waterproof casing made of polyethylene. The probe capacitance Cp as measured by the LCR meter is 2.2 pF. Figure 5 shows a 3D schematic diagram and a technical drawing with the dimensions of the developed probe for contactless high voltage measurement.

3.2. Signal Conditioning and Data Acquisition Unit

The low-cost DrDAQ signal acquisition card by Pico Technology with a sampling frequency of 1 MS/s in block mode or 100 kS/s in fast USB streaming mode, and a resolution of 8 bits is used to measure the voltage registered with a capacitive probe. The input resistance Rs of the acquisition card is 1 MΩ, and its input capacitance Cs is 17 pF. The capacitive probe is an element with a very low current efficiency and connecting it to an acquisition card with a 1 MΩ input impedance causes a significant reduction of the signal amplitude. This problem was solved using a voltage follower based on the AD549 operational amplifier with a very high input impedance (1015 Ω) and a low offset voltage (max. 0.5 mV). Additionally, this op-amp can safely drive a 4000 pF capacitance at unity gain. This allows the use of long coaxial cables without negative consequences, such as parasitic oscillations or signal attenuation. In order to protect the circuit against overvoltage, BAV20-type protective diodes are used at the input of the voltage follower. Figure 6 shows a comparison of voltage waveforms recorded in the measurement system with and without a voltage follower. It can be seen that in the case of a circuit without a voltage follower, the recorded signal is highly distorted and has about 15 times lower amplitude.
The conditioned voltage signal is sampled by the analog-to-digital converter of the data acquisition (DAQ) card, and then (already in digital form) transmitted via a universal serial bus (USB) cable to an industrial computer that is part of the online PD monitoring system. The schematic diagram of the system for non-contact high voltage measurement is shown in Figure 7.

3.3. Integration of the High Voltage Measurement Module with the Online PD Monitoring System

The high voltage contactless measurement module has been integrated with the PDtracker system designed for online partial discharge monitoring, developed at the Poznan University of Technology. The system has eight analog channels, each of them is equipped with an independent analog-to-digital converter, sampling the signal with a maximum frequency of 20 MS/s. The default partial discharge detectors are acoustic emission sensors optimized to detect discharges occurring in oil-paper insulation [33]. The system has also been adapted to work with high-frequency current transformers (HFCT), UHF antennas, and active dielectric windows [12]. The detailed structure of the system and examples of its implementation for monitoring power transformers are discussed, among others, in [23].
The electronic circuit of the signal conditioning module and the DAQ card of the voltage measurement module are placed in a separate, compact housing with dimensions of 6 × 6 × 4 cm. The power supply and data transmission between the DAQ card and the industrial computer is carried out using the universal serial bus (USB) 2.0, which provides a data transfer up to 60 MB/s. The PDtracker system and the components of the non-contact voltage measurement module are shown in Figure 8.
The non-contact high voltage measurement module works under the control of an application developed—similarly to the PDtracker’s software—in the NI LabVIEW environment. The program functions related to the data acquisition (DrDAQ card configuration), digital signal processing (filtering and reconstruction), calibration, and display of the voltage value and voltage waveform are available in the main panel of the user interface (Figure 9). The program also allows for the automatic recording of results with an appropriate time step (monitoring of voltage changes over time) and a quick calibration (i.e., determination of the value of coupling capacitance C1 following the principles described in Section 2). The calibration procedure consists of determining the voltage ratio v of the measuring system based on Equation (1) as the quotient of the reference high voltage U1 and the voltage U2 measured with the capacitive probe. For this purpose, the instantaneous voltage value U1 read from the substation SCADA system or from an analog voltmeter installed in the substation control room is entered into the program. During calibration, the voltage value U1 is usually given by phone by the substation staff.
An important function of the program is a special, three-stage sequential filter, thanks to which it is possible to measure the voltage with a capacitive probe even in the presence of strong electromagnetic interference, such as corona discharge, lightning discharge, and substation switching operations. At each stage of the sequence filter, the user can select one of the available filtering options: averaging filter, wavelet filter, Butterworth low-pass filter, or turn off the filtering stage. The standard setting in the program is two-stage filtering, whereby the signal is averaged first (with a minimum of 2 and a maximum of 128 voltage periods) and then the higher harmonics and transient disturbances are removed from the signal with a second-order Butterworth low-pass filter. An example of the operation of such a two-stage filtration is shown in Figure 10. In the case of a highly noisy signal or when the signal-to-noise ratio (SNR) is low, the filtration efficiency can be increased by applying a wavelet de-noising function on the first stage of the sequential filter. By default, using the sym8 wavelet, a five-level wavelet decomposition of the signal is performed, and then at each of these levels, the signal is de-noised using the soft-thresholding technique introduced by Donoho and Johnstone [34,35].

4. Determining the Voltage Ratio and Measurement Uncertainty

In laboratory conditions, the determination of the voltage ratio of the measuring system of a capacitive probe can be performed in various ways. Each of them should use the standard voltage source for calibration purposes or one of the traditional reference high voltage measurement methods, e.g., measuring sphere gaps (according to IEC 60060-2:2000) [36]. In field conditions, the value of the voltage ratio v is estimated based on the knowledge of the instantaneous voltage values (recorded by the substation SCADA system) measured by the voltage transformers operating in the transformer bay. In this case, the accuracy of determining the voltage ratio will depend on the measurement uncertainty introduced by the voltage transformer used in the substation and on the parameters of the measurement system. These issues will be discussed in more detail later in this section.
In order to determine the value of the voltage ratio, it is necessary to find the relation between the value of the voltage measured on the monitored transformer and the value of the voltage measured by the measuring system of the capacitive probe. It is enough to do this for at least one measuring point because this relation is linear, as shown in Section 6. Knowing the maximum values of the voltages U1 and U2, as well as the parameters of the measuring system, i.e., the elements included in the impedance Z2, the value of the coupling capacitance C1 can be determined using Equation (5), which results from the transformation of Equations (1) and (2). It is assumed that the impedance Z1 is purely capacitive.
C 1 = U 2 ω Z 2 ( U 1 U 2 )
In the high voltage measurement method with the use of a capacitive probe, the assessment of the measurement uncertainty requires taking into account several factors. In particular, it concerns the determination of the value of the coupling capacitance C1 between the tested object and the probe.
By transforming Equations (1) and (4) with respect to the voltage U1, the formula for the absolute value (modulus) of the voltage U1 can be written as
U 1 = | ( C 1 + C 2 C 1 j 1 ω R s C 1 ) U 2 |
It can be seen that the voltage U1 depends on five quantities: C1, C2, Rs, ω, and U2. The individual parameters in Equation (6) are independent, and therefore to determine the standard uncertainty of the voltage measurement, the formula for the combined standard uncertainty can be used [6]:
u ( U 1 ) = ( U 1 C 1 ) 2 u 2 ( C 1 ) + ( U 1 C 2 ) 2 u 2 ( C 2 ) + ( U 1 ω ) 2 u 2 ( ω ) + ( U 1 R s ) 2 u 2 ( R s ) + ( U 1 U 2 ) 2 u 2 ( U 2 )
Individual derivatives are the result of differentiating the Equation (7) with respect to a given variable, and the expressions u2(C1), u2(C2), u2(ω), u2(Rs), and u2(U2) are the appropriately determined standard measurement uncertainties of the individual components of Equation (6). The expanded uncertainty of the voltage measurement given as the final result can be written as:
U ( U 1 ) = k u ( U 1 )
where k is a coverage factor equal to 2 for the 95% confidence level.
If an element with a very high input impedance is used in the measuring system (in this case, the AD549 voltage follower with an input impedance of 1015 Ω), then due to the elimination of the influence of the input resistance Rs of the signal acquisition card on the measuring system, Equation (6) for the voltage ratio of the system will be simplified, and then it will take the following form:
U 1 = | ( C 1 + C 2 C 1 ) U 2 |
Thus, Equation (7) for determining the measurement uncertainty will also be simplified to the following form:
u ( U 1 ) = ( U 1 C 1 ) 2 u 2 ( C 1 ) + ( U 1 C 2 ) 2 u 2 ( C 2 ) + ( U 1 U 2 ) 2 u 2 ( U 2 )
Limiting the number of variables influencing the uncertainty of voltage determination also allows us to reduce the level of uncertainty, but only to a small extent, because the greatest influence is still the measurement uncertainty of voltage U2, and this does not change.

4.1. Measurement Uncertainty of Voltage U2

In the PD monitoring system, the Pico Technology DrDAQ data acquisition card was used to measure the voltage. According to the technical specification, the accuracy of the voltage measurement is ±3% of the measured value. The formula for the maximum limit error EU of the measured voltage, which is recorded in the waveform averaging mode (at least sixteen), can be written as follows:
E U = ± ( 0.03 V M E A S )
where VMEAS is the voltage value measured with the acquisition card. Assuming a uniform distribution of errors and a negligible influence of voltage measurement resolution, the standard uncertainty can be calculated using the formula:
u ( U 2 ) = E U 3

4.2. Measurement Uncertainty of Pulsation ω

According to the pulsation formula, the only factor that determines the uncertainty of determining this parameter is the measurement of the time T:
ω = 2 π 1 T
Time measurement is also performed with the DrDAQ signal acquisition card. The limit error ET of the time measurement provided by the manufacturer in the technical specification is described as follows:
E T = ± ( 0.2 S i + 0.05 W i + 10 4 T M E A S )
where TMEAS is the measured value of time T, Si is the time interval between samples (depends on the sampling frequency), and Wi is the waveform interval (depends on the record length).
Thus, the standard uncertainty u(T) of the time measurement, after taking into account the limit error of the time measurement ET and the error resulting from the resolution d of this measurement, can be described by the formula:
u ( T ) = ( E T 3 ) 2 + ( d 2 3 ) 2
Finally, the standard uncertainty of determining the pulsations u(ω)—after calculating the differential from the Equation (13) and taking into account the measurement uncertainty of the time u(T)—can be determined using the formula:
u ( ω ) = 2 π T 2 u ( T )

4.3. Measurement Uncertainty of Capacitance C2

The capacitance C2 consists of the capacitance of the probe Cp and the coaxial cable Cc, as well as the input capacitance Cs of the analog input. The first two capacitances were measured together using an LCR meter, type ESCORT ELC-3131D, with the limit error described by the formula:
E c = ± ( 0.006 C M E A S + 5 L S D )
where CMEAS is the measured capacitance value with the LCR meter and LSD is the least significant digit in the given measuring range. According to the data provided by the manufacturer of the DrDAQ card, the input capacitance Cs of the signal acquisition channel is 17 pF ± 3 pF. After taking both these parameters into account and assuming a uniform distribution of errors, the standard uncertainty of the C2 capacitance measurement can be determined as:
u ( C 2 ) = ( E c 3 ) 2 + ( 3 10 12 3 ) 2

4.4. Uncertainty in Estimating the Input Resistance Rs of the Signal Acquisition Card

According to the technical specification of the signal acquisition card used, the input resistance of the analog channel is 1 MΩ ± 0.5%. Therefore, the standard uncertainty can be estimated from the equation:
u ( R s ) = R s 0.005 3

4.5. Measurement Uncertainty of Coupling Capacitance C1

In order to estimate the value of the coupling capacitance C1, scaling measurements are performed on the basis of which the value of the coupling capacitance module is determined:
C 1 = | U 2 C 2 U 1 U 2 + j U 2 ω R s ( U 1 U 2 ) |
Standard complex uncertainty takes the form of the equation:
u ( C 1 ) = ( C 1 U 1 ) 2 u 2 ( U 1 ) + ( C 1 C 2 ) 2 u 2 ( C 2 ) + ( C 1 ω ) 2 u 2 ( ω ) + ( C 1 R s ) 2 u 2 ( R s ) + ( C 1 U 2 ) 2 u 2 ( U 2 )
and individual uncertainties should be determined as described above.
The uncertainty calculations for various variants of the probe positioning showed that it is in the range of 1% to 5%, which is an acceptable level for the online PD monitoring system.

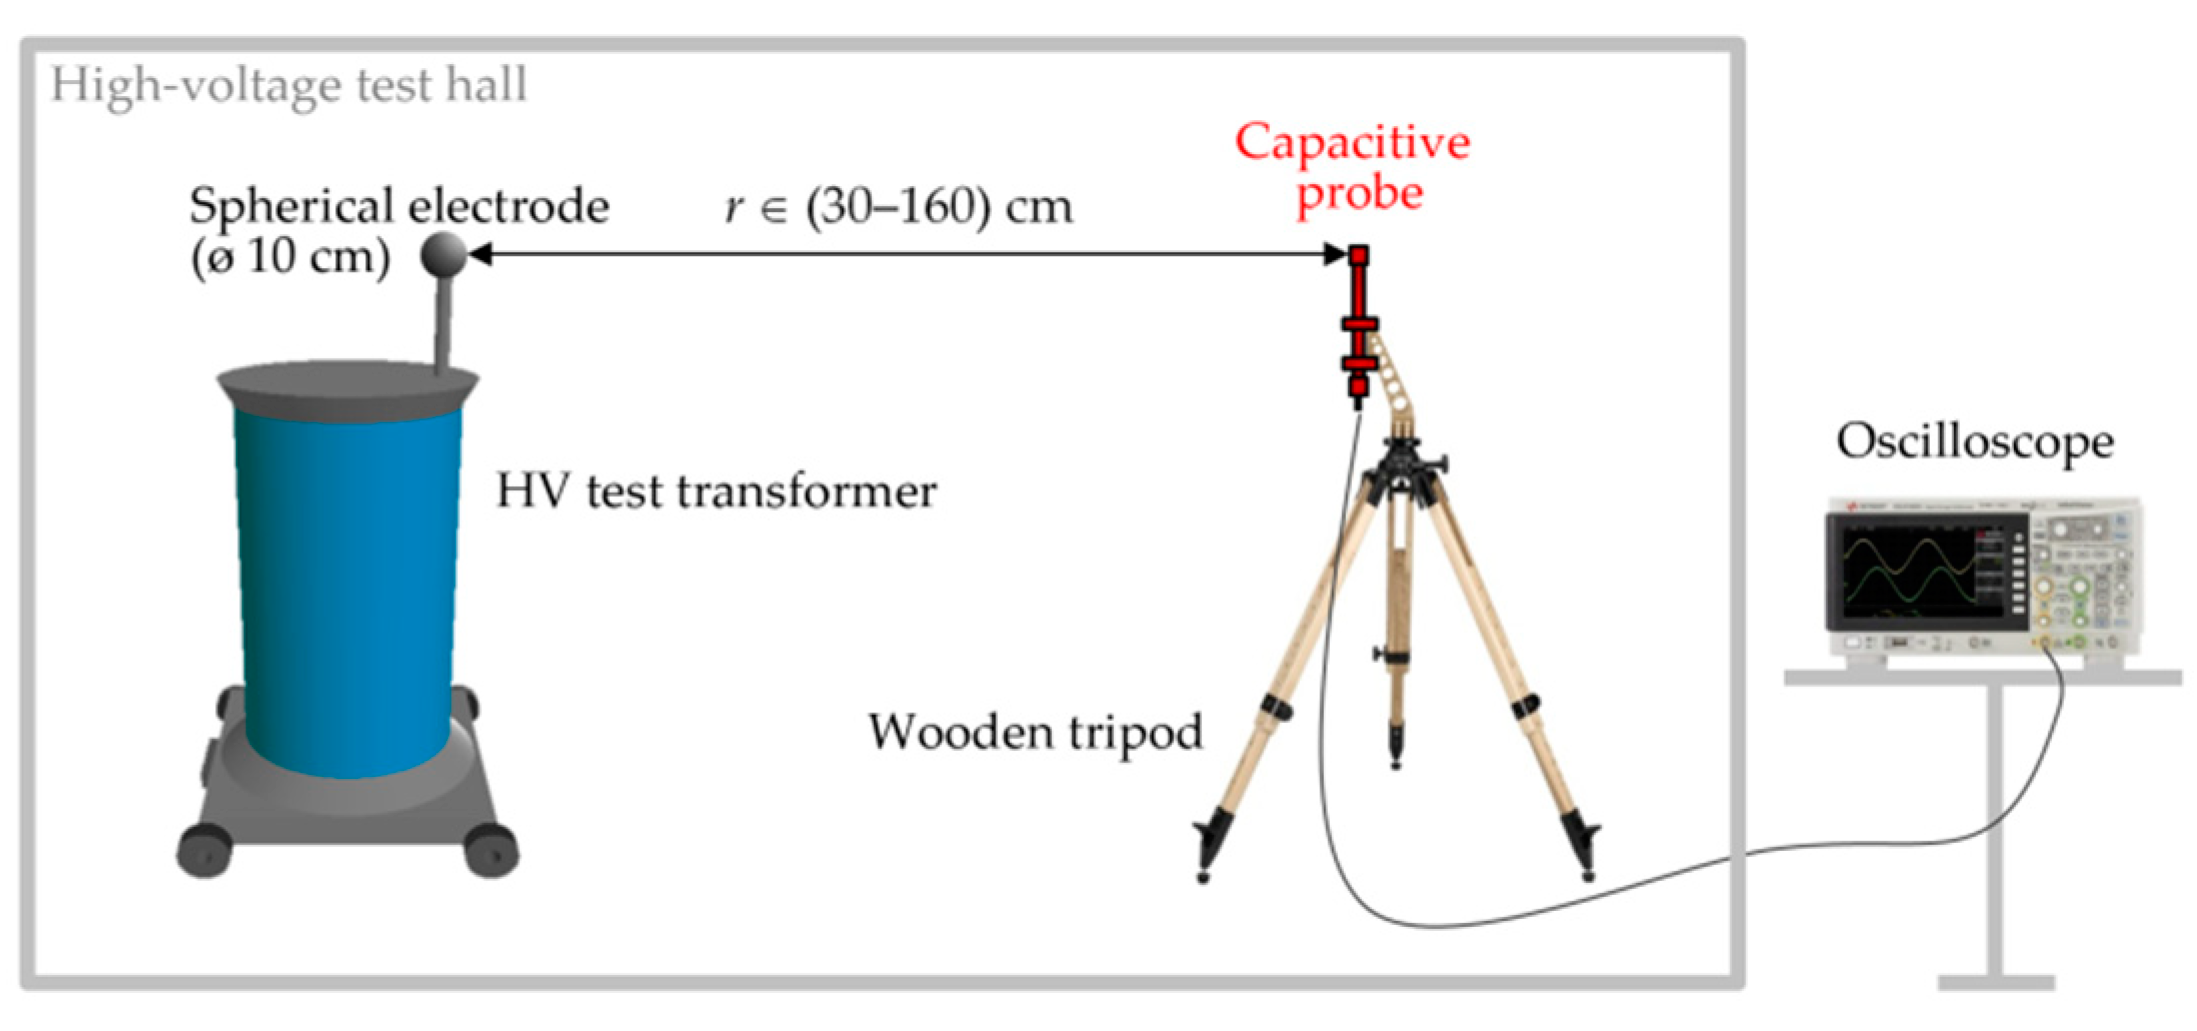
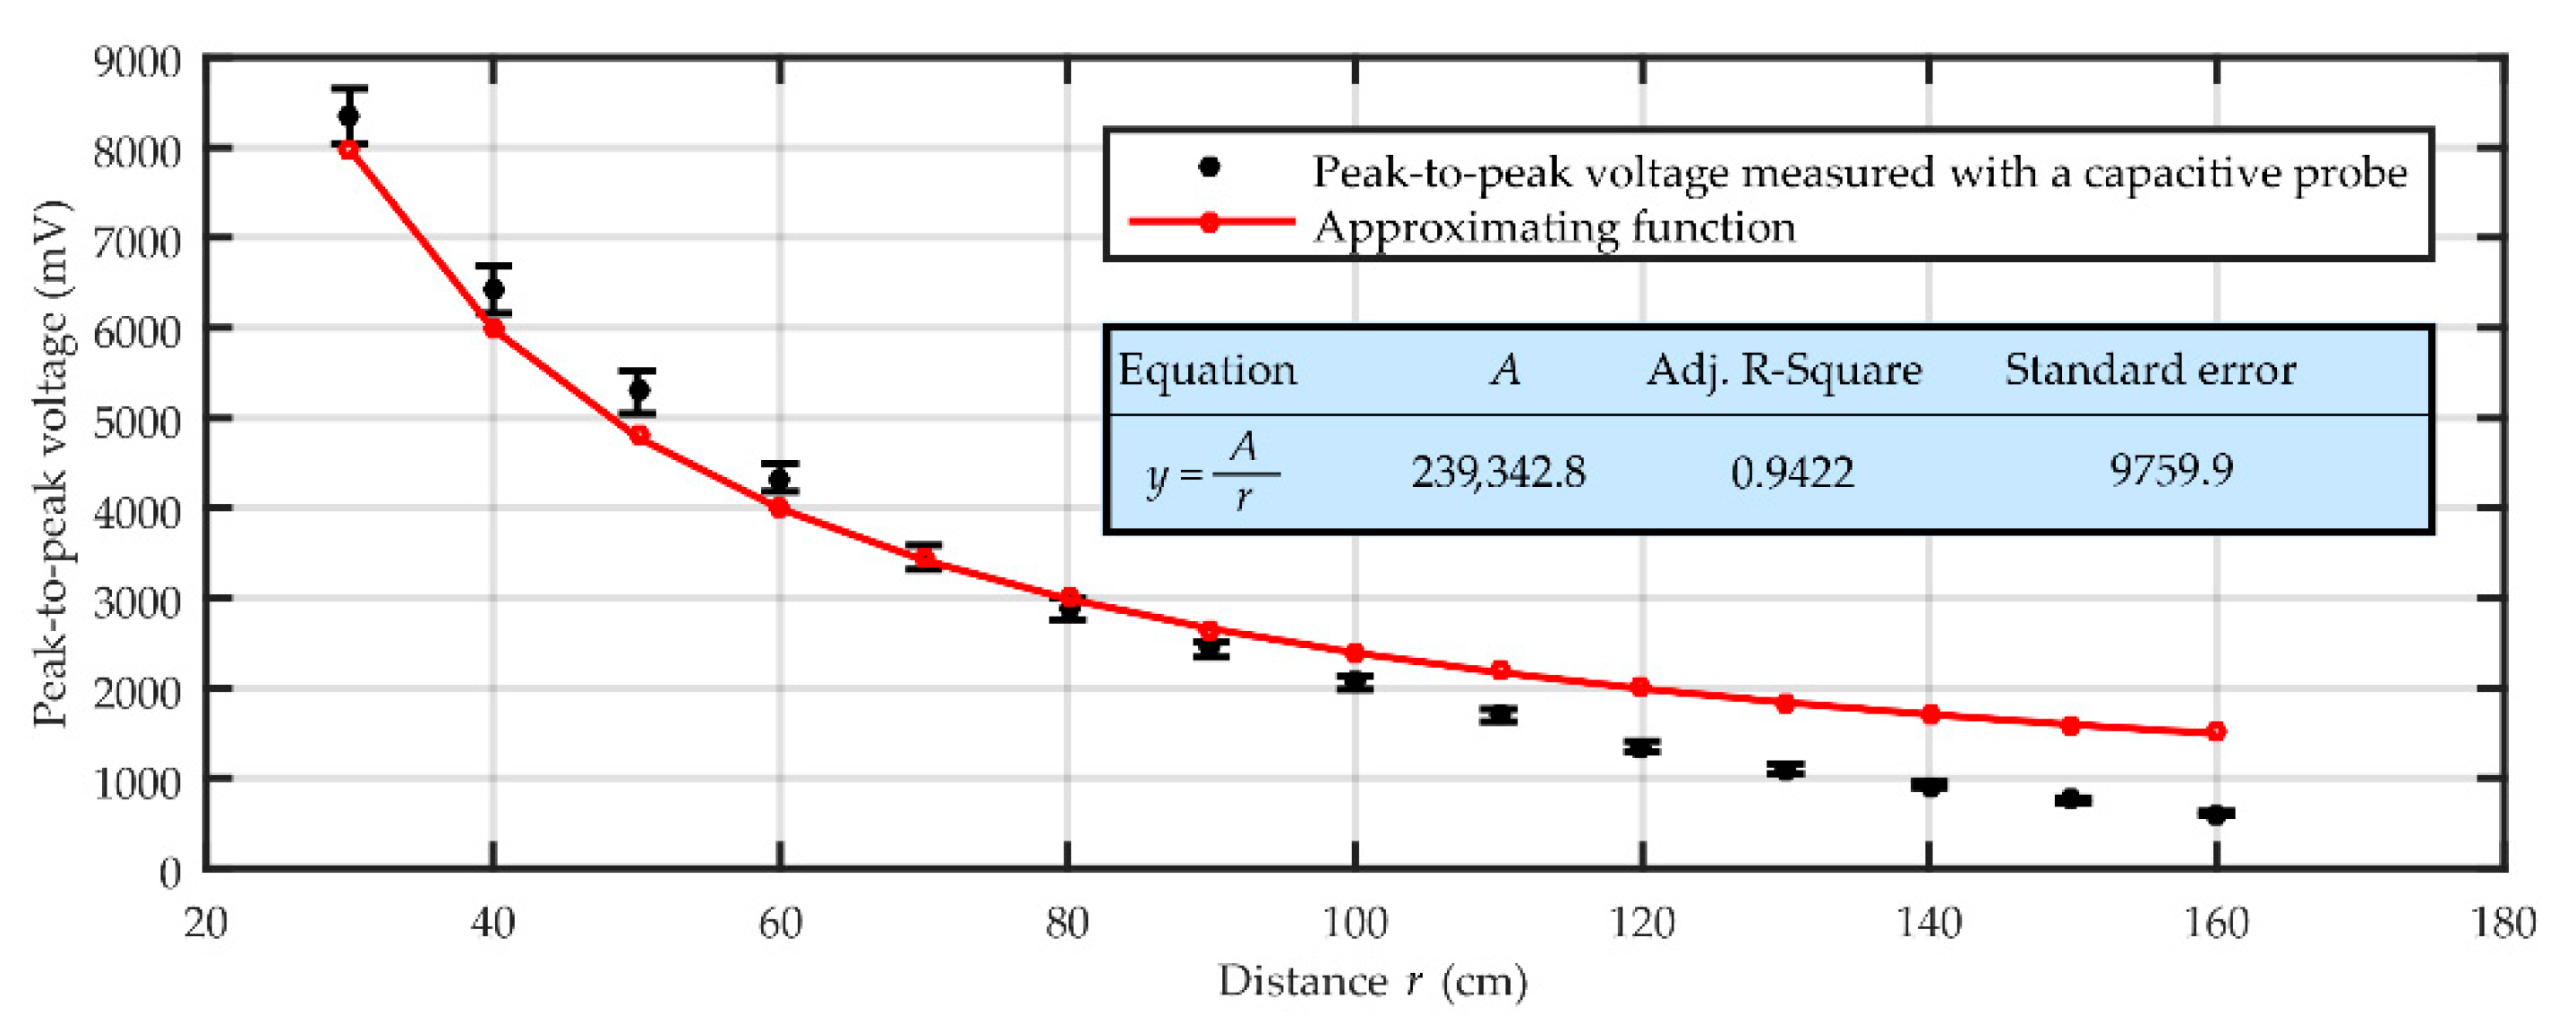
5. Distance Characteristics

When measuring the voltage with a capacitive probe in the near field, it should be taken into account that the distance between the source of the electromagnetic wave and the probe is of fundamental importance for the amplitude of the registered voltage signal. This is a direct result of the distribution of the electric field around the object on the potential. Using the classic example of a heterogeneous field in the sphere-to-plate electrode system (Figure 11), this relationship can be described by the formula:
V ( r ) = P 1 E d r = P 1 q 4 π ε 0 r 2 d r = q 4 π ε 0 r
where q is the total electric charge of the sphere and P1 is a point in space at a distance r from the center of the sphere.
The presented dependence V(r) = 1/r is a great simplification in relation to reality, but it illustrates well its general character. In order to verify the adopted hypothesis about the influence of distance on the voltage recorded by the capacitive probe, an experiment was carried out. Of course, due to the influence of many factors related to, for example, the vicinity of various types of live devices and earthed elements, the presented results of the experiment are primarily quantitative. Nevertheless, in the context of the described measurement method, their presentation in this article seems to be important.
The distance characteristics, i.e., the dependence of the amplitude of the signal recorded by the probe on the distance from the voltage source, was determined as follows: the capacitive probe was placed at a distance of r = (30–160) cm from a stable signal source, which was a spherical electrode with a diameter of 10 cm, supplied with an alternative current (AC) voltage with a frequency of 50 Hz (Figure 12). In order to obtain high accuracy, the distance of a given probe from the source was measured with a laser rangefinder. The effective value of the voltage generated by the test transformer was 25 kV. For the duration of the measurements, all unnecessary elements were removed from the HV test hall, which could somehow change the electric field distribution in the space between the capacitive probe and the spherical electrode. In addition, the probe was placed on an insulating tripod at a distance of 1.5 m from the ground.
Figure 13 shows the dependence of the amplitude of the voltage signal recorded with the capacitive probe on the distance r from the signal source. Additionally, the approximating function is shown according to the adopted equation:
y = A r
where A is the function parameter. The parameter A of the non-linear function A/r was determined in the OriginLab program using the Levenberg–Marquardt algorithm.
When analyzing Figure 13, it can be noticed that the applied approximating function (Equation (2)) correctly reflects the nature of the dependence of the amplitude of the signal recorded with the capacitive probe on the distance r. This is confirmed by the high value of the R2 coefficient, equal to 0.94. As previously mentioned, the obtained characteristic has little practical significance, but it allows us to show that the distance r of the capacitive probe from the monitored HV device is a parameter having a large impact on the value of the voltage ratio of the measuring system.

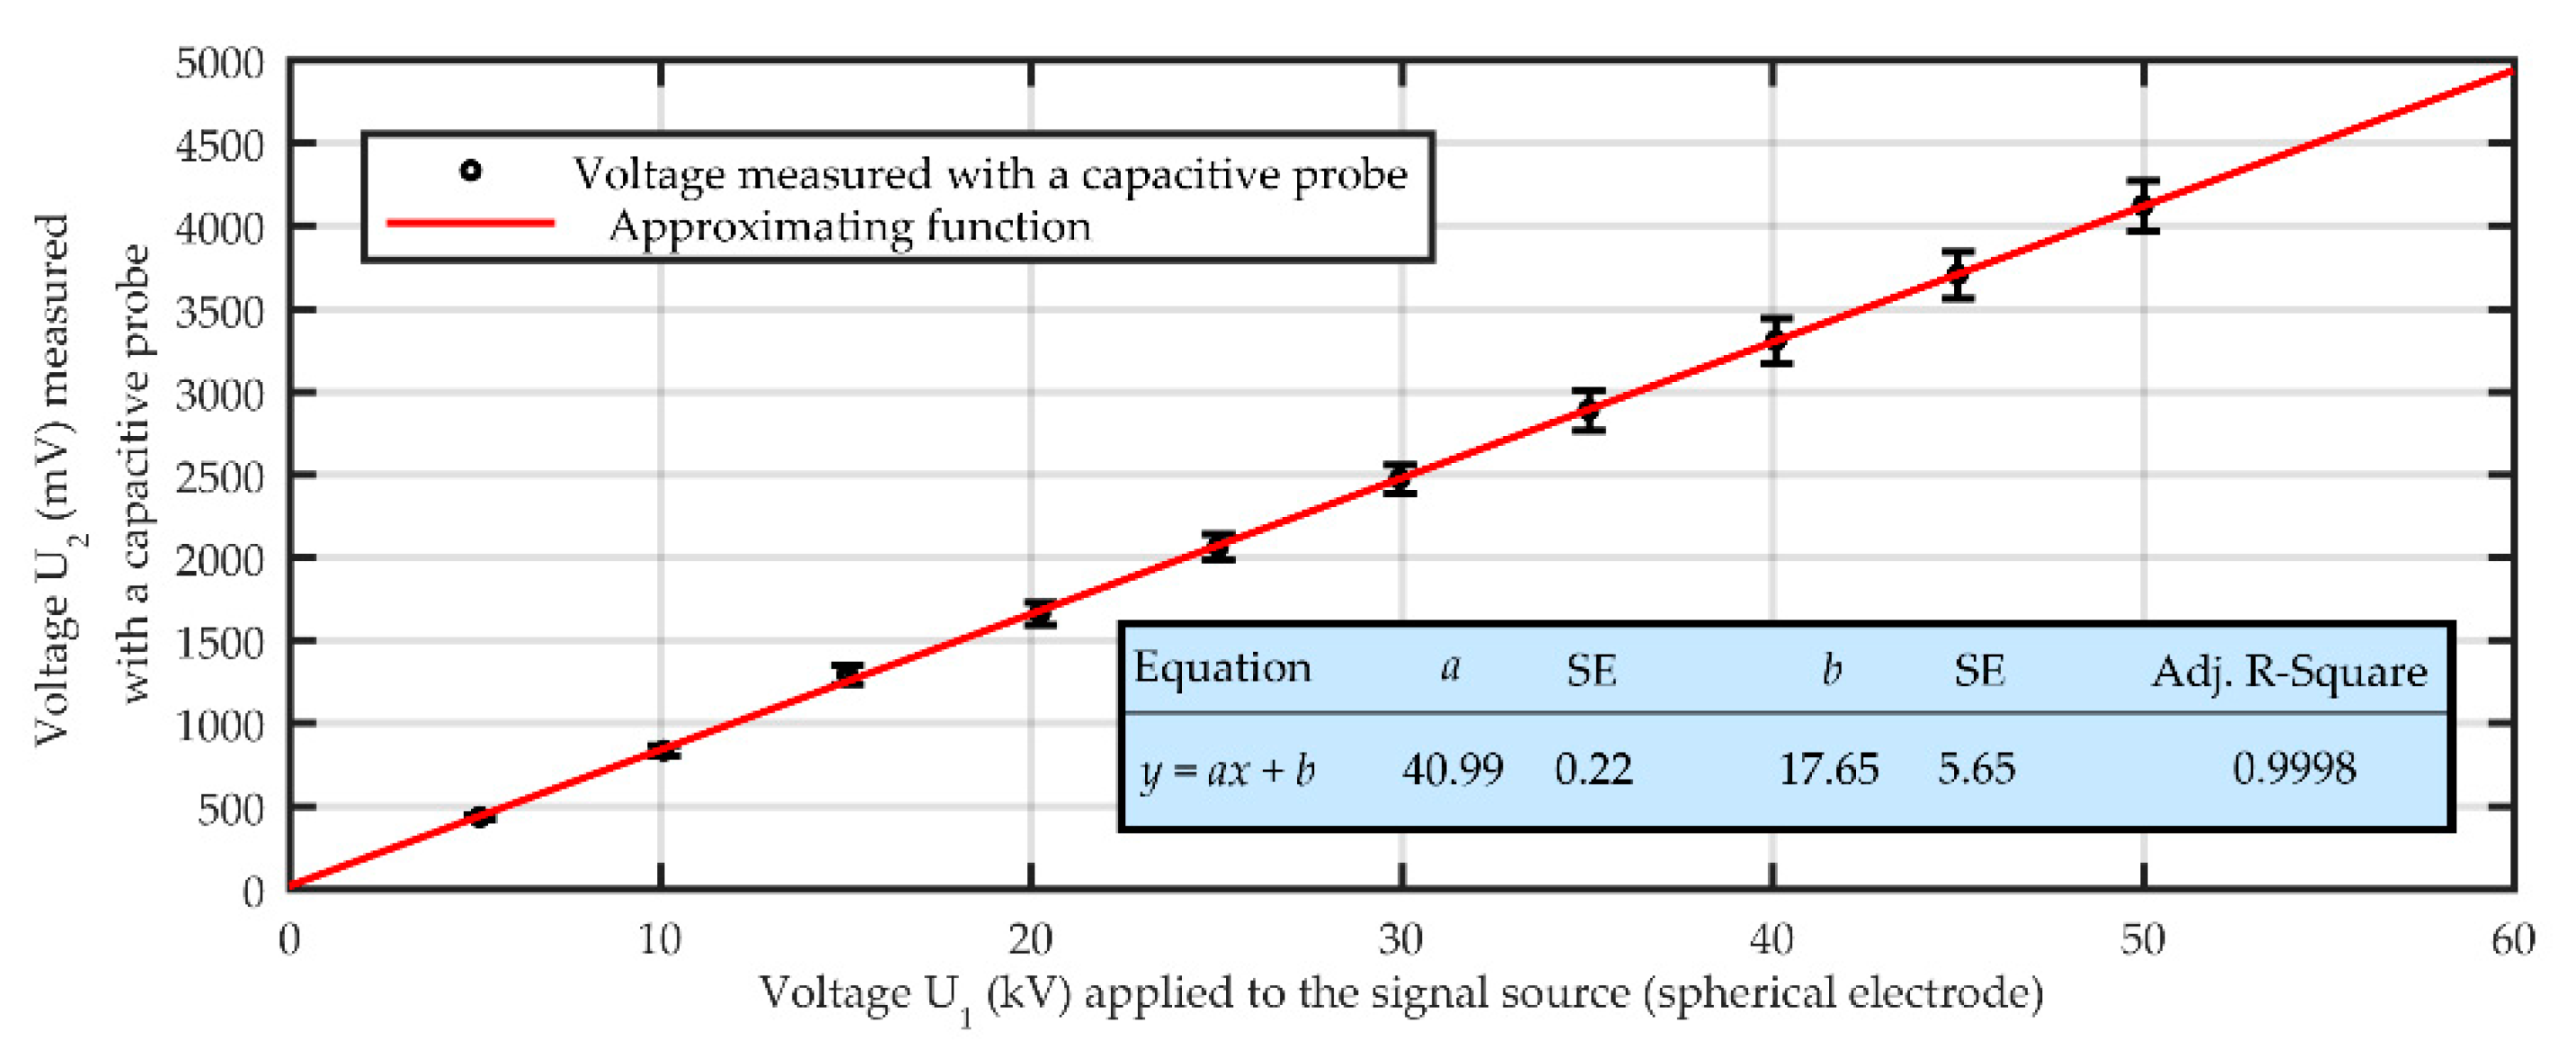
6. Linear Relationship between the Voltage U1 and U2

Equations (1) and (4) show that the relationship between the voltage U2 measured with the capacitive probe and the actual value of the voltage U1 present on the tested object is linear in the entire voltage range. To confirm this, tests were carried out with the use of the measurement setup previously used to study the distance characteristics (see Figure 12). The capacitive probe was placed 100 cm from the spherical electrode that was the source of the signal. The electrode was supplied with a voltage from 5 to 50 kV. The obtained measurement results are shown in Figure 14.
For the obtained measurement results, a linear regression analysis was performed using the York algorithm. The high value of the coefficient of determination (R2 = 0.9998) confirms that the applied linear function describes well (in the tested voltage range and for a given system configuration) the dependence of the voltage U2 measured with a capacitive probe on the actual voltage U1 prevailing on the object. This allows the use of a capacitive probe for non-contact (remote) high voltage measurement.

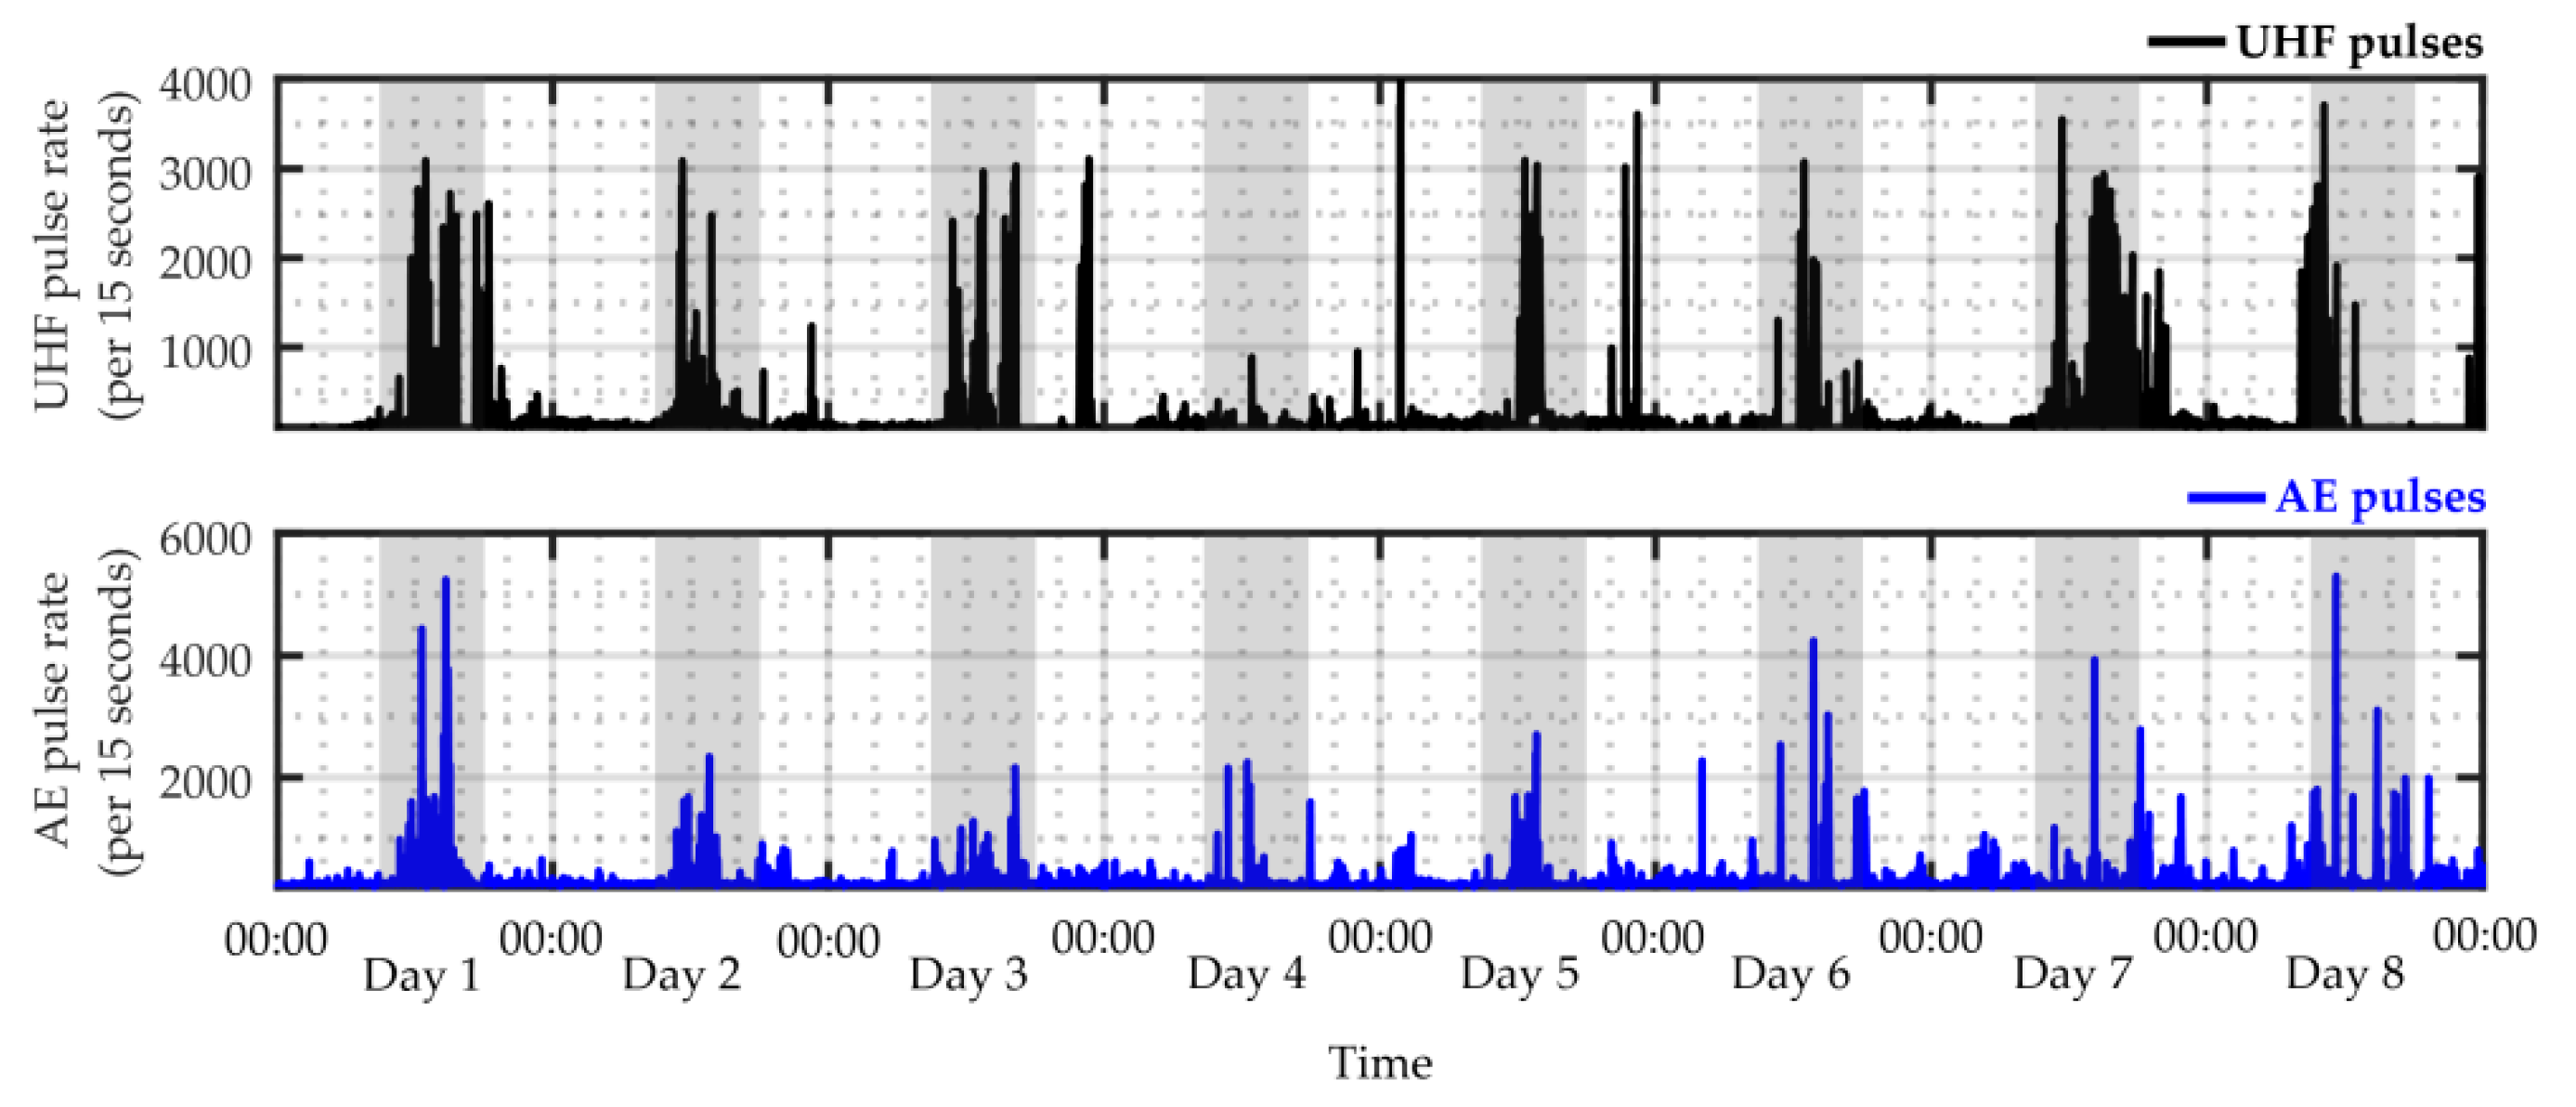
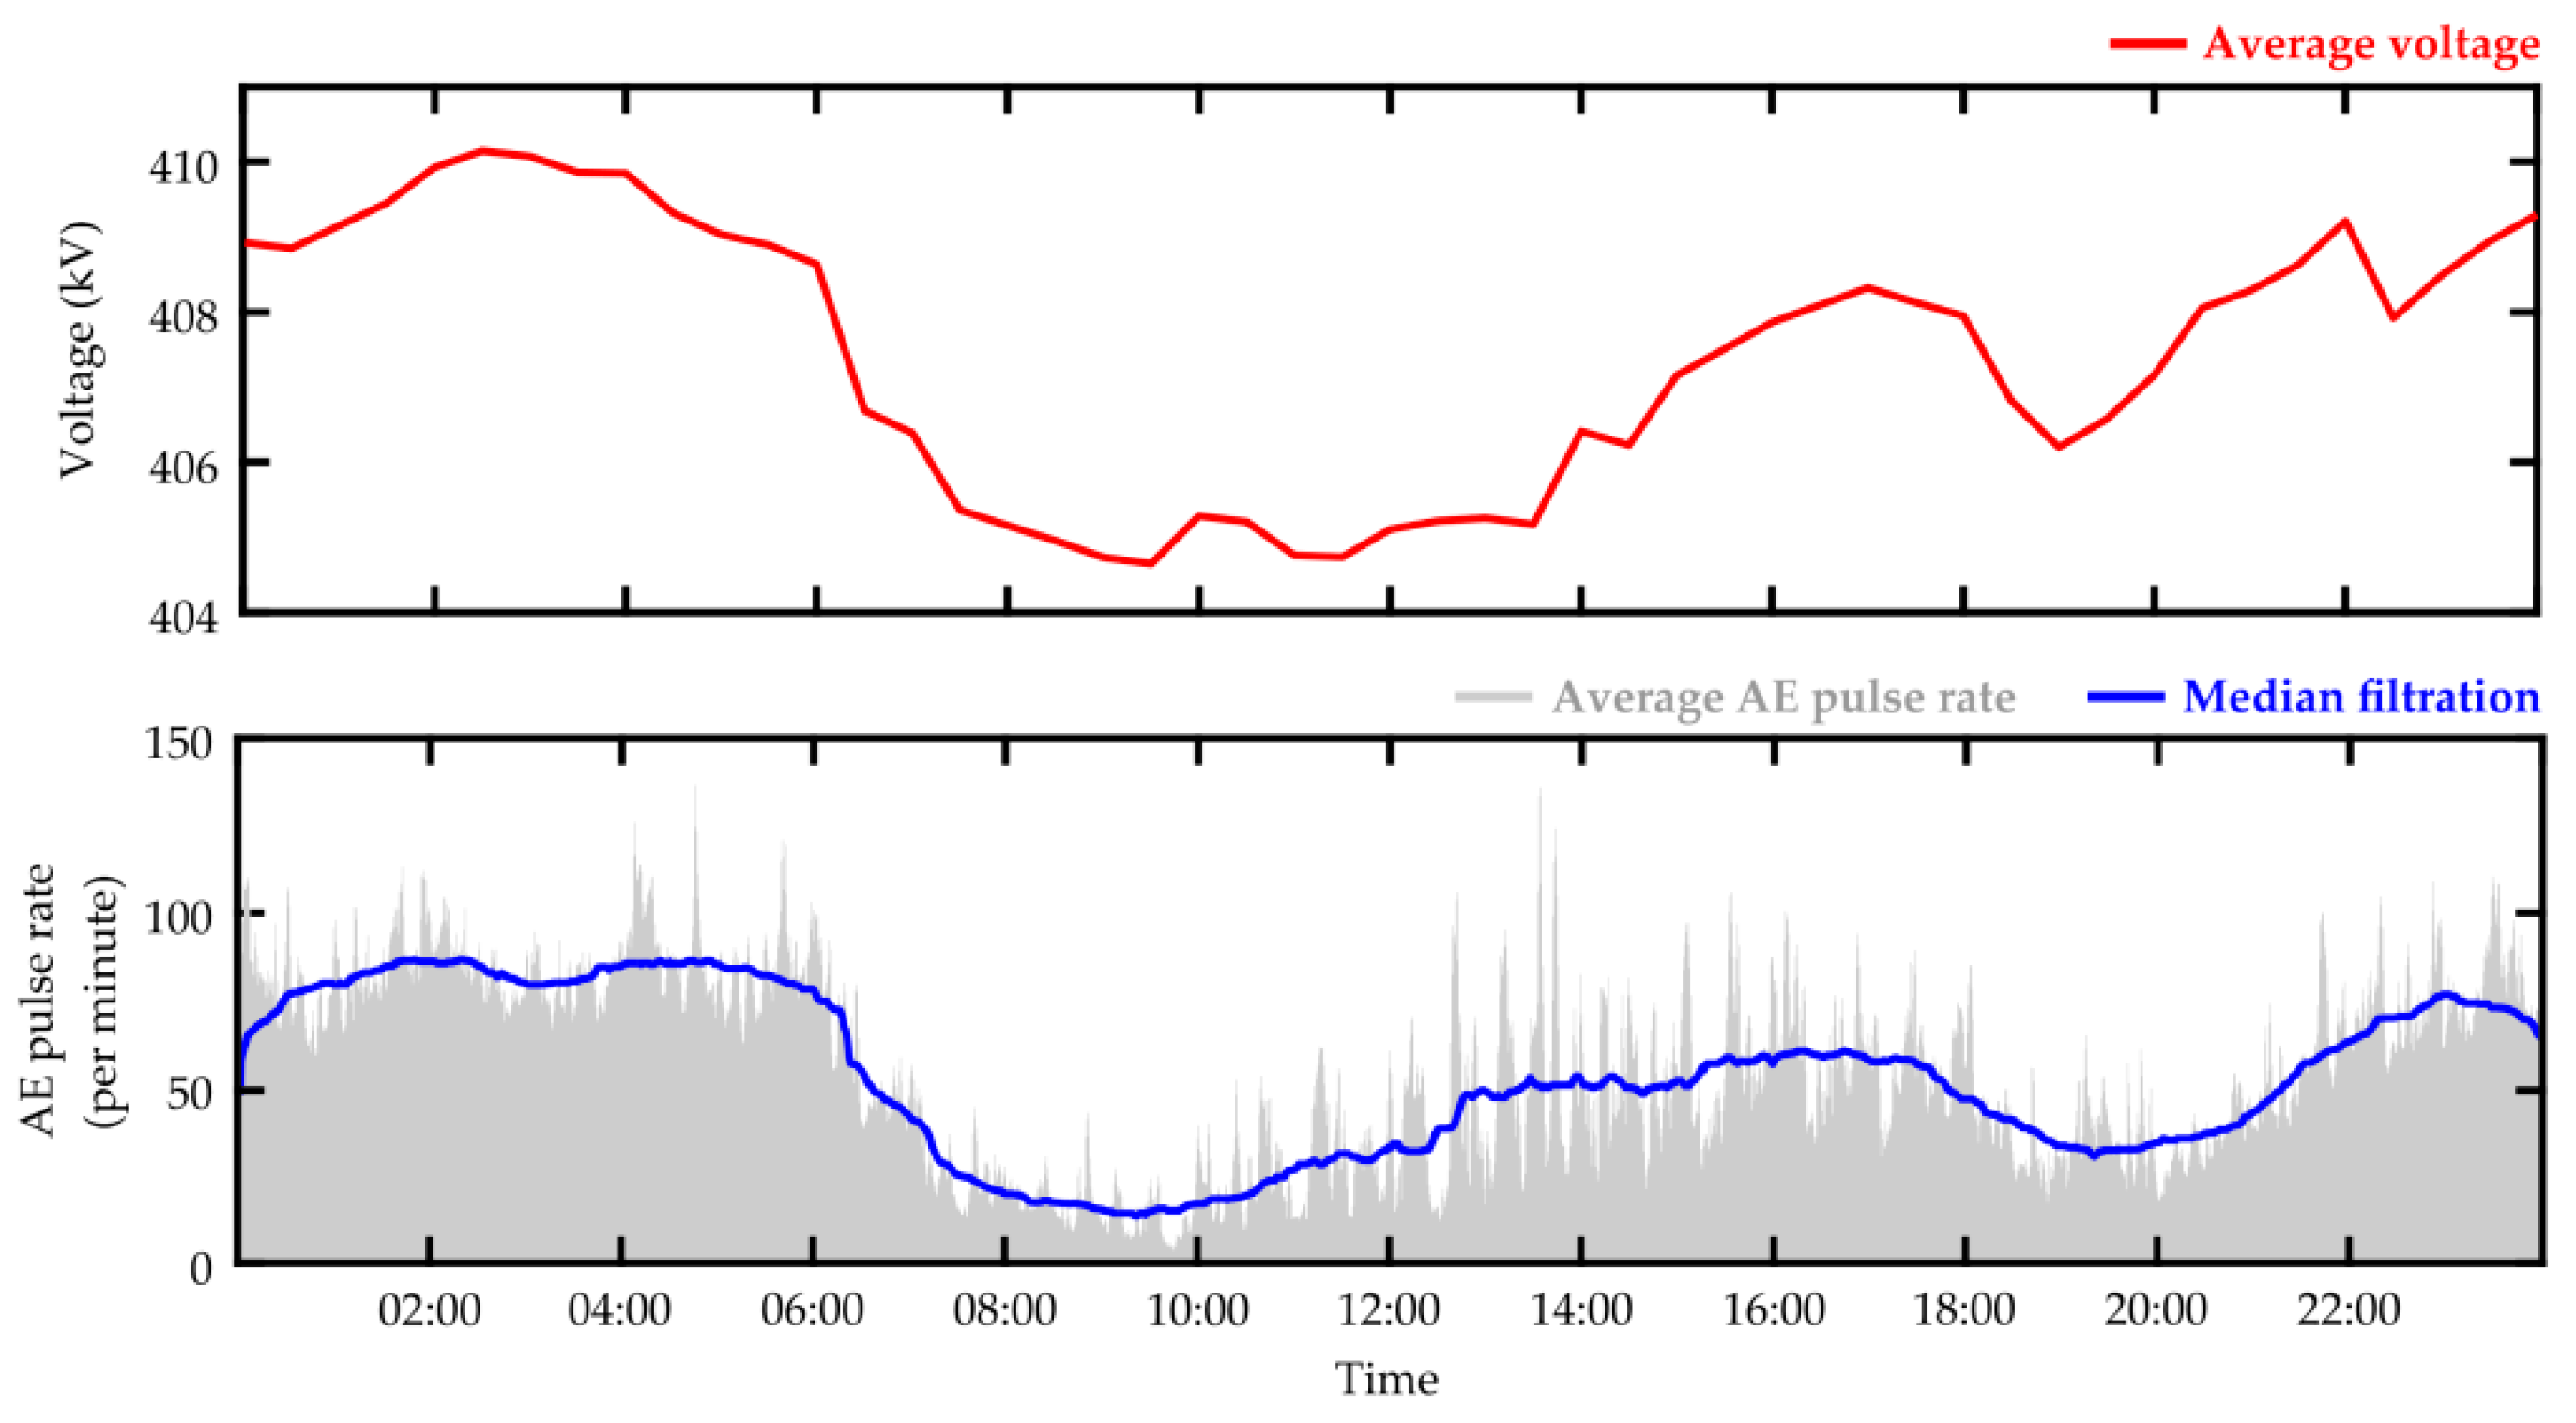
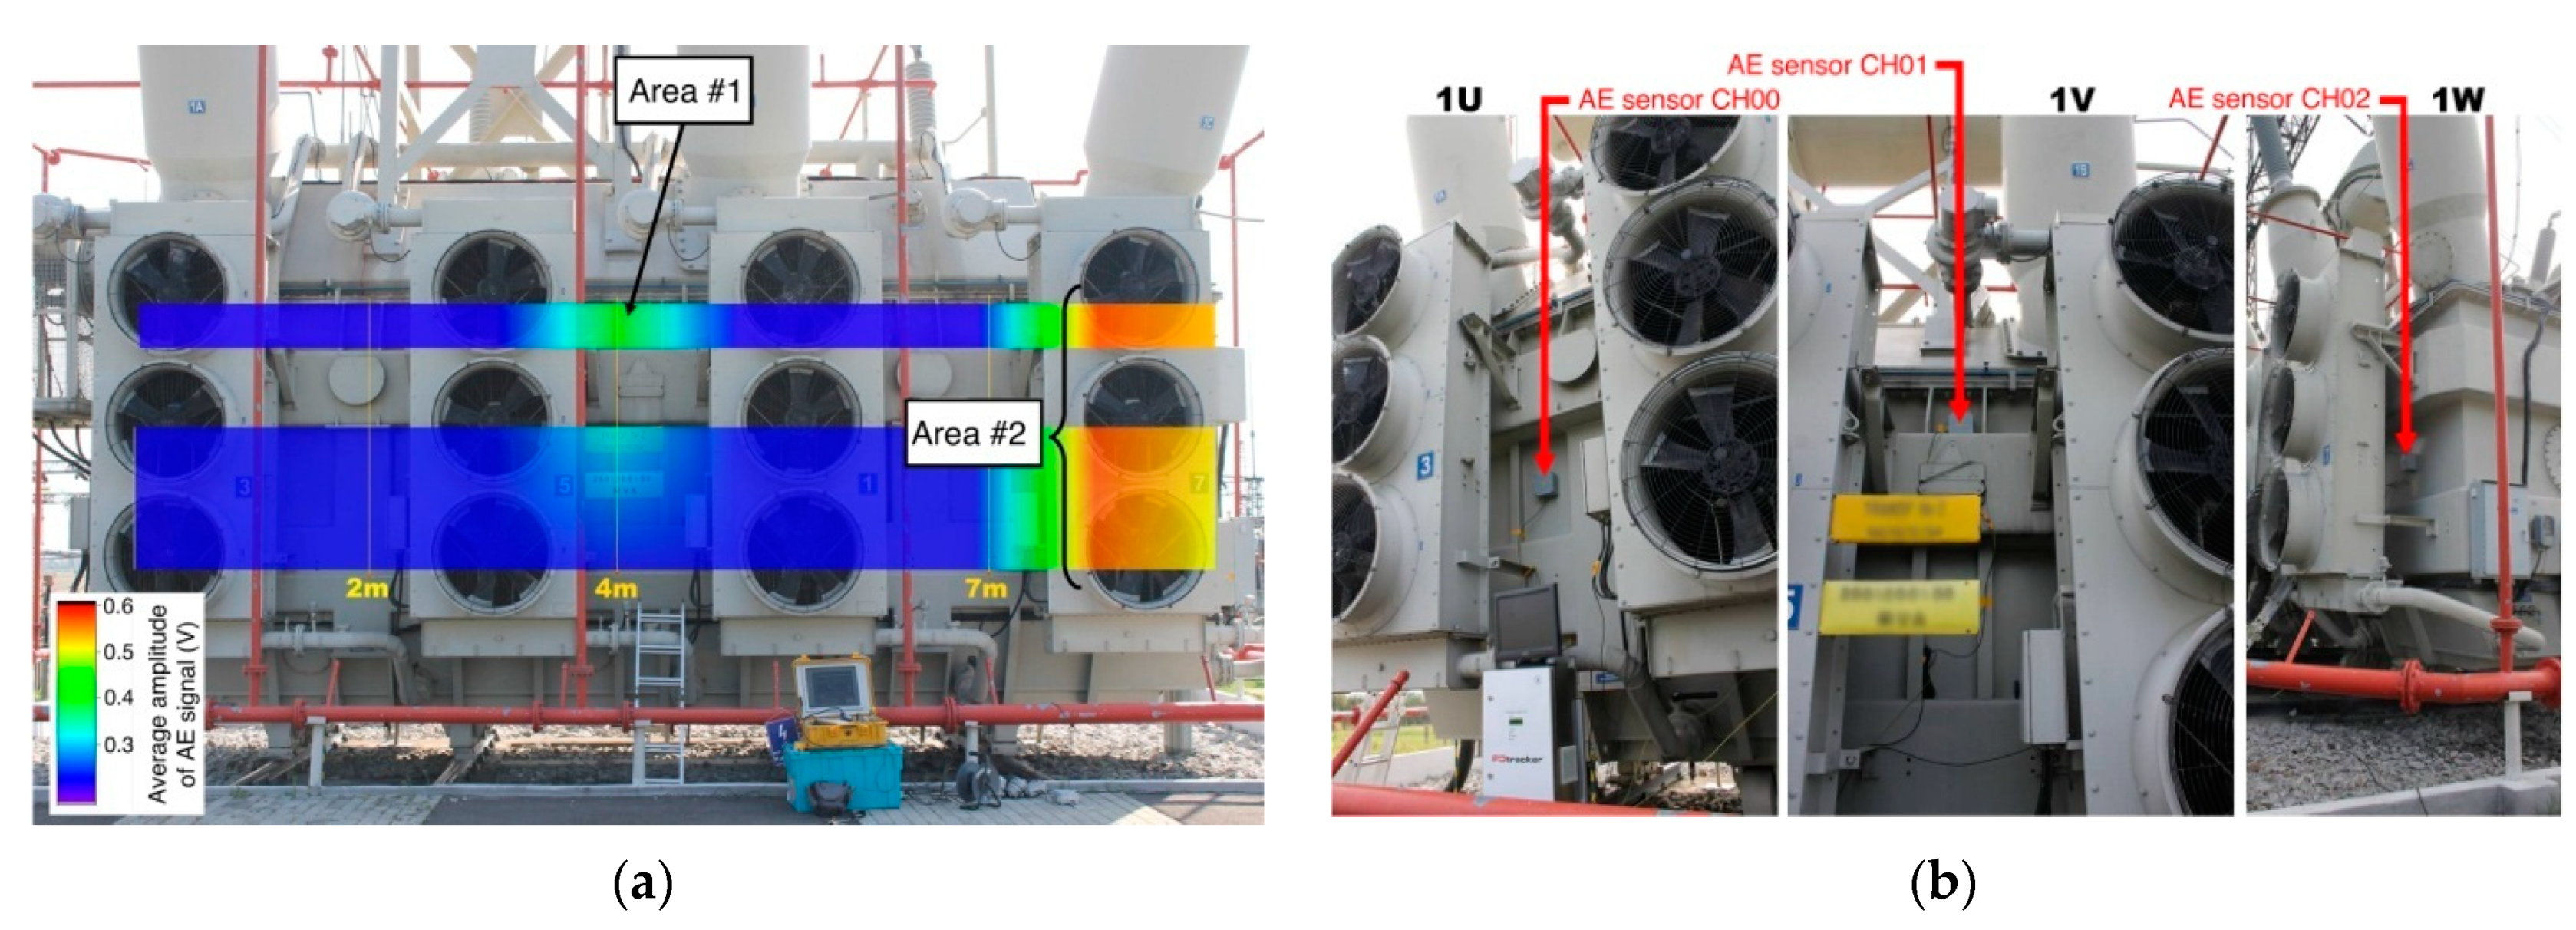
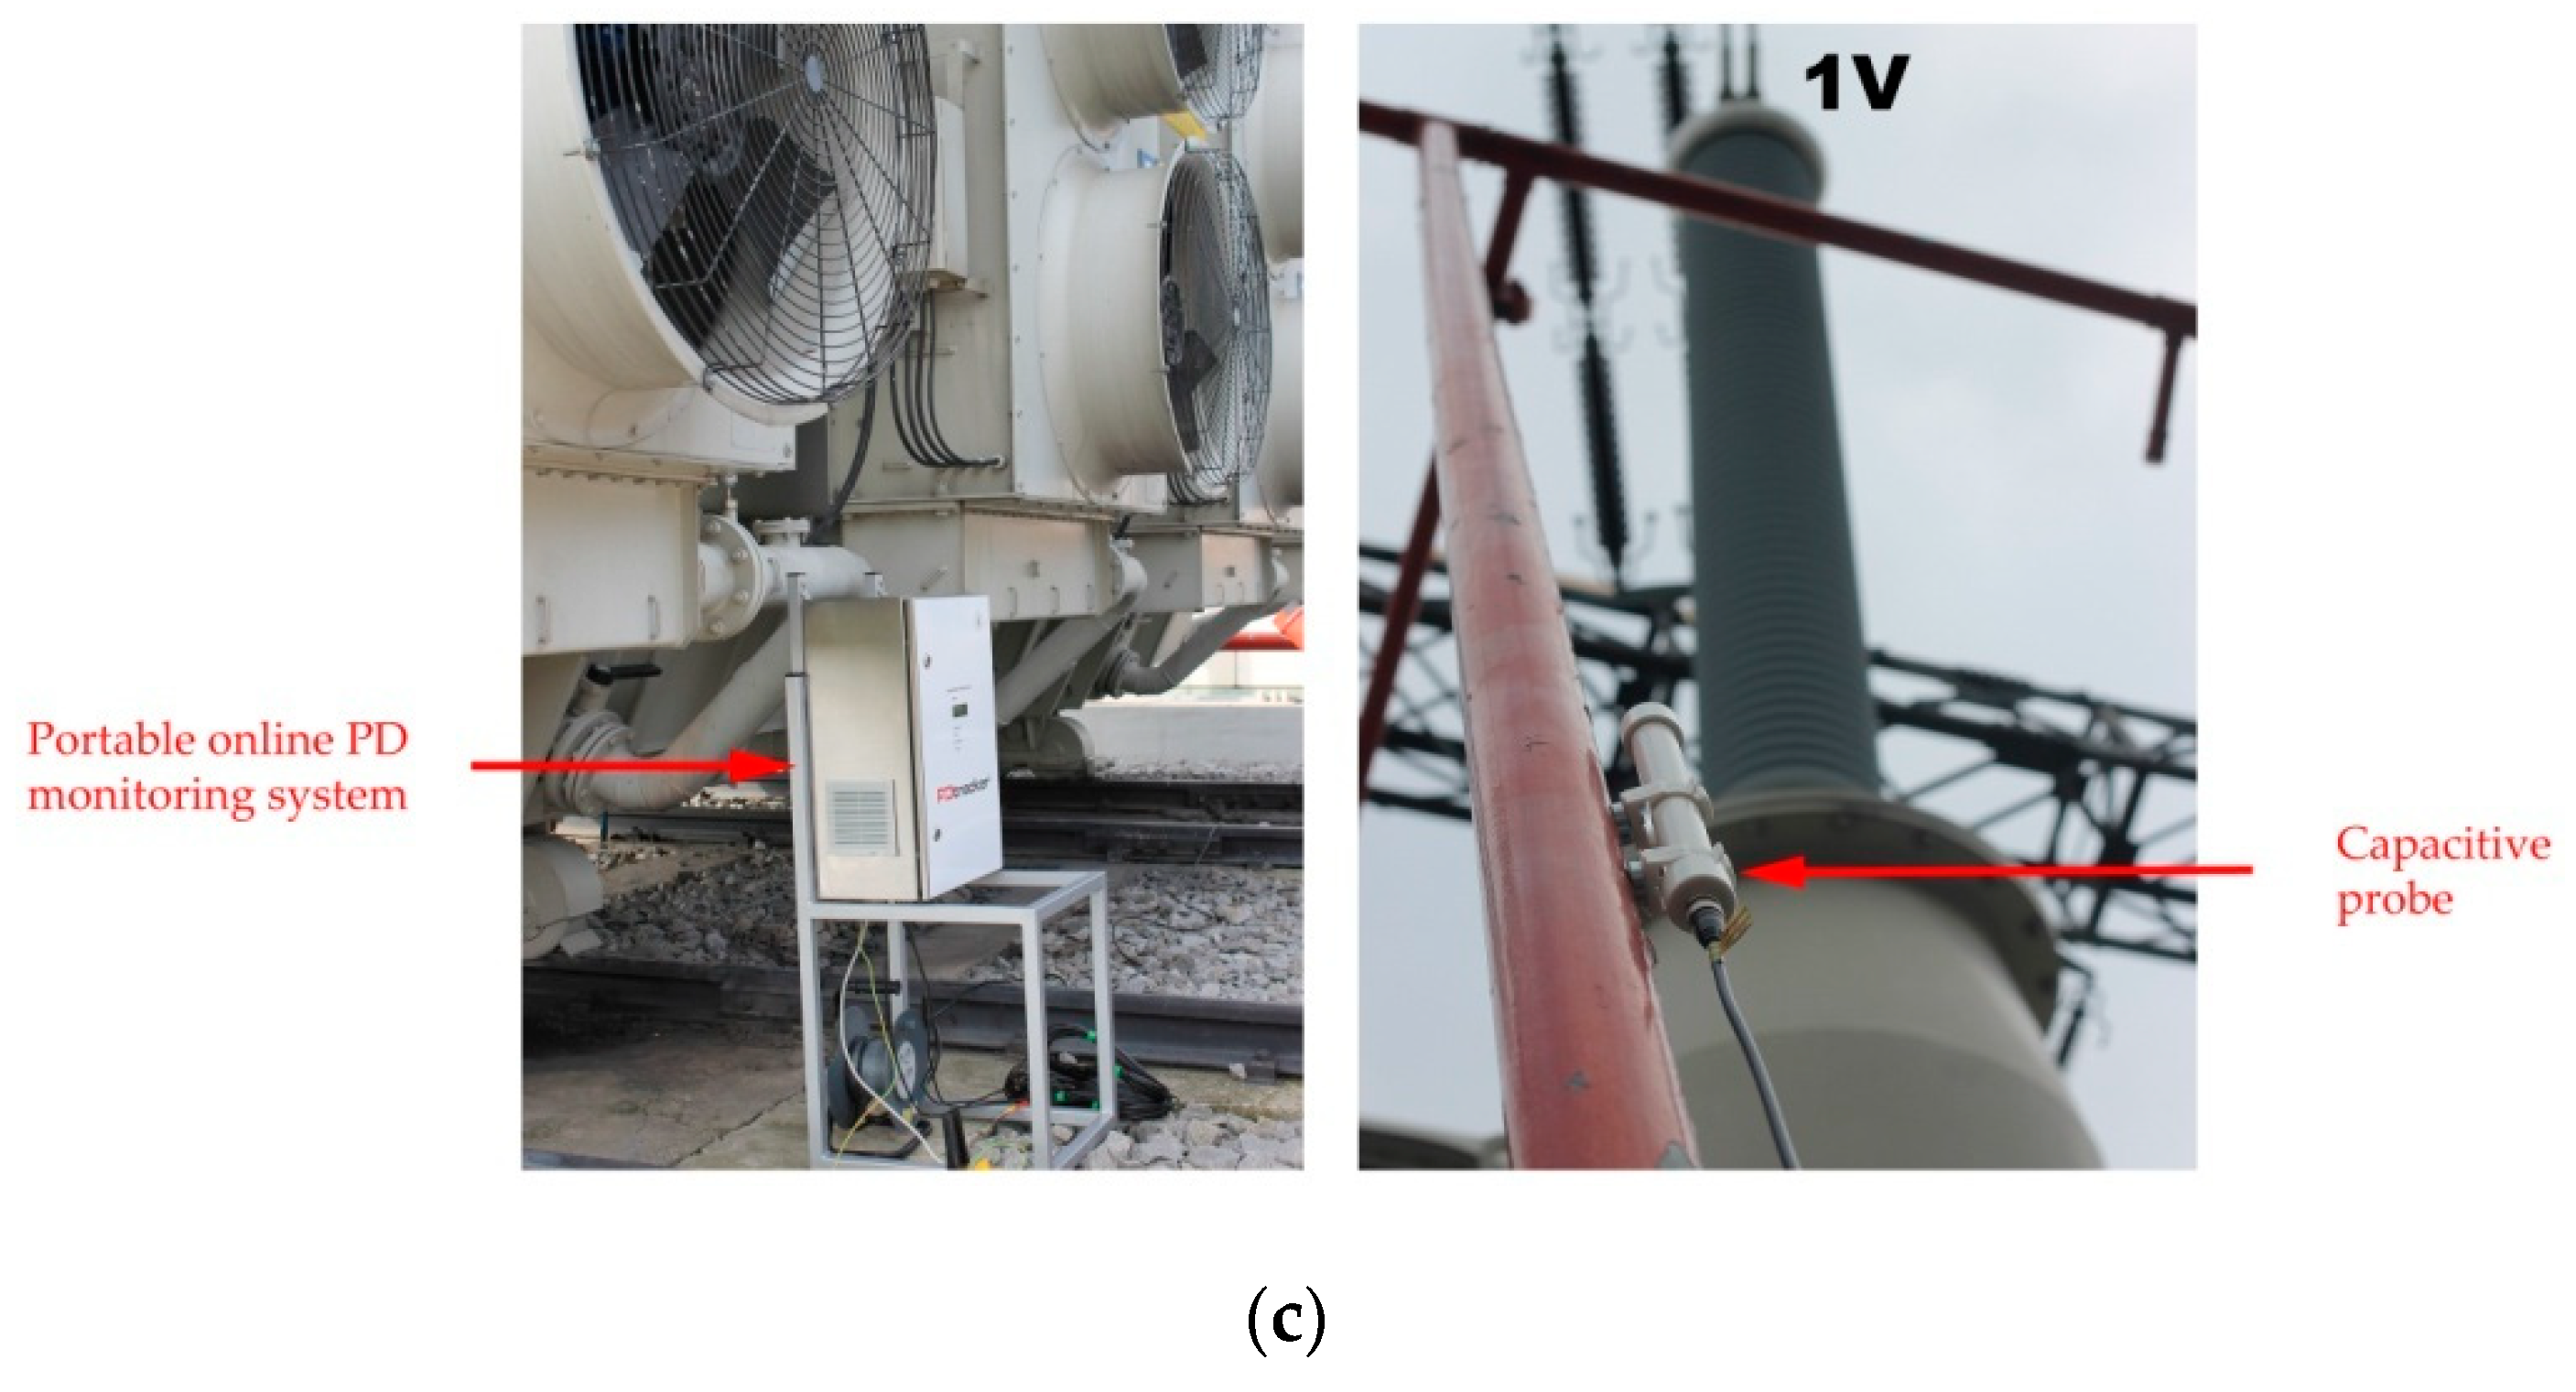
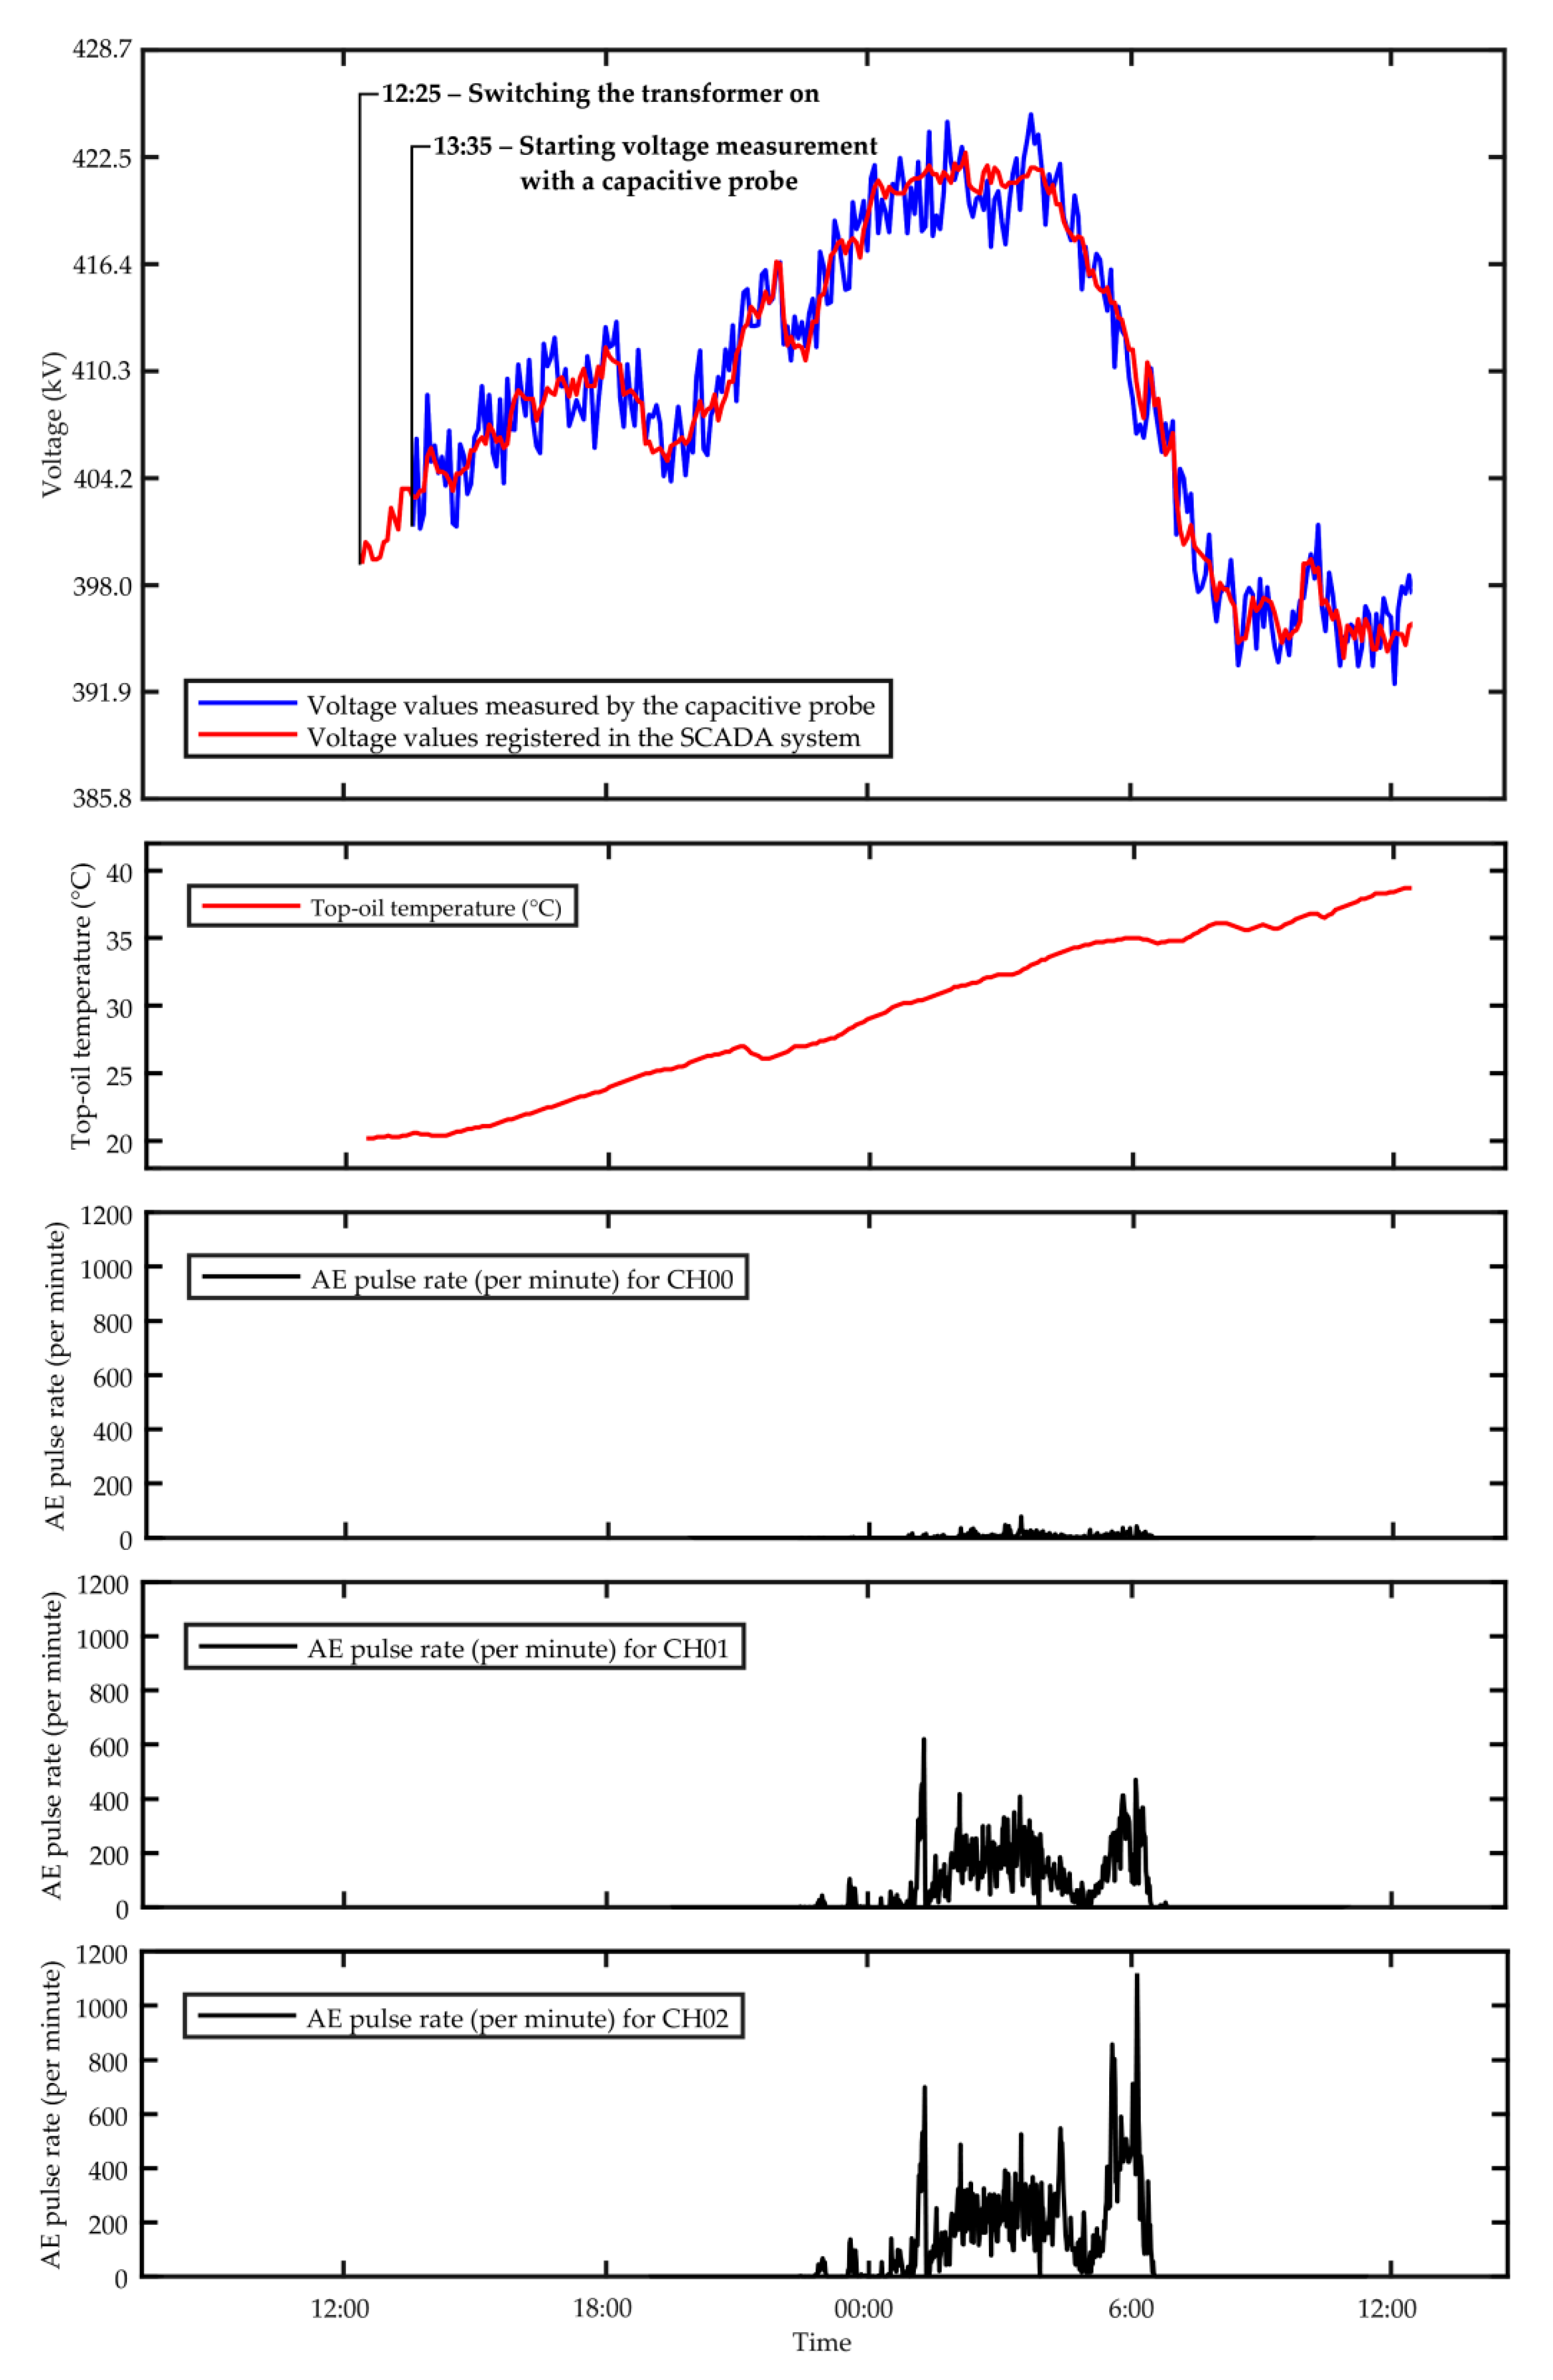
7. Application Example of the Non-Contact High Voltage Measurement Method in Online Partial Discharge Monitoring

The high voltage non-contact measurement module was first tested in the field during one-day monitoring of a 250 MVA power transformer. Before installing the monitoring system, the location of PD sources was carried out using a standard auscultatory technique, the assumptions of which are described in [37]. The analysis of the measurement results presented in the form of an acoustic map superimposed on the photo of the tested transformer (Figure 15a) showed the existence of two areas in which AE pulses of increased amplitude were recorded. In the first area, which was located directly in front of the upper part of the 1V phase windings, AE pulses with an average amplitude of approximately 350 mV were recorded. In the second area, which covered almost the entire height of the 1W phase winding, AE pulses with an average amplitude of approximately 600 mV were recorded (with the background noise at the level of 30–40 mV). Two piezoelectric AE sensors (CH01 and CH02) of the PDtracker monitoring system were installed in places where an increased amplitude of acoustic signals was found. The CH00 sensor (acting as the reference sensor) was installed close to the 1U phase, where no AE signals had been recorded during previous tests. The location and marking of the AE sensors are shown in Figure 15b. The capacitive probe for high voltage measurement was magnetically attached to one of the sprinkler pipes of the fire protection system, approximately 8 m from the connection point of the 400 kV transmission line with the transformer bushing of phase 1V (Figure 15c).
The installation of a portable PD monitoring system was caused by the alarming results of the analysis of gases dissolved in the oil. On the day that the PD localization was performed, the hydrogen level was 1116 ppm and the acetylene level was 216 ppm. Typical values for the concentrations of these gases given in the IEC 60599 standard are respectively 60–150 ppm for hydrogen and 3–50 ppm for acetylene. In order to avoid a failure, the owner of the transformer decided to turn it off. The transformer was restarted for one day only in order to perform online monitoring of partial discharges and confirm their presence in the insulation system.
The power transformer was started at 12:25, while the non-contact voltage measurement system module started recording at 13:35 (Figure 16). The maximum difference between the voltage measured with the capacitive probe and the voltage measured with the substation voltage transformer was 4.11 kV (1.02%), while the average difference was 1.34 kV (0.33%). These slight differences in voltage measurement were probably due to the imperfect filtration of external electromagnetic (EM) disturbances, the main source of which was corona discharge from HV transmission lines.
During the 24-h transformer monitoring, the voltage varied from 393.9 kV to 422.8 kV. At the moment of switching on the transformer for the test, the temperature of the upper oil layer was 20.2 °C, and at the end of the test, it reached the maximum value of 38.7 °C. The first PD pulses were registered almost 10 h after the start of the test. When analyzing the graphs shown in Figure 16, it can be seen that the period of increased intensity of the AE phenomenon coincided with the period in which the voltage on the transformer was the highest. The maximum voltage value in this period was 422.8 kV, which accounted for 105.7% of the transformer’s rated voltage. The monitoring system stopped recording the AE pulses when the voltage across the transformer dropped to 408.5 kV. This suggests that the phenomenon of partial discharges was the source of the recorded pulses of acoustic emission.
Summarizing the results of the conducted field test, it can be concluded that the proposed method based on a cheap and easy-to-build capacitive probe may be an alternative to typical, large-size devices for high voltage measurement. In addition, such a non-contact voltage measurement technique fits very well with the concept of short-term PD monitoring in a power transformer, using, e.g., the AE or UHF method because it does not require shutting down the tested unit for the time of installation of the module for HV measurement. In addition, it allows us to increase the diagnostic reliability of the monitoring system thanks to the possibility of correlating the intensity of PD with the voltage level.

8. Conclusions

The article presents an innovative system for measuring high voltage with the use of a capacitive probe. This system employs additional equipment of the portable partial discharge monitoring system in the power transformer to ensure its full autonomy and independence from the substation devices.
The article presents the concept of HV measurement with the use of a capacitive probe and a detailed analysis of the selection of the optimal solution was carried out. The developed monopole probe showed the best features taking into account both the electrical parameters and the design properties. Laboratory tests using a prototype capacitive probe allowed for the development of algorithms for determining the voltage ratio and measurement uncertainty. In laboratory conditions, the measurement uncertainty was in the range of 1–5%, which is a fully acceptable result for the remote (non-contact) method of HV measurement.
Finally, the results of the field tests are presented. The object of the research was a 250 MVA power transformer. The voltage measurements using the prototype system were compared with the voltage values recorded by the voltage transformer installed at the substation. The comparative test results showed that the maximum difference in measured voltage was only 4.11 kV (1.02%).
The developed measurement system allows for real-time recording of high voltage values in a safe and non-invasive manner. Importantly, installing the system near the transformer does not require shutting it down. Thanks to the use of advanced methods of digital filtration and noise reduction, the system can work effectively in the presence of strong EM interference. By measuring not only the maximum or root mean square (RMS) value of the voltage, but also by recording the voltage waveform (e.g., during one or more periods), it is possible to precisely correlate the PD activity with the phase angle and create phase-resolved partial discharge patterns (PRPD). Such PRPD images can then be used to recognize the type of defect that is the source of the PD and increase the reliability of the transformer condition diagnostics.

Author Contributions

Conceptualization, K.W. and W.S.; methodology, K.W.; software, K.W. and W.S.; validation, K.W. and W.S.; formal analysis, K.W.; investigation, K.W. and W.S.; resources, K.W. and W.S.; data curation, W.S.; writing—original draft preparation, K.W. and W.S.; writing—review and editing, K.W. and W.S.; visualization, W.S. All authors have read and agreed to the published version of the manuscript.

Funding

This work was supported by the Polish National Centre for Research and Development, within the Applied Research Programme, grant No. PBS3/A4/12/2015.

Conflicts of Interest

The authors declare no conflict of interest.

References

  1. Tenbohlen, S.; Jagers, J.; Vahidi, F.; Bastos, G.; Desai, B.; Diggin, B.; Fuhr, J.; Gebauer, J.; Krüger, M.; Lapworth, J.; et al. Transformer Reliability Survey; Technical Brochure 642; CIGRE: Paris, France, 2015. [Google Scholar]
  2. Foros, J.; Istad, M. Health Index, Risk and Remaining Lifetime Estimation of Power Transformers. IEEE Trans. Power Deliv. 2020, 35, 2612–2620. [Google Scholar] [CrossRef] [Green Version]
  3. Ortiz, F.; Fernandez, I.; Ortiz, A.; Renedo, C.J.; Delgado, F.; Fernandez, C. Health indexes for power transformers: A case study. IEEE Electr. Insul. Mag. 2016, 32, 7–17. [Google Scholar] [CrossRef] [Green Version]
  4. Orosz, T. Evolution and modern approaches of the power transformer cost optimization methods. Period. Polytech. Electr. Eng. Comput. Sci. 2019, 63, 37–50. [Google Scholar] [CrossRef] [Green Version]
  5. Martin, D.; Marks, J.; Saha, T.K.; Krause, O.; Mahmoudi, N. Investigation into modeling Australian power transformer failure and retirement statistics. IEEE Trans. Power Deliv. 2018, 33, 2011–2019. [Google Scholar] [CrossRef]
  6. Singh, J.; Singh, S.; Singh, A. Distribution transformer failure modes, effects and criticality analysis (FMECA). Eng. Fail. Anal. 2019, 99, 180–191. [Google Scholar] [CrossRef]
  7. Kapinos, J. Operating damages of bushings in power transformers. Trans. Electr. Eng. 2012, 1, 89–93. [Google Scholar]
  8. Kapinos, J.; Glinka, T.; Drak, B. Typical causes of operational failures in power transformers working in National Grid. Przegląd Elektrotechniczny 2014, 90, 186–189. [Google Scholar]
  9. Castro, B.; Clerice, G.; Ramos, C.; Andreoli, A.; Baptista, F.; Campos, F.; Ulson, J. Partial discharge monitoring in power transformers using low-cost piezoelectric sensors. Sensors 2016, 16, 1266. [Google Scholar] [CrossRef] [Green Version]
  10. Chai, H.; Phung, B.T.; Mitchell, S. Application of UHF sensors in power system equipment for partial discharge detection: A review. Sensors 2019, 19, 1029. [Google Scholar] [CrossRef] [Green Version]
  11. Tenbohlen, S.; Beltle, M.; Siegel, M. PD monitoring of power transformers by UHF sensors. In Proceedings of the International Symposium on Electrical Insulating Materials (ISEIM), Toyohashi, Japan, 12–15 September 2017; Volume 1, pp. 303–306. [Google Scholar]
  12. Sikorski, W.; Walczak, K.; Gil, W.; Szymczak, C. On-Line partial discharge monitoring system for power transformers based on the simultaneous detection of high frequency, ultra-high frequency, and acoustic emission signals. Energies 2020, 13, 3271. [Google Scholar] [CrossRef]
  13. Judd, M.D.; Yang, L.; Hunter, I.B.B. Partial discharge monitoring of power transformers using UHF sensors. Part I: Sensors and signal interpretation. IEEE Electr. Insul. Mag. 2005, 21, 5–14. [Google Scholar] [CrossRef]
  14. Álvarez, F.; Garnacho, F.; Ortego, J.; Sánchez-Urán, M.Á. Application of HFCT and UHF sensors in on-line partial discharge measurements for insulation diagnosis of high voltage equipment. Sensors 2015, 15, 7360–7387. [Google Scholar] [CrossRef] [Green Version]
  15. Jahangir, H.; Akbari, A.; Werle, P.; Szczechowski, J. UHF PD measurements on power transformers-advantages and limitations. IEEE Trans. Dielectr. Electr. Insul. 2017, 24, 3933–3940. [Google Scholar] [CrossRef]
  16. Polak, F.; Sikorski, W.; Siodla, K. Location of partial discharges sources using sensor arrays. In Proceedings of the 2014 ICHVE International Conference on High Voltage Engineering and Application, Poznan, Poland, 8–11 September 2014; pp. 1–4. [Google Scholar] [CrossRef]
  17. Jiang, J.; Chen, J.; Li, J.; Yang, X.; Albarracín-Sánchez, R.; Ranjan, P.; Zhang, C. Propagation and localisation of partial discharge in transformer bushing based on ultra-high frequency technique. High Volt. 2021, 6, 684–692. [Google Scholar] [CrossRef]
  18. Sikorski, W. Active dielectric window: A new concept of combined acoustic emission and electromagnetic partial discharge detector for power transformers. Energies 2019, 12, 115. [Google Scholar] [CrossRef] [Green Version]
  19. Beura, C.P.; Beltle, M.; Tenbohlen, S. Study of the Influence of Winding and Sensor Design on Ultra-High Frequency Partial Discharge Signals in Power Transformers. Sensors 2020, 20, 5113. [Google Scholar] [CrossRef] [PubMed]
  20. IEEE Guide for the Detection and Location of Acoustic Emissions from Partial Discharges in Oil-Immersed Power Transformers and Reactors. In IEEE Std C57.127-2007 (Revision of IEEE Std C57.127-2000); Institute of Electrical and Electronics Engineers: Piscataway, NJ, USA, 31 August 2007.
  21. Sikorski, W.; Szymczak, C.; Siodla, K.; Polak, F. Hilbert curve fractal antenna for detection and on-line monitoring of partial discharges in power transformers. Eksploat. Niezawodn.—Maint. Reliab. 2018, 20, 343–351. [Google Scholar] [CrossRef]
  22. CIGRE. CIGRE WG D 1.33, Guidelines for Unconventional Partial Discharge Measurements; CIGRE Technical Brochure TB 444; CIGRE: Paris, France, 2010. [Google Scholar]
  23. Sikorski, W.; Walczak, K. PDtracker—On-line partial discharge monitoring system for power transformers. Przegląd Elektrotechniczny 2014, 90, 45–49. [Google Scholar]
  24. DelleFemine, A.; Gallo, D.; Landi, C.; Lo Schiavo, A.; Luiso, M. Low Power Contactless Voltage Sensor for Low Voltage Power Systems. Sensors 2019, 19, 3513. [Google Scholar] [CrossRef] [Green Version]
  25. Ma, G.; Wang, Y.; Qin, W.; Zhou, H.; Yan, C.; Jiang, J.; Ju, Y. Optical sensors for power transformer monitoring: A review. High Voltage 2020, 6, 367–386. [Google Scholar] [CrossRef]
  26. Sun, X.; Huang, Q.; Hou, Y.; Jiang, L.; Pong, P.W.T. Noncontact operation-state monitoring technology based on magnetic-field sensing for overhead high-voltage transmission lines. IEEE Trans. Power Deliv. 2013, 28, 2145–2153. [Google Scholar] [CrossRef] [Green Version]
  27. Sima, W.; Han, R.; Yang, Q.; Sun, S.; Liu, T. Dual LiNbO3 Crystal-Based Batteryless and Contactless Optical Transient Overvoltage Sensor for Overhead Transmission Line and Substation Applications. IEEE Trans. Ind. Electron. 2017, 64, 7323–7332. [Google Scholar] [CrossRef]
  28. Bobowski, J.S.; Ferdous, M.S.; Johnson, T. Calibrated single-contactvoltage sensor for high-voltage monitoring applications. IEEE Trans. Instrum. Meas. 2015, 64, 923–934. [Google Scholar] [CrossRef]
  29. Walczak, K. Wireless voltage measurement on test stand in high voltage laboratory. Przegląd Elektrotechniczny 2008, 10, 207–209. [Google Scholar]
  30. Zhu, K.; Lee, W.K.; Pong, P.W.T. Non-Contact Voltage Monitoring of HVDC Transmission Lines Based on Electromagnetic Fields. IEEE Sens. J. 2019, 19, 3121–3129. [Google Scholar] [CrossRef]
  31. Kuffel, J.; Kuffel, P. High Voltage Engineering Fundamentals; Elsevier: Amsterdam, The Netherlands, 2000. [Google Scholar]
  32. Gülmez, Y.; Özkan, T.; Gülmez, G.; Turhan, E. A microwave system for humidity measurements. In Proceedings of the 2012 Conference on Precision Electromagnetic Measurements, Washington, DC, USA, 1–6 July 2012; pp. 652–653. [Google Scholar] [CrossRef]
  33. Sikorski, W. Development of Acoustic Emission Sensor Optimized for Partial Discharge Monitoring in Power Transformers. Sensors 2019, 19, 1865. [Google Scholar] [CrossRef] [Green Version]
  34. Donoho, D.L. De-noising by soft-thresholding. IEEE Trans. Inf. Theory 1995, 41, 613–627. [Google Scholar] [CrossRef] [Green Version]
  35. Donoho, D.L.; Johnstone, I.M. Threshold selection for wavelet shrinkage of noisy data. In Proceedings of the 16th Annual International Conference of the IEEE Engineering in Medicine and Biology Society, Baltimore, MD, USA, 3–6 November 1994; Volume 1, pp. A24–A25. [Google Scholar]
  36. High-Voltage Test Techniques—Part 2: Measuring Systems; IEC: Geneva, Switzerland, 2010.
  37. Sikorski, W.; Siodla, K.; Moranda, H.; Ziomek, W. Location of partial discharge sources in power transformers based on advanced auscultatory technique. IEEE Trans. Dielectr. Electr. Insul. 2012, 19, 1948–1956. [Google Scholar] [CrossRef]
Figure 1. The result of the eight-day monitoring of the 31.5 MVA power transformer with the simultaneous use of the acoustic emission (AE) and ultrahigh frequency (UHF) method.
Energies 14 05777 g001
Figure 2. Daily distribution of average voltage values and average AE pulse rate obtained from 30 days of monitoring of a 330 MVA power transformer.
Energies 14 05777 g002
Figure 3. Schematic diagram of non-contact high voltage measurement with the use of a capacitive probe for an autonomous online partial discharge monitoring system.
Energies 14 05777 g003
Figure 4. Equivalent circuit of the measuring system: (a) simplified, (b) detailed, where: C1—coupling capacitance between the probe and the tested object, Cp—probe capacitance, Cc—coaxial cable capacitance, Cs—voltmeter input capacitance, and Rs—voltmeter resistance.
Energies 14 05777 g004
Figure 5. Construction of a capacitive probe for non-contact high voltage measurement: (a) 3D schematic diagram; (b) technical drawing with dimensions in mm.
Energies 14 05777 g005
Figure 6. Comparison of voltage waveforms recorded in the system with and without a voltage follower.
Energies 14 05777 g006
Figure 7. Schematic diagram of non-contact high voltage measurement with the use of a capacitive probe for an autonomous online partial discharge monitoring system.
Energies 14 05777 g007
Figure 8. Photo of the online PD monitoring system and the components of the non-contact high voltage measurement module.
Energies 14 05777 g008
Figure 9. Graphical user interface in the program for configuration, control, and visualization of the high voltage measurement process.
Energies 14 05777 g009
Figure 10. Example of two-stage filtering of a raw voltage signal using an averaging filter and a Butterworth low-pass filter.
Energies 14 05777 g010
Figure 11. Distribution of electric field strength E and potential V in a heterogeneous sphere-to-plate system.
Energies 14 05777 g011
Figure 12. Measurement setup for determining the dependence of the signal amplitude received by the capacitive probe on the distance r from the signal source (spherical HV electrode).
Energies 14 05777 g012
Figure 13. Measured dependence of the amplitude of the voltage signal registered by the capacitive probe on the distance r from the signal source and its approximating function.
Energies 14 05777 g013
Figure 14. Linear relationship between the voltage U2 measured with the capacitive probe and the actual value of the voltage U1 present on the tested HV object.
Energies 14 05777 g014
Figure 15. The tested 250 MVA power transformer: (a) The result of PD localization using a standard auscultatory technique (SAT), (b) arrangement of AE sensors on the transformer tank selected based on the obtained PD location results using the SAT method, and (c) photo of the portable PD monitoring system installed on the tested transformer and the place of mounting the capacitive probe for non-contact high voltage measurement.
Energies 14 05777 g015aEnergies 14 05777 g015b
Figure 16. Voltage values measured with a capacitive probe and substation voltage transformer, the top-oil temperature, and the number of AE pulses recorded by three piezoelectric transducers (CH00, CH01, CH02) during 24-h online monitoring of the 250 MVA power transformer.
Energies 14 05777 g016
Publisher’s Note: MDPI stays neutral with regard to jurisdictional claims in published maps and institutional affiliations.

