2. Research Status
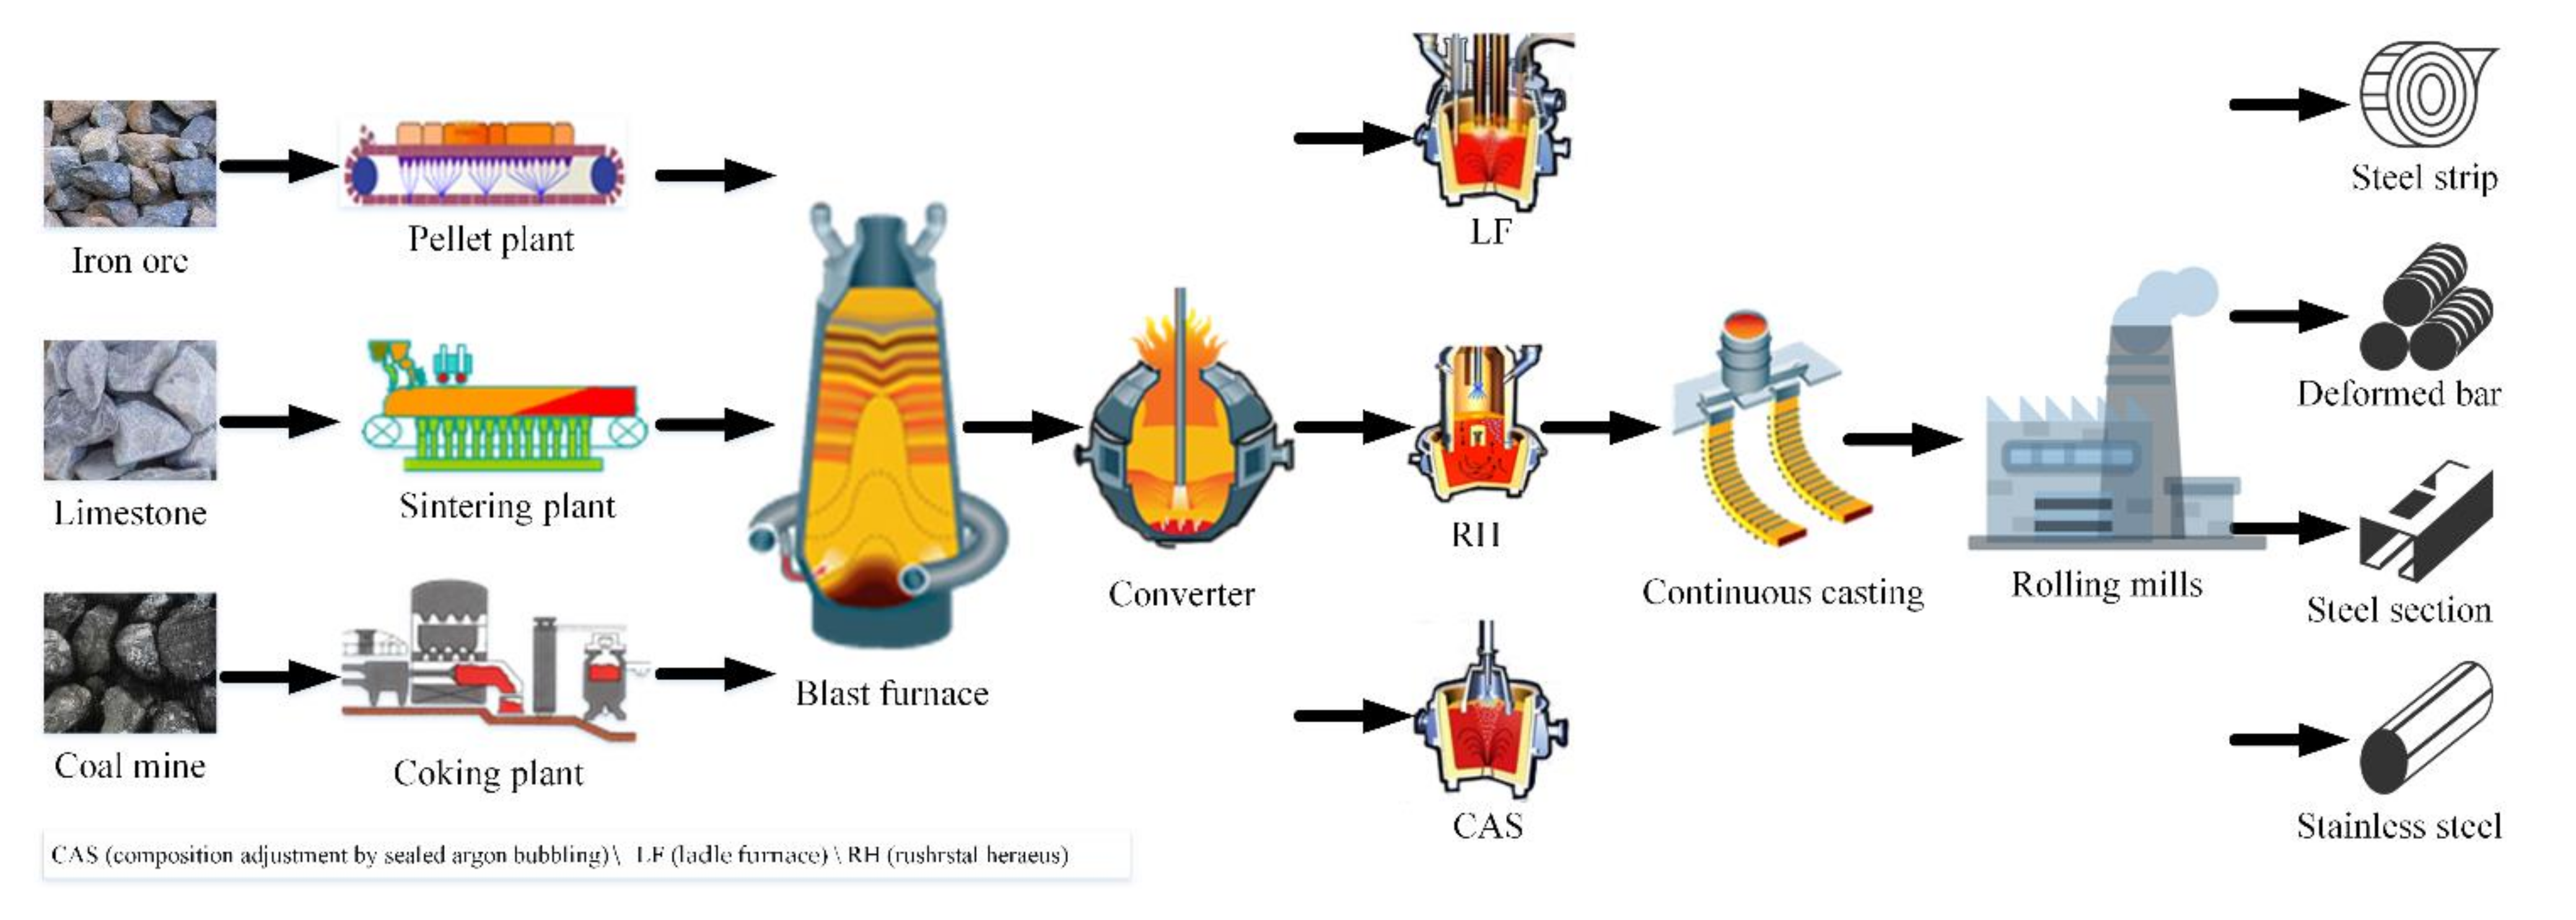
The relevant research in this paper is based on the production process of a steel plant in China (
Figure 1). High energy consumption and high pollutant emission are obstacles to the sustainable development of the steel industry. In this regard, Sun et al. [
4] evaluated the strength of energy-saving technologies and analyzed the influencing factors from the perspectives of the material network, exergy network and emission network. Wang et al. [
5] proposed the energy saving potential by studying the overall energy consumption of the iron and steel industry to determine the appropriate energy saving technology. All this is necessary for the further implementation of energy management and emission reduction.
Research on energy conservation mainly focuses on the following three aspects: energy saving technology, energy management and comprehensive evaluation or analysis.
Regarding energy saving technology, Zhang et al. [
6] affirmed that accelerating the promotion of advanced energy-saving technology and encouraging innovation would improve production efficiency. Quader et al. [
7] and Ren et al. [
8] discussed related energy-saving technologies to reduce CO
2 emissions. Tang et al. [
9] systematically analyzed the application of energy efficiency optimization technology in the iron and steel industry, focusing on energy saving technologies, such as production process energy saving and waste heat and energy recycling. Ren et al. [
10] focused on research related to ultra-low carbon technology and committed to reducing CO
2 emissions. Wang et al. [
11] paid attention to the relationship between energy, water consumption and CO
2 in iron and steel enterprises, and evaluated the economic, energy-saving, water-saving and emission-reduction potential of 31 energy-saving technologies. Hasanbeigi et al. [
12,
13] and He et al. [
14] summarized the latest progress of energy-saving technology in the ISPP, so readers could have a clear understanding of the energy use, the research and practice of energy-saving technology in the steel industry.
For energy management, Kong et al. [
15] established a converter oxygen scheduling model with the goal of reducing fluctuations in the total oxygen consumption and reducing the system energy consumption, which was used to optimize the scheduling of the converter oxygen consumption. Dang et al. [
16] used the parameter optimization method to predict the use rate of BFG (blast furnace gas). Li et al. [
17] established the HP(2)-Elman prediction model to predict and optimize the scheduling of surplus gas. Zhang et al. [
18] focused on the study of waste energy and evaluated the future energy-saving potential and energy-saving consumption reduction under the synergistic effect of technology promotion and structural adjustment through constructing four scenarios. Based on the LEAP (long-range energy alternatives planning) energy modeling software, Ates [
19] estimated and evaluated the energy consumption of the Turkish steel industry by generating four different scenarios, and finally proposed that improved energy management is a key priority for achieving permanent energy efficiency.
For comprehensive evaluation or analysis, Liao et al. [
20] combined the input–output energy consumption model with a sensitivity analysis to obtain the energy value and total energy consumption of each product and analyzed the impact of demand and technical parameters on energy consumption, respectively. Lu et al. [
21] established the CO
2 emission model of the steel production process and analyzed the relationship between energy consumption and CO
2. Gao et al. [
22] established the evaluation framework model of water and energy consumption in the steel industry, and quantitatively evaluated the energy- and water-saving situation of traditional and emerging technologies. Long et al. [
23] comprehensively analyzed various factors affecting energy conservation and emission reduction potential, and quantitatively evaluated energy intensity, greenhouse gas emission intensity and other indicators under five scenarios. Griffin et al. [
24] conducted a comprehensive analysis of energy saving technologies used in the U.K. steel industry and pointed out that existing technologies can reduce a significant proportion of process energy loss, but that there are a number of non-technological barriers.
Guo et al. [
25] summarized the key issues and energy consumption status of China’s iron and steel industry development. Although the overall technical level of China’s steel industry has improved, China is still the country with the lowest energy efficiency among the major steel producers. The iron and steel industry is still one of the major industries with high energy consumption and high pollution in China. In the author’s opinion, this is mainly because the related research for many years only explored the traditional energy-saving mode, and the space for energy conservation is becoming smaller and smaller. Today, the concept of system energy saving is emerging, using the system view, theory and method, through the implementation of system energy saving to promote the efficient operation of the ISPP and the optimization of energy system management; this is the most urgent matter. Lu et al. [
26] first proposed the e-p analysis method of the relationship between procedures and process energy consumption in 1992. Then, based on the concepts of “system” and “energy carrier” [
27], the system energy-saving method and the process energy-consumption diagnosis and analysis method gradually developed from the system energy-saving modeling method, direction and approach of energy saving, system energy consumption evaluation and other aspects. It is helpful to establish a more intuitive reference material flow diagram [
28] of the ISPP.
Therefore, people’s research starts from the whole process system and combines with the system energy saving. Na et al. [
29] made important explorations and attempts in this aspect. Aiming at the deficiency of traditional energy efficiency evaluation methods for the process industry, they established a new energy efficiency evaluation method for the process industry. Finally, it is pointed out that the energy efficiency of iron and steel enterprises can be improved effectively by adjusting the steel distribution ratio, recovering the waste heat and energy and developing the interface technology. In this paper, the calculation of energy saving refers to the evaluation method of energy efficiency. The CPS (cyber–physical system) proposed by Yin et al. [
30] or the HCPS (human–cyber–physical system) proposed by Zhou et al. [
31], are both from the perspective of the system; both hope to establish a set of optimal control of the production process and realize the integration of decision and control. Norbert et al. [
32] clearly pointed out that the potential for improvements tends to be more and more limited at the level of a steel plant. In order to break through this bottleneck, they proposed a new methodology based on the concepts of system dynamics, which applies all resources and energy flow throughout the steel plant to quantify the economic and environmental benefits or impacts. Johansson et al. [
33] evaluated the energy saving and CO
2 emission reduction potential of two Swedish steel companies from a system perspective. Chen [
34] et al., by analyzing the mass flow and energy flow in the steel industry at home and abroad, clarified the importance of the thermal optimization of the whole system. Sun et al. [
35] discussed the challenges to be overcome and the development direction of mass flow and energy flow research in the steel industry, which also highlighted the importance of system energy conservation. Du et al. [
36] established a multilevel input–output model for iron and steel enterprises, according to the theory of system energy saving, and analyzed in detail the influence of such factors as the plant layout, steel ratio and production structure on energy consumption.
The research object of system energy saving is the process engineering system, which is a whole concept, not limited to a single procedure equipment or a single energy. There are many roles of system energy saving, which also comprise the research direction of energy workers:
- (1)
To provide ideas and reference for energy-saving calculation. The calculation methods of energy saving in this paper are all developed on the basis of system energy saving.
- (2)
Make clear the optimization direction and path of energy saving in process engineering and avoid too many detours on the road of energy saving.
- (3)
Optimize the matching of each procedure equipment and the reasonable collocation of various energy media in the process engineering, promote energy saving and improve the smooth state of the production process, that is, optimize the mass flow and energy flow of the production process.
- (4)
To guide the production practice. Implementing energy saving technology needs strict control of many technological parameters in the production process to bring ideal energy savings. However, the current situation is that the process parameters are empirical and uncertain. Therefore, it is of practical significance to optimize and determine the process parameters based on the system energy savings.
- (5)
Transformation and optimization of energy saving technology. Through the calculation method of energy saving, the contribution of energy-saving technology in energy saving can be clarified to a certain extent, and the advantages and disadvantages of energy-saving technology can be further clarified.
Figure 2 is a schematic diagram of the mass flow in the ISPP.
Figure 3 is a schematic diagram of the energy flow in the ISPP. In these two figures, only considering major procedures, such as coking, sintering, ironmaking, steelmaking and rolling in the process, COG (coke oven gas), BFG, LDG (Linz–Donawitz process gas), electric power and steam, in the energy. The input and output of mass flow and energy flow in the figures are very complicated and messy. If considering other auxiliary procedures (such as refining procedure) or more energy [
37], the mass flow and energy flow of the entire production system become more complex and variable, and the production and energy scheduling become more difficult. Therefore, from the perspective of system energy saving, each procedure, all kinds of energy as a whole, and thus, the research on energy-saving methods or energy-saving technology, we are more able to optimize the overall production process.
It can be found that, on the one hand, the current calculation of energy saving is still the most basic method of dividing the total energy consumption by the product quantity or e-p analysis method, which cannot accurately calculate the contribution of energy saving technology. On the other hand, the current energy-saving calculation is based on a single process or energy, but rarely on the whole production system. Energy efficiency is an important index to evaluate industrial activities. Morfeldt et al. [
38] found that such important indicators differ, because statistical data, and more data and improved energy efficiency indicators are needed to comprehensively detect the energy system in the steel industry. Unfortunately, there has never been a quantitative calculation of the contribution of energy-saving technology to energy saving. Therefore, the author makes a bold assumption and puts forward an energy-saving calculation method based on the e-p analysis method, aiming to inspire the thoughts of researchers in related fields, and work together to put forward a more reasonable and simpler energy-saving calculation method, and promote the energy-saving assessment in future energy-saving projects.
3. Energy Saving Calculation Method and Case
3.1. Energy Saving Calculation Method
The statistics of energy consumption in iron and steel enterprises are based on the procedure. Therefore, in the calculation of energy saving in this paper, there are mainly three aspects involved: ironmaking procedure and iron–steel interface; steelmaking procedure and steel-casting interface; and steelrolling procedure and casting–rolling interface. The calculation method of energy saving in these three aspects mainly adopts the widely used e-p analysis method of energy consumption per ton of steel, which is respectively embodied in the direct energy saving and indirect energy saving.
where
is the change in energy consumption per ton of steel during the contrast period; its inverse is the energy saving (kgce/t
steel).
is the change caused by the procedure energy consumption change; its inverse is the direct energy saving (kgce/t
steel).
is the change caused by the steel ratio coefficient change; its inverse is indirect energy saving (kgce/t
steel).
is the total number of energy saving items. When calculating a certain energy saving item, n = 1, the sum of all energy saving items is ∆E.
is the contribution rate of energy-saving technology to direct energy saving (%). When calculating the overall energy saving,
00%.
is the contribution rate of energy-saving technology to indirect energy saving (%). When calculating the overall energy saving,
= 100%.
is the steel (iron) ratio coefficient of procedure
i during the reference period, that is, the ratio of procedure product quantity to the output of molten steel (molten iron).
is the steel (iron) ratio coefficient of procedure
i during the contrast period.
is the procedure energy consumption of procedure
i during the reference period (kgce/t
product).
is the procedure energy consumption of procedure
i during the contrast period (kgce/t
product).
In the following, taking the data provided by a Chinese iron and steel enterprise in 2015 as the reference value and the data from August to October 2019 as the contrast value, the paper elaborates the energy-saving calculation of the above three parts and energy management in detail.
3.2. Ironmaking Procedure and Iron–Steel Interface (II-S)
There are many pre-ironmaking procedures directly related to the ironmaking procedure, mainly the coking procedure, sintering procedure and pelletizing procedure. Therefore, the energy consumption of molten iron products is directly related to these procedures and cannot be ignored in the calculation of energy saving. Direct energy saving is mainly reflected in the change in the procedure of energy consumption in the ironmaking procedure. The indirect energy saving is mainly reflected in the operation optimization of the pre-ironmaking section, which reduces the temperature drop of the molten iron, increases the scrap ratio of the converter, and reduces the ratio coefficient of iron to steel. Thus, these changes reduce the consumption of molten iron per ton of steel, and reduce the consumption of sinter, pellets and coke per ton of steel, ultimately achieving energy conservation. The specific calculation method is as follows:
where
is the change in energy consumption during the contrast period, compared to the reference period, and its inverse is the direct energy saving per ton of steel (kgce/t
steel).
is the change in energy consumption during the contrast period compared to the reference period, and its inverse is the indirect energy saving per ton of steel (kgce/t
steel).
is the monthly average iron to steel ratio during the reference period of the ironmaking procedure (t
iron/t
steel).
is the monthly iron to steel ratio during the contrast period of the ironmaking procedure (t
iron/t
steel).
is the monthly average energy consumption of per ton iron during the reference period (kgce/t
iron).
is the monthly average energy consumption of per ton iron during the contrast period (kgce/t
iron).
is the contribution rate of energy saving technology to direct energy saving (%).
is the contribution rate of energy saving technology to indirect energy saving (%).
i = 1, 2, 3, 4, indicates the coking procedure, sintering procedure, pelletizing procedure and ironmaking procedure, respectively.
is the monthly iron ratio coefficient of the corresponding procedure
i in the reference period, that is, the ratio of the actual production of the procedure
i to the molten iron production (t
product/t
iron), where
i = 4 is the ironmaking procedure, and
.
is the monthly iron ratio coefficient of the corresponding procedure
i in the contrast period, that is, the ratio of the actual production of the procedure
i to the molten iron production (t
product/t
iron), where
i = 4 is the ironmaking procedure, and
.
is the monthly average procedure energy consumption of the corresponding procedure
i in the reference period (kgce/t
product).
is the monthly average procedure energy consumption of the corresponding procedure
i in the contrast period (kgce/t
product).
is the monthly mean tapping temperature of molten iron in the BF (blast furnace) during the reference period (°C).
is the monthly average temperature of molten iron entering the converter during the reference period (°C).
is the monthly tapping temperature of molten iron in the BF during the contrast period (°C).
is the monthly temperature of molten iron entering the converter during the contrast period (°C). The value 0.5 means that the consumption of molten iron in the converter will be reduced by 0.5 kg/t
steel for every 1 °C decrease in the temperature drop of molten iron; 1000 is the conversion between unit kg and unit t.
and are necessary to calculate the contribution of energy-saving technology to energy saving. However, if we only calculate the energy saving of the whole process during the contrast period and the reference period, both and are at 100%. In the present study, the contribution rate of energy-saving technology to direct energy saving cannot be calculated, and the energy-saving technology needs to be measured, so = 100% is temporarily taken. However, the contribution rate of energy-saving technology to indirect energy saving can be calculated. The following will provide a calculation idea and method, but in the application, we need to make customized changes according to the different energy-saving technologies. When excluding the incommensurable factors (such as the fluctuation of BF tapping time), the decrease of molten iron temperature drop from the BF to BOF (basic oxygen furnace) by 1 °C equals the increase in the molten iron temperature into the BOF by 1 °C. The corresponding consumption of molten iron in the BOF is reduced by 0.5 kg/tsteel, that is, the ratio coefficient of iron to steel in the BOF is reduced by 0.5‰. The contribution of energy-saving technology to indirect energy saving is concentrated on the reduction value of the molten iron temperature drop from BF to BOF, which is representative. Therefore, the contribution of energy-saving technology to the reduction of the iron/steel ratio coefficient in the BOF is calculated according to the reduction value of the molten iron temperature drop from the BF to BOF caused by the implementation of energy-saving technology, that is, the contribution rate of indirect energy saving in the II-S.
Table 1 shows the actual data provided by a steel enterprise in China.
Table 2 shows the energy saving calculated, according to Equations (4)–(8).
3.3. Steelmaking Procedure and Steel-Casting Interface (SS-C)
In recent years, with the gradual development of negative energy steelmaking technology, the energy saving of the steelmaking procedure has been considerable. According to Equation (3),
and
are the ratio of the molten steel output to molten steel output in calculating energy saving of the SS-C and are both 1. Therefore, energy saving in this part is reflected in the direct energy saving, and its main related technologies are as follows: optimizing ladle scheduling, ladle insulation, ladle efficient baking, etc. Implementing these technologies has achieved the following results: (1) increasing the ladle turnover rate and reducing the number of ladles used, (2) optimizing the refining procedures and shortening the refining cycle, (3) lowering the tapping temperature of the converter and reducing the consumption of ladle baking gas. The specific calculation method of this energy saving is as follows:
where
is the change in energy consumption during the contrast period, compared to the reference period, and its inverse is the direct energy saving per ton of steel (kgce/t
steel).
is the monthly average procedure energy consumption during the reference period of the steelmaking procedure (kgce/t
steel).
is the monthly average procedure energy consumption during the contrast period of the steelmaking procedure (kgce/t
steel).
is the contribution rate of the energy-saving technology to direct energy saving (%).
For the present research, the contribution rate of energy saving technology to direct energy saving cannot be calculated, mainly because the calculation of Equation (9) only contains the procedure energy consumption and no steel ratio coefficient. Therefore, the contribution rate cannot be calculated simply by the temperature change and other parameters, which focus on indirect energy saving. However, the calculation of energy saving in the SS-C only, Equation (9), does not contain the indirect energy saving. This is related to the characteristics of converter steelmaking itself; compared with the BF, the energy consumption of the converter does not involve coking, sintering and other procedures, as its own procedure energy consumption can characterize the energy consumption state. However, the BF also needs to be converted to the energy consumption per ton of iron, and . Therefore, to obtain the contribution of the energy-saving technology to direct energy saving, it is necessary to adopt certain scientific methods to measure different energy-saving technologies. The measuring method is not involved in this paper, so = 100% is temporarily taken.
Table 3 shows the actual data provided by a steel enterprise in China.
Table 4 shows the energy saving calculated according to Equation (9).
3.4. Steelrolling Procedure and Casting–Rolling Interface (RC-R)
When using the e-p method to calculate the overall energy saving, the calculation method is as follows:
where
is the change in energy consumption during the contrast period, compared to the reference period, and its inverse is the direct energy saving per ton of steel (kgce/t
steel).
is the change in energy consumption during the contrast period compared to the reference period, and its inverse is the indirect energy saving per ton of steel (kgce/t
steel).
is the monthly average slab to steel ratio during the reference period of the steelrolling procedure (t
roll/t
steel).
is the monthly slab to steel ratio during the contrast period of the steelrolling procedure (t
roll/t
steel).
is the monthly average energy consumption per ton of slab during the reference period (kgce/t
roll).
is the monthly average energy consumption per ton of slab during the contrast period (kgce/t
roll).
is the contribution rate of energy-saving technology to direct energy saving (%).
is the contribution rate of energy-saving technology to indirect energy saving (%).
In this part of the energy-saving calculation,
and
take 100%. The main reason is that when both of them are 100%, the total energy saving of the RC-R is calculated. If implementing energy-saving technology, such as highly efficient hot delivery and hot charging of continuous casting slab, optimal scheduling of heating furnace group, etc., the energy saving in the RC-R is mainly reflected in two aspects: increasing the hot charging rate and the hot charging temperature of casting slab. Both of them increase the sensible heat of the slab, reduce the gas consumption of the heating furnace and realize energy saving. Therefore, the following calculation method is simpler and avoids the problem of finding the contribution rate.
where
is the energy saving per ton of steel contributed by energy-saving technology in the RC-R (kgce/t
steel).
represents the reference period and the contrast period, respectively.
is the physical heat per ton of hot-charging and cold-charging billets (kJ/t
roll).
is the energy per ton consumed by heating hot-charging and cold-charging billets to the temperature of the out-heating furnace (kJ/t
roll). W is the hot rolling production of the corresponding period of
(ten thousand tons).
is the hot rolling rate of the corresponding period of
(%).
is the average specific heat capacity of solid steel, 0.699 kJ/(kg∙°C).
is the average hot charging temperature of the corresponding period of
(°C).
is the out-heating furnace’s average temperature of the corresponding period of
(°C).
is the average cold charging temperature of the corresponding period of
(°C).
is the thermal efficiency of hot charging, which is 40%.
is the thermal efficiency of cold charging, which is 70%.
is the monthly slab to steel ratio during the contrast period of the steelrolling procedure (t
roll/t
steel).
is the calorific value per kilogram of standard coal, which is 29,306 kJ/kgce. The slab temperature of cold charging is 25 °C. Finally,
are the coefficients of the unit conversion.
Table 5 shows the actual data provided by a steel enterprise in China. In the actual production process, the hot-rolling procedure is divided into two types of hot-rolling products, with 2250 mm width and 1580 mm width, so we calculate them separately in the table.
Table 6 shows the energy saving, calculated according to Equations (10)–(14). There seems to be a contradiction in
Table 6. For example, the total energy saving of 1580 is a negative value, that is, there is no energy saving at all, but the energy saving technology is a positive value for 1580. This is not a contradiction. The calculation of the negative value is to solve the energy saving of the RC-R. There are many factors influencing this value, such as the increase in the output of thin specification products, which will prolong the heating time of the heating furnace, thus increasing the consumption of gas and increasing the energy consumption. However, this does not mean that energy-saving technology has no energy-saving effect, so the calculation using Equations (12)–(14) can better reflect the role of energy-saving technology in energy saving. This method also avoids searching for contribution values in the negative values calculated by Equations (10) and (11), which simplifies the calculation method but is more reasonable.
3.5. Energy Management (EM)
It is always difficult to calculate the energy saving in the EM, especially in the whole production process. This article gives an example to illustrate the energy savings of energy-saving technology in the EM. Taking the implementation of coupling optimization scheduling of gas, steam and power as an example, the energy optimization management of the whole ISPP is carried out through the system optimization technology of multi-energy media. The energy saving effect of this technology is mainly reflected in two aspects: the decrease in the blast furnace gas (BFG) emission rate and the increase in the converter gas (LDG) recovery rate. The following elaborates the specific calculation method.
For the energy saving caused by the decrease in the BFG emission rate, the specific calculation method is as follows:
For the energy saving brought by the increase of LDG recovery, the specific calculation method is as follows:
where
is the energy saving per ton of steel caused by the decrease in the BFG emission rate (kgce/t
steel).
is the energy saving per ton of steel brought by the increase in LDG recovery (kgce/t
steel).
is the average monthly BFG recovery in the reference period (ten thousand m
3).
is the monthly BFG recovery in the contrast period (ten thousand m
3).
is the average monthly LDG recovery in the reference period (m
3/t
steel).
is the monthly LDG recovery in the contrast period (m
3/t
steel).
is the average monthly BFG emission rate in the reference period (%).
is the monthly BFG emission rate in the contrast period (%).
is the standard coal coefficient of the BFG, which is 0.129 kgce/m
3.
is the standard coal coefficient of the LDG, which is 0.257 kgce/m
3.
is the average monthly crude steel production in the reference period (ten thousand tons).
is the monthly crude steel production in the contrast period (ten thousand tons).
Table 7 shows the actual data provided by a steel enterprise in China.
Table 8 shows the energy saving calculated, according to Equations (15) and (16).
4. Results Discussion and Method Analysis
By using the above calculation method, this paper calculates the energy saving of the II-S, the SS-C, the RC-R and the EM. This energy saving refers specifically to the energy-saving contribution of energy-saving technology applied for such aspects.
For the II-S, the direct energy saving per ton of steel from August to October 2019 is 38.335 kgce/tsteel, and the indirect energy saving per ton of steel is 122.062 kgce/tsteel, among which the indirect energy saving per ton of steel brought by energy-saving technology is 10.059 kgce/tsteel. The problem in this part of calculation is that cannot be calculated, that is, the direct energy saving per ton of steel brought by energy-saving technology cannot be calculated. The direct energy saving here mainly refers to the significant reduction in procedure energy consumption after the application of energy-saving technology. However, in terms of current theories and energy-saving technologies, it is impossible to quantify how much of the reduced procedure energy consumption is the contribution of energy-saving technologies; this requires updating the measurement or calculation methods.
For the SS-C, the direct energy saving per ton of steel from August to October 2019 is 13.855 kgce/tsteel. The unique feature of steelmaking procedure is that in the e-p calculation method, there is no change in the steel ratio coefficient before and after the application of technology, which remains at 1. This makes the energy-saving calculation of this part focus on direct energy saving, but like the ironmaking procedure, it cannot be calculated at present.
For the RC-R, the rolling procedure with 1580 mm width does not save energy as a whole, but the energy-saving technology brings 1.402 kgce/tsteel. In the rolling procedure with 2250 mm width, the direct energy saving per ton of steel is 1.385 kgce/tsteel, and the indirect energy saving per ton of steel is 0.316 kgce/tsteel, among which the energy-saving technology brings the energy saving per ton of steel of 1.089 kgce/tsteel. There seems to be a contradiction in the calculation. For example, the total energy saving of 1580 mm is a negative value, that is, there is no energy saving at all, but the energy saving technology is a positive value for 1580 mm. This is not a contradiction. The calculation of the negative value solves the energy saving of the RC-R. There are many factors influencing this value, such as the increase in the output of thin specification products, which prolong the heating time of the heating furnace, thus increasing the consumption of gas and increasing the energy consumption. However, this does not mean that energy-saving technology has no energy-saving effect, so the calculation using Equations (12)–(14) can better reflect the role of energy-saving technology in energy saving. This method also avoids searching for contribution values in the negative values calculated by Equations (10) and (11), which simplifies the calculation method but is more reasonable.
For the EM, the energy saving per ton of steel is 5.500 kgce/tsteel due to the decrease in the BFG emission rate, and 4.430 kgce/tsteel, due to the increase in LDG recovery. The calculation of this part of the energy saving focuses on the calculation of indirect energy saving; the e-p method cannot be used for this calculation. In this paper, the decrease in the BFG emission rate and the increase in the LDG recovery rate proposed are significant energy-saving directions brought about by the EM. If the calculation is carried out according to the energy medium, such as the difference between the changes in gas, steam, electricity and so on, this method lacks consideration of the interaction between multiple energy media.
In conclusion, on the basis of the e-p method, if the contribution rate φ1 and φ2 can be calculated, the energy saving can be directly calculated by using Equations (2) and (3). However, under the current theoretical and technical conditions, it is impossible to obtain the contribution rate in many cases, so it is necessary to open up new ideas, starting from the main embodiment of energy-saving technology, such as the decrease in the BFG emission rate in the EM. The method in this paper was applied to the final report of the funding project and was recognized by some experts. Therefore, this method has certain application value; for example, it can evaluate the contribution rate of energy-saving technology, provide the optimization direction for the practical application of energy-saving technology, and can also be used as an important evaluation index of energy-related projects. At the same time, we should be clearly aware that there are some problems in this method, mainly in the following two aspects:
- (1)
This paper only provides some examples of calculating the contribution rates, φ1 and φ2. It is not possible to completely calculate and distinguish the contribution rates of all technologies, let alone those φ1 and φ2 that cannot be calculated. For example, the energy-saving technology applied to the II-S may also include the optimal scheduling of a hot metal ladle, the baking of the hot metal ladle, the covering of the hot metal ladle and so on. Their indirect energy saving is mainly reflected in the reduction in the hot metal temperature drop. However, the influence of three technologies on the decrease in the hot metal temperature drop cannot be reflected from the calculated contribution rate, and the current theory and technology cannot achieve such a detailed distinction. The only way to do this is to test the energy-saving technologies one by one so that they do not interfere with each other, but such experimental conditions require sufficient resources and people. This makes the inability to distinguish a difficult and painful point.
- (2)
Although this paper takes the whole steel production process as the research object, rather than a single procedure or energy, the interaction between procedures or energy in the whole process is not clear. For example, in terms of the EM, the energy-saving technology comprises multi-energy media coupling optimal scheduling to the energy saving caused by the decrease in the BFG emission rate. The overall energy-saving situation after the implementation of this technology is calculated, but the interaction between the multiple energy media is not reflected, so it is not clear how much energy saving is due to the gas optimal scheduling or how much energy saving is due to the steam optimal scheduling.
To sum up, the calculation method in this paper is recognized by some experts. However, this method still has great shortcomings. Therefore, the author will conduct further research based on the calculation method in this paper in order to improve the calculation method in the future.


