Article

Analysis of Influencing Factors of Carbon Emissions in China’s Logistics Industry: A GDIM-Based Indicator Decomposition

1
School of Modern Post, Xi’an University of Posts & Telecommunications, Xi’an 710061, China
2
School of Economics and Management, Xi’an University of Posts & Telecommunications, Xi’an 710061, China
*
Author to whom correspondence should be addressed.
Energies 2021, 14(18), 5742; https://doi.org/10.3390/en14185742
Submission received: 19 July 2021 / Revised: 21 August 2021 / Accepted: 7 September 2021 / Published: 12 September 2021
(This article belongs to the Special Issue Advances in CO2 Mitigation in Energy and the Environment)

Abstract

:
Due to increased global carbon dioxide emissions, the greenhouse effect is being aggravated, which has attracted wide attention. China is committed to promoting the low-carbon development of all industries. This paper analyzed the influencing factors of carbon emissions in the Chinese logistics industry, so as to identify the key factors that influence carbon emissions. Based on the carbon emission data of China’s logistics industry in 2000–2019, this paper applied the carbon emission coefficients issued by the Intergovernmental Panel on Climate Change. For the first time, the Generalized Divisia Index Method was used to analyze the degree of influence of the factors on carbon emissions. This method considered more variables and their relationships. The results showed that (1) the carbon emissions of the logistics industry were increased by 3.22 times from 2000 to 2018, and showed negative growth for the first time in 2019; (2) the added value of the logistics industry is the most important factor in increasing carbon emissions (with a contribution ratio of 65.45%), energy consumption and practical population size are the main factors in carbon emissions. The promotion of this industry is subjected to decreased per capita carbon emissions, which have a large impact on total carbon emissions; (3) the intensity of carbon output is the most important factor in the reduction of carbon emissions (with a contribution ratio of −29.1%), where the energy carbon intensity and per capita added value are the main influencing factors with regard to the reduction of carbon emissions, while energy intensity has a negative inhibitory effect on carbon emissions, and (4) the influencing factors have negative effects on the cumulative inhibition of carbon emissions in the logistics industry, to an extent that is far less than the integral promotion of carbon emissions. Finally, according to the research conclusions of this paper, it is feasible to make recommendations for the carbon reduction of the logistics industry.

1. Introduction

Since the 21st century, the concentration of greenhouse gases such as carbon dioxide in the atmosphere has continued to increase, leading to the deterioration of global warming [1]. Climate change has become an urgent problem to be solved in the field of sustainable development around the world. The International Energy Agency (IEA) [2] in 2020 reported that global energy-related carbon dioxide (CO2) emissions tended to stabilize in 2019 at 33 Gt [3]. In 2006, China’s carbon dioxide emissions (6378 MtCO2) surpassed those of the United States (6050 MtCO2) for the first time, causing the country to become the world’s largest carbon dioxide emitter [4]. In 2018, the world’s total carbon dioxide emissions were 36,573 MtCO2, while China’s carbon dioxide emissions were 10,065 MtCO2, accounting for 27.52% of the global total—nearly twice that of the United States (5416 MtCO2). China has become the largest country in terms of carbon dioxide emissions in the world [5].
The logistics industry accounts for a large proportion of China’s carbon dioxide emissions [6]. According to statistics, carbon dioxide emissions from China’s logistics industry reached 180.65 million tons in 2019. As an important source of energy consumption and carbon emissions in China, the logistics industry is still in the stage of rapid development and will become a key industry to achieve carbon emission reduction targets in the next few years [7]. Therefore, the influence of the main factors of scientific research on the carbon emissions of the logistics industry will play a positive guiding role for China to achieve peak carbon in 2030 and carbon neutralization in 2060. Shipper was the first scholar to analyze carbon emissions in the transportation industry [8]. Subsequently, many scholars have conducted research on low-carbon logistics and carbon dioxide emissions in the logistics field. Huang stated that environmental issues in the logistics industry will affect many logistics decisions throughout the supply chain [9,10]. Shi took IKEA as an example to study the impact of low-carbon concepts on the logistics model of the furniture industry [11]. Lee discussed the field of maritime logistics [12].
In the study of logistics carbon emissions, the analysis of influencing factors is an important factor. The research in China and abroad mainly includes the Laspeyres decomposition method, Arithmetic Mean Divisia Index (AMDI) method, and Logarithmic Mean Divisia Index (LMDI) method. Of these, Rüstemolu et al. used the Laspeyres decomposition method to analyze the effects of economic activity, employment, energy intensity, and carbon intensity on carbon emissions in Brazil and Russia [13]. Hatzigeorgiou et al. used the AMDI method to decompose and analyze energy-related carbon emissions in Greece [14]. It is concluded that the income effect is the most important factor promoting the increase of carbon emissions, and the energy intensity effect is the main reason for the reduction of CO2 emissions [15]. However, the AMDI model contains residuals, and when the value in the data is zero, the model is invalidated [16]. The LMDI method solves the problems present in the above two exponential decomposition methods. Timilsina et al. considered the factors affecting carbon emissions in the transportation sector in some countries using LMDI [17]. Zhang used the LMDI technique to determine that the effect of economic development is the most important driving factor for the sustained and rapid growth of carbon dioxide emissions in the logistics industry [18]. Wang [19] explored the potential factors affecting changes in carbon dioxide emissions in China’s transportation sector. Ang discussed some methodology and application problems of decomposing national industrial energy consumption into changes related to the total industrial production level, production structure, and sector energy intensity [20]. Liu used the LMDI model to decompose the carbon emissions of the logistics industry at the regional level [21], then dividing China into eastern, central, and western regions, and determining the differences of influencing factors of carbon emissions in the three regions by the LMDI model [22]. Many scholars analyzed the factors affecting the carbon emissions of the logistics industry based on the LMDI method, but there are still some defects. First, the LMDI model can only contain one absolute factor and cannot consider multiple relative factors at the same time. Second, it does not consider the relationship between the influencing factors.
The above methods have achieved very important and remarkable results in terms of solving the problem of carbon emissions. However, in some cases, there are some problems that cannot be solved and answered by these methods. Therefore, solving and avoiding related problems has become the content of recent research. Vaninsky [23] proposed a new index decomposition model: the Generalized Divisia Index Method (GDIM). This model can consider the effects of multiple absolute variables and relative variables on carbon emissions at the same time, analyzing and discussing the contribution of different factors to the change of carbon emissions accurately and scientifically. Some scholars have used the GDIM to study related problems. Ma used the GDIM to decompose the drivers of China’s industrial carbon emissions and determined that the output scale effect, technological progress effect, energy consumption scale effect, and per capita carbon emission effect were the main factors leading to the increase of industrial carbon emissions [24]. Li used the GDIM to study the influence of eight driving factors on URE [25]. Wang used GDIM to study the impact of renewable energy on CO2 emissions [26]. Sun analyzed the influencing factors of carbon emissions from China’s tourism industry based on the GDIM and found that the added value is the largest factor affecting the increase in carbon emissions [27]. Li used GDIM to explore the impact of different factors on the consumption of urban residents [25]. Wang used the GDIM to analyze the driving factors of carbon emissions in China’s transportation sector for the first time. Chu decomposed the driving factors of agricultural carbon emissions in China using the GDIM and found that the scale of fiscal expenditure was the primary factor causing carbon emissions [28]. Dias used GDIM to analyze the economic impact on the U.S. carbon dioxide emissions [29]. Shao and Li used the GDIM to examine the drivers of manufacturing carbon emission evolution in China and Shandong Province [30,31]. The GDIM is used to analyze the main factors of energy-related PM2.5 emissions changes [32]. The GDIM is also used to study the main influencing factors of carbon emissions in the Beijing–Tianjin–Hebei region of China and to quantify their contributions [33,34]. The GDIM was applied to decompose greenhouse gas emissions from the agricultural sector in European countries [35].
In this paper, an attempt is made to analyze the influencing factors of carbon emissions in Chinese logistics industry using GDIM. Compared with AMDI and LMDI, this method takes into account more absolute variables and relative variables. The GDIM can avoid relevant problems and reaching more advanced and optimized result. The method of this paper is the Generalized Divisia Index Method. The research idea of this method is to use the GDIM to study the relationship between carbon dioxide released by energy consumption and various influencing factors. Its advantage is that it breaks the interdependence of different influencing factors in form and makes the results more accurate and comprehensive, and can make up for the shortcomings of residual errors in previous research methods and the interdependence among influencing factors. It puts forward a new example for the analysis of influencing factors of carbon emission in logistics industry. Finally, according to the research results, this paper provides feasible suggestions for the low-carbon development of China’s logistics industry.
In brief, this paper proposes the use of the GDIM to study the carbon emissions of China’s logistics industry. This paper collects several years of data from the National Bureau of Statistics of China by finding materials related to transportation, warehousing, and the postal industry. These data reflect the impact of the added value of the logistics industry, energy consumption, the size of the working population, and other influencing factors on the carbon emissions of the logistics industry. In this paper, the GDIM is used to study the carbon emissions of China’s logistics industry, and relevant research conclusions are put forward. The structure of the remainder of this paper is as follows: Section 2 describes the method, Section 3 introduces the influencing factors, Section 4 presents the result analysis, Section 5 shows the next step, and Section 6 concludes the paper.

2. Methods

2.1. Calculation Method of Carbon Emissions

At the end of the 20th century, the logistics industry began to grow in China, but there are very few statistics specifically regarding the logistics industry in the statistical data of countries around the world; even the most advanced North American industrial classification system does not include the statistical category of the logistics industry. Through the analysis of the data in the Statistical Yearbook of China’s Tertiary Industry published by the National Bureau of Statistics in 2006, it’s easy to find that warehousing, transportation and postal industry account for more than 83% of the logistics industry. To a large extent, this can reflect the development of the logistics industry. For example, Zhang [18], Liu [21,22], and Cao [36] all use this method to study the carbon emissions of the logistics industry. Therefore, this paper also uses this method to select the statistical data of China’s transportation, warehousing, and postal industry from 2000 to 2019 to replace the logistics industry.
Carbon emissions refer to the general term for greenhouse gases, which mainly include carbon dioxide, nitrous oxide, methane and other carbon oxides. Among them, CO2 emissions account for more than 60% of greenhouse gas emissions [37]. For lacking comprehensive statistics of the latest global carbon emissions, most scholars apply the methods, provided by IPCC. Then adopt the data of energy consumption to calculate carbon emissions [38]. From the angle of source of data, a “top-down” method was often adopted to calculate carbon emissions of logistics activities. In the “top-down” calculation, the total carbon emissions of researched object are calculated based on comprehensive macro data of a region. In this method, the energy consumption of logistics activities is multiplied by the carbon emission coefficient of all kinds of energy to calculate the total carbon emissions. This method has a merit of direct utilization of the national or local governments’ statistical data to simplify the process and complexity of research and is suitable for research of carbon emissions in a larger spatial scale such as a country or a province. The results of the IPCC (2007) show that more than 95% of carbon dioxide emissions come from traditional fossil fuel combustion, so carbon dioxide emissions can be estimated by converting and summing the energy consumption of the logistics industry.
According to the measurement caliber of the China Energy Statistical Yearbook, this paper finally selects nine types of energy sources—coke, coal, gasoline, crude oil, kerosene, diesel, fuel oil, natural gas, and electricity—and converts them all into standard coal. Wang et al. [39], Zhao et al. [40], and Ma et al. [41] also use this method to test and calculate carbon dioxide emissions. The final carbon dioxide emissions of the logistics industry represent the consumption of these nine types of energy multiplied by their respective standard coal coefficients and then multiplied by their respective carbon emission coefficients, as shown in Equation (1) [39,40,41]:
C O 2 = i = 0 19 j = 1 9 E i j α j β j
where CO2 is the total carbon dioxide emission of the logistics industry in units of 106 tons from 2000 to 2019; i = 0, 1, 2, …19 indicates the year (2000–2019); j = 1, 2, …9 indicates the type of energy; E i j is the consumption of type j energy in the ith year in units of 106 tons, α j is the reference coefficient of converted standard coal of type j energy in units of kg/kg or kg/m3, and β j is the carbon emission coefficient of type j energy in units of tons/ton. In the calculation, the carbon emission coefficient of primary energy and the conversion coefficient of standard coal published in the IPCC National greenhouse Gas inventory 2006 are used to calculate the carbon emissions of the logistics industry. The carbon emission coefficient β j and standard coal conversion coefficient α j corresponding to various energy sources are listed in Table 1.

2.2. Generalized Divisia Index Method Based on Extended Kaya Identity (GDIM)

The Kaya identity is an index model proposed by Yoichi Kaya [42] in 1989 for environmental research. This model established the relationship between CO2 emissions and energy, economic and demographic factors, analyzed the factors that affect CO2 emissions, and measures the contribution of each factor. It represents the total carbon dioxide emissions as the product of energy carbon intensity (CO2/E), the energy intensity of economic activity (E/GDP), per capita GDP (GDP/P), and population (P), as shown in Equation (2) [23]:
C O 2 = ( C O 2 / E ) × ( E / G D P ) × ( G D P / P ) × P
In Equation (2): CO2 is the total carbon emission of China’s logistics industry, in units of 106 tons; GDP is the added value of the logistics industry, in units of 109 yuan; E is the energy consumption of the logistics industry, in millions of tons of standard coal; P is the size of the logistics industry staff, in units of 106 people.
Although the Kaya identity has been applied in the fields of energy consumption, population, environment, economy, and others, it also has its own limitations. First of all, it only considers population indicators based on the population environment. In the model, neither the energy index (E) nor economic index (GDP) are taken into account. Thus, some special cases will arise; for example, with other influencing factors unchanged, if energy consumption decreases, the model shows that CO2 emissions have not increased, which is obviously not in line with the actual situation. In addition, the model only considers one absolute variable (P) and three relative variables (CO2, E/GDP, GDP/P), covering a limited number of variables. Therefore, this paper uses the extended Kaya identity to include two absolute variables, the energy index (E) and economic index (GDP), and two relative variables, the output carbon intensity (CO2/GDP) and per capita carbon emission (CO2/P), into the model to study the influencing factors of carbon dioxide emissions. The GDIM is a decomposition model established by Vaninsky [23] through the deformation of the Kaya identity to reveal the internal motivation of the change of carbon emissions. On the basis of previous scholars’ research into the influencing factors of the logistics industry, this paper adds variables such as output carbon intensity, industrial energy consumption carbon intensity, energy intensity, and others in the model. GDIM is applied to decompose the factors affecting carbon emissions in China’s logistics industry. The decomposition steps are as follows:
Step 1: Establish the relationship between carbon emissions and its influencing factors in China’s logistics industry, as shown in Equations (3)–(5):
C O 2 = G D P × ( C O 2 / G D P ) = E × ( C O 2 / E ) = P × ( C O 2 / P )
G D P / P = ( C O 2 / P ) / ( C O 2 / G D P )
E / G D P = ( C O 2 / G D P ) / ( C O 2 / E )
where CO2/GDP indicates that the logistics industry produces a carbon intensity of a certain number of tons per thousand yuan; CO2/E represents the logistics industry’s energy consumption carbon intensity in tons per ton of standard coal; CO2/P represents the per capita carbon emissions of the logistics industry, in tons per person; GDP/P represents the per capita added value of the logistics industry, as 1000 yuan per person; and E/GDP represents energy intensity, in tons per thousand yuan. Our goal is to include these aspects symmetrically in factor analysis. To facilitate the derivation, we use the following terms: C = CO2, X1 = GDP, X2 = (CO2/GDP), X3 = E, X4 = (CO2/E), X5 = P, X6 = (CO2/P), X7 = (GDP/P), and X8 = (E/GDP).
Step 2: Based on the above assumptions, the variables are substituted into the equations and further transformed into Equations (6) and (7):
X 7 = ( C O 2 / P ) / ( C O 2 / G D P ) = X 6 / X 2
X 8 = ( C O 2 / G D P ) / ( C O 2 / E ) = X 2 / X 4
Step 3: To make better use of the GDIM, we convert Equations (3)–(7) into the following Equations (8)–(12):
C = X 1 × X 2
X 1 × X 2 X 3 × X 4 = 0
X 1 × X 2 X 5 × X 6 = 0
X 1 X 5 × X 7 = 0
X 3 X 1 × X 8 = 0
For the influencing factors X, the function C(X) is used to express the contribution of the influencing factors. A Jacobian matrix Φ X is constructed from Equations (8)–(12), as shown in Equation (13).
Φ X = X 2 X 1 X 4 X 3 0 0 0 0 X 2 X 1 0 0 X 6 X 5 0 0 1 0 0 0 X 7 0 X 5 0 X 8 0 1 0 0 0 0 X 1 T
Step 4: Measure changes in carbon emissions and the contribution of various influencing factors. Use GDIM to decompose changes in carbon emissions into the sum of contributions from influencing factors in the following Equation (14):
Δ C X | Φ = L C T I Φ X Φ X + d X
where L denotes the time span C = ( X 2 , X 1 , 0 , 0 , 0 , 0 , 0 , 0 ) T , I is the unit matrix, and “+” is the calculation symbol of the generalized inverse matrix. When the column vectors in the Jacobian matrix Φ X are linearly independent, Φ X + = Φ X T Φ X 1 Φ X T ; the elements in the row vector Δ C X | Φ represent the eight influencing factors that have been decomposed.
The change of carbon emissions in the logistics industry can be divided into eight effects: Δ C G D P , Δ C E , Δ C P , Δ C C G D P , Δ C C E , Δ C C P , Δ C G D P P , and Δ C E G D P . Of these, Δ C G D P , Δ C E , and Δ C P indicate that the three absolute factors reflect the impact of the change of added value, the change of energy consumption, and the change of personnel scale on the change of carbon emissions in the logistics industry, respectively. Among the relative factors, Δ C C G D P reflects the low-carbon degree of the development of the logistics industry—that is, the impact of the change of output carbon intensity on carbon emissions— Δ C C E reflects the low-carbon degree of energy use—that is, the comprehensive impact of the change of carbon intensity of energy consumption on carbon emissions—and Δ C C P reflects the low-carbon intensity of the size of employees—that is, the impact of per capita carbon emissions on carbon emissions. Δ C G D P P reflects the low-carbon degree of individual output—that is, the impact of per capita added value of the logistics industry on carbon emissions—while Δ C E G D P reflects the dependence of the output process on energy—that is, the impact of energy intensity on carbon emissions.

2.3. Data Source

As the data for 2020 have not yet been released, this paper selects the data of China’s logistics industry from 2000 to 2019 as the research sample [43]. According to Equation (1) regarding the consumption and use of each type of energy, the carbon dioxide emissions are calculated, and the carbon emissions of various kinds of energy consumption of China’s logistics industry from 2000 to 2019 are shown in Table 2. To make the data comparable to each other, the added value of the logistics industry is adjusted according to the price in 2000 to eliminate the impact of price fluctuations.
It can be seen from Table 2 that the energy consumption is still dominated by diesel, gasoline, fuel oil, kerosene, and other fuels, and the carbon dioxide emissions of diesel, gasoline, and kerosene all show an increasing trend. Of these, carbon dioxide from gasoline and kerosene maintained an increasing trend in 2019, at 50.8323 million tons and 18.5431 million tons, respectively, representing an increase of 308.76% and 588.41% compared with 2000; carbon dioxide emitted by diesel oil continued to surge in 2000–2012, from 28.3789 million tons to 92.4223 million tons, and the growth rate of emissions was relatively slow in the following years, increasing by 239.03% compared with 2000 in 2012. Carbon dioxide emitted by fuel oil rose from 7.4996 million tons in 2000 to 15.5281 million tons in 2007, fell to 10.0827 million tons in 2008, and rose to its original peak in subsequent years. According to the analysis of the reasons behind this, the transportation work of China’s logistics industry is mainly road transportation, and the means of transport have a great demand for fuel energy; furthermore, the rapid development of e-commerce in China in recent years has led to a surge in logistics business, resulting in a substantial increase in energy consumption. In addition, although the carbon dioxide emissions of coal, coke, and crude oil increased and decreased in the middle years of the studied period, they all showed a downward trend as a whole. From 2000 to 2019, carbon dioxide emissions from coal decreased by 63.61% from 4.71 million tons to 1.5113 million tons, carbon dioxide emissions from coke decreased by 67.91% from 12,100 tons to 4400 tons, and carbon dioxide emitted from crude oil decreased by 94.75% from 1.4639 million tons to 76,900 tons. Compared with traditional fossil fuels, the amount of carbon dioxide emitted by electricity and natural gas has increased year by year, indicating that the demand for the logistics industry has increased significantly, which indirectly leads to an increase in carbon emissions.
Through analysis and comparison, the results show that there is a high correlation between carbon emissions, energy consumption and energy consumption structure. At present, there is still a situation that the structure of energy consumption is unreasonable and the use of clean energy is relatively small. To realize the low-carbon development of the logistics industry, it is necessary to adjust the energy consumption structure of the logistics industry, reduce the use of traditional high-polluting energy, and increase the utilization rate of clean energy.

3. Variable Description and Statistics

The raw data used in the analysis are given in Table 3. Relative variables are converted from absolute variables. This chapter describes all influencing factors.
The CO2 emissions of the logistics industry increased from 58.01 million tons in 2000 to 18.65 million tons in 2019—an increase of 211.41%. To measure the contribution of influencing factors to carbon emissions, this section selects three absolute factors and five relative factors and analyzes their dynamic changes.

3.1. Current Situation of Carbon Emissions in China’s Logistics Industry

The total carbon emissions of China’s logistics industry from 2000 to 2019 is calculated using Equation (1). As can be seen from Figure 1, the total CO2 emissions of China’s logistics industry increase year by year; that is, from 58.01 million tons in 2000 to 180.65 million tons in 2019—an increase of 3.11 times—with an average annual growth rate of 10.57%. From 2001 to 2013, the average annual growth rate was as high as 13.12%, but from 2014 to 2018, the average annual growth rate dropped to 2.70%. This shows that the growth rate of carbon dioxide emissions varies greatly in different periods of time. In 2019, the logistics industry’s carbon emissions were 180.65 million tons—6.07 million tons lower than in 2018.
This is mainly because China’s economy developed rapidly from 2000 to 2013, with an average annual growth rate of 24.62%. With the popularity of mobile Internet and e-commerce, the demand for logistics business continues to increase, and the total carbon emissions of the logistics industry continue to grow at a high speed. After 2012, China’s economic development has entered a new normal, from the pursuit of rapid growth to the pursuit of a high-quality growth model. As a result, economic growth has slowed. In the medium-and long-term Plan for the Development of the Logistics Industry (2014–2020) [44] issued by the State Council in 2014, it was pointed out that it is necessary to speed up the application of advanced operation and management concepts, vigorously develop green logistics, and promote carbon emission reduction, as well as reduce energy consumption and traffic pressure. The document places a certain constraint and guidance for the development direction of China’s logistics industry. From 2014 to 2019, the output of the logistics industry grew at an average annual rate of 8.14%. This was due to the optimization of China’s industrial structure, the accelerated transformation of traditional enterprises, the realization of electronic informatization, and the continuous improvement of logistics efficiency. As a result, the growth rate of carbon emissions from China’s logistics industry slowed down from 2014 to 2019, and carbon dioxide emissions from the logistics industry showed negative growth for the first time in 2019.

3.2. Decompose Variables

In response to the eight influencing factors of the logistics industry, the variation law is described along with the motivation behind it. These variables are divided into three parts: the first part is the increased value-related variables in the logistics industry, including the increased value of the logistics industry, the production of carbon intensity, and the per capita value of the logistics industry; the second part is energy-related variables, including energy consumption, energy intensity, and energy consumption carbon intensity; the third part is the employment of the relevant variables, including the size of the staff, per capita CO2 emissions, and the per capita logistics industry. These are discussed in detail below.

3.2.1. Increased Value-Related Variables

The added value of the output of the logistics industry includes the added value of transportation, warehousing, and postal services. It can be seen from Figure 2 that the GDP of China’s logistics industry continues to increase. From 2000 to 2019, the GDP of the logistics industry increased by 6.89 times, reaching 4246.6 billion yuan in 2019, with an average annual growth rate of 34.46%. During the study period, the total output in 2008 and 2009 was 1636.8 billion yuan and 1652.2 billion yuan, with a change of only 0.95% between the two years. This was due to the impact of the international financial crisis and the facts that China’s domestic economy was in a state of recovery and the value-added output of the industry was relatively small. After that, in the environment of international financial turmoil, logistics warehousing has become a safe haven for real estate investment. With the increase of corporate financing and the introduction of relevant policies by the government, the logistics industry gradually recovered after 2009 and continued to maintain rapid growth. We measure the logistics maturity of a country through the added value of the logistics industry accounts for the proportion of GDP. As can be seen from Figure 2, the ratio of logistics in the national GDP has declined year by year, from 6.14% in 2000 to 4.25% in 2019, which shows that the logistics industry is maturing while maintaining rapid development.
The output carbon intensity is the ratio of carbon dioxide emissions to the added value of the logistics industry output, indicating the amount of carbon dioxide released for each additional unit of output. This reduced from 0.0941 tons of carbon dioxide per thousand yuan in 2000 to 0.0425 tons per thousand yuan in 2019—a decrease of 54.81%—with an average annual reduction of 2.74%. This was because the new technology and process transformation of the logistics industry not only improved operational efficiency but also reduced carbon dioxide emissions.

3.2.2. Energy-Related Variables

Energy consumption is the total consumption of coke, coal, gasoline, crude oil, fuel oil, kerosene, diesel, natural gas, and electricity in the logistics industry. Figure 3 shows that the energy consumption increased from 114.67 million tons to 439.09 million tons of standard coal from 2000 to 2019—an increase of 283.59%—with an average annual growth rate of 14.18%. In the first three years, the growth of energy consumption was relatively slow, with an average annual growth rate of only 2.52%. Energy demand increased rapidly from 2003 to 2018, and energy consumption reached relative saturation in 2018. Compared with 2018, energy consumption in 2019 increased by only 2.92 million tons of standard coal—an increase of 0.67%. Since the start of the 21st century, China’s logistics industry has developed rapidly, and the volume of business has increased sharply, which has brought about an increase in energy consumption year by year.
The energy intensity presented in this paper is the ratio of the energy consumption to the added value of the output of the logistics industry (constant price in 2000), in units of 1000 yuan per ton of standard coal. During the 20 years of the study, the energy intensity of China’s logistics industry showed an overall downward trend, from 0.19 tons of standard coal per thousand yuan in 2000 to 0.10 tons of standard coal per thousand yuan in 2019, with an average annual decrease of 2.37%. In the first 10 years, the energy intensity decreased first and then increased, decreased and then increased, and then continued to decline after 2019. This is mainly because, with the rapid development of the logistics industry, new technologies and new equipment continue to emerge, shortening the working time and improving the work efficiency under the condition of the same workload. The result is a reduction in energy consumption with the same output.
The carbon intensity of energy consumption in the logistics industry is the ratio of carbon dioxide emissions to energy consumption; that is, the amount of carbon dioxide released per unit of energy consumption. It showed an overall downward trend during the study period, increasing slightly from 2005 to 2007 and then decreasing year by year from 0.51 tons of carbon dioxide per ton of standard coal in 2000 to 0.41 tons of carbon dioxide per ton of standard coal—a decrease of 19.61%—with an average annual decline of 0.98%. With the development of the logistics industry, the carbon dioxide released per unit of energy consumption has been reduced. Part of the reason is that the consumption of traditional fuels such as coke and coal has decreased, and the use of clean energy such as electricity and natural gas has increased. In the past, due to technical conditions and other reasons, traditional fossil fuels such as coal and coke were widely used, but with the use of new technology and new equipment, traditional fossil fuels were replaced and switched to clean energy.

3.2.3. Population-Related Variables

The logistics industry employees calculated in this paper include railway transport, road transport, water transport, air transport, pipeline transport, handling and other transport service, and post employees. Compared with 2000, the number of logistics employees increased by 3.69 million to 7.74 million at the end of 2019, with an average annual growth rate of 4.54%. The indicators related to the population size of China’s logistics industry are shown in Figure 4. The population size grew rapidly in 2002–2003 and 2011–2013, and remained relatively stable in other years. The per capita carbon emission of the logistics industry is the ratio of carbon dioxide emissions to the employed population; that is, the carbon dioxide emissions of each employee. During the period of the study, it was “W” as a whole, reaching the lowest point of 14.63 tons per person in 2003 and the highest point of 26.57 tons per person in 2011. Compared with 14.30 tons per person in 2000, it was 23.33 tons per person in 2019—an increase of 63.18%—with an average annual growth rate of 3.16%.
The per capita added value is the ratio of the total output value to the number of employees; that is, the added value of the logistics industry output per person. During the study period, compared with 151.87 thousand yuan per person in 2000 and 548.45 thousand yuan per person in 2019, the per capita added value increased and decreased alternately, with an increase of 396.58 thousand yuan per person—an increase of 261.14%—with an average annual growth rate of 13.06%. The maximum growth rate was 19.42% in 2003–2004, and the maximum decline was 17.15% in 2002–2003. It should be noted that, as can be seen from the chart, the per capita added value increased, and so did the per capita carbon emission, and while the per capita added value decreased, so did the per capita carbon emission. The change trends of per capita carbon emission and per capita added value tended to be consistent.

4. Result Analysis

In this paper, the R language was used to program the algorithm. According to the generalized Di exponential decomposition method, Rversion 4.0.5 was used to calculate the contribution of eight influencing factors to the CO2 emissions of China’s logistics, such as the added value of logistics output, energy consumption, the scale of logistics employees, and so on.

4.1. Decomposition Results of Total Carbon Emissions from China’s Logistics Industry

This paper studies the influencing factors of CO
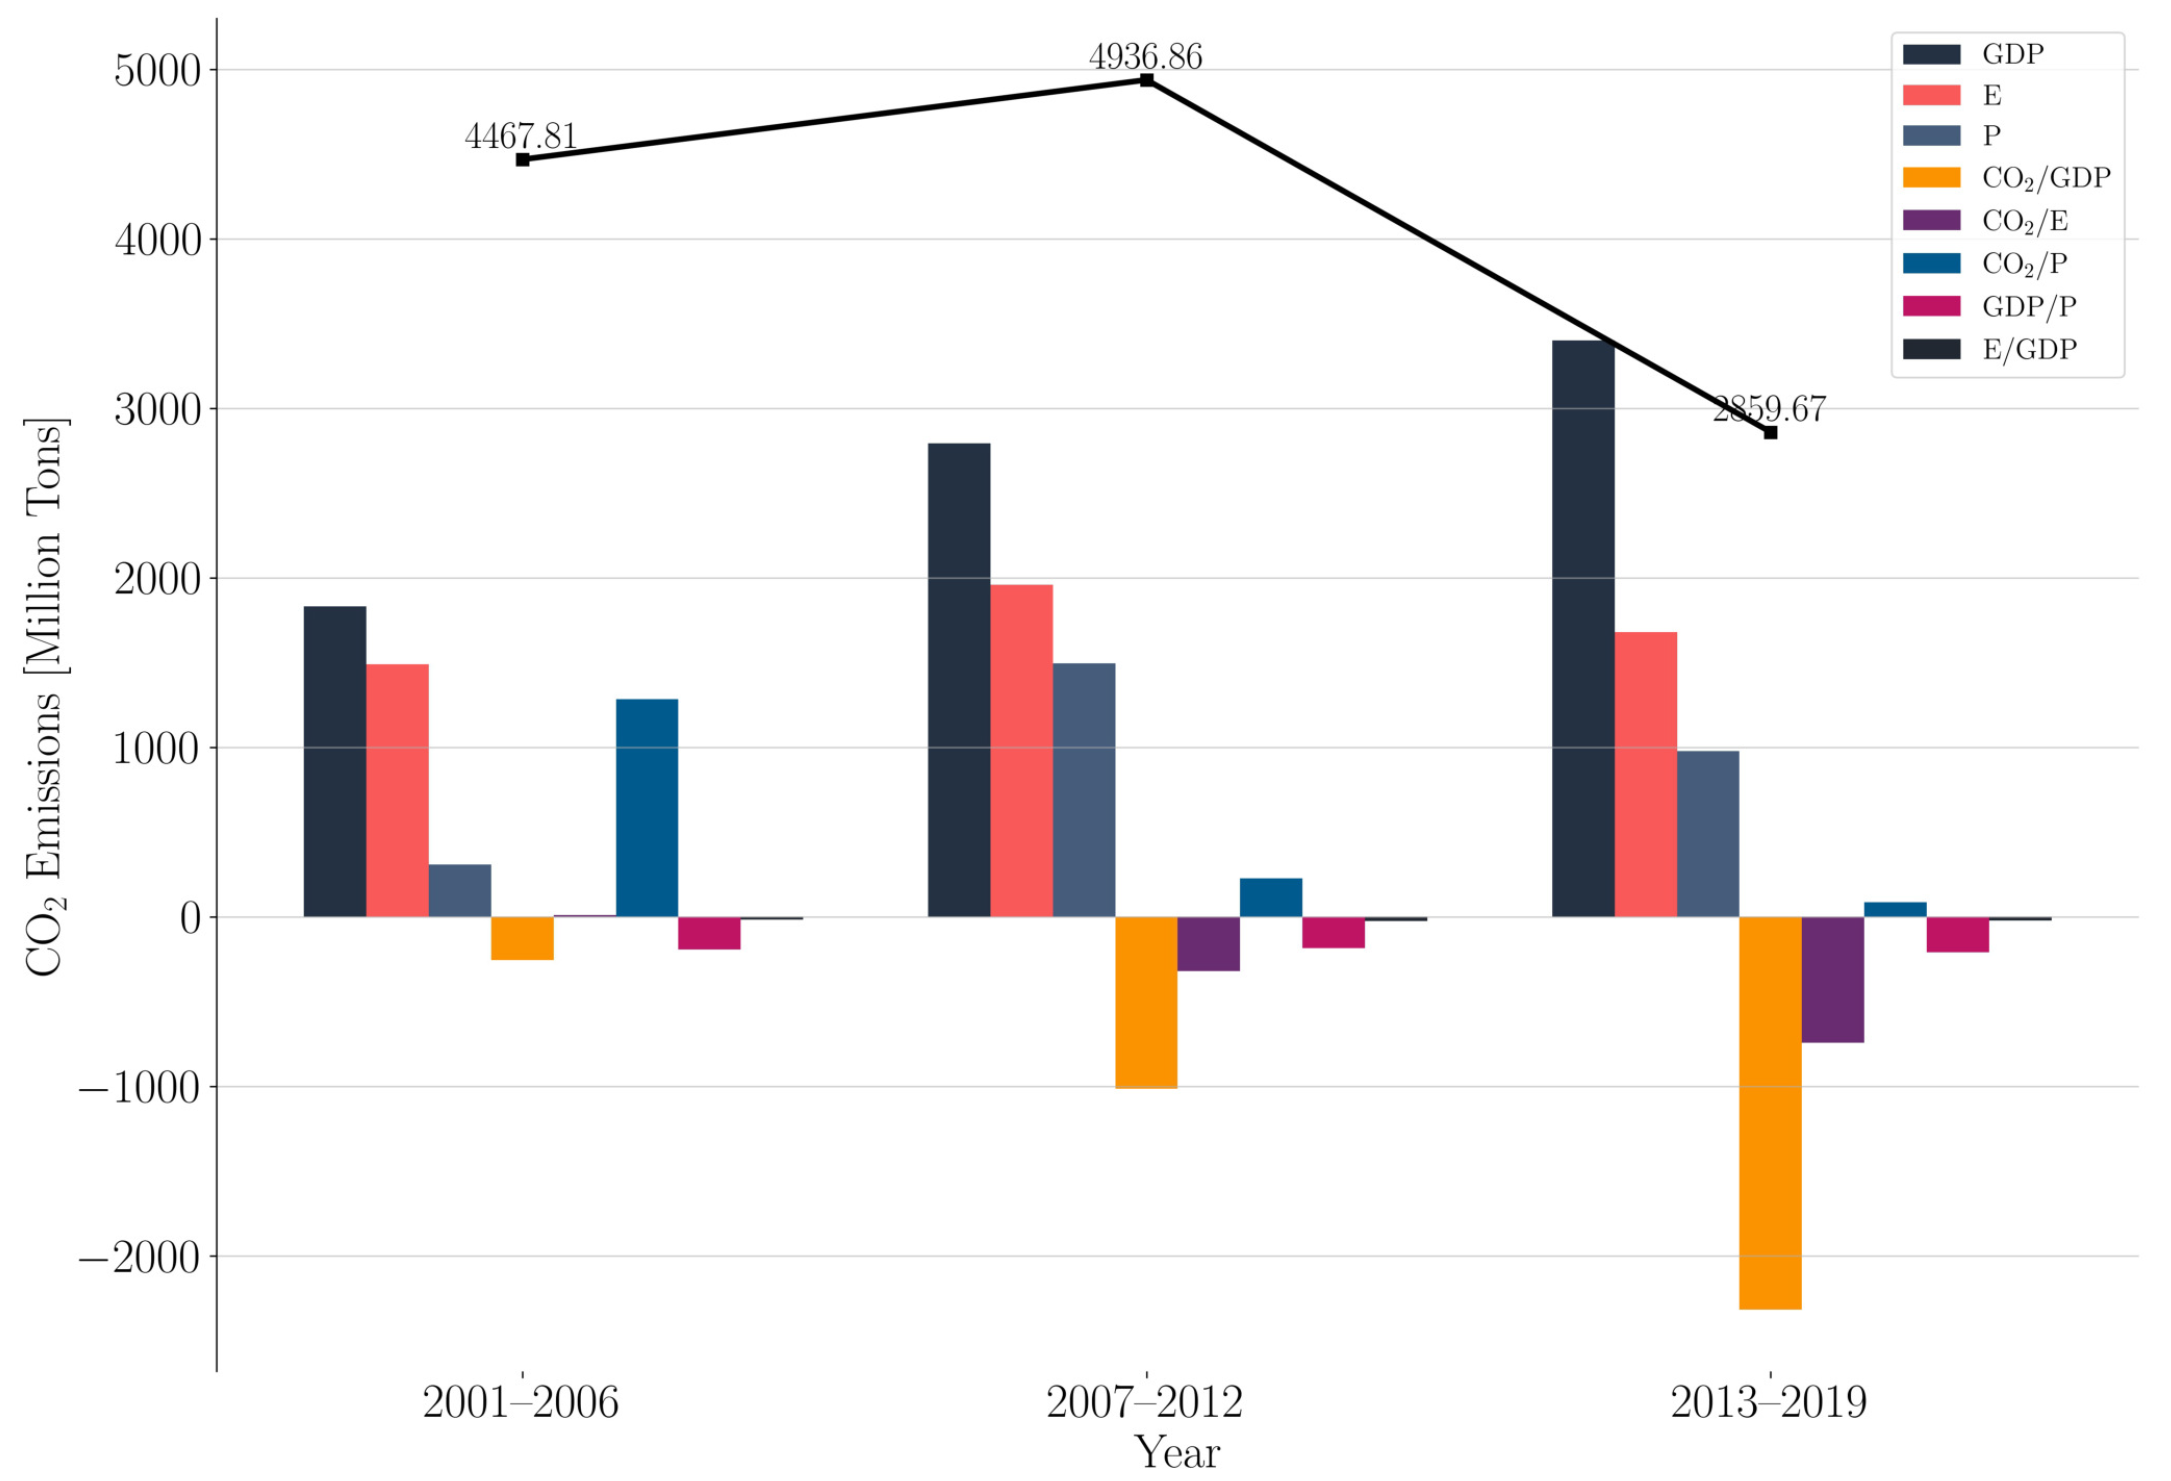
2 emissions in China’s logistics industry from 2000 to 2019. As the period of the study saw financial fluctuations such as the global financial crisis, the growth of various industries in China has slowed significantly since 2012. To compare the contribution of driving factors in different periods, the research period from 2000 to 2019 is divided into three stages: 2000–2006, 2007–2012, and 2013–2019. This paper uses the GDIM and calculates the results of factor decomposition according to Equations (8) and (14), as shown in Figure 5.
It can be seen that during the period from 2001 to 2019, the added value of the logistics industry, energy consumption, staff size, and per capita carbon emissions played a positive role in driving the change of carbon emissions; the output carbon intensity of the logistics industry and the per capita added value of the logistics industry played a negative driving role; and the carbon intensity of energy consumption in the logistics industry appeared to be both a positive and negative driver.
Among the positive driving factors of the change of carbon emissions in the logistics industry, the driving effect of the output added value of the logistics industry increased from 18.3249 million tons in 2001–2006 to 27.9437 million tons in 2007–2012, and then to 33.9965 million tons in 2013–2019. Its driving effect was the strongest in the three time periods. This shows that the current development model of China’s logistics industry is reliant on the energy demand, and if the mandatory carbon dioxide emission reduction policy is implemented at this time, it will be at the expense of the development of the logistics industry. The positive driving effect of energy consumption in the logistics industry first increased from 14.9055 million tons in the first stage to 19.5909 million tons in the second stage and then decreased to 16.8031 million tons in the third stage, with an increase of 31.43% and a decrease of 14.23%. This shows that the logistics industry has changed from relying on energy consumption to relying on energy efficiency, while maintaining the development of growth; furthermore, energy consumption has been reduced, and the use of new equipment and the popularity of electric vehicles have greatly reduced the energy consumption in the industry, and the whole industry is changing from energy consumption to energy conservation.
The size of the employed population positively promoted carbon dioxide emissions in all three stages, which is consistent with the impact of energy consumption, showing a trend of first increasing and then decreasing. The positive driving effect of per capita carbon emissions on carbon emissions gradually decreased, from 12.8384 million tons in 2001–2006 to 2.279 million tons in 2007–2012, and then to 862,500 tons in 2013–2019—a decrease of 93.28% in 20 years. This is because, in recent years, with the Chinese government’s long-term promotion of the concept of conservation, the people have generally begun to accept the reality of climate change, low-carbon awareness has gradually taken root in the hearts of the people, and changes in people’s way of life have also made great progress in terms of lowering carbon use, leading to a reduction in per capita carbon emissions year by year.
Among the negative drivers of the change of carbon emissions in the logistics industry, the effect of output carbon intensity is the strongest, and its effect increased gradually, from 2.5465 million tons in 2000–2006 to 10.1304 million tons in 2007–2012 and then to 23.14 million tons in 2013–2019. This can be attributed to the commitment made by the Chinese government during the 11th Five-Year Plan (2011–2015) to achieve the target of reducing carbon intensity by 45% in 2020. In 2017, China’s carbon intensity decreased by about 46% compared with 2005, reaching the 2020 carbon intensity target ahead of schedule. Therefore, with the development of new technologies in the logistics industry and with attention paid to the development model of the low-carbon economy, it is expected that the negative driving effect of the carbon intensity of logistics output will be further enhanced in the next few years.
The negative driving effect of per capita added value in the logistics industry was relatively stable in three periods, with a minimum of 1.8435 million tons and a maximum of 2.0749 million tons. Energy intensity had a less negative driving effect on carbon dioxide emissions, from 143,800 tons in 2001–2006 to 232,700 tons in 2007–2012, and then to 222,500 tons in 2013–2019, but it accounted for a very small share of overall carbon dioxide emissions of no more than 1%.
The carbon intensity of energy consumption in the logistics industry was driven in both directions, increasing carbon emissions by 111,000 tons in 2001–2006 and reducing carbon emissions by 3.1915 million tons and 7.4096 million tons in 2007–2012 and 2013–2019, respectively. The transformation from an initial positive driving role to a negative driving effect shows that the energy utilization efficiency of China has gradually improved and the energy structure has been optimized to a certain extent. This is affected by the shift from rapid economic development to high-quality development proposed by China in recent years, as well as the government’s attention to ecological civilization and the prevention and control of air pollution, and the logistics industry is also constantly promoting the adjustment of the industrial structure and energy structure. Energy conservation and carbon reduction are being vigorously carried out, as well as the construction of an ecological civilization, thus promoting the carbon emission reduction of the transportation industry. Therefore, speeding up the adjustment of the energy structure and reducing the carbon intensity of energy consumption is very important for the logistics industry to achieve the goal of energy saving and emission reduction.

4.2. Analysis of the Main Driving Factors of Carbon Emission

The analysis in this section is based on the statistical information of China’s logistics industry’s GDP, energy consumption, and the logistics population from 2000 to 2019 provided by the website of the National Bureau of Statistics of China [44]. This paper used GDIM to decompose the influencing factors of China’s logistics CO2 emissions. In this paper, the GDIM decomposition method is used to decompose the influencing factors of carbon emissions in China’s logistics industry. The contribution value and contribution rate of each influencing factor are calculated. Table 4 and Table 5 showed the results of decomposition. The results are shown in Table 4 and Table 5.

4.2.1. The Influence of Output Added Value of the Logistics Industry

From the data in Table 4 and Table 5 (GDP), the added value of the output of the logistics industry can be seen to make a positive contribution to carbon emissions and has an obvious promoting effect on carbon emissions, with a cumulative contribution rate of 68.62% and a contribution of 80.2651 million tons, respectively. The contribution rate of the output added value to the carbon emissions of the logistics industry is greater than other factors, which shows that the output added value is the most important factor affecting the carbon emissions of the logistics industry.
From 2001 to 2019, the contribution of industrial added value to the logistics industry fluctuated up and down, but the overall trend was upward. The contribution of the added value of the output of the logistics industry to carbon emissions increased from 2.2444 million tons in 2001 to 3.2204 million tons in 2019, and the contribution rate decreased from 3.87% to 1.72%. The contribution value in the middle year of the period was in a state of fluctuation, and the decomposed carbon emissions reached the maximum value of 7.2065 million tons in 2017, with a contribution rate of 4.12%. Affected by the world financial crisis, the contribution of the output scale to carbon emissions decreased sharply from 2008 to 2009, with carbon emissions of only 352,200 tons in 2009, but carbon emissions gradually returned to normal after 2010, indicating that the logistics industry gradually recovered after the economic crisis. This is because, in recent years, with the development of e-commerce and mobile Internet, online shopping has become a new consumption pattern, and express logistics has developed rapidly. A large number of express companies and the disorderly development of urban distribution have also led to the increase of carbon dioxide emissions in the logistics industry to a certain extent.
After disorderly development, the government began to carry out regulation and control at the national level, such as the “medium-and long-term plan for the Development of the Logistics Industry (2014–2020) [44]” initiated by the State Council of China. It was clearly pointed out that, by 2020, a modern logistics service system with reasonable layout, advanced technology, convenience, efficiency, environmental protection, safety and order should be basically established. This requires the use of energy-saving and environmental protection technology and equipment, the improvement of the level of organization and networking of logistics operation, and a reduction in the overall energy consumption and pollutant emission level of the logistics industry. The contribution of the added value of output in 2019 was 3.2201 million tons—an increase of only 43.49% compared with 2001—and the contribution still showed a downward trend, indicating that the development of the industry is consistent with the policy designated by the Chinese government and is developing in the direction of energy conservation and emission reduction.

4.2.2. The Influence of Energy Consumption in the Logistics Industry

The contribution rate of energy consumption (E, Table 4) to carbon dioxide emissions varies from year to year. Overall, from 2001 to 2019, the contribution of energy consumption to carbon emissions showed a “W” type, first increasing and then decreasing, increasing, and then decreasing. The cumulative contribution rate was 43.92%, representing an important positive driver.
From 268,000 tons in 2001 to 2.1097 million tons in 2018, the contribution rate increased from 0.46% to 1.16%. In 2019, the contribution rate of energy consumption to carbon emissions was negative for the first time, and the contribution value also dropped to 403,100 tons. The reason behind this may be the great improvement of the living standards of the Chinese people since the start of the 21st century; furthermore, the popularity of the mobile Internet has driven people’s demand for materials and services, and the logistics industry has purchased a large number of new means of transportation to meet the needs of customers, resulting in an increase in energy consumption in the whole industry. With the continuous promotion of the national energy conservation and emission reduction policy, as well as the improvement of people’s low-carbon awareness and the increase in the use of clean energy, the contribution of energy consumption to carbon emissions gradually decreased from a positive high contribution rate to a land contribution rate and then turned to a negative contribution rate, showing an inhibitory effect on carbon dioxide emissions.

4.2.3. The Influence of the Size of Staff in the Logistics Industry

The contribution value of staff size (P, Table 5) in different years was mostly positive, and the cumulative contribution rate and contribution value were 24.06% and 27.8405 million tons, respectively, indicating that personnel size can promote the increase of carbon emissions in China’s logistics industry.
Overall, there were several extremes in the contribution of staff size to the carbon emissions of China’s logistics industry from 2001 to 2019, in 2012, 2009 and 2013, respectively. The contribution rates and contribution values were 8.85%, 2.49%, 7.36%, and 8.42% and 5.5522 million tons, 2.8338 million tons, 10.1851 million tons, and 12.8105 million tons, respectively. In other years, the contribution rates and contribution values were mostly negative, indicating that the promoting effect of staff size on the carbon emissions of the logistics industry is mainly reflected in these four years, and the other years are more likely to restrain carbon emissions. The reason is probably that, at these three time points, major events occurred, such as the SARS epidemic, the global financial crisis and other major emergencies, which had a significant impact on the transfer of goods and personnel. The national experience of the SARS epidemic greatly increased the demand for materials and personnel, while the wave of economic recovery after the financial crisis drove the development of the real economy, thus promoting the increase of logistics carbon emissions.

4.2.4. Carbon Intensity of Logistics Industry

The contribution rate of carbon intensity of logistics output (CO2/GDP Table 4) was both positive and negative within the period of the study. However, the total contribution rate and contribution value were −24.3% and −35.8241 million tons, respectively. This had an inhibitory effect on carbon dioxide emissions from the logistics industry, and the cumulative inhibition of carbon intensity from 2001 to 2019 exceeded the sum of other influencing factors, making it the most important negative factor.
Carbon emissions per unit of output are reducing over time, which is related to the development of logistics technology. Since 2012, the Chinese government has advocated the improvement of logistics technology, upgrading logistics equipment and speeding up the research and application of key technologies and equipment. Thus, companies must enhance the level of informationization and intelligence of the logistics industry, innovate the mode of operation and management, and improve the level of supply chain management and logistics services to create new advantages for the coordinated development of the logistics industry and the manufacturing industry, commerce and trade industry, and financial industry. The contribution rate and contribution value of the carbon intensity of the output of the logistics industry from 2013 to 2019 were negative, proving that this factor has a significant inhibitory effect on carbon emissions and also showing that technological progress is an important decisive factor to solve carbon emissions; the results of this analysis are consistent with the research report released by the IPCC.

4.2.5. Carbon Intensity of Energy Consumption in Logistics Industry

The contribution value of the carbon intensity of energy consumption to carbon emissions appears to alternate, and the total contribution value is negative, indicating that the carbon intensity of energy consumption has an inhibitory effect on the carbon emissions of the logistics industry.
Within the period of the study, the contribution rate was positive and negative from 2001 to 2012, but since 2013, the contribution rate and contribution value have remained negative, and the absolute values of the contribution rate and contribution value reached a peak in 2019, indicating that the inhibitory effect on carbon emissions is increasing. This is because, in 2012, China’s State Council issued the 12th Five-Year Plan for energy saving and emission reduction, which set a target of reducing the energy consumption per 10,000 yuan of GDP to 0.869 tons of standard coal by 2015—down 16% from 2010. This requires the joint efforts of various industries, and the industrial structure of the logistics industry has been optimized and the energy consumption structure has been improved to a certain extent through the efforts of the logistics industry in recent years. In response to the policies designated by the Chinese government, the logistics industry continues to improve new technologies and increase the proportion of clean energy use, and the carbon intensity of energy consumption shows a stable inhibitory effect.

4.2.6. Impact of Per Capita Carbon Emissions in Logistics Industry

As can be seen from Table 4 and Table 5, the contribution rate and contribution value of per capita carbon emissions have been positive in most years and negative in a few years, proving that per capita carbon emissions can promote the increase of carbon emissions. Overall, from 2001 to 2019, per capita carbon emissions contributed a large amount of carbon dioxide to China’s logistics industry, accounting for 15.9799 million tons, with a contribution rate of 19.19%. This is mainly because a considerable part of the carbon emissions of the logistics industry comes from the flow of people. China has been seeking rapid development in recent years. Behind this economic development is the cooperation between people, and the mobility of people has led to the increase of traffic demand, thus promoting the increase of carbon dioxide emissions. It may also be true that, with the improvement of people’s income level, while the demand for public transport travel increases, a large number of people are buying private cars, which increases energy consumption, thus promoting the increase of carbon dioxide emissions.

4.2.7. The Impact of Per Capita Value Added in the Logistics Industry

The per capita added value of the logistics industry shown in Table 4 (GDP/P) had an inhibitory effect on CO2 emissions within the period of the study. The total contribution value and total contribution rate were 5.83 million tons and 5.48%, respectively. The absolute value accounts for a relatively small proportion of the total, which seems to be counterintuitive. It can be seen that the contribution rate of this factor to carbon dioxide is different in different years, and the increasing and decreasing trend appears alternately, but the value of the contribution rate is not very different. In Figure 5, the inhibition of the per capita added value of the logistics industry tends to be consistent in three time periods, and there is no difference in the time periods.
Vaninsky [23] pointed out that per capita added value is a relative index, which is the ratio of the added value to the size of the employed population. The fluctuation of these two absolute indicators affects their respective carbonization, which is likely to be out of sync. Secondly, the per capita added value of the logistics industry is related to several other indicators, and other indicators are affected by Equation (14). In this way, the change in per capita value added is distributed among all these indicators. Only part of its change is caused by this, which is included in the impact on changes in CO2 emissions, and the rest is included in the images of several other indicators. Therefore, the interconnected nature of per capita added value means that it shows a negative driving effect. The inhibitory effect of per capita added value on the carbon emissions of the logistics industry implies that the driving force of people’s welfare lags behind the economic development of China’s logistics industry.

4.3. The Influence of Energy Intensity

Energy intensity (Table 4 and Table 5, GDP/E)—that is, energy consumption per unit output—showed a significant inhibitory effect on carbon dioxide emissions within the period of the study, but because the absolute value of its contribution rate was significantly lower than other indicators every year, the contribution value of this factor was far less than other indicators, and the cumulative contribution rate of carbon emission reduction from 2001 to 2018 was only 0.53%. The energy consumption per unit output of the logistics industry gradually decreased, and the energy use efficiency increased, but on the whole, it had little inhibitory effect on carbon dioxide emissions.

4.4. Analysis of Cumulative Contribution of Influencing Factors

It can be seen from Table 4 and Table 5 that the impact of various factors on the carbon emissions of the logistics industry fluctuated to either a large or small extent in different years, and some indicators changed their direction within the period of the study. With this in mind, 
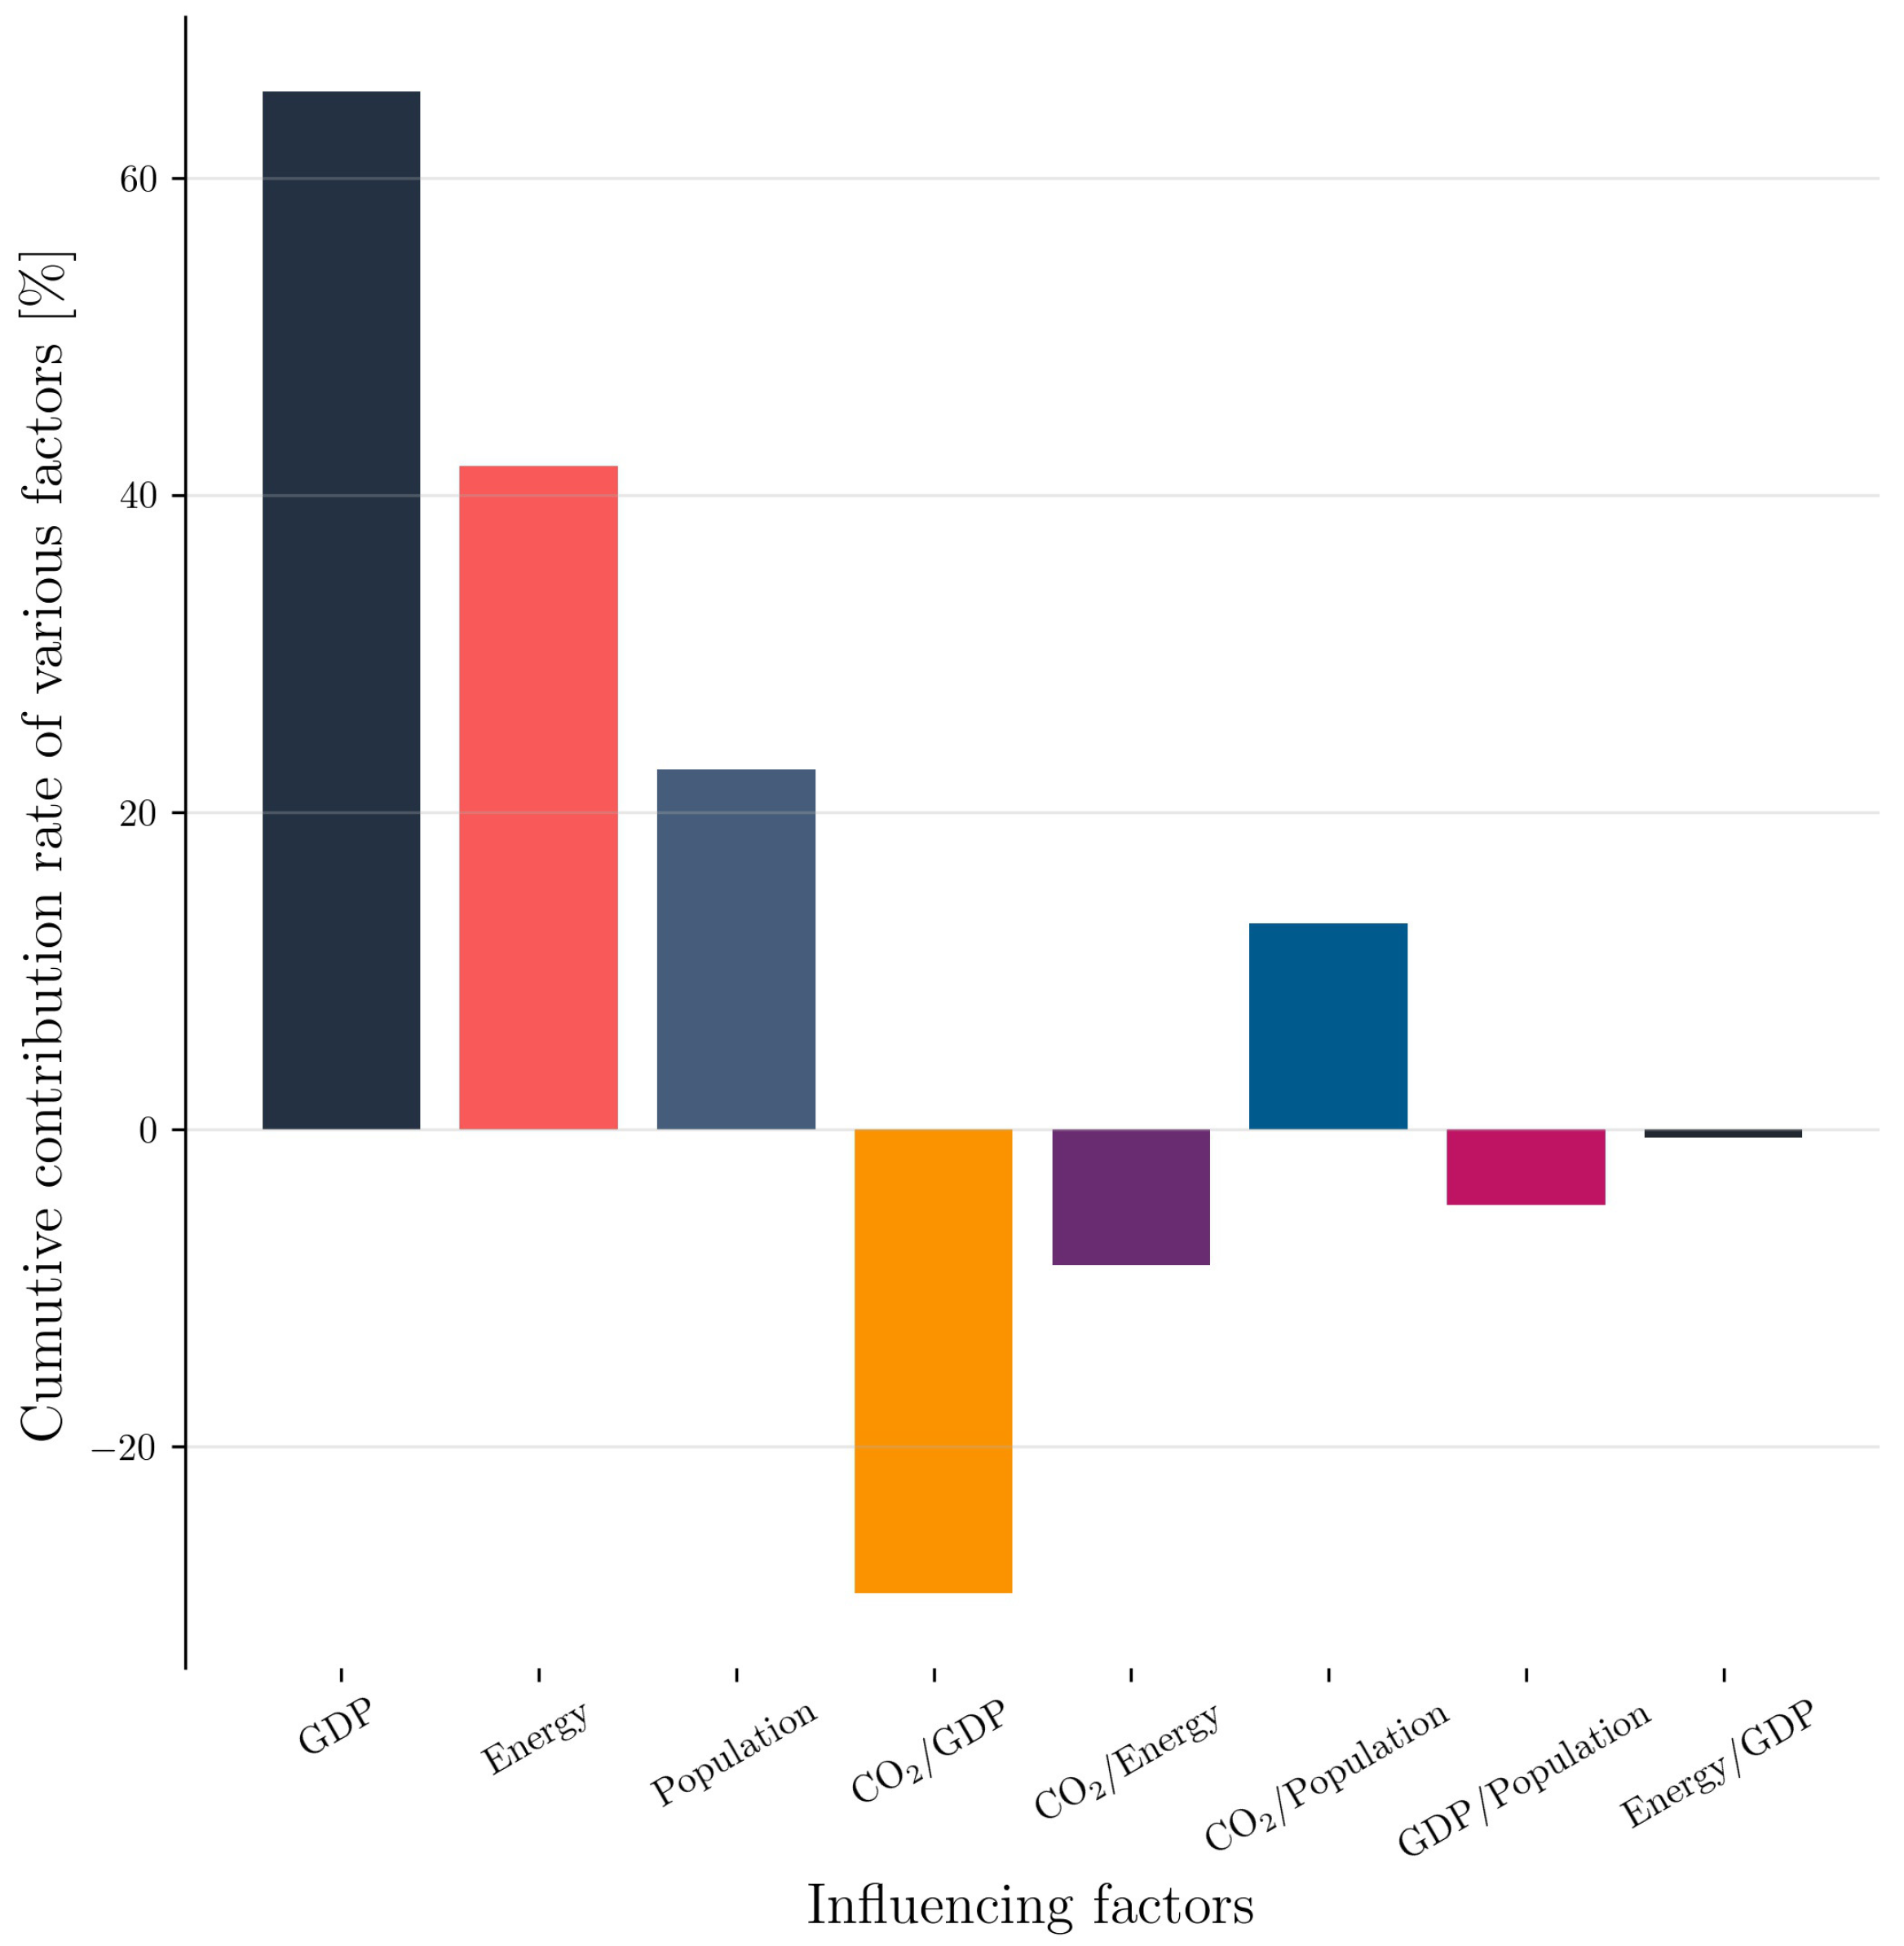
Figure 6 shows the result analyzed from the average data.
As can be seen, the most significant factors leading to the increase in CO2 emissions from the logistics industry were the added value of output (65%), energy consumption (41.83%), the size of the employed population (22.7%), and per capita carbon emissions (13.03%). The key factors leading to the decline in carbon dioxide emissions were output carbon intensity (−29.21%), energy carbon intensity (−8.55%), and energy intensity (−0.49%). Considering the correlation between the per capita added value and other indicators, it is not advisable for this factor to reduce the carbon emissions of the logistics industry.
In the development of China’s logistics industry, we should give full play to the specific role of output carbon intensity and energy consumption carbon intensity in the development of China’s low-carbon, peak-carbon, or carbon neutralization efforts, constantly improve logistics facilities and equipment, and upgrade logistics technology. Energy consumption per unit output should be reduced and the low-carbon and clean development of energy structure should be achieved as far as possible, and the overall carbon emissions of the logistics industry should be reduced.

5. Next Step

This article provides a good example for the use of GDIM, and the method can also be applied to the economic and technical fields. Logistics is a complex system composed of people, goods and transportation. The selection of influencing factors can be appropriately changed to expand the model so as to study the impact of other factors on carbon emissions in the logistics industry. In addition, China has a large land area, and there are certain differences in economic development between regions. So do the same influencing factors have the same impact in different provinces or regions? What are the differences in the analysis of influencing factors in different regions? Research in this area is currently rare. Other scholars can conduct research in this field.

6. Conclusions and Suggestions

6.1. Conclusions

The logistics industry is an important part of China’s energy consumption and carbon emissions. To achieve China’s ambitious goal of peaking carbon in 2030 and being carbon neutral by 2060, the logistics industry must assume the important mission of carbon emission reduction; strive to find an effective way to save energy and reduce emissions; as well as coordinating development and reducing carbon. This will determine whether China will be successful in reaching the goals of the Third Paris Peace Forum on 12 November 2020.
In this paper, carbon emission coefficient method is used to calculate the carbon dioxide emissions, followed by a comparison of carbon emissions among 9 categories of energy. Compared with previous researches, it’s the first time that Generalized Divisia Index Method is used for factoring carbon emissions in Chinese logistics industry during 2000–2019. This method takes into account more absolute variables and their interrelations, thus making up the deficiencies of Arithmetic Mean Divisia Index and Logarithmic Mean Divisia Index. The growth of CO2 emissions in logistics industry was decomposed into GDP, energy consumption, size of population in the industry, output carbon intensity, energy consumption carbon intensity, carbon emission per capital, added value per capital and energy intensity. Subsequently, the paper measured the evolution of carbon emissions and the contribution of different influencing factors. The results reveal the main factors driving carbon dioxide emissions and provide wise suggestions for changing economic activities to improve environmental performance. The following conclusions are reached based on the research result:
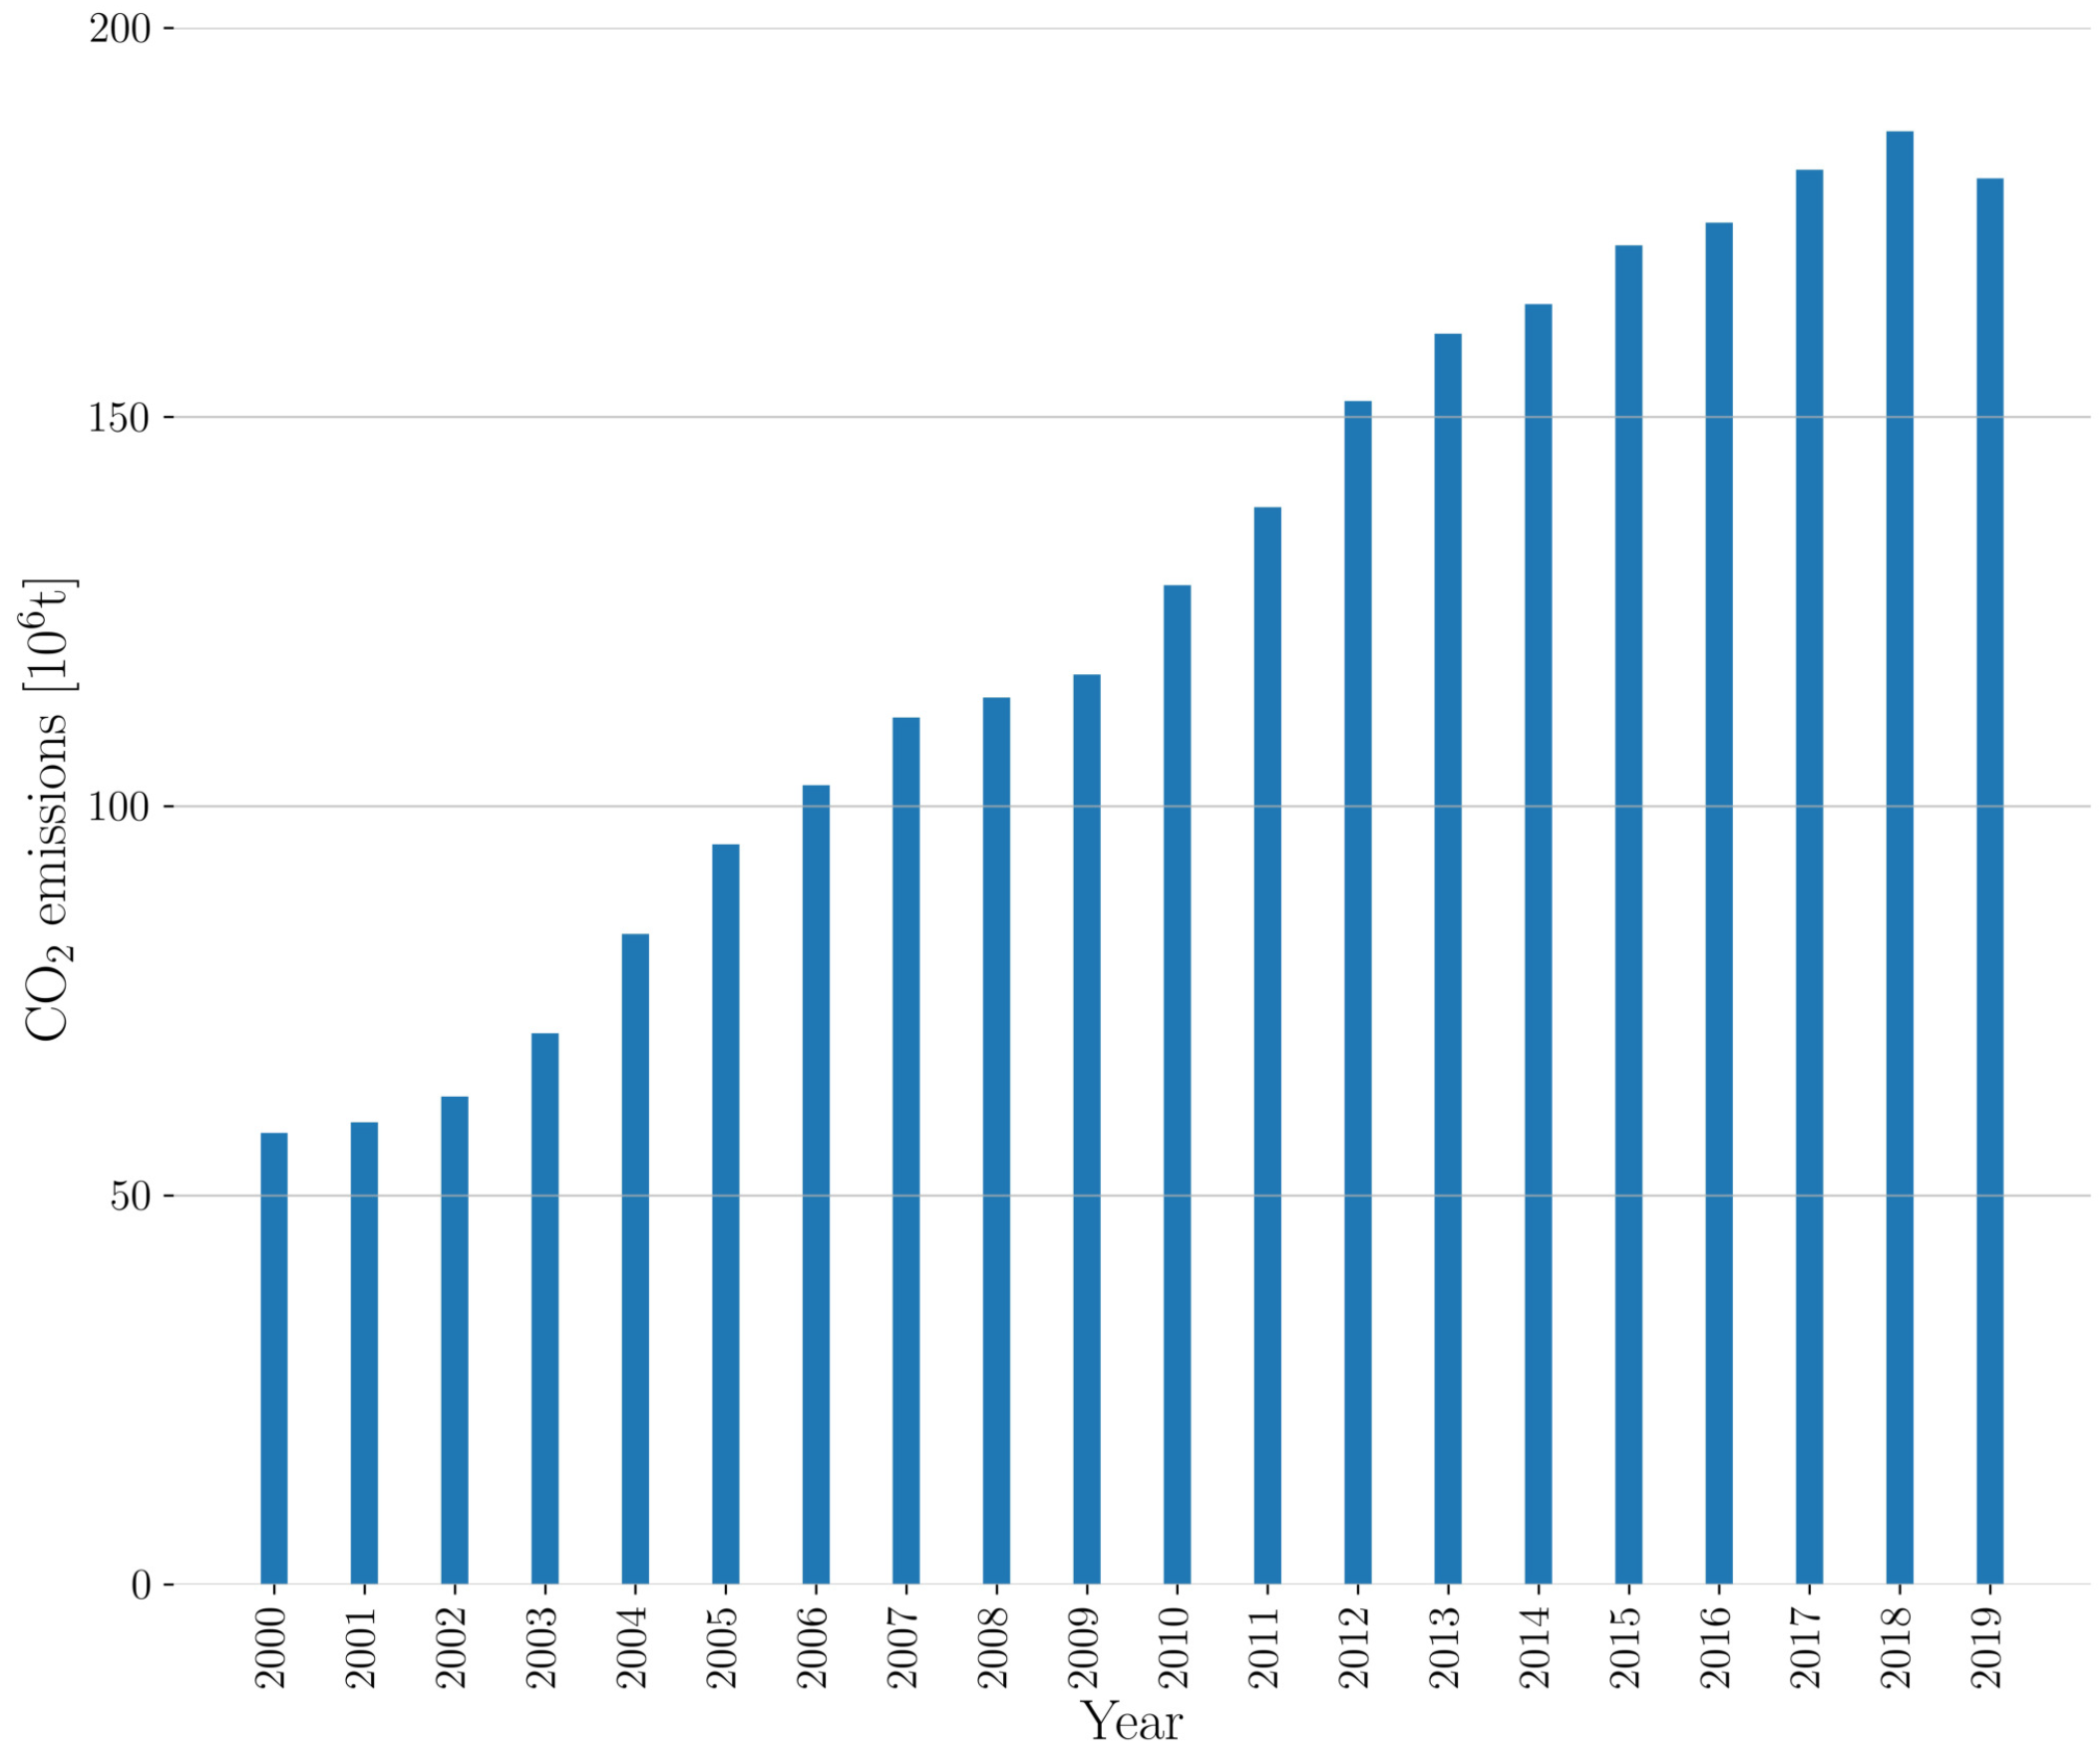
(1) The total carbon emissions in China’s logistics industry are still increasing. The carbon emissions increased from 58.01 million tons in 2000 to 186.72 million tons in 2018, with an annual growth rate of 16.9%. In 2019, there was a negative growth for the first time, with 180.65 tons of carbon emissions. This indicates that the structure of logistics industry is being constantly optimized, with a gradual transition to low-carbon and environment-friendly development.
(2) In the decomposition of the staged factors of carbon emissions in the logistics industry, carbon dioxide emissions first increase and then decrease. Upon analysis of the performance of each influencing factor in the staged and cumulative contributions, it is found that the performance of the factors is basically the same.
(3) In terms of accumulative contribution of carbon emissions, the added value of logistics industry was the most important factor of increased carbon emissions, with an accumulative contribution ratio of 65.45% and an accumulative contribution of 80.27 million tons. The rapid development of the logistics industry has caused a large amount of energy consumption, and the carbon emissions brought about by economic growth accounted for the largest proportion of the total. Therefore, energy consumption is the main factor of increased carbon emissions (41.83%), but its role in promotion is gradually declining. This indicated that the development is no longer based on energy consumption as the main driving force for development. The cumulative contribution rate of the employed population is 22.7%, which has an obvious promotion effect. Per capita carbon emissions have a positive impact on carbon emissions. The output carbon intensity is the most important factor leading to the reduction of carbon emissions. The cumulative contribution rate is −29.21%, and the cumulative contribution value is −35.82 million tons. It shows that with the development of the logistics industry, the carbon dioxide released per unit of output is showing a decreasing trend. Part of the reason is that technological progress has reduced the energy consumption of production activities. The energy carbon intensity has a restraining effect on carbon emissions, with a cumulative contribution rate of −8.55%. Per capita value-added has a restraining effect on carbon emissions, but considering the correlation between this indicator and other indicators, its restraining effect is not considered.
(4) The cumulative inhibitory effect of negatively-acting factors on carbon emissions is much smaller than the cumulative effect of positively-acting factors. Therefore, in recent years, the logistics industry’s carbon emissions still show an increasing trend, but the growth trend has been significantly weakened. The logistics industry is developing towards a low-carbon saving model.

6.2. Policy Suggestion

Based on the above research results, regarding the continued growth of carbon emissions in China’s logistics industry, the following suggestions are made to policy makers:
(1) Change the economic growth mode to achieve high-quality development. The increased value of the logistics industry is the most important factor in promoting the increase in carbon emissions. Carbon emission reduction is not advisable at the expense of economic development, but it is possible to transform the development mode, adjust the industrial structure, and gradually introduce high-tech, reasonable planning to build a low-carbon logistics park, and transform from rapid development to a high-quality development model.
(2) Improve the energy efficiency of the logistics industry and promote the use of new facilities. As can be seen from Figure 6, energy consumption is the second largest factor in promoting carbon emissions growth. Gasoline, kerosene, and fuel oil are accounted for in the total energy, which is mainly due to the energy demand of transportation vehicles and handling equipment. Furthermore, the use of clean energy such as natural gas and electricity is still not very common. Therefore, the government should formulate relevant policies from source governance, reduce high-energy consumption, retract high emission facility equipment from the market, guide the logistics industry to update old equipment, and encourage special equipment and green energy-saving equipment using cleaning energy. Furthermore, the government should develop public transportation, engage in the reasonable planning of urban traffic network layouts, minimize energy consumption, and reduce total CO2 emissions.
(3) Adjust the structure of energy and increase the proportion of clean energy usage. From Table 4, it can be seen that, from 2000 to 2019, the proportions of coal, coke, crude oil, and fuel oil in total energy consumption were greatly reduced, but the consumption rates of gasoline, kerosene, and diesel in 2019 were still as high as 88.46%. The energy carbon intensity is a main factor in reducing carbon emissions. In the future, the government should adopt the following policies: optimize the energy structure of the logistics industry, reduce the use of traditional high pollution energy, and improve the use of clean energy. For example, new energy vehicles should be used instead of previous high-emission vehicles, while the government should encourage the research and development of low-carbon environmental protection logistics facilities; for example, using electric forklifts instead of fuel trucks.
(4) Improve the low-carbon awareness of logistics practitioners. As can be seen from Table 5 and Figure 6, developing the size of the economy and per capita carbon emissions are positive ways to promote carbon emissions. Therefore, in the carbon reduction initiative of the Chinese logistics industry, people are very important. Low-carbon conservation awareness should be popularized and the propaganda to enterprises and the people should be strengthened; the former to save energy consumption, and the latter to reduce cost spending and obtain more profits. Excellent low-carbon logistics enterprises can be screened to play demonstrative roles in society for other enterprises. The government can also give appropriate policy advantages to excellent environmentally friendly companies.

Author Contributions

Methodology and manuscript, W.Z. and C.Z.; algorithm, W.L.; investigation, X.G.; data collection, B.Z., revision, C.Z. All authors have read and agreed to the published version of the manuscript.

Funding

This research received no external funding.

Institutional Review Board Statement

This research does not involve human or animal.

Informed Consent Statement

The research does not involve humans.

Data Availability Statement

The data used in this study comes from the following website. https://data.stats.gov.cn/easyquery.htm?cn=C01.

Conflicts of Interest

The authors declare no conflict of interest.

Abbreviations

The following abbreviations are used in this manuscript:
CO2Carbon Dioxide
IEAInternational Energy Agency
FDIInternational Direct Investment
AMDIArithmetic Mean Divisia Index
LMDILogarithmic Mean Divisia Index
GDIMGeneralized Divisia Index Method

References

  1. Dong, K.; Hochman, G.; Timilsina, G. Do drivers of CO2 emission growth alter overtime and by the stage of economic development? Energy Policy 2020, 140, 111420. [Google Scholar] [CrossRef]
  2. Global CO2 Emissions in 2019. Paris: International Energy Agency. Available online: https://www.iea.org/articles/global-CO$_2$-emissions-in-2019 (accessed on 25 May 2021).
  3. O’Neill, S. Global CO2 emissions level off in 2019, with a drop predicted in 2020. Engineering 2020, 6, 958. [Google Scholar] [CrossRef] [PubMed]
  4. International Energy Agency: CO2 Emissions from Fuel Combustion 2020. Available online: http://cms2018a.globalcarbonatlas.org/cn/CO2-emissions (accessed on 30 May 2021).
  5. Lin, B.; Sun, C. Evaluating carbon dioxide emissions in international trade of China. Energy Policy 2010, 38, 613–621. [Google Scholar] [CrossRef]
  6. Zhang, S.; Wang, J.; Zheng, W. Decomposition analysis of energy-related CO2 emissions and decoupling status in China’s logistics industry. Sustainability 2018, 10, 1340. [Google Scholar] [CrossRef] [Green Version]
  7. Duan, H.; Mo, J.; Fan, Y.; Wang, S. Achieving China’s energy and climate policy targets in 2030 under multiple uncertainties. Energy Econ. 2018, 70, 45–60. [Google Scholar] [CrossRef]
  8. Shipper, L.; Scholl, L.; Price, L. Energy Use and Carbon Emissions from Freight in 10 Industrialized Countries: An Analysis of Trends from 1973 to 1992. Transp. Res. D Transp. Environ. 1997, 2, 57–76. [Google Scholar] [CrossRef]
  9. A Study of Developing Chinese Low Carbon Logistics in the New Railway Period. Available online: https://ieeexplore.ieee.org/abstract/document/5660847 (accessed on 15 May 2021).
  10. Heiko, A.; Darkow, I.L. Energy-constrained and low-carbon scenarios for the transportation and logistics industry. Int. J. Logist. Manag. 2016, 27, 142–166. [Google Scholar]
  11. Study on Logistics Mode of Furniture Industry Based on the Low-Carbon Concept. Available online: https://ascelibrary.org/doi/abs/10.1061/41139(387)89 (accessed on 20 May 2021).
  12. Lee, P.T.W.; Kwon, O.K.; Ruan, X. Sustainability challenges in maritime transport and logistics industry and its way ahead. Sustainability 2019, 11, 1331. [Google Scholar] [CrossRef] [Green Version]
  13. Rüstemoğlu, H.; Andrés, A.R. Determinants of CO2 Emissions in Brazil and Russia between 1992 and 2011:A Decomposition Analysis. Environ. Environ. Sci. Policy 2016, 58, 95–106. [Google Scholar] [CrossRef]
  14. Hatzigeorgiou, E.; Polatidis, H.; Haralambopoulos, D. CO2 Emissions in Greece for 1990–2002: A Decomposition Analysis and Comparison of Results Using the Arithmetic Mean Divisia Index and Logarithmic Mean Divisia Index Techniques. Energy 2008, 33, 492–499. [Google Scholar] [CrossRef]
  15. Ang, B.; Zhang, F. A Survey of Index Decomposition Analysis in Energy and Environmental Studies. Energy 2000, 25, 1149–1176. [Google Scholar] [CrossRef]
  16. Wang, Y.; Zhou, Y.; Zhu, L.; Zhang, F.; Zhang, Y. Influencing factors and decoupling elasticity of China’s transportation carbon emissions. Energies 2018, 11, 1157. [Google Scholar] [CrossRef] [Green Version]
  17. Timilsina, G.R.; Shrestha, A. Factors Affecting Transport Sector CO2 Emissions Growth in Latin American and Caribbean Countries: A LMDI Decomposition Analysis. Int. J. Energy Res. 2009, 33, 396–414. [Google Scholar] [CrossRef]
  18. Zhang, L. Analysis of Driving Factors of CO2 Emission Changes in China’s Logistics Industry. China Bus. Mark. 2016, 30, 29–39. [Google Scholar]
  19. Wang, W.; Zhang, M.; Zhou, M. Using LMDI method to analyze transport sector CO2 emissions in China. Energy 2011, 36, 5909–5915. [Google Scholar] [CrossRef]
  20. Ang, B.W. Decomposition methodology in industrial energy demand analysis. Energy 1995, 20, 1081–1095. [Google Scholar] [CrossRef]
  21. Liu, Y.; Li, L. Research on Decoupling and Influencing Factors of Carbon Emissions in China’s Logistics Industry. Environ. Sci. Technol. 2018, 41, 177–181. [Google Scholar]
  22. Liu, Y.; Li, L.; Song, Y. Regional Differences in Influencing Factors of Carbon Emissions in China’s Logistics Industry. Resour. Dev. Mark. 2017, 33, 1439–1443. [Google Scholar]
  23. Vaninsky, A. Factorial Decomposition of CO2 Emissions: A Generalized Divisia Index Approach. Energy Econ. 2014, 45, 389–400. [Google Scholar] [CrossRef]
  24. Ma, X.; Chen, R.; Dong, B.; Niu, X.Q. Factor Decomposition and Decoupling Effect of China’s Industrial Carbon Emissions. China Environ. Sci. 2019, 39, 3549–3557. [Google Scholar]
  25. Li, Q.; Hu, J.; Yu, B. Spatiotemporal Patterns and Influencing Mechanism of Urban Residential Energy Consumption in China. Energies 2021, 14, 3864. [Google Scholar] [CrossRef]
  26. Wang, J.; Dong, X.; Dong, K. How renewable energy reduces CO2 emissions? Decoupling and decomposition analysis for 25 countries along the Belt and Road. Appl. Econ. 2021, 53, 1–17. [Google Scholar] [CrossRef]
  27. Sun, Y.; Yang, G. Decomposition of Influencing Factors and Decoupling Effects of China’s Tourism Carbon Emissions. China Environ. Sci. 2020, 40, 5531–5539. [Google Scholar]
  28. Chu, L.; Jiang, Z.; Ren, T. Empirical Decomposition and Peak Forecast of China’s Agricultural Carbon Emissions—Based on the Perspective of Dynamic Policy Scenarios. J. China Agric. Univ. 2020, 25, 187–201. [Google Scholar]
  29. Dias, O.; Vaninsky, A. Factor analysis of the CO2 emissions in the united states with implications for the environmental policy. J. Soc. Sci. Res. 2015, 7, 136–1371. [Google Scholar] [CrossRef]
  30. Li, Z.; Zhu, Y.; Wu, X. Research on Driving Factors of Carbon Emissions from Manufacturing in Shandong Province—Based on GDIM Method. East China Econ. Manag. 2019, 33, 30–36. [Google Scholar]
  31. Shao, S.; Zhang, X.; Zhao, X. Empirical Decomposition and Peaking Pathway of Carbon Dioxide Emissions of China’s Manufacturing Sector—Generalized Divisia Index Method and Dynamic Scenario Analysis. China Ind. Econ. 2017, 34, 44–63. [Google Scholar]
  32. Yu, B.; Fang, D. Decoupling economic growth from energy-related PM2.5 emissions in China: A GDIM-based indicator decomposition. Ecol. Indic. 2021, 127, 107795. [Google Scholar] [CrossRef]
  33. Wang, Y.; Han, S.; Li, J. Empirical Decomposition and Scenario Prediction of Carbon Peak in Five Transportation Modes–Taking Three Northeast Provinces as Examples. Resour. Sci. 2019, 41, 1824–1836. [Google Scholar]
  34. Yan, Y.; Yi, J. Decomposition of Carbon Emission Factors in the Beijing-Tianjin-Hebei Region Based on the Decomposition Method of Generalized Divisia Index. Science and Technology. Sci. Technol. Manag. Res. 2017, 37, 239–245. [Google Scholar]
  35. Yan, Q.; Yin, J.; Baležentis, T.; Makutėnienė, D.; Štreimikienė, D. Energy-related GHG emission in agriculture of the European countries: An application of the Generalized Divisia Index. J. Clean. Prod. 2017, 164, 686–694. [Google Scholar] [CrossRef]
  36. Cao, J.; Zhou, L. Research on the Temporal and Spatial Distribution and Influencing Factors of Carbon Emissions of Logistics Industry in the Yangtze Delta. Stat. Decis. 2021, 37, 79–83. [Google Scholar]
  37. Zhu, C.Z.; Gao, D.W. A Research on the Factors Influencing Carbon Emission of Transportation Industry in the Belt and Road Initiative Countries Based on Panel Data. Energies 2019, 12, 2405. [Google Scholar] [CrossRef] [Green Version]
  38. Zhu, C.Z.; Wang, M.; Yang, Y.R. Analysis of the Influencing Factors of Regional Carbon Emissions in the Chinese Transportation Industry. Energies 2020, 13, 1100. [Google Scholar] [CrossRef] [Green Version]
  39. Wang, Z.; Yang, Y. Features and influencing factors of carbon emissions indicators in the perspective of residential consumption: Evidence from Beijing, China. Ecol. Indic. 2016, 61, 634–645. [Google Scholar] [CrossRef]
  40. Zhao, M.; Tan, L.; Zhang, W.; Ji, M.; Liu, Y.; Yu, L. Decomposing the influencing factors of industrial carbon emissions in Shanghai using the LMDI method. Energy 2010, 35, 2505–2510. [Google Scholar] [CrossRef]
  41. Ma, X.; Wang, C.; Dong, B.; Gu, G.; Chen, R.; Li, Y.; Zou, H.; Zhang, W.; Li, Q. Carbon emissions from energy consumption in China: Its measurement and driving factors. Sci. Total Environ. 2019, 648, 1400–1420. [Google Scholar] [CrossRef] [PubMed]
  42. Kaya, Y. Impact of Carbon Dioxide Emission Control on GNP Growth: Interpretation of Proposed Scenarios; IPCC Energy and Industry Subgroup, Response Strategies Working Group: Paris, France, 1990. [Google Scholar]
  43. National Bureau of Statistics. Available online: http://www.stats.gov.cn/ (accessed on 1 June 2021).
  44. Long-Term Planning for the Development of the Logistics Industry (2014–2020). Available online: http://www.gov.cn/zhengce/content/2014-10/04/content$_$120.htm (accessed on 26 May 2021).
Figure 1. Carbon dioxide emissions of China’s logistics industry from 2000 to 2019.
Energies 14 05742 g001
Figure 2. Added value and carbon intensity of China’s logistics industry in 2000–2019.
Energies 14 05742 g002
Figure 3. Energy consumption, energy intensity, and carbon intensity of energy consumption in the logistics industry in 2000–2019.
Energies 14 05742 g003
Figure 4. Added value and carbon intensity of China’s logistics industry in 2000–2019.
Energies 14 05742 g004
Figure 5. Staged factor decomposition results of carbon emission evolution of the logistics industry.
Energies 14 05742 g005
Figure 6. Cumulative contribution rate of carbon dioxide level change rate in China’s logistics industry from 2000 to 2019.
Energies 14 05742 g006
Table 1. Reference coefficient and carbon emission coefficient of standard coal converted from various energy sources.
EnergyReduced Standard Coal Coefficient
(Kg/Kg or Kg/m3)
Carbon Emission Coefficient
(t/t)
Coal0.71430.7476
Coke0.97140.1128
Crude oil1.42860.5854
Petrol1.47140.5532
Kerosene1.47140.3416
Diesel oil1.45710.5913
Fuel oil1.42860.6176
Natural gas1.330.4479
Power0.12292.2132
Notes: Data from Intergovernmental Panel on Climate Change of the UN (IPCC) and China Energy Statistical Yearbook.
Table 2. Calculation of carbon dioxide released by each kind of energy consumption.
YearCoal
(104 tons)
Coke
(104 tons)
Crudeoil
(104 tons)
Petrol
(104 tons)
Kerosene
(104 tons)
Dieseloil
(104 tons)
Fueloil
(104 tons)
Naturalgas
(108 m3)
Power
(108 KWh)
2000471.001.21146.391243.58269.362837.89749.965.2576.49
2001449.251.28142.011273.36281.822947.48754.376.5384.14
2002454.961.25147.141305.21360.263157.54751.819.7582.42
2003511.761.18124.031558.88372.793562.82829.6211.21110.69
2004442.160.20103.551900.20462.274295.201015.0515.58122.31
2005433.080.11106.101978.01478.725315.461059.6622.64117.05
2006411.160.09136.872110.13507.935641.061306.3528.14127.13
2007392.970.06136.872127.08567.966189.931552.8127.93144.68
2008355.340.03138.542515.54590.386590.521008.2742.62155.54
2009342.300.02128.312345.55660.586885.741104.3354.25167.83
2010341.230.01132.142665.71804.757459.211170.5163.56199.79
2011344.970.0188.152908.77827.518172.291186.8482.42230.77
2012327.880.0199.853075.24898.259242.231221.0592.04248.98
2013328.420.22124.383566.691004.359408.951260.80104.71272.25
2014297.980.3337.513797.221113.849514.291271.73127.73288.12
2015262.730.3329.984319.451259.039617.681270.07141.55306.17
2016215.740.3318.684485.961414.879536.431333.50151.77340.41
2017188.510.667.254638.481595.009627.061562.86169.60385.69
2018171.420.447.384938.911740.379621.231584.35170.49437.52
2019151.130.337.695083.231854.318501.511786.94203.42476.64
Summary6893.988.091862.8257,837.2117,064.35138,124.5123,780.861531.214374.60
Notes: Data from China National Bureau of Statistics.
Table 3. Four absolute variables of carbon emissions in the logistics industry.
YearCO2
(Million tons)
GDP
(Billion RMB)
Energy
(Million Tons)
Population
(Million People)
200058.01616.19114.474.06
200159.40687.13116.133.86
200262.70749.43123.133.80
200370.83791.48141.164.84
200483.57930.65166.424.77
200595.111066.88191.364.65
2006102.691218.63202.844.63
2007111.401460.51219.594.68
2008113.971636.76229.174.66
2009116.891652.24244.605.01
2010128.371878.36271.024.94
2011138.422184.20296.945.21
2012152.062376.32325.616.40
2013160.712604.27348.198.14
2014164.492853.44363.438.29
2015172.073051.95385.108.22
2016174.983302.87398.838.19
2017181.753712.19421.408.14
2018186.724033.72436.177.86
2019180.654246.63439.097.74
Notes: CO2—carbon dioxide emissions; GDP—value of the logistics industry; Energy—the energy consumption of the logistics industry converted into standard coal; Population—the number of people employed in the logistics industry.
Table 4. Contribution ratio of CO2 emissions of each decomposing factor. Unit: %.
YearGDPEPCO2/GDPCO2/ECO2/PGDP/PE/GDPSUM
20010.03870.0046−0.0162−0.02720.00340.0258−0.0043−0.00080.0240
20020.03050.0200−0.0054−0.0109−0.00150.0247−0.00190.00000.0556
20030.01850.04930.08850.0251−0.0054−0.0409−0.0050−0.00070.1296
20040.06110.0602−0.00530.00120.00040.0690−0.00670.00000.1798
20050.05040.0503−0.0087−0.0025−0.00370.0578−0.00550.00000.1381
20060.04810.0198−0.0010−0.01860.00660.0286−0.0032−0.00050.0797
20070.06640.02730.0034−0.03260.00070.0259−0.0051−0.00090.0849
20080.03990.0143−0.0018−0.0295−0.00680.0098−0.0024−0.00050.0230
20090.00310.02220.02490.0055−0.0133−0.0158−0.0005−0.00040.0256
20100.04650.0359−0.0047−0.0117−0.00310.0391−0.00390.00010.0982
20110.05380.03130.0182−0.0253−0.00560.0077−0.0016−0.00040.0783
20120.02890.03220.07360.00350.0006−0.0378−0.00240.00000.0985
20130.03090.02280.0842−0.0127−0.0041−0.0603−0.0036−0.00020.0569
20140.03150.01430.0060−0.0224−0.00660.0018−0.0008−0.00020.0235
20150.02330.0198−0.0027−0.0074−0.00440.0185−0.00100.00000.0461
20160.02720.0117−0.0013−0.0204−0.00620.0071−0.0011−0.00020.0169
20170.04120.0186−0.0020−0.0257−0.00590.0155−0.0026−0.00030.0387
20180.02900.0116−0.0113−0.0183−0.00260.0214−0.0024−0.00010.0273
20190.0172−0.02710.0022−0.0131−0.0049−0.0060−0.0007−0.0002−0.0325
Table 5. Contribution of CO2 emissions of each decomposition factor. Unit: 104 tons.
YearGDPCO2/GDPECO2/EPCO2/PGDP/PE/GDP
2001224.44−157.9426.8019.46−93.71149.81−24.97−4.76
2002181.45−64.73119.02−9.09−31.81146.67−11.37−0.04
2003116.20157.61309.37−33.72555.22−256.46−31.15−4.41
2004432.608.25426.092.86−37.75488.96−47.31−0.14
2005420.76−20.63420.55−31.03−72.61483.23−45.69−0.25
2006457.03−177.21188.7262.62−9.49271.63−30.50−4.79
2007681.38−334.59279.866.7534.60266.02−52.85−9.67
2008444.51−328.80159.08−75.95−19.87109.19−26.40−5.28
200935.2262.86252.94−151.09283.38−180.31−6.08−4.79
2010543.09−136.34419.42−35.83−54.94457.62−45.640.65
2011690.73−324.23402.11−71.34233.6398.58−20.08−4.55
2012399.4548.06445.698.301018.51−523.19−33.300.38
2013469.43−193.86347.06−62.661281.05−916.86−55.22−3.74
2014506.98−359.72229.82−106.3996.6228.29−13.60−3.99
2015384.05−122.42326.02−72.32−45.11305.02−17.260.28
2016468.69−350.53201.00−105.89−22.83122.71−19.53−2.92
2017720.65−450.37325.14−102.58−35.01270.37−45.40−5.36
2018527.80−332.44210.97−46.51−205.16388.75−43.81−2.62
2019322.04−505.3840.31−244.61−90.68−112.04−12.66−3.90
Publisher’s Note: MDPI stays neutral with regard to jurisdictional claims in published maps and institutional affiliations.

