
Determinants of Renewable Energy Production: Do Intellectual Property Rights Matter?


Abstract
: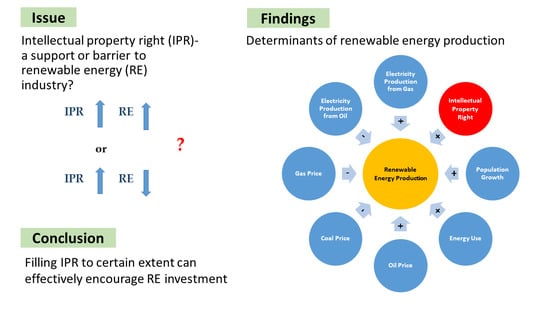
1. Introduction
2. Literature Review
3. Data and Methodology
3.1. Model Specification
3.2. Methodology
3.3. Data
4. Results and Discussion
4.1. Main Result
4.2. Robustness Check
5. Conclusions and Policy Implications
Author Contributions
Funding
Institutional Review Board Statement
Informed Consent Statement
Data Availability Statement
Conflicts of Interest
Appendix A

| Renewable Energy Electricity Production (WDI) | Renewable Energy Electricity Production (BP) | ||||||
|---|---|---|---|---|---|---|---|
| WIPO | OECD | WGI | ICRG | WIPO | OECD | WGI | ICRG |
| 1. Argentina | 1. Argentina | 1. Argentina | 1. Argentina | 1. Argentina | 1. Argentina | 1. Argentina | 1. Argentina |
| 2. Australia | 2. Australia | 2. Australia | 2. Australia | 2. Australia | 2. Australia | 2. Australia | 2. Australia |
| 3. Austria | 3. Austria | 3. Austria | 3. Austria | 3. Austria | 3. Austria | 3. Austria | 3. Austria |
| 4. Belgium | 4. Belgium | 4. Bangladesh | 4. Bangladesh | 4. Bangladesh | 4. Belgium | 4. Bangladesh | 4. Bangladesh |
| 5. Brazil | 5. Brazil | 5. Belgium | 5. Belgium | 5. Belgium | 5. Brazil | 5. Belgium | 5. Belgium |
| 6. Bulgaria | 6. Bulgaria | 6. Brazil | 6. Brazil | 6. Brazil | 6. Bulgaria | 6. Brazil | 6. Brazil |
| 7. Canada | 7. Canada | 7. Bulgaria | 7. Bulgaria | 7. Bulgaria | 7. Canada | 7. Bulgaria | 7. Bulgaria |
| 8. Chile | 8. Chile | 8. Canada | 8. Canada | 8. Canada | 8. Chile | 8. Canada | 8. Canada |
| 9. China | 9. China | 9. Chile | 9. Chile | 9. Chile | 9. China | 9. Chile | 9. Chile |
| 10. Colombia | 10. Colombia | 10. China | 10. China | 10. China | 10. Colombia | 10. China | 10. China |
| 11. Croatia | 11. Croatia | 11. Colombia | 11. Colombia | 11. Colombia | 11. Croatia | 11. Colombia | 11. Colombia |
| 12. Czech Republic | 12. Czech Republic | 12. Croatia | 12. Croatia | 12. Croatia | 12. Czech Republic | 12. Croatia | 12. Croatia |
| 13. Denmark | 13. Denmark | 13. Czech Republic | 13. Czech Republic | 13. Czech Republic | 13. Denmark | 13. Czech Republic | 13. Czech Republic |
| 14. Estonia | 14. Estonia | 14. Denmark | 14. Denmark | 14. Denmark | 14. Estonia | 14. Denmark | 14. Denmark |
| 15. Finland | 15. Finland | 15. Dominican Republic | 15. Dominican Republic | 15. Estonia | 15. Finland | 15. Estonia | 15. Estonia |
| 16. France | 16. France | 16. Estonia | 16. Estonia | 16. Finland | 16. France | 16. Finland | 16. Finland |
| 17. Germany | 17. Germany | 17. Finland | 17. Finland | 17. France | 17. Germany | 17. France | 17. France |
| 18. Greece | 18. Greece | 18. France | 18. France | 18. Germany | 18. Greece | 18. Germany | 18. Germany |
| 19. Hong Kong | 19. Hong Kong | 19. Germany | 19. Germany | 19. Greece | 19. Hong Kong | 19. Greece | 19. Greece |
| 20. Hungary | 20. Hungary | 20. Greece | 20. Greece | 20. Hong Kong | 20. Hungary | 20. Hong Kong | 20. Hungary |
| 21. India | 21. India | 21. Hong Kong | 21. Hungary | 21. Hungary | 21. India | 21. Hungary | 21. India |
| 22. Indonesia | 22. Indonesia | 22. Hungary | 22. India | 22. India | 22. Indonesia | 22. India | 22. Indonesia |
| 23. Iran. | 23. Iran | 23. India | 23. Indonesia | 23. Indonesia | 23. Iran | 23. Indonesia | 23. Ireland |
| 24. Ireland | 24. Ireland | 24. Indonesia | 24. Ireland | 24. Iran | 24. Ireland | 24. Iran | 24. Israel |
| 25. Israel | 25. Israel | 25. Iran | 25. Israel | 25. Ireland | 25. Israel | 25. Ireland | 25. Italy |
| 26. Italy | 26. Italy | 26. Ireland | 26. Italy | 26. Israel | 26. Italy | 26. Israel | 26. Japan |
| 27. Japan | 27. Japan | 27. Israel | 27. Japan | 27. Italy | 27. Japan | 27. Italy | 27. Kazakhstan |
| 28. Korea, Rep. | 28. Korea, Rep. | 28. Italy | 28. Kazakhstan | 28. Japan | 28. Korea, Rep. | 28. Japan | 28. Korea, Rep. |
| 29. Latvia | 29. Latvia | 29. Japan | 29. Korea, Rep. | 29. Kazakhstan | 29. Latvia | 29. Kazakhstan | 29. Latvia |
| 30. Luxembourg | 30. Malaysia | 30. Kazakhstan | 30. Latvia | 30. Korea, Rep. | 30. Malaysia | 30. Korea, Rep. | 30. Luxembourg |
| 31. Malaysia | 31. Mexico | 31. Korea, Rep. | 31. Luxembourg | 31. Latvia | 31. Mexico | 31. Latvia | 31. Malaysia |
| 32. Mexico | 32. Morocco | 32. Latvia | 32. Malaysia | 32. Luxembourg | 32. Morocco | 32. Luxembourg | 32. Mexico |
| 33. Morocco | 33. Netherlands | 33. Luxembourg | 33. Mexico | 33. Malaysia | 33. Netherlands | 33. Malaysia | 33. Morocco |
| 34. Netherlands | 34. New Zealand | 34. Malaysia | 34. Morocco | 34. Mexico | 34. New Zealand | 34. Mexico | 34. Netherlands |
| 35. New Zealand | 35. Norway | 35. Mexico | 35. Netherlands | 35. Morocco | 35. Norway | 35. Morocco | 35. New Zealand |
| 36. Norway | 36. Pakistan | 36. Morocco | 36. New Zealand | 36. Netherlands | 36. Pakistan | 36. Netherlands | 36. Norway |
| 37. Philippines | 37. Peru | 37. Netherlands | 37. Norway | 37. New Zealand | 37. Peru | 37. New Zealand | 37. Pakistan |
| 38. Poland | 38. Philippines | 38. New Zealand | 38. Pakistan | 38. Norway | 38. Philippines | 38. Norway | 38. Peru |
| 39. Portugal | 39. Poland | 39. Norway | 39. Peru | 39. Philippines | 39. Poland | 39. Pakistan | 39. Philippines |
| 40. Romania | 40. Portugal | 40. Pakistan | 40. Philippines | 40. Poland | 40. Portugal | 40. Peru | 40. Poland |
| 41. Russian Federation | 41. Romania | 41. Peru | 41. Poland | 41. Portugal | 41. Romania | 41. Philippines | 41. Portugal |
| 42. Serbia | 42. Russian Federation | 42. Philippines | 42. Portugal | 42. Romania | 42. Russian Federation | 42. Poland | 42. Romania |
| 43. Singapore | 43. Singapore | 43. Poland | 43. Romania | 43. Russian Federation | 43. Singapore | 43. Portugal | 43. Singapore |
| 44. Slovak Republic | 44. Slovak Republic | 44. Portugal | 44. Serbia | 44. Singapore | 44. Slovak Republic | 44. Romania | 44. Slovenia |
| 45. Slovenia | 45. Slovenia | 45. Romania | 45. Singapore | 45. Slovak Republic | 45. Slovenia | 45. Russian Federation | 45. Spain |
| 46. Spain | 46. Spain | 46. Russian Federation | 46. Slovenia | 46. Slovenia | 46. Spain | 46. Singapore | 46. Sweden |
| 47. Sweden | 47. Sweden | 47. Serbia | 47. Spain | 47. Spain | 47. Sweden | 47. Slovak Republic | 47. Switzerland |
| 48. Switzerland | 48. Thailand | 48. Singapore | 48. Sweden | 48. Sweden | 48. Thailand | 48. Slovenia | 48. Thailand |
| 49. Thailand | 49. Turkey | 49. Slovak Republic | 49. Switzerland | 49. Switzerland | 49. Turkey | 49. Spain | 49. Turkey |
| 50. Turkey | 50. Ukraine | 50. Slovenia | 50. Tanzania | 50. Thailand | 50. Ukraine | 50. Sweden | 50. Ukraine |
| 51. Ukraine | 51. United Kingdom | 51. Spain | 51. Thailand | 51. Turkey | 51. United Kingdom | 51. Thailand | 51. United Kingdom |
| 52. United Kingdom | 52. United States | 52. Sweden | 52. Turkey | 52. Ukraine | 52. United States | 52. Turkey | 52. United States |
| 53. United States | 53. Tanzania | 53. Ukraine | 53. United Kingdom | 53. Ukraine | 53. Vietnam | ||
| 54. Vietnam | 54. Thailand | 54. United Kingdom | 54. United States | 54. United Kingdom | |||
| 55. Turkey | 55. United States | 55. Vietnam | 55. United States | ||||
| 56. Ukraine | 56. Vietnam | 56. Vietnam | |||||
| 57. United Kingdom | |||||||
| 58. United States | |||||||
| 59. Vietnam | |||||||
| Variable | Definition | Source | Unit Measurement | Mean | Std Dev | Min | Max | |
|---|---|---|---|---|---|---|---|---|
| RE | REWP | Electricity Production from Renewable sources | WDI | % of Total Electricity Production | 3.75 | 5.79 | 0.00 | 55.85 |
| REWPBP | Renewables Energy Generation | BP | Terawatt-hours | 8.78 | 23.84 | 0.00 | 296.78 | |
| POP | Population Growth | WDI | % change | 0.74 | 0.76 | −2.08 | 2.89 | |
| CO2 | CO2 emissions | WDI | Metric tons per capita | 7.23 | 4.67 | 0.14 | 27.43 | |
| GDP | Real Gross Domestic Product | WDI | US$ constant price 2010 | 1050 | 2090 | 10 | 16,200 | |
| EUSE | Energy Use | WDI | KG of oil equivalent per capita | 3095.35 | 1971.51 | 163.94 | 9353.42 | |
| OP | OIL | Oil Price | WB | US$ Price | 49.83 | 33.41 | 13.53 | 103.40 |
| COAL | Coal Price | WB | US$ Price | 54.48 | 30.06 | 25.08 | 123.85 | |
| GAS | Gas Price | WB | US$ Price | 5.02 | 2.58 | 1.89 | 11.13 | |
| OE | OILP | Electricity Production from Oil sources | WDI | % of Total Electricity Production | 8.29 | 12.01 | 0.00 | 71.44 |
| COALP | Electricity Production from Coal sources | WDI | % of Total Electricity Production | 29.54 | 25.07 | 0.00 | 97.49 | |
| GASP | Electricity Production from Gas sources | WDI | % of Total Electricity Production | 20.54 | 19.50 | 0.03 | 95.27 | |
| IPR | IPR WIPO | Patent Granted to Environmental Technologies | WIPO | Actual Count | 241.29 | 598.68 | 1.00 | 4474.00 |
| IPR OECD | Patent Granted to Climate Change Mitigation Technologies | OECD | Actual Count | 96.27 | 314.52 | 0.08 | 2774.35 | |
| Variables | REWP | REWPBP | POP | CO2 | GDP | EUSE | OIL | COAL | GAS | OILP | COALP | GASP | IPR WIPO | IPR OECD |
|---|---|---|---|---|---|---|---|---|---|---|---|---|---|---|
| REWP | 1.00 | |||||||||||||
| REWPBP | 0.14 | 1.00 | ||||||||||||
| POP | −0.14 | −0.02 | 1.00 | |||||||||||
| CO2 | −0.09 | 0.24 | 0.06 | 1.00 | ||||||||||
| GDP | −0.11 | 0.81 | 0.02 | 0.38 | 1.00 | |||||||||
| EUSE | −0.01 | 0.18 | 0.03 | 0.85 | 0.28 | 1.00 | ||||||||
| OIL | 0.33 | 0.21 | 0.00 | −0.12 | 0.00 | −0.09 | 1.00 | |||||||
| COAL | 0.23 | 0.13 | −0.01 | −0.09 | −0.01 | −0.07 | 0.88 | 1.00 | ||||||
| GAS | 0.15 | 0.08 | 0.01 | −0.05 | −0.01 | −0.05 | 0.75 | 0.73 | 1.00 | |||||
| OILP | −0.14 | −0.12 | 0.20 | −0.19 | −0.04 | −0.32 | −0.17 | −0.14 | −0.11 | 1.00 | ||||
| COALP | −0.15 | 0.15 | −0.02 | 0.17 | 0.17 | −0.19 | −0.07 | −0.06 | −0.03 | −0.01 | 1.00 | |||
| GASP | 0.04 | −0.07 | 0.19 | −0.06 | −0.05 | −0.16 | 0.12 | 0.11 | 0.07 | 0.26 | −0.25 | 1.00 | ||
| IPR WIPO | −0.13 | 0.54 | −0.16 | 0.24 | 0.65 | 0.16 | 0.07 | 0.03 | 0.02 | 0.04 | 0.15 | −0.05 | 1.00 | |
| IPR OECD | −0.06 | 0.68 | −0.04 | 0.42 | 0.85 | 0.34 | 0.06 | 0.09 | 0.04 | −0.03 | 0.11 | 0.01 | 0.61 | 1.00 |
References
- EIA. International Electricity Generation. U.S. Energy International Administration. Available online: https://www.eia.gov/international/data/world/electricity/electricity-generation (accessed on 25 August 2021).
- BP Statistical Review of World Energy, 68th ed.; BP plc: London, UK, 2019; Available online: https://www.bp.com/content/dam/bp/business-sites/en/global/corporate/pdfs/energy-economics/statistical-review/bp-stats-review-2019-full-report.pdf (accessed on 29 January 2021).
- Zhang, Y.; Qamruzzaman, M.; Karim, S.; Jahan, I. Nexus between Economic Policy Uncertainty and Renewable Energy Consumption in BRIC Nations: The Mediating Role of Foreign Direct Investment and Financial Development. Energies 2021, 14, 4687. [Google Scholar] [CrossRef]
- Mathews, J.A.; Kidney, S.; Mallon, K.; Hughes, M. Mobilizing private finance to drive an energy industrial revolution. Energy Policy 2010, 38, 3263–3265. [Google Scholar] [CrossRef]
- Zyadin, A.; Halder, P.; Kähkönen, T.; Puhakka, A. Challenges to renewable energy: A bulletin of perceptions from international academic arena. Renew. Energy 2014, 69, 82–88. [Google Scholar] [CrossRef]
- Helm, S.; Tannock, Q.; Iliev, I. Renewable Energy Technology: Evolution and Policy Implications—Evidence from Patent Literature. World Intellectual Property Organization, 2014. Available online: https://www.eldis.org/document/A68704 (accessed on 20 June 2020).
- Downey, K. Intellectual Property Rights and Renewable Energy Technology Transfer in China. South Carol. J. Int. Law Bus. 2012, 9, 90–130. [Google Scholar]
- Newiak, M. The Dual Role of IPRs Under Imitation and Innovation Driven Development; Working Paper; 2001; Available online: https://www.semanticscholar.org/paper/The-Dual-Role-of-Intellectual-Property-Rights-underNewiak/be32246137b7935d142981590aade38940e376c0#paper-header (accessed on 20 August 2021).
- IRENA INSPIRE. RE Technology Patents Reports; International Renewable Energy Agency: Abu Dhabi, United Arab Emirates; Available online: http://inspire.irena.org/Pages/patents/Patents-Search.aspx (accessed on 25 August 2021).
- Li, J.; Omoju, O.E.; Zhang, J.; Ikhide, E.E.; Lu, G.; Lawal, A.I.; Ozue, V.A. Does Intellectual Property Rights Protection Constitute A Barrier To Renewable Energy? An Econometric Analysis. Natl. Inst. Econ. Rev. 2020, 251, R37–R46. [Google Scholar] [CrossRef] [Green Version]
- Gould, D.M.; Gruben, W.C. The role of intellectual property rights in economic growth. J. Dev. Econ. 1996, 48, 323–350. [Google Scholar] [CrossRef] [Green Version]
- Park, W.G.; Ginarte, J.C. Intellectual Property Rights and Economic Growth. Contemp. Econ. Policy 1997, 15, 51–61. [Google Scholar] [CrossRef]
- Siwek, S.E. Copyright Industries in the U.S. Economy: The 2018 Report; International Intellectual Property Alliance: Washington, DC, USA, 2018; Available online: https://iipa.org/files/uploads/2018/12/2018CpyrtRptFull.pdf (accessed on 20 June 2020).
- Falvey, R.; Foster, N.; Greenaway, D. Intellectual property rights and economic growth. Rev. Dev. Econ. 2006, 10, 700–719. [Google Scholar] [CrossRef]
- Park, W.G. Do Intellectual Property Rights Stimulate R&D and Productivity Growth? Evidence from Cross-national and Manufacturing Industries Data. In Intellectual Property and Innovation in the Knowledge-Based Economy; Putnam, J., Ed.; Industry Canada: Ottawa, ON, Canada, 2005; Volume 9, pp. 1–51. [Google Scholar]
- Thomson, R.; Webster, E. The Role of Intelectual Property Rights in Addressing Climate Change: The Case of Agricuture; The University of Melbourne: Melbourne, Australia, 2010. [Google Scholar]
- Gattari, P. The Role of Patent Law in Incentivizing Green Technology. Northwest. J. Technol. Intellect. Prop. 2013, 11, 42–45. [Google Scholar]
- Rai, V.; Schultz, K.; Funkhouser, E. International low carbon technology transfer: Do intellectual property regimes matter? Glob. Environ. Chang. 2014, 24, 60–74. [Google Scholar] [CrossRef]
- Popp, D.; Hascic, I.; Medhi, N. Technology and the diffusion of renewable energy. Energy Econ. 2011, 33, 648–662. [Google Scholar] [CrossRef]
- Johnstone, N.; Haščič, I.; Popp, D. Renewable Energy Policies and Technological Innovation: Evidence Based on Patent Counts. Environ. Resour. Econ. 2010, 45, 133–155. [Google Scholar] [CrossRef]
- Gao, X.; Zhai, K. Performance Evaluation on Intellectual Property Rights Policy System of the Renewable Energy in China. Sustainability 2018, 10, 2097. [Google Scholar] [CrossRef] [Green Version]
- Marques, A.C.; Fuinhas, J.A.; Manso, J. Motivations driving renewable energy in European countries: A panel data approach. Energy Policy 2010, 38, 6877–6885. [Google Scholar] [CrossRef]
- Marques, A.C.; Fuinhas, J.A. Are public policies towards renewables successful?Evidence from European countries. Renew. Energy 2012, 44, 109–118. [Google Scholar] [CrossRef]
- Aguirre, M.; Ibikunle, G. Determinants of renewable energy growth: A global sample analysis. Energy Policy 2014, 69, 374–384. [Google Scholar] [CrossRef] [Green Version]
- Silva, P.P.; Cerqueira, P.A.; Ogbe, W. Determinants of renewable energy growth in Sub-Saharan Africa: Evidence from panel ARDL. Energy 2018, 156, 45–54. [Google Scholar] [CrossRef]
- Rafiq, S.; Bloch, H.; Salim, R. Determinants of renewable energy adoption in China and India: A comparative analysis. Appl. Econ. 2014, 46, 2700–2710. [Google Scholar] [CrossRef] [Green Version]
- Zhao, X.; Luo, D. Driving force of rising renewable energy in China: Environment, regulation and employment. Renew. Sustain. Energy Rev. 2017, 68, 48–56. [Google Scholar] [CrossRef]
- Shah, I.H.; Hiles, C.; Morley, B. How do oil prices, macroeconomic factors and policies affect the market for renewable energy? Appl. Energy 2018, 215, 87–97. [Google Scholar] [CrossRef] [Green Version]
- Damette, O.; Marques, A.C. Renewable energy drivers: A panel cointegration approach. Appl. Econ. 2019, 15, 2793–2806. [Google Scholar] [CrossRef]
- Omri, A.; Nguyen, D. On the determinants of renewable energy consumption: International evidence. Energy 2014, 72, 554–560. [Google Scholar] [CrossRef]
- Lin, B.; Omoju, O.E.; Okonkwo, J.U. Factors influencing renewable electricity consumption in China. Renew. Sustain. Energy Rev. 2016, 55, 687–696. [Google Scholar] [CrossRef]
- Akar, B.G. The Determinants Of Renewable Energy Consumption: An Empirical Analysis For The Balkans. Eur. Sci. J. 2016, 12, 594–607. [Google Scholar] [CrossRef]
- Ergun, S.J.; Rivas, M.F. Determinants of renewable energy consumption in Africa. Environ. Sci. Pollut. Res. 2019, 26, 15390–15405. [Google Scholar] [CrossRef] [PubMed]
- Olanrewaju, B.T.; Olubusoye, O.E.; Adenikinju, A.; Akintande, O.J. A panel data analysis of renewable energy consumption in Africa. Renew. Energy 2019, 140, 668–679. [Google Scholar] [CrossRef]
- Anton, S.G.; Afloarei Nucu, A.E. The effect of financial development on renewable energy consumption. A panel data approach. Renew. Energy 2020, 147, 330–338. [Google Scholar] [CrossRef]
- Farhad, T.-H.; Naoyuki, Y.; Yugo, I.; Peter, J.M. Analyzing the Factors Influencing the Demand and Supply of Solar Modules in Japan. In Asian Development Bank Working Paper 1084; Asian Development Bank Institute: Tokyo, Japan, 2020. [Google Scholar]
- Anderson, T.; Hsiao, C. Formulation and estimation of dynamic models using panel data. J. Econom. 1982, 18, 47–82. [Google Scholar] [CrossRef]
- Holtz-Eakin, D.; Newey, W.; Rosen, H.S. Estimating Vector Autoregressions with Panel Data. Econometrica 1988, 56, 1371–1395. [Google Scholar] [CrossRef]
- Arellano, M.; Bond, S. Some Tests of Specification for Panel Data: Monte Carlo Evidence and an Application to Employment Equations. Rev. Econ. Stud. 1991, 58, 277–297. [Google Scholar] [CrossRef] [Green Version]
- Arellano, M.; Bover, O. Another look at the instrumental variable estimation of error-components models. J. Econom. 1995, 68, 29–51. [Google Scholar] [CrossRef] [Green Version]
- Blundell, R.; Bond, S. Initial conditions and moment restrictions in dynamic panel data models. J. Econom. 1998, 87, 115–143. [Google Scholar] [CrossRef] [Green Version]
- Bun, M.J.; Windmeijer, F. The weak instrument problem of the system GMM estimator in dynamic panel data models. Econom. J. 2010, 13, 95–126. [Google Scholar] [CrossRef] [Green Version]
- Eicher, T.; García-Peñalosa, C. Endogenous strength of intellectual property rights: Implications for economic development and growth. Eur. Econ. Rev. 2008, 52, 237–258. [Google Scholar] [CrossRef]
- Wu, L.; Broadstock, D.C. Does economic, financial and institutional development matter for renewable energy consumption? Evidence from emerging economies. Intern. J. Econ. Policy Emerg. Econ. 2015, 8, 20–39. [Google Scholar] [CrossRef]
- Shahbaz, M.; Raghutla, C.C.; Jiao, Z.; Vinh Vo, X. The effect of renewable energy consumption on economic growth: Evidence from the renewable energy country attractive index. Energy 2020, 207, 118162. [Google Scholar] [CrossRef]
- Lee, S.; Jung, Y. Causal dynamics between renewable energy consumption and economic growth in South Korea: Empirical analysis and policy implications. Energy Environ. 2018, 29, 1298–1315. [Google Scholar] [CrossRef]
- Maji, I.; Sulaiman, C. Renewable energy consumption and economic growth nexus: A fresh evidence from West Africa. Energy Rep. 2019, 5, 384–392. [Google Scholar] [CrossRef]
- Sahlian, D.N.; Popa, A.F.; Cre¸tu, R.F. Does the Increase in Renewable Energy Influence GDP Growth? An EU-28 Analysis. Energies 2021, 14, 4762. [Google Scholar] [CrossRef]
- Wait, A. Investment in Clean Technologies as a Public Good; University of Sydney: Sydney, Australia, 2010. [Google Scholar]
- Hooman, P.; Farhad, T.-H. The Role of Renewable Energy in Resolving Energy Insecurity in Asia; Asian Development Bank Institute: Tokyo, Japan, 2019. [Google Scholar]
- Razmi, S.F.; Bajgiran, B.R.; Mehdi, B.; Salari, T.E.; Razmi, S.M. The relationship of renewable energy consumption to stock market development and economic growth in Iran. Renew. Energy 2020, 145, 2019–2024. [Google Scholar] [CrossRef]
| Explanatory Variable | [22] | [23] | [24] | [25] |
|---|---|---|---|---|
| GDP | Mixture | - | Neutral | Positive |
| CO2 Emission | Negative | Negative | Positive | - |
| Energy Use | Positive | Positive | Negative | Positive |
| Oil Price | Mixture | - | Mixture | Mixture |
| Coal Price | Mixture | - | Neutral | Mixture |
| Gas Price | Positive | - | Neutral | Negative |
| VARIABLES | Renewable Energy Production (WDI) | Renewable Energy Production (BP) | ||
|---|---|---|---|---|
| Model 1 | Model 2 | Model 3 | Model 4 | |
| L.REWP | 0.799 *** | 0.687 *** | 0.676 *** | 0.309 *** |
| (0.0194) | (0.0135) | (0.00603) | (0.0177) | |
| POP | 0.0617 *** | 0.101 *** | 0.0404 *** | 0.207 *** |
| (0.0152) | (0.0150) | (0.0117) | (0.0190) | |
| CO2 | −0.538 | −1.300 *** | −0.714 | −0.894 *** |
| (0.444) | (0.448) | (0.577) | (0.304) | |
| GDP | −0.0678 | −0.0424 | 0.118 | 0.310 *** |
| (0.0437) | (0.0744) | (0.0836) | (0.0578) | |
| EUSE | 0.775 * | 1.520 *** | 1.162 * | 1.124 *** |
| (0.411) | (0.473) | (0.689) | (0.235) | |
| OIL | 0.475 *** | 0.541 *** | 0.426 *** | 1.426 *** |
| (0.0437) | (0.0939) | (0.0690) | (0.0606) | |
| COAL | −0.0653 *** | −0.122 *** | −0.0554 *** | −0.501 *** |
| (0.0247) | (0.0342) | (0.0209) | (0.0344) | |
| GAS | −0.286 *** | −0.410 *** | −0.295 *** | −0.860 *** |
| (0.0360) | (0.0550) | (0.0785) | (0.0468) | |
| OILP | −0.0516 *** | −0.00326 | −0.110 *** | −0.0651 *** |
| (0.0179) | (0.00976) | (0.0185) | (0.0175) | |
| COALP | −0.0116 | 0.217 *** | −0.0539 | −0.0612 |
| (0.0271) | (0.0417) | (0.0380) | (0.0393) | |
| GASP | 0.0609 *** | 0.0505 *** | 0.0610 *** | −0.0148 |
| (0.00927) | (0.00794) | (0.0116) | (0.0198) | |
| IPR WIPO | 0.0393 *** | 0.133 *** | ||
| (0.00811) | (0.00870) | |||
| IPR OECD | 0.0128 | 0.113 *** | ||
| (0.00843) | (0.0146) | |||
| Constant | −5.451 ** | −10.51 *** | −10.18 ** | −11.98 *** |
| (2.595) | (3.654) | (5.077) | (1.273) | |
| Observations | 823 | 466 | 885 | 468 |
| N | 51 | 48 | 52 | 47 |
| Sargan Test | 42.1210 | 31.9784 | 39.3982 | 31.9288 |
| 1.0000 | 1.0000 | 1.0000 | 1.0000 | |
| AR(1) | −2.7873 | −1.6598 | −1.5002 | −1.9000 |
| 0.0053 | 0.0970 | 0.1336 | 0.0574 | |
| AR(2) | −1.1821 | 0.2257 | −1.4329 | −0.5775 |
| 0.2372 | 0.8214 | 0.1519 | 0.5636 | |
| VARIABLES | Renewable Energy Production (WDI) | Renewable Energy Production (BP) | ||
|---|---|---|---|---|
| Main Model Model 1 | Model 2 | Model 3 | Model 4 | |
| L.REWP | 0.847 *** | 0.909 *** | 0.396 *** | 0.706 *** |
| (0.0101) | (0.0112) | (0.0158) | (0.0118) | |
| POP | 0.0992 *** | 0.0580 *** | 0.302 *** | 0.0329 *** |
| (0.0202) | (0.0178) | (0.0256) | (0.0104) | |
| CO2 | −0.511 *** | −0.688 | −0.144 | −0.751 ** |
| (0.184) | (0.618) | (0.188) | (0.333) | |
| GDP | −0.259 *** | −0.0891 | 0.779 *** | 0.362 *** |
| (0.0366) | (0.225) | (0.0783) | (0.0966) | |
| EUSE | 0.322 | 0.955 | −0.743 *** | 1.016 *** |
| (0.250) | (0.624) | (0.264) | (0.385) | |
| OIL | 0.363 *** | 0.168 *** | 0.766 *** | 0.302 *** |
| (0.0555) | (0.0489) | (0.0794) | (0.0303) | |
| COAL | −0.0743 *** | 0.0521 *** | −0.149 *** | 0.000557 |
| (0.0231) | (0.0197) | (0.0263) | (0.0133) | |
| GAS | −0.329 *** | −0.179 *** | −0.795 *** | −0.192 *** |
| (0.0406) | (0.0415) | (0.0618) | (0.0197) | |
| OILP | −0.0158 | 0.00261 | −0.272 *** | −0.131 *** |
| (0.0102) | (0.0274) | (0.0166) | (0.0206) | |
| COALP | 0.162 *** | 0.108 ** | 0.0503 | 0.0760 *** |
| (0.0356) | (0.0463) | (0.0333) | (0.0244) | |
| GASP | 0.0199 | 0.0560 ** | −0.176 *** | 0.0530 *** |
| (0.0164) | (0.0227) | (0.0377) | (0.0131) | |
| IQ WGI | 0.835 *** | 0.859 *** | ||
| (0.177) | (0.316) | |||
| IQ ICRG | −0.202 | 0.0200 | ||
| (0.332) | (0.151) | |||
| Constant | 1.142 | −4.315 | −18.19 *** | −17.01 *** |
| (1.953) | (6.256) | (2.064) | (2.402) | |
| Observations | 484 | 932 | 570 | 1025 |
| N | 52 | 50 | 55 | 52 |
| Sargan Test | 41.13089 | 34.4894 | 43.17009 | 41.79858 |
| (1.0000) | (1.0000) | (1.0000) | (1.0000) | |
| AR(1) | −2.4114 | −2.8674 | −2.3083 | −1.4363 |
| (0.0159) | (0.0041) | (0.0210) | (0.1509) | |
| AR(2) | −0.24241 | −0.91367 | −1.1249 | −1.0434 |
| (0.8085) | (0.3609) | (0.2606) | (0.2968) | |
| Variables | REWP WDI | REWP BP | REWP WDI | REWP BP | ||||
|---|---|---|---|---|---|---|---|---|
| Model 1 | Model 2 | Model 3 | Model 4 | Model 1 | Model 2 | Model 3 | Model 4 | |
| POP | +(*) | +(***) | +(NS) | +(***) | +(***) | +(***) | +(***) | +(***) |
| CO2 | +(NS) | −(***) | −(NS) | −(***) | −(NS) | −(***) | −(NS) | −(***) |
| GDP | +(NS) | −(NS) | +(**) | +(***) | +(***) | +(***) | +(***) | +(***) |
| ENERGYUSE | −(NS) | +(***) | +(NS) | +(***) | −(***) | +(***) | −(***) | +(***) |
| OIL | +(***) | +(***) | +(***) | +(***) | +(***) | +(***) | +(***) | +(***) |
| COAL | −(**) | −(***) | −(***) | −(***) | −(***) | −(NS) | −(***) | −(NS) |
| GAS | −(***) | −(***) | −(***) | −(***) | −(***) | −(***) | −(***) | −(***) |
| OILP | −(***) | +(NS) | −(***) | −(***) | −(***) | −(***) | −(***) | −(***) |
| COALP | +(NS) | +(***) | −(NS) | +(NS) | +(NS) | +(***) | +(NS) | +(***) |
| GASP | +(***) | +(***) | +(***) | −(NS) | −(***) | +(***) | −(***) | +(***) |
| IPR WIPO | +(***) | +(***) | ||||||
| IPR OECD | +(NS) | +(***) | ||||||
| IQ WGI | +(***) | +(***) | ||||||
| IQ ICRG | −(NS) | +(NS) | ||||||
Publisher’s Note: MDPI stays neutral with regard to jurisdictional claims in published maps and institutional affiliations. |
© 2021 by the authors. Licensee MDPI, Basel, Switzerland. This article is an open access article distributed under the terms and conditions of the Creative Commons Attribution (CC BY) license (https://creativecommons.org/licenses/by/4.0/).
Share and Cite
Tee, W.-S.; Chin, L.; Abdul-Rahim, A.S. Determinants of Renewable Energy Production: Do Intellectual Property Rights Matter? Energies 2021, 14, 5707. https://doi.org/10.3390/en14185707
Tee W-S, Chin L, Abdul-Rahim AS. Determinants of Renewable Energy Production: Do Intellectual Property Rights Matter? Energies. 2021; 14(18):5707. https://doi.org/10.3390/en14185707
Chicago/Turabian StyleTee, Wu-Shun, Lee Chin, and Abdul Samad Abdul-Rahim. 2021. "Determinants of Renewable Energy Production: Do Intellectual Property Rights Matter?" Energies 14, no. 18: 5707. https://doi.org/10.3390/en14185707
APA StyleTee, W.-S., Chin, L., & Abdul-Rahim, A. S. (2021). Determinants of Renewable Energy Production: Do Intellectual Property Rights Matter? Energies, 14(18), 5707. https://doi.org/10.3390/en14185707