Article

Non-Contact Methods for High-Voltage Insulation Equipment Diagnosis during Operation

by
Dmitry A. Ivanov
*,
Marat F. Sadykov
,
Danil A. Yaroslavsky
,
Aleksandr V. Golenishchev-Kutuzov
and
Tatyana G. Galieva
Institute of Electric Power Engineering and Electronics, Kazan State Power Engineering University, 420066 Kazan, Russia
*
Author to whom correspondence should be addressed.
Energies 2021, 14(18), 5670; https://doi.org/10.3390/en14185670
Submission received: 27 July 2021 / Revised: 26 August 2021 / Accepted: 6 September 2021 / Published: 9 September 2021
(This article belongs to the Special Issue Frontiers in Power Electronics and Drive Systems)

Abstract

:
The article describes a complex of non-contact methods for remote diagnosis of high-voltage insulators as well as the two-channel method for remote diagnostics of the operating state of high-voltage insulators, based on the registration of partial discharges by electromagnetic and acoustic sensors. The presented device allows visual inspection and searches for faulty high-voltage equipment and a remote non-contact method of recording high-intensity electric fields of industrial frequency and their spatial distribution based on the electro-optical effect. The scheme of using the system for monitoring and diagnosing the technical condition of high-voltage support insulators of open switchgear is described. The results of experimental studies confirm the possibility of industrial applicability of the proposed method for non-contact remote diagnostics of the state of high-voltage insulators under operating voltage.

1. Introduction

At present, in the context of electric power industry rapid development, it starts facing the problem of recording electric fields of industrial frequency (50–60 Hz), as a part of the ultra-low-frequency range of the radio frequency spectrum, which is becoming more common, both in industrial conditions and in everyday life. These fields are generated mainly by power lines, open switchgear, bus bars, various high-voltage devices, transformers, high-voltage bushings, protection and automation devices, bus bars, and switches. All mentioned devices have a strong negative impact not only on electronic engineering but also on humans. The exposure on the human body results into disorders in nervous and cardiovascular systems and changes of blood composition. The degree of exposure primarily depends on the intensity and duration of the radiation. Continuous exposure leads to pathologies of various organs. According to the sanitary and epidemiological rules and regulations [1,2], the maximum permissible level for field strength at the service personnel’s workplace when being exposed for 1 h per shift is 60 kV/m. At the same time, malfunctioned electrical equipment may act as an additional source of high and low-frequency radiation.
By the end of the 20th century, ideas on diagnostics of the of high-voltage equipment’s operating state began to change moderately from the applied test stand control, with the death of equipment, to remote control of equipment under operating voltage [3,4,5,6,7,8].
Thus, the possibility of contactless detection of sources of electric fields appears important to determine the degree of their influence on the surrounding space. Additionally, the registration of local overvoltage in transformer windings, in high-voltage insulators and cables, can indicate the presence of insulation defects, which ultimately cause damage and even destruction of the insulating elements [9,10,11,12,13,14,15,16,17,18,19]. Therefore, it is necessary to control the occurrence of local overvoltage during the high-voltage insulation operation. It will be more convenient to carry out overvoltage remotely and contactless because in this case there is no need to decommission the equipment [20,21,22,23,24,25,26]. Yet, despite the existing urgency, the degree of development of such control methods has been low until now. Although separate attempts have already been conducted to create them [27,28,29,30,31,32,33,34,35,36], they have not yet become widespread in high-voltage systems. Insufficient development of remote contactless methods for overvoltage control in high-voltage insulation prompted us to continue research in this direction. The purpose of our research was to create a method for non-contact remote measurement of various types of electric fields for high-voltage insulation, which eliminates the shortcomings of previous developments. There is an obvious necessity in the development of an integrated method and the corresponding instrumentation for continuous contactless diagnostics of the operating state at all stages of operation of high-voltage insulators, starting from the moment they are connected to the electrical network. The result of the research should ensure the possibility of recording the moment of occurrence of a pre-defect state by identifying areas with increased electric field strength and measuring the gradients of the electric field strength in these areas, followed by the isolation of defects.

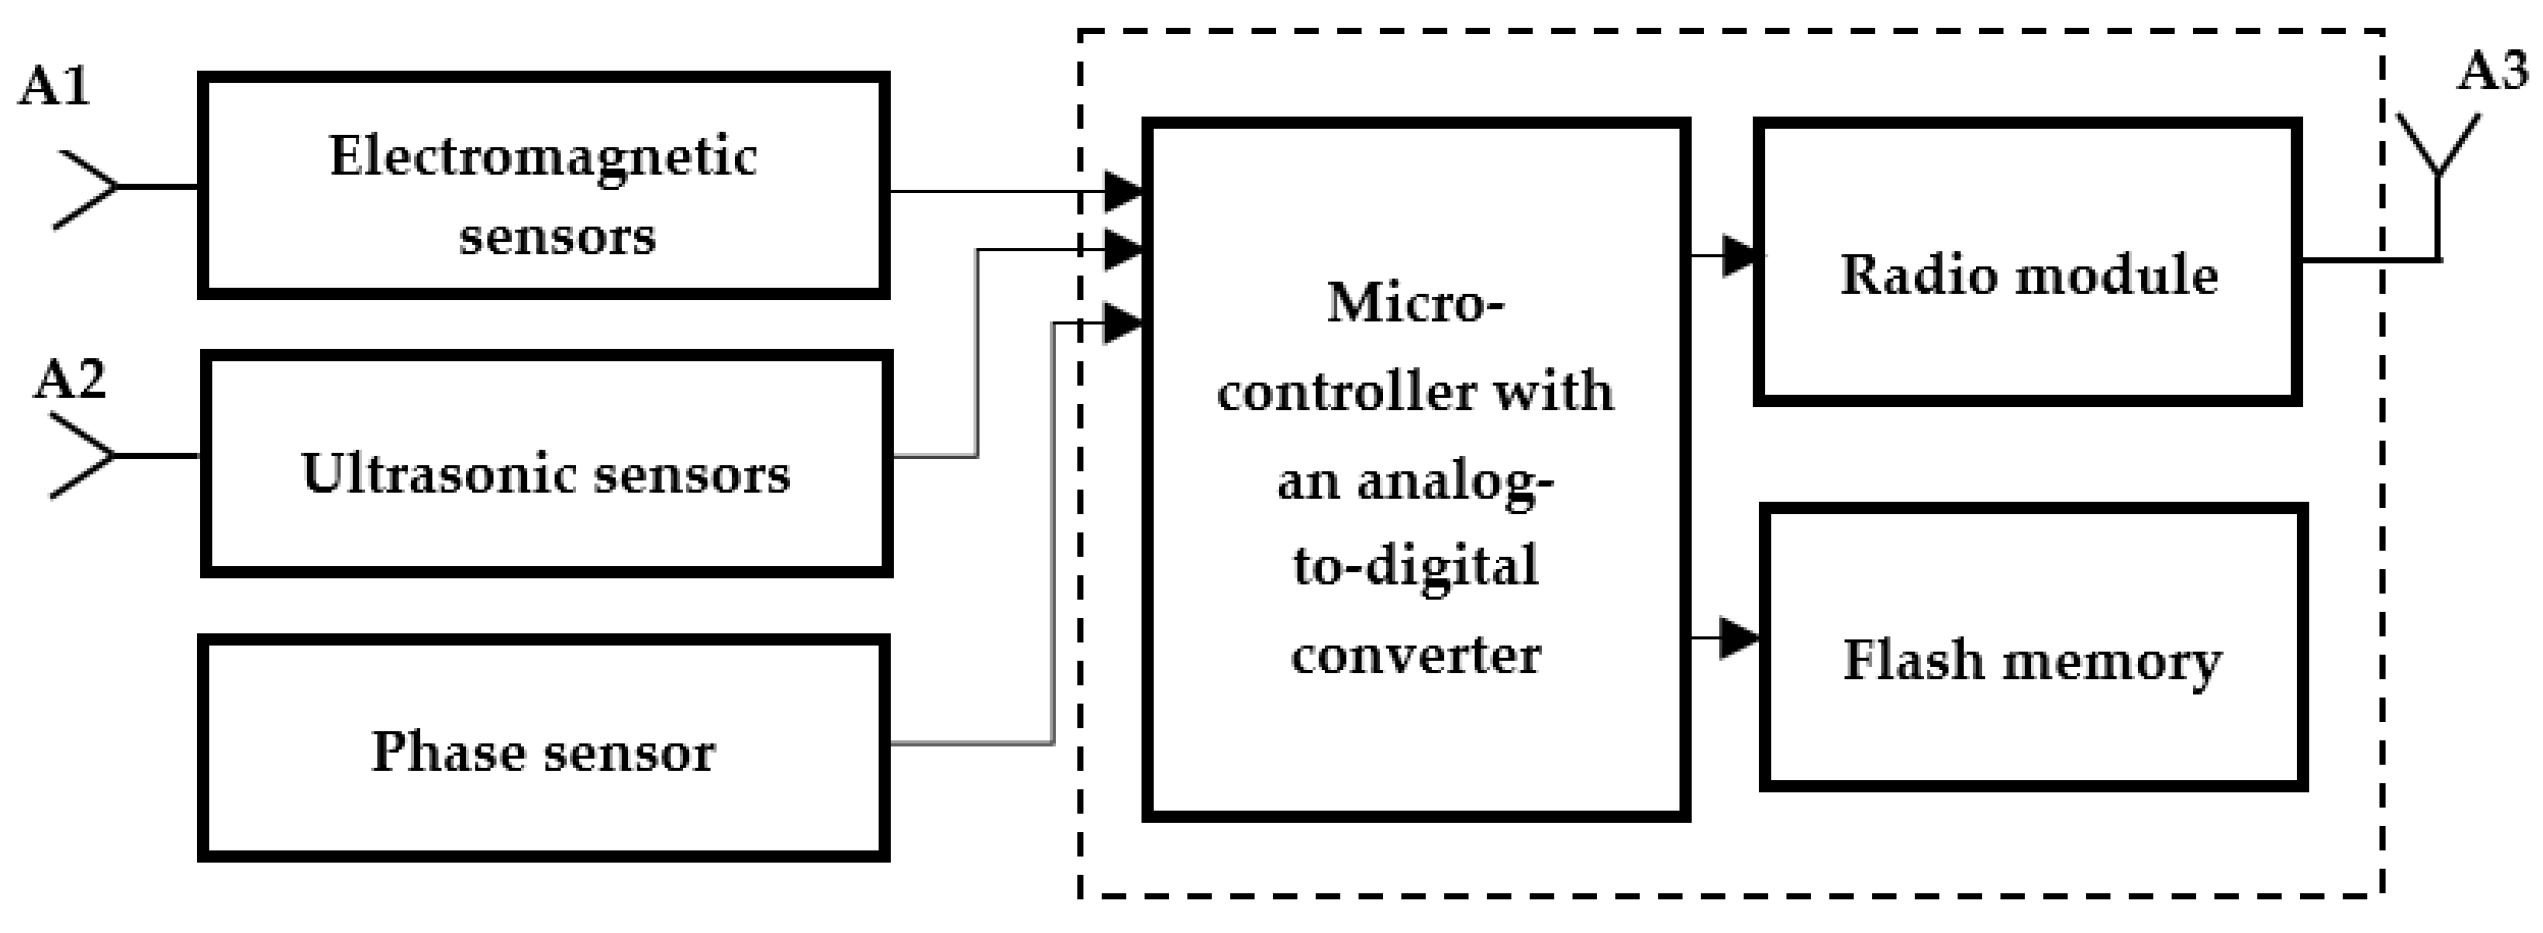
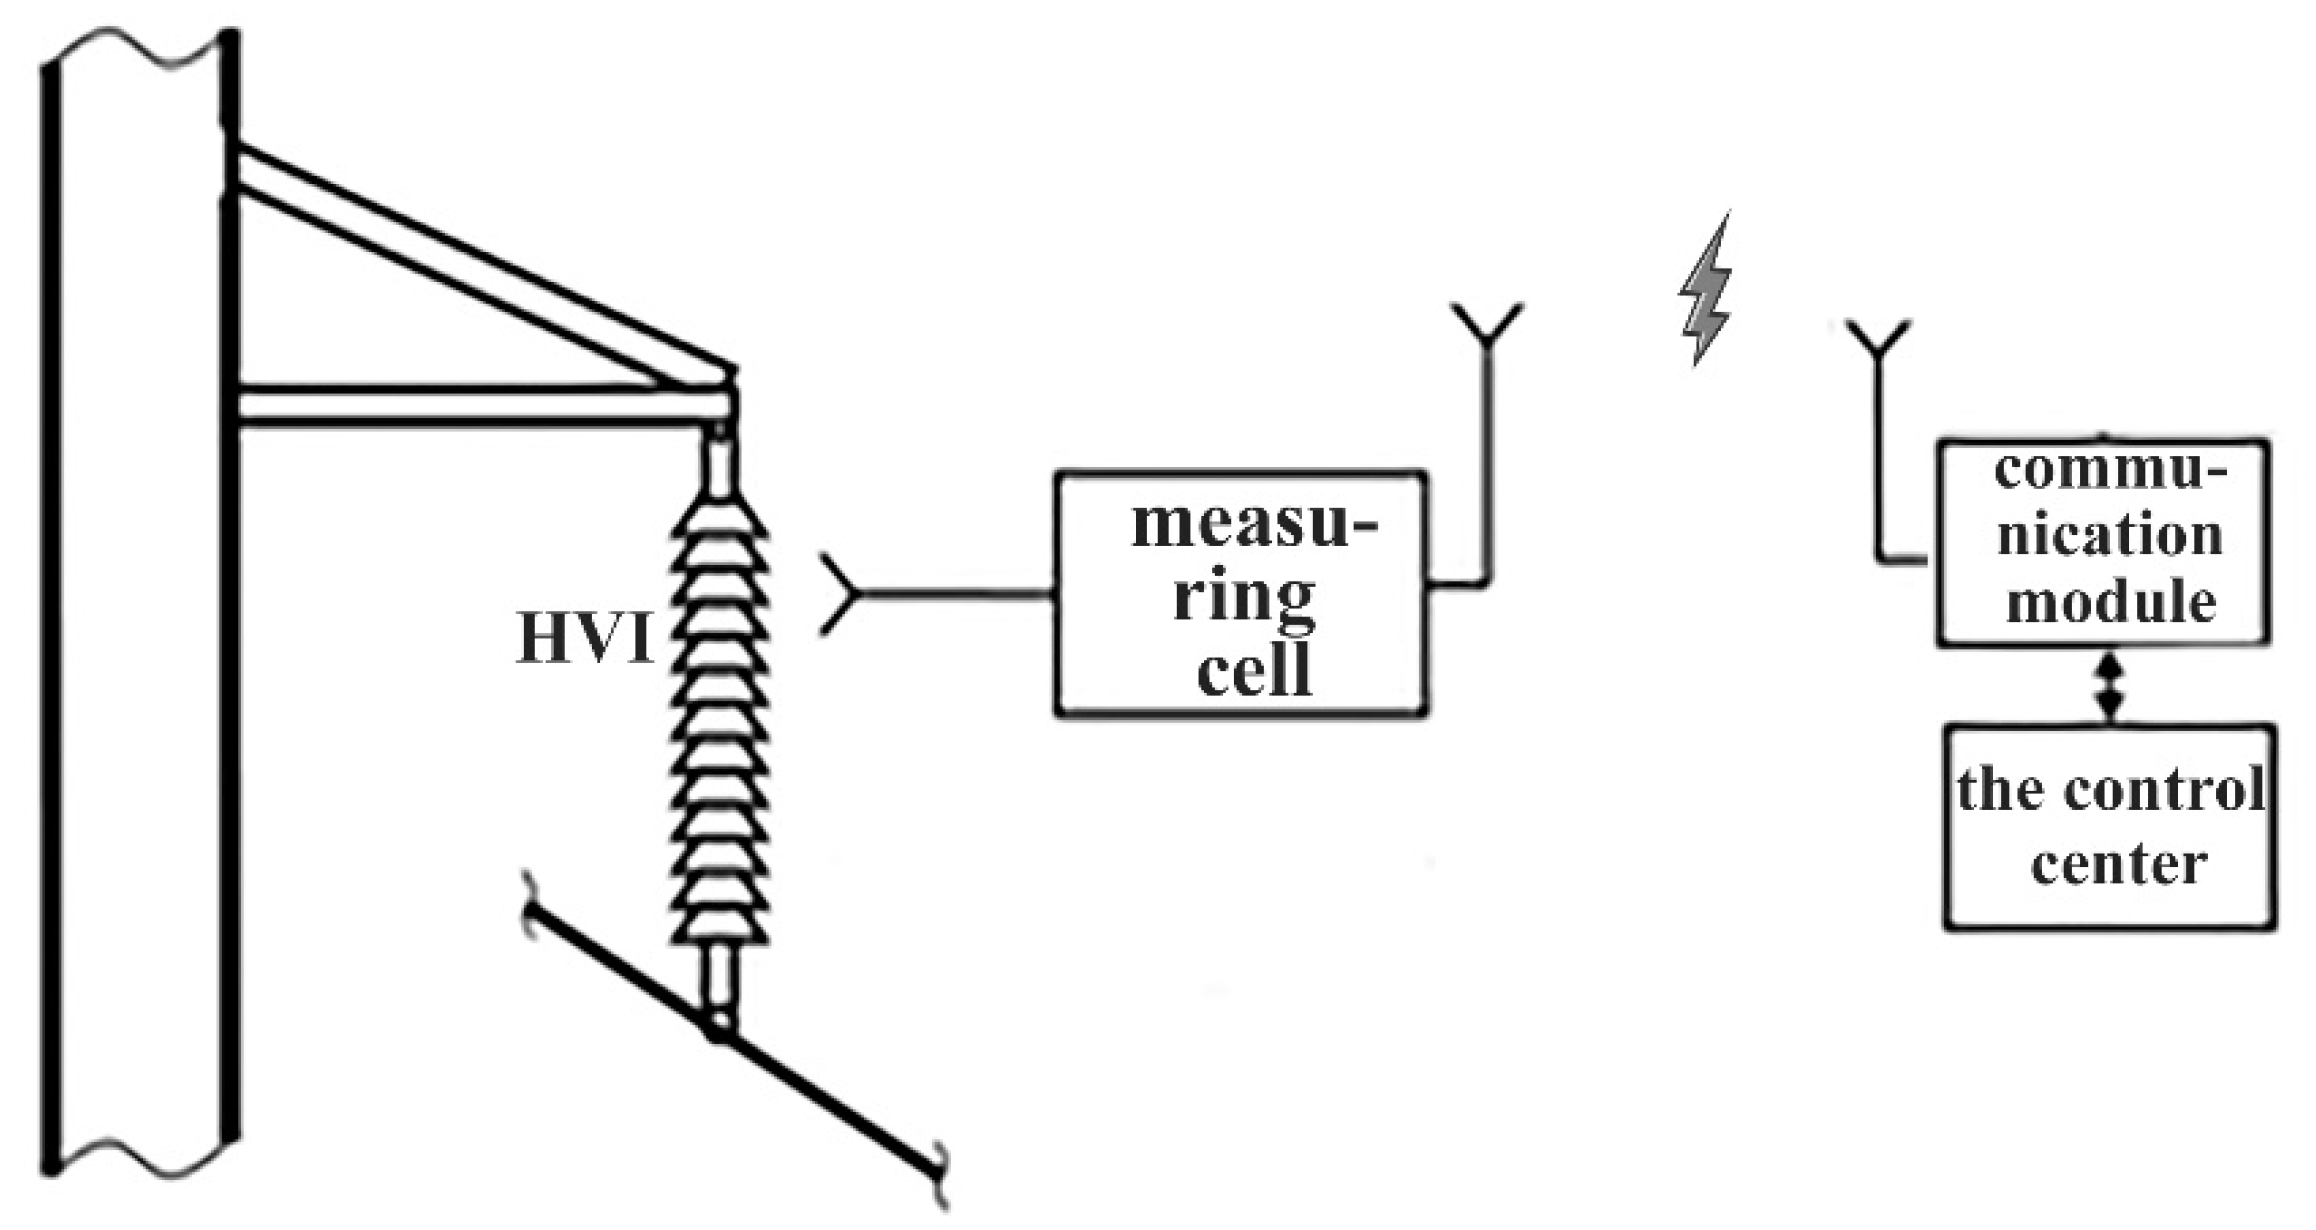
2. Materials and Methods

Figure 1 shows contactless mobile diagnostic devices that were used to detect PDs in high-voltage insulators (HVI). The diagnostic device conducts basic measurements using electromagnetic (EM) and ultrasonic (US) sensors [37] and a phase sensor. Diagnostic devices have been installed at the substation at a distance from the monitored HVI group. The ultrasonic sensor allows to localize a group of faulty HVIs and the EM sensor measures the electromagnetic field emitted by the PD using an antenna. This non-contact diagnostic device is used by the authors for inspection of insulators.
Registration of electromagnetic pulses of partial discharges (PDs) (Figure 1) is carried out by means of an electromagnetic sensor (directional antenna). The electromagnetic sensor allows detecting pulses in the frequency range of 0.5–600 MHz [38,39]. Acoustic pulses are detected via acoustic sensor (active parabolic antenna). The sensor operates at a frequency of 40 kHz.
The factors determining the frequency are the frequency dependence of wave attenuation, industrial noise and electromagnetic interference. For example, acoustic noise dominates in the low-frequency region (20 Hz–20 kHz), the upper frequency limit is limited by the frequency dependence of attenuation, (f ≥ 100 kHz). Experiments have shown that in the range of 35–45 kHz, with a signal-to-noise ratio of ≈ 2, acoustic pulses from the PDs are detected at a distance of 15–25 m. Considering the low-frequency production of electromagnetic interference in the range (50–200 MHz) and above 600 MHz, the frequency bands 20–50 MHz and 400–550 MHz are the most preferred for electromagnetic registration of the PD. The intensity of the PD signals is much higher in the second band than in the first one [39].
Figure 2 represents the monitoring system. It is a pair of receivers (non-contact diagnostic devices in Figure 1 for the treatment of partial discharges emitted by the substation insulating equipment, mounted along the perimeter of the substation. A meteorological station is mounted in an arbitrary place to determine the temperature and humidity of the air, and the direction of the wind. Electromagnetic and ultrasonic channels are used for registration and remote monitoring of the insulation condition at the substation. Sensors placed along the perimeter of the substation allow triangulating the discharges of faulty insulators when simultaneously monitoring the environmental parameters.
After determining the diagnostic parameters of the PD, the obtained distribution is compared with the same for serviceable, pre-defective and defective HVI. The complex provides localization of the signal source via a directional antenna with an accuracy of 1–2 m from a distance of 5–10 m, even in a field with a large number of signal sources and reflective surfaces [39]. In the microwave range, the interference level is much lower and antennas can be used with a high degree of directivity. This will ensure the localization of the source with an accuracy of about 0.5 m. The sensors are most sensitive to defects in the external parts of the equipment. These sensors are most sensitive to defects in the outer parts of the equipment [39].
The acoustic sensor included in the complex makes it possible to carry out a fairly accurate localization of the signal source inside the object of low-frequency PD. In this case, the delay of the moment of arrival of the acoustic pulse relative to the electrical signal at several points of the equipment is measured. Based on this, the approximate position of the source is calculated, considering the design of a specific object [39]. Acoustic sensors are practically not susceptible to external interference on power equipment of substations.
The communication module is a microcontroller device with a radio transmitter operating under the IEEE 802.15.4 standard on its own-account software [38]. Depending on the application, the communication module can be used separately as a radio transmitting device or with a data gateway to the required protocol (USB, RS-485, etc.) [39,40].
The method for performing visual inspection and detecting malfunctioning equipment is as follows: we constructed a design for a portable device allowing visual identification of the defects in high-voltage equipment. The flowchart is shown in Figure 3. The device includes acoustic sensors, an electromagnetic sensor, a laptop with a video camera, and software. To identify malfunctioning equipment, it is necessary to direct the device with the camera at the inspected area of the object. The sensors detect signals from malfunctioning equipment and superimpose the signal intensity from the sensors on the picture from the camera using the software installed on the laptop (Figure 3).
The main task of the complex is to identify defective insulators from the general system of high-voltage insulators that are under operating voltage and located at certain distances from each other at outdoor switchgears and substations [39]. We developed a portable device for visual detection of faulty insulators and other high-voltage equipment at energy facilities based on these conditions.
The process of recording high-intensity electric fields is based on the electro-optical effect [41]. Local areas with an increased intensity of this field (the change in the reflection coefficient is proportional to the electric field strength) are determined by the change in the reflection coefficient of the laser beam from the electro-optical sensor for monitoring the electric field strength. Moreover, an electro-optical sensor is used to measure the gradients of the electric field. The sensor is pre-calibrated in a calibrated alternating electric field.
Figure 4 represents the flowchart of the developed device for non-contact remote diagnostics of HVI. The device consists of a series-connected laser emitter (1), a polarization discriminator (2), an optical fiber (3), a photodetector (5), a narrow-band amplifier and a comparator (6), a personal computer (or laptop) (7), and an electro-optical sensor (4) connected to a fiber light guide (3) and a photodetector (5) [42]. The main measuring element of the device is the electro-optical sensor (4), which can be placed directly in a high alternating electric field because it is made without the use of metal elements. The optical fiber is also protected from the electric field.
The electro-optical sensor (4) is nothing more than a ferroelectric crystal, on the surface of which a periodic domain structure (PDS) is formed [43]. To increase the sensitivity and resolution when locating field strength gradients, the resonance properties of the PDS are used for a given wavelength of the laser emitter (1) [44]. The average values of the alternating electric fields intensity, corresponding to the operating high voltage, are determined during experimental measurements for all diagnosed high-voltage insulators. Additionally, the limiting boundaries of the gradients of the electric field strength are determined (the limit prior to electrical breakdown or overlapping of insulators).
To scan the surface of high-voltage insulators, an electro-optical sensor (4) is placed on a dielectric rod and connected through a polarization discriminator (2) and a fiber light guide (3) with a laser emitter (1), as well as with a photodetector (5) [8,42]. The sensor is brought closer to the insulator to scan the surface. In this case, the operator is at a safe distance from the high-voltage insulator and only touches the dielectric rod. The obtained data are recorded using special software, which records the spatial position of the electro-optical sensor relative to the insulator surface and the electric field strength corresponding to this point. Also, the computer program measures the normal and tangential components of the gradients of the electric field strength. Further, the spatial distribution of the elevated, normal, and tangential to the surface gradients of the electric field strength is compared with the previously stored reference strength values for a completely serviceable high-voltage insulator. The general scheme for measuring electric field gradients is shown in Figure 5.

3. Results

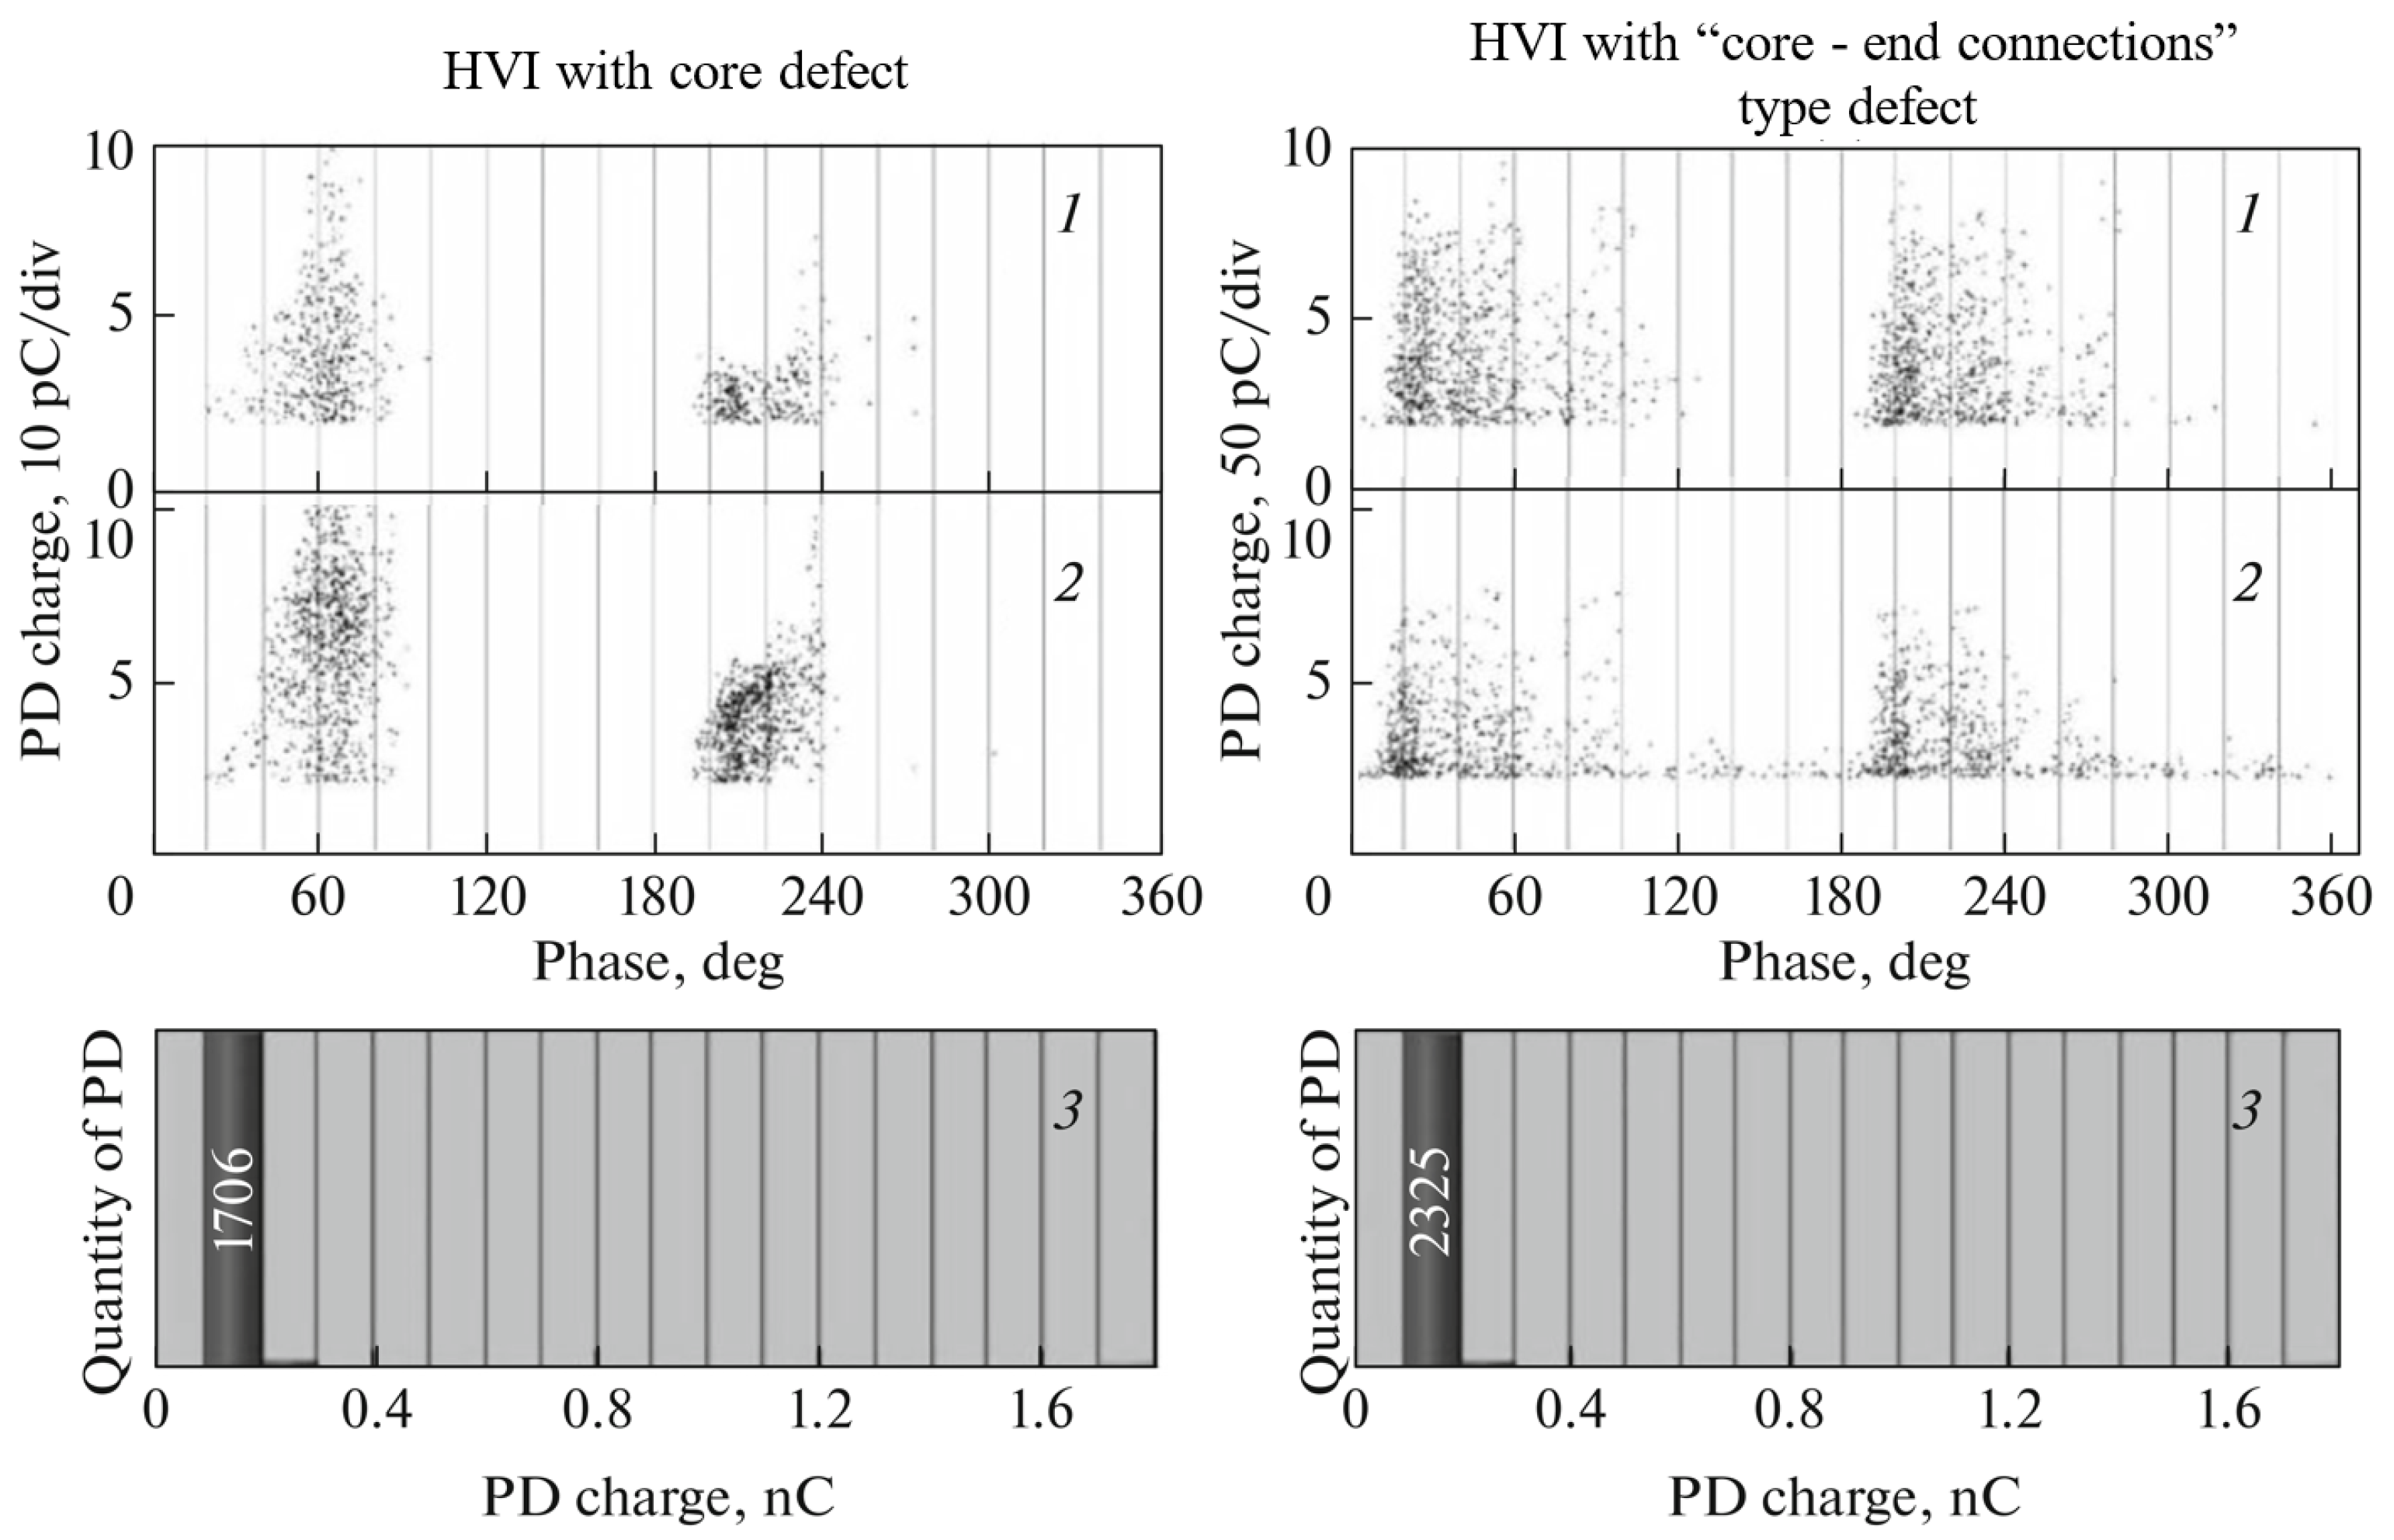
3.1. Diagnostics by Electromagnetic and Acoustic Recording of PD

Figure 6 illustrates a flowchart of the measuring device, which helps to more precisely understand the process of PD registration by the electromagnetic and acoustic methods.
The object of the research is a high-voltage insulator and a measuring cell is installed next to it [42]. Diagnostic data from the measuring cell is transmitted via a radio channel to the control room. A communication module is connected to the PC installed in the control room via the USB interface. It receives the data obtained via the radio channel from the measuring cell. Reliable communication between neighboring devices can be carried out at up to 1000 m with the location of neighboring devices within the line of sight. It may be used in case of failure of one or more devices since it is possible to transfer information bypassing faulty links.
The layout of the measuring cell is as one shown in Figure 1. This measuring cell is equipped with electromagnetic and ultrasonic antennas with corresponding receivers. The communication module is connected via I2C, SPI, or UART/USART interfaces [39]. The communication module transmits the received data to the control room via a 2.4 GHz radio channel.
The PC collects information, records it, and then processes information about the amplitude, repetition rate, and phase of signals using the developed program by the high-voltage polymer insulators contactless diagnostics method [42]. The accumulation of signals over narrow phase intervals (about 20 deg.) occurs within 18 s, fully satisfying the stochastic nature of the PD occurrence.
The PD signal processing ends with the characteristics display: the amplitude and number of pulses in each phase interval and the distribution of the number of pulses by amplitude. The results of data processing were presented in the following articles [45,46,47].
The obtained phase distribution of pulse parameters is compared with the previously recorded distribution of pulse signal parameters for an identical (defect-free) VI [46]. Since the propagation velocities of electromagnetic and acoustic pulses differ by several orders of magnitude, a phase synchronization unit is used to synchronize them with each specific phase interval (considering the distance between the defect and the sensors).

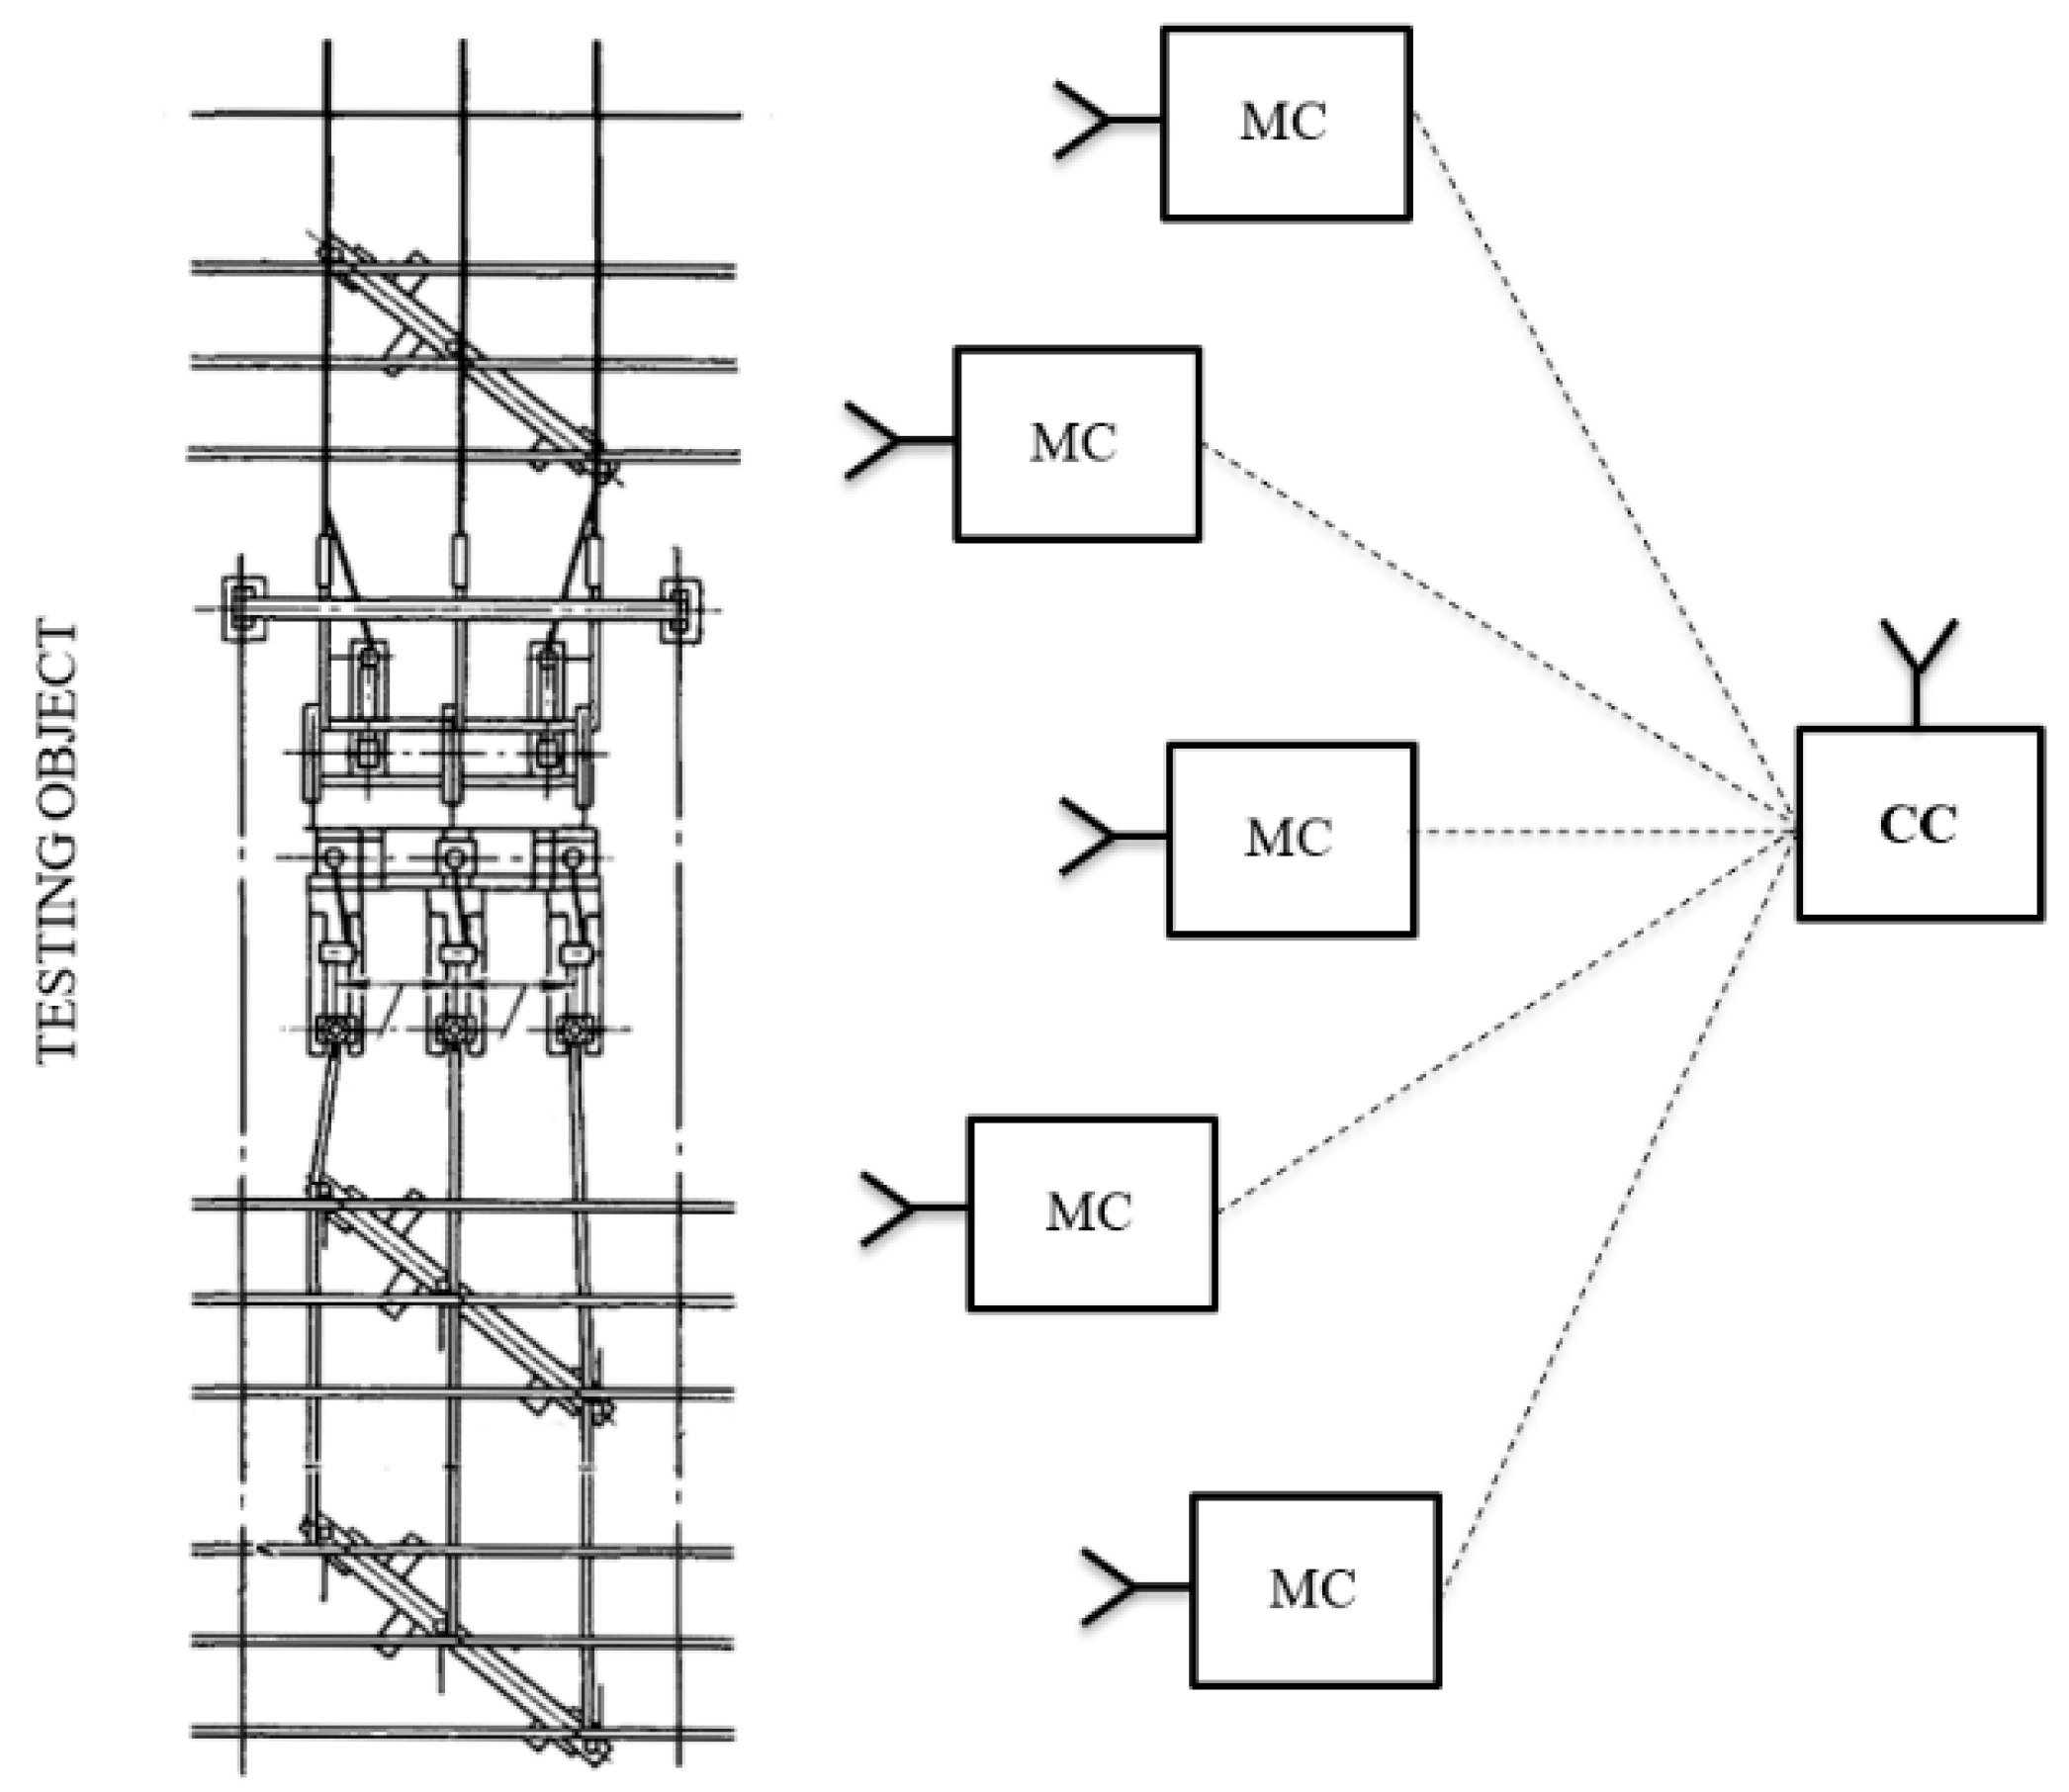
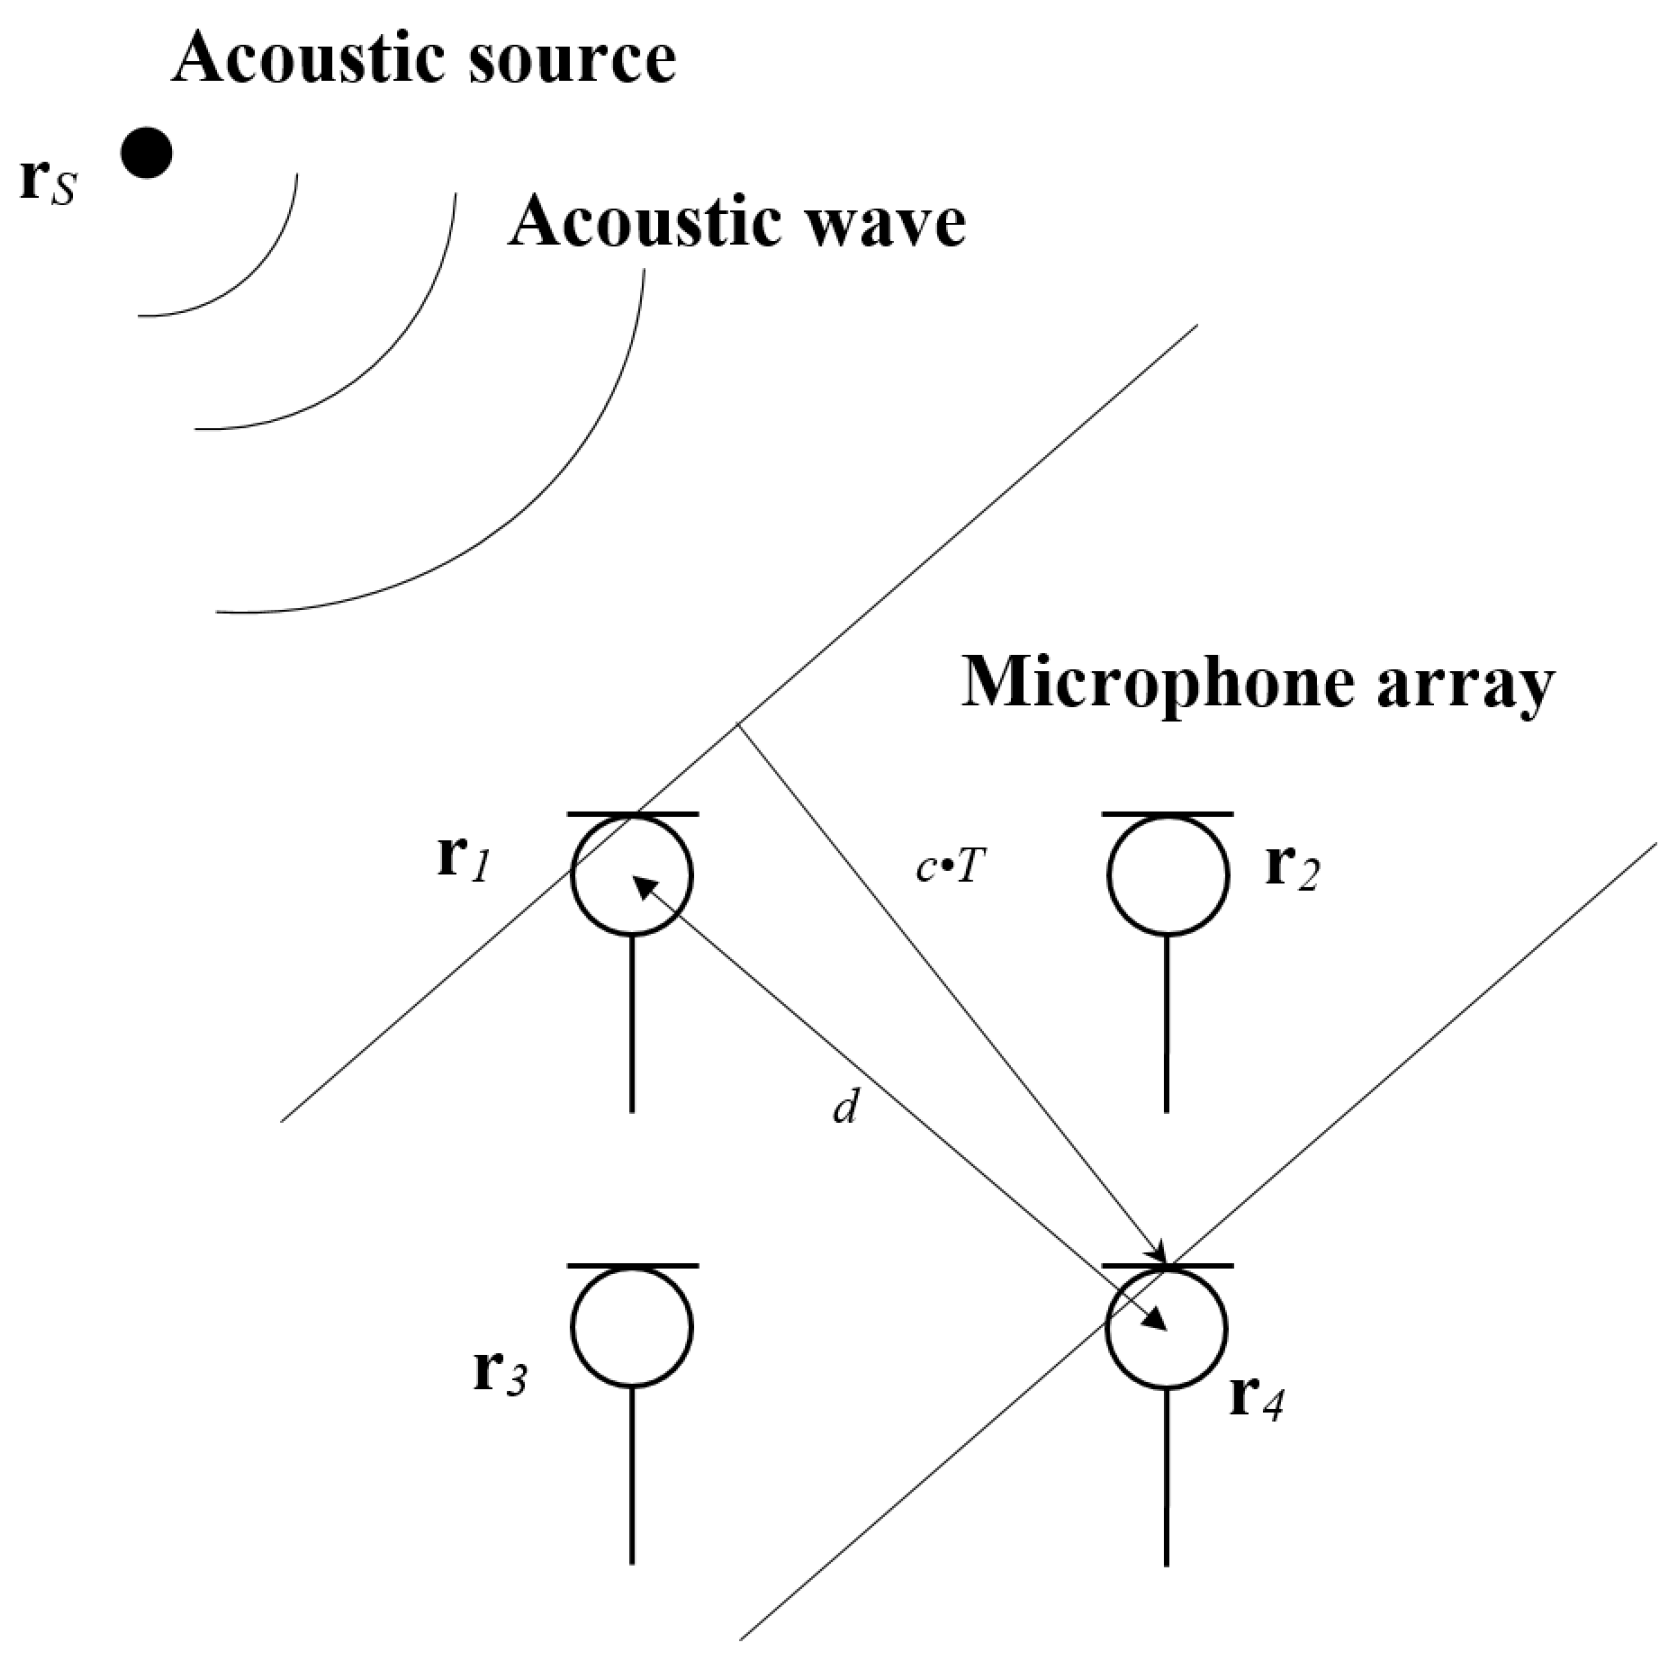
3.2. Diagnostics by Acoustic Recording of PD Using a Microphone Array

In a portable device (Figure 3), microphone arrays—four acoustic channels and one electromagnetic channel—are used to localize the ultrasound source from the PD arising on the insulation. At the same time, environmental parameters are monitored.
The microphone array consists of four piezoelectric receivers with a resonance frequency of 41 kHz. The entire microphone array is enclosed in a metal housing to minimize induced electromagnetic noise from high voltage equipment. Cross-correlation of sensor signals is used to localize an acoustic source using a microphone array [33,36]. Figure 7 shows the amplified signals at each receiver for the same PD.
The difference in arrival time for each pair of receivers, based on the results of cross-correlation of signals for each pair of receivers of the microphone array, makes it possible to reconstruct the coordinates of the acoustic radiation source—to localize the defect site on the inspected high-voltage insulators. The use of an electromagnetic sensor is necessary to register an electromagnetic pulse from a PD to confirm its occurrence.
The PD signal recorded by the EM sensor is shown in Figure 8.

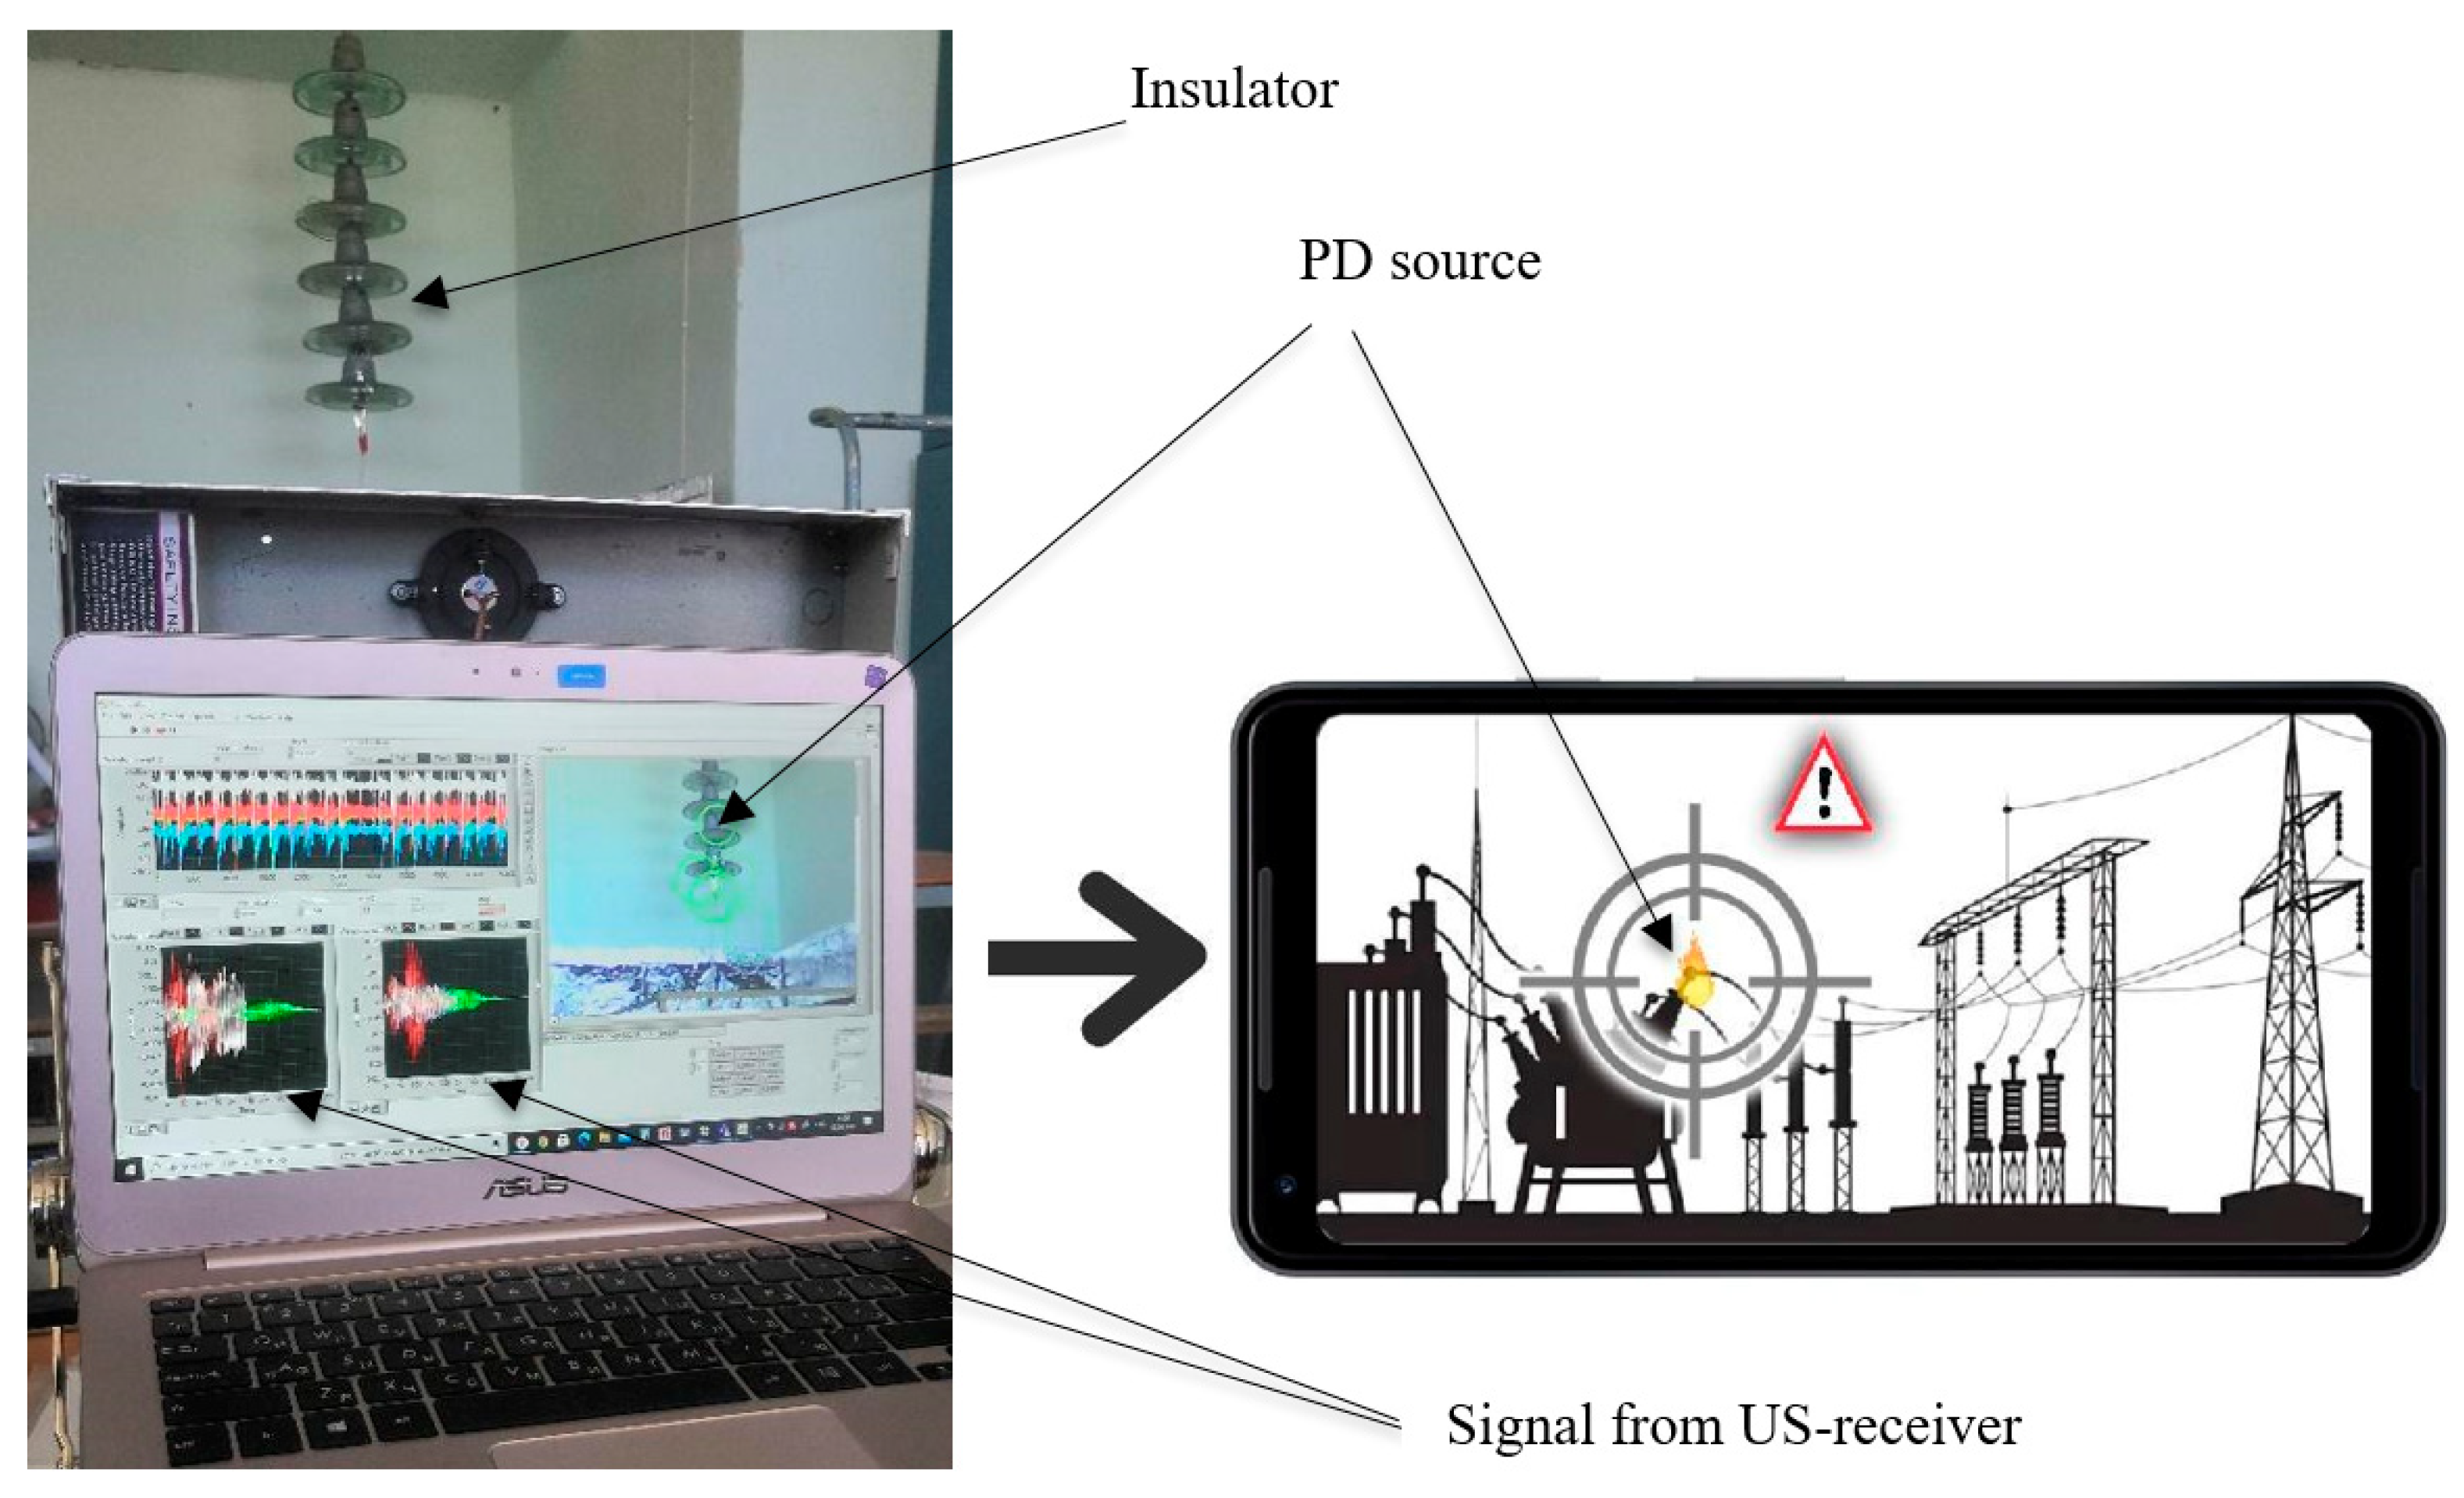
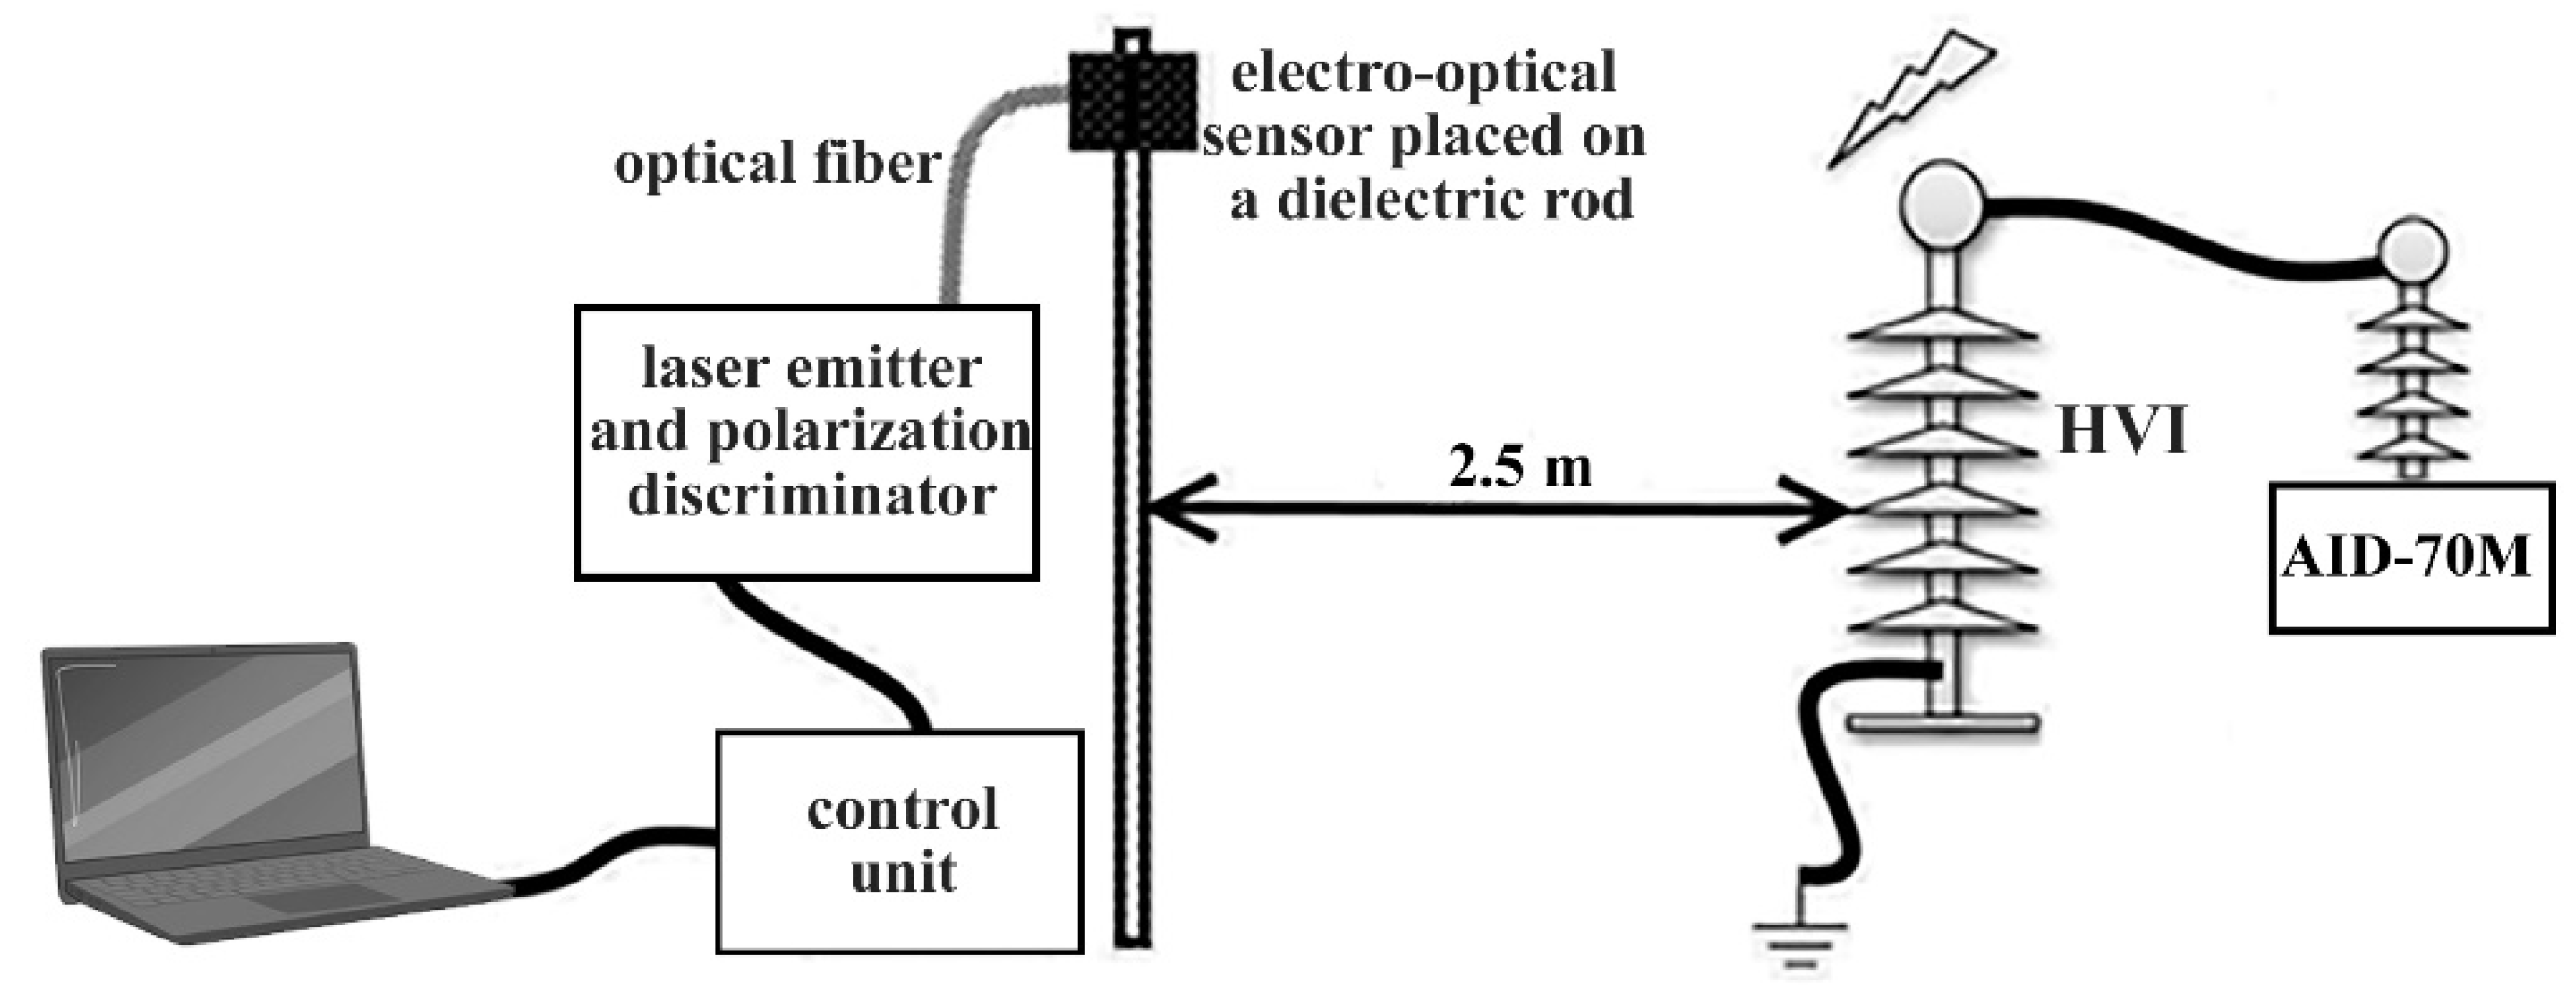
3.3. Diagnostics with an Electro-Optical Sensor

The recording high-intensity electric fields method is based on the electro-optical effect [48,49,50]. The physical principle of electro-optical sensor operation is based on the refractive index change of a laser beam passing through a periodic domain structure in an electric field with an intensity E. This effect is called the “linear electro-optical effect” or “Pockels effect”. The condition for the maximum reflection (or transmission) of a laser wave with a length λ0 from the PDS is fulfilled with the equality:
λ0 = 2 n D (reflection),
λ = (2 n + 1) D (refraction),
where n—refractive index, and D—PDS period.
The shift of the resonant frequency of the PDS corresponds to the change in the resonant wavelength:
λm = (λ0λE) = n3 r D E,
where r—electro-optic coefficient, and λE—wavelength in an applied electric field.
Therefore, the maximum reflection coefficient R of the laser wave from the PDS decreases with an increase in the resonant wavelength.
The change in reflection coefficient R could be represented as:
R = (dR/dE) E.
This expression implies:
E = λm (n3 r D)−1,
Therefore,
dR/dE = (dR/dλm) n3 r D
Figure 9 shows the value of the reflection coefficient R on the change in the resonant wavelength. If the laser wavelength λm is adjusted to the middle of the slope of the spectral reflectance curve corresponding to the value of Rmax/2, then the alternating electric field will create a corresponding change in the reflectance (∆R). The use of an almost linear segment dR/m makes it possible to determine the values of the field E on a linear scale.
We performed diagnostics of the state of a group of real high-voltage polymer insulators LK70/35, using the proposed method of remote contactless measurement of the electric field strength. The experiments were carried out at the Department of Industrial Electronics and Lighting Engineering stand (Kazan State Power Engineering University). The condition of the insulators was checked by scanning with an electro-optical sensor along the insulator shaft at a distance of 2.5 m.
During the experiments, several defective insulators with a damaged “core—end connections” were identified. Several insulators were in a pre-defective state. Figure 10 shows the distribution of the electric field strength along with the sample for (a) defective and (b) defect-free polymer insulators of the LK70/35 type. A slight increase in E near the ends of both samples can be explained by the absence of special screens for equalizing the field along the entire length.

4. Discussion

In this chapter, the authors discuss the research results, hypotheses, and formulated conclusions. Further areas of research are also determined.

4.1. Electromagnetic and Acoustic Recording of PD Method

This paper presents the method that we developed for contactless remote diagnostics of the HVI condition. The method provides contactless reception of pulse signals of partial discharges by an electromagnetic receiver. Further, their indication is determined and computer processing is performed in order to determine in each of the discrete intervals of the phase voltage the average values of the number and intensity of partial charge pulses that exceed the permissible threshold for the occurrence of defects or their development in comparison with the reference isolator. Additionally, the distribution of the number of partial discharges by intensity for the positive and negative half-periods of high voltage is determined. The presence and type of the most dangerous defects is viewed by the expansion of the phase intervals of radiation of partial discharges and a sharp increase in the number of partial discharges in negative half-periods of high voltage in comparison with positive half-periods.
In this case, the width and shape of single positive and negative pulses of partial discharges are additionally determined, and the type and location of the defect are established by their differences (increase in the width of the negative pulse).
Three diagnostic signs determine the type and location of the most dangerous for the normal functioning of insulators:
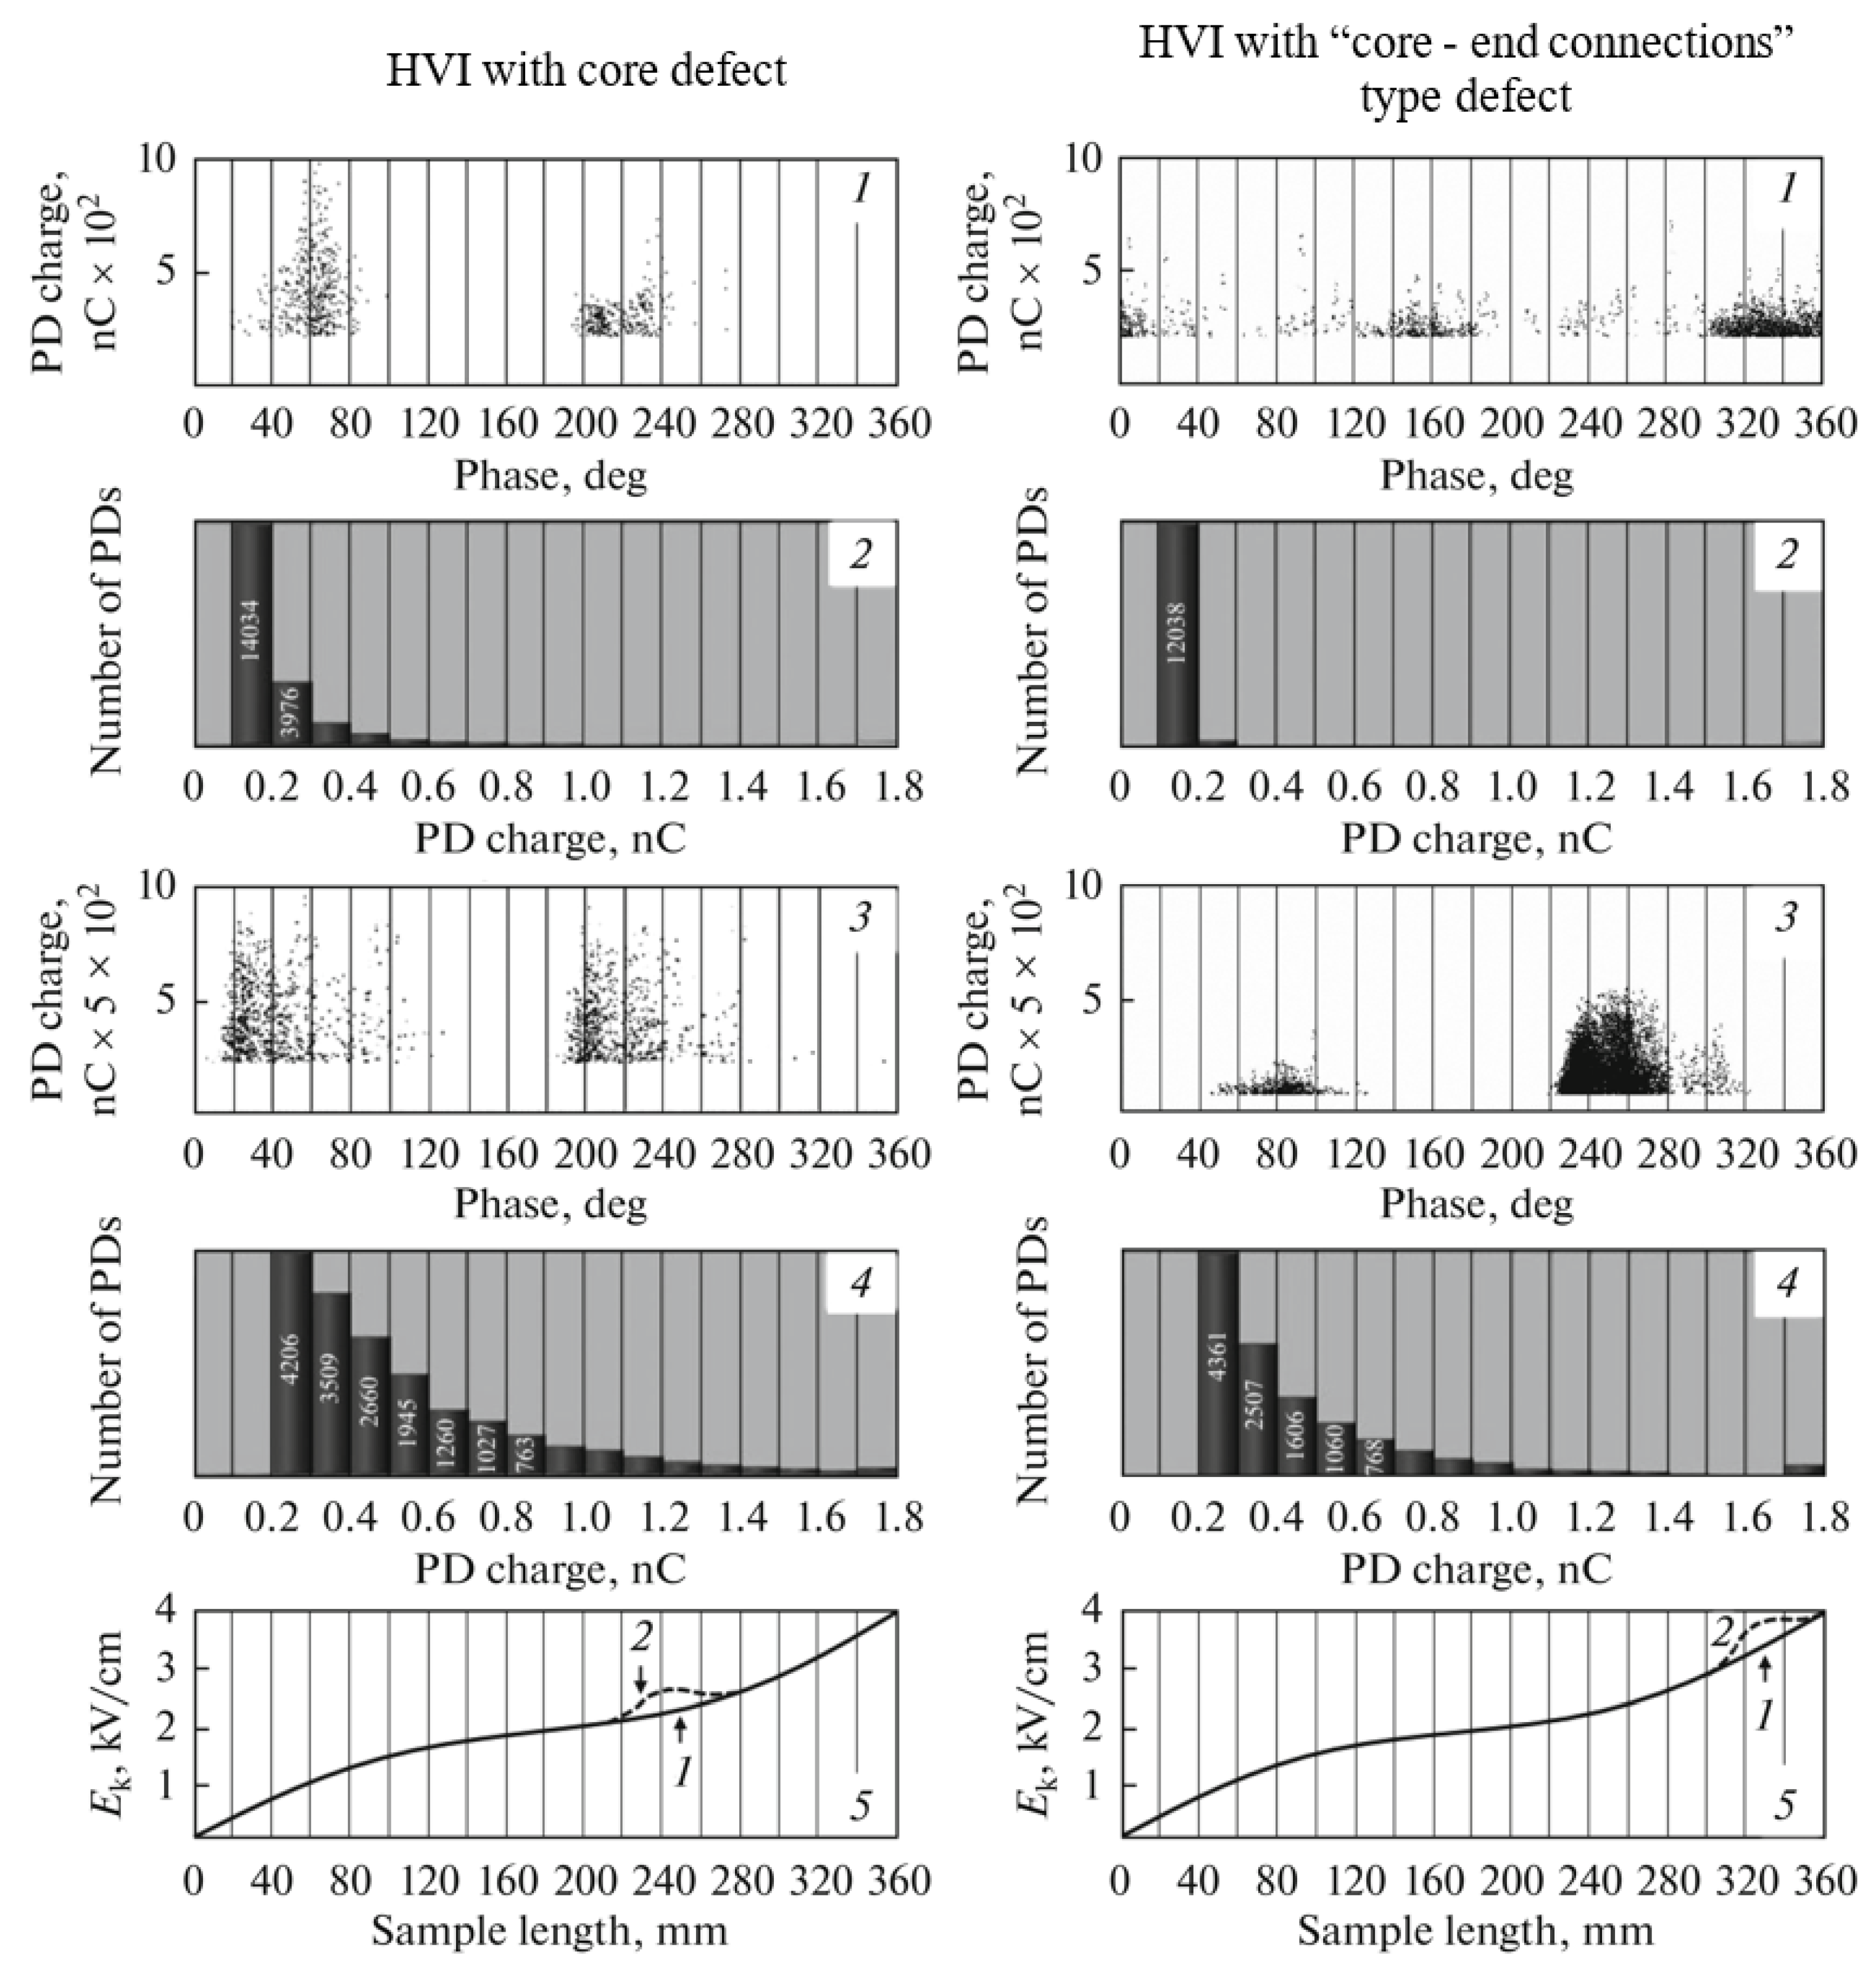
  • The significant broadening of the phase intervals of radiation of partial discharges;
  • The sharp increase in the number of partial discharges in negative high voltage half-periods in comparison with positive half-periods;
  • The significant difference in the shape of single pulses of partial discharges for positive and negative signals.
Determination of the number of pulses and PD intensity values (in charge units) exceeding the permissible safe level during operation and the PD pulse shape for each type of insulator is performed by comparison with similar characteristics of an insulator of the same type, taken as a standard.
Complete measurements of PD characteristics by simultaneously using electromagnetic and acoustic sensors in combination with visual inspection of HVI and subsequent computer analysis of parameters made it possible to divide HVI by a set of the most significant differences into a group that are workable versus a group that are inoperative. Diagnostic signs that distinguish workable HVIs from inoperative ones that need to be replaced are the following: the occurrence of PD with an intensity significantly (2–3 times) higher than the safety threshold at the rated operating voltage; shift of phase intervals, in which the intensity and number of PD pulses are greatest, towards smaller phase angles; and an increase in the number of more powerful PDs in the total number of PDs during phase intervals corresponding to the most powerful PDs.
Examples of the obtained generalized characteristics of PDs and overvoltage are shown in Figure 11 and Table 1, which shows the parameters of the most intense PDs, which are about 10% of the total PD in each phase interval. Workable includes HVI No. 1–5, and inoperative—HVI No. 6–7. Between the groups, the phase shift of the radiation (∆φ) is 20–30%, the increase in intensity (q) reaches 2–3 times, and the amount of PD increases 2–3 times. Differences in the values of PD parameters for the registration period of 10 min did not exceed 2–3% for both sensors.
Both types of small defects are characterized by a narrow power radiation of intensity PD, and they coincide for electromagnetic and acoustic sensors (Figure 11), but differ in radiation parameters (in phase intervals and PD intensities, in pulse shapes, in the degree of heating of a part of the HVI core). With an increase in the size of the “core—end connections” defect, an increase in the phase intervals of the PD emission was observed, more powerful PDs appeared, and the number of negative PDs increased in comparison with positive PDs. At the same time, the heating of a part of the insulator core was observed at a distance of about 10 cm near the end piece, by about 1–3 °C. According to the local heating of the dielectric core and the shape of the PD characteristics, such defects were classified as a “core—end connections” type defect.

4.2. Method for Determining a Faulty Isolator Using a Microphone Array

PD in HVI occurs on internal and surface defects [5]. PD generates a non-stationary acoustic wave that occurs in the superheated gas channel, created by a partial discharge current pulse and a PD is a point source of acoustic waves. To diagnose PD on internal defects by the acoustic method, it is necessary to use a sensor that has an acoustic contact with the insulator body, since almost complete reflection of the acoustic wave occurs at the porcelain/polymer–air interface. When PD appears on a surface defect, the acoustic wave propagates spherically, which makes it possible to register it contactless.
To localize an acoustic source from PD using a microphone array, cross-correlation of sensor signals is used [25,33,36]. The spatial arrangement of the receivers with the designations of their numbers is shown in Figure 12 (signal source—rS). Cross-correlation is performed for the signals of the receiver pairs r1r4 and r2r3.
Cross-correlation function for receiver pair r1r4
R r 1 , r 4 ( T ) = n = r 1 ( n ) r 4 ( n + T )
The sequence of the received signal of each receiver is divided into equal segments from n-points. Sections with zero signal level are discarded, which significantly improves the signal-to-noise ratio. The resulting value of the function R r 1 , r 4   ( T ) determines the level of correlation between the output signals of the two sensors r1 and r4. A higher level of correlation means that the T argument is relatively close to the real time difference of the signal arrival. For a pair of sensors r1r4, the difference in arrival time is determined by the ratio
T = d · cos θ c
where θ is the angle between the normal of the receivers r1r4 and the incident sound, deg.
For a pair of receivers r2r3, cross-correlation of signals is performed in a similar way.
The difference in arrival time for each pair of receivers, based on the results of cross-correlation of signals for each pair of receivers of the microphone array, makes it possible to reconstruct the coordinates of the acoustic radiation source—to localize the defect site on the inspected high-voltage insulators.
The intensity of the emitted acoustic wave is proportional to the energy released in the discharge and the amplitude of the wave is proportional to the square root of the discharge energy. The relationship between the amplitude of the acoustic wave and the magnitude of the discharge is linear [31].
The intensity of the received signals makes it possible to judge the magnitude of the PD and identify defective HVIs.

4.3. Electro-Optical Method

The combined method using electromagnetic and electro-optical sensors was tested on a series of LC 70/35 type polymer insulators. During the research, the authors identified the most common defects in HVI—these are damage to the core shell and damage to the “core—end connections” contact. We identified a complex of characteristics of partial discharges, which makes it possible to detect differences in the phase distribution of the intensity and number of PD pulses for the investigated insulators (Figure 13). In addition, we found that some of the characteristics had a distribution corresponding to the considered defects in the form of cracks in model samples made of electrical porcelain or defects on the surface of HVI cores.
PD on the «core—end connections» defects have special characteristics: the shift of the radiation phase intervals, the expansion of these intervals, an increase in the number and amplitude of discharges in negative voltage half-periods, as well as changes in their shape. In this type of defect, the contact breakdown occurs in the air gap. In this case, the breakdown of the contact consisting of an electrode, a gap and a core occurs in the air gap due to the field component normal to the gap, by emitting electrons from the electrode (cathode). As a result of electron bombardment of the surface of the dielectric core, an induced charged ion field with a density of up to 10−6–10−5 C/cm is formed. During this time the field changes its sign by 180° when the phase of the applied voltage changes. The intensity of the PD and the moment of occurrence are determined by the sign and the strengths of the applied and induced fields. The sum of these fields exceeds the electric breakdown field. According to our calculations and measurements, it was found that after the transition of the applied field to the negative phase, a condition for summing both fields occurs. This results in the generation of the most powerful PDs. In the case of a difference between the applied and induced fields there is a decrease in the total field and a tightening of the phase band of the PD radiation.
The intensity of the PD depends on the area and width of the gap between end connections and core. Due to long-term operation, these parameters are random and uncontrolled. Therefore, the intensity and the number of phase-half-period asymmetric PDs can be determined by the defect parameters. Due to electron-thermal processes, accelerated aging and even damage to the dielectric occurs during long-term operation of such a defective contact. As a result, this reduces the electrical strength of the high-voltage insulator.
Due to the PD, the induced field also affects the PD characteristics, shifting the end of the PD radiation intervals towards large phase angles. But the intensity and quantity of PD do not change much, due to the fact that the processes of PD generation when the sign of the applied voltage changes are symmetrical, since the induced field due to PD is smaller than the external applied field at small defect sizes. The difference in the shape of the pulses of positive and negative PD is due to the fact that the positive PDs are created by positive charges induced in the plasma of the air gap. Negative PD pulses are mainly initiating by a faster flow of induced electrons.
The results of the performed survey of the working condition of the PD using the developed two-channel method in the bench and field versions were presented. This proved the ability to remotely diagnose the degree of efficiency of a PD in the conditions of their operation and determine the type of the most dangerous defects and their location. This has become feasible due to the addition of additional diagnostic features of remote monitoring. The previously developed system could only distinguish between serviceable HVI from defective ones. Additional diagnostic signs include: a significant expansion and change in the phase intervals of PD radiation, an increase in the number and intensity of the PD in negative high voltage half-periods compared to positive half-periods, a decrease in the width of negative PD pulses, and the presence of large local gradients of electric fields.

5. Conclusions

Among the complex high-voltage electric power devices that require diagnostics during operation, high-voltage insulators occupy a special place. Numerous HVI on power transmission lines or electrical substations are subject to the complex effects of strong electric fields, gradients of light and thermal fields, electrodynamic and mechanical influences. All this creates conditions for the occurrence of defects, which inevitably leads to various failures and even accidents in complex electric power systems.
The set of methods for remote diagnostics of the operating state of high-voltage insulators has been developed. It is based on registration, transmission, and subsequent computer processing of partial discharge signals detected by electromagnetic, acoustic, and electro-optical sensors. In addition to them, visual control and troubleshooting of high-voltage equipment at power facilities have been used. Thus, it can be stated that the presented complex, including non-contact remote diagnostics of the state of high-voltage insulators, using a photonic crystal as an electro-optical sensor, makes it possible to determine the moment of occurrence of the insulators pre-defect state by identifying areas with increased electric field strength. Measurement of the electric field strength gradients in these areas makes it possible to determine the possible location of the defect’s formation during operation.
Evaluating the results of studying the characteristics of the PD in the HVI under the operating voltage, the following conclusions can be drawn. In contrast to the contact bench method for testing insulation with high voltage [10], which is based on the principle of measuring such PD characteristics as intensity, repetition rate and moment of occurrence over a certain time interval (second), measurement of such characteristics with the contactless method is associated with large errors, depending on the distance between the sensor and the HVI, and the influence of climatic and external interference.
The most important and reliable PD characteristics for non-contact monitoring of the operating state of polymer HVIs are changes in the phase intervals corresponding to the most powerful PDs, the intensity and repetition rate, in comparison with defect-free HVIs of the same type.
An increase in the measurement accuracy corresponds to the simultaneous use of several methods: acoustic and thermal imaging, electromagnetic and acoustic, as well as an additional optical method, with the accumulation of PD signals with subsequent computer signal processing.
A diagnostic forecast for the further period of the working state of positive HVI is possible by assessing the change in the phase angles of the onset of PD, the number of PDs and the intensity of the most powerful PD pulses over a long period (at least one hour) of high voltage exposure.
The results obtained during experimental studies confirm the industrial applicability possibility of the proposed method for contactless remote diagnostics of the state of high-voltage insulators under operating voltage.

Author Contributions

Conceptualization, D.A.I. and M.F.S.; methodology, A.V.G.-K.; software, D.A.Y.; validation, D.A.I., M.F.S. and D.A.Y.; formal analysis, A.V.G.-K.; investigation, D.A.I. and A.V.G.-K.; resources, T.G.G.; data curation, D.A.Y.; writing—original draft preparation, A.V.G.-K.; writing—review and editing, T.G.G.; visualization T.G.G.; supervision, A.V.G.-K.; project administration, D.A.I.; funding acquisition, M.F.S. All authors have read and agreed to the published version of the manuscript.

Funding

This research was funded by the Ministry of Science and Higher Education of the Russian Federation on fundamental scientific research «Distributed automated systems for monitoring and diagnostic the technical condition of overhead power lines and substations based on technology of broadband data transmission through power lines and the Industrial Internet of Things», grant number 075-00063-20-02.

Conflicts of Interest

The funders had no role in the collection, analyses, or interpretation of data, in the writing of the manuscript and the decision to publish the results.

References

  1. Sanitary and Epidemiological Rules and Regulations 1.2.3685-21. Hygienic Standards and Requirements for Ensuring the Safety and (or) Harmlessness to Humans of Environmental Factors; Chief State Sanitary Doctor of the Russian Federation: Moscow, Russia, 2021. [Google Scholar]
  2. State Standard 12.1.045-84. Occupational Safety Standards System. Electrostatic Fields. Tolerance Levels and Methods of Control at Working Places; Standartinform: Moscow, Russia, 2006. [Google Scholar]
  3. Boggs, S.A. Partial discharge: Overview and signal generation. IEEE Electr. Insul. Mag. 1990, 6, 33–39. [Google Scholar] [CrossRef]
  4. Altenbuzges, R.; Heitz, C.; Timmer, J. Analisis of phase-resolved partial discharge pattern of voids. J. Phys. D Appl. Phys. 2002, 35, 1149–1163. [Google Scholar]
  5. Mor, R.A.; Heredia, L.C.; Harmsen, D.A.; Munoz, F.A. A new design of a test platform for testing multiple partial discharge sources. Electrical Power and Energy Systems. 2018, 94, 374–384. [Google Scholar]
  6. Bartnicas, R. Partial discharges. Their mechanism, detection and measurement. IEEE Trans. Dielectr. Electr. Insul. 2002, 9, 763–808. [Google Scholar] [CrossRef]
  7. Runde, M.; Aurud, T.; Ljokelsoy, K.; Lundgaard, L.; Nokleby, J.; Skyberg, B. Risk assessment basis of moving particles in gas insulated substations. IEEE Transactions on Power Delivery. 1997, 12, 714–721. [Google Scholar] [CrossRef]
  8. Li, C.; Yoshino, T. Optical voltage sensor based on electrooptic crystal multiplier. J. Lightwave Technol. 2002, 20, 843–849. [Google Scholar] [CrossRef]
  9. IEC TS 62478:2016|IEC Webstore. Available online: https://webstore.iec.ch/publication/25740 (accessed on 27 July 2021).
  10. IEEE 4-2013-IEEE Standard for High-Voltage Testing Techniques. Available online: https://standards.ieee.org/standard/4-2013.html (accessed on 27 July 2021).
  11. Callender, G.; Golosnoy, I.; Rapisarda, P.; Lewin, P. Critical analysis of partial discharge dynamics in air filled spherical voids. J. Phys. D Appl. Phys. 2018, 51, 125601. [Google Scholar] [CrossRef] [Green Version]
  12. Wonf, R.L. Application of very high frequency method to ceramic insulators. IEEE Trans. Dielectr. Electr. Insul. 2004, 11, 1057–1064. [Google Scholar]
  13. Castro, B.; Clerice, G.; Ramos, C.; Andreoli, A.; Baptista, F.; Campos, F.; Ulson, J. Partial Discharge Monitoring in Power Transformers Using Low-Cost Piezoelectric Sensors. Sensors 2016, 16, 1266. [Google Scholar] [CrossRef] [PubMed] [Green Version]
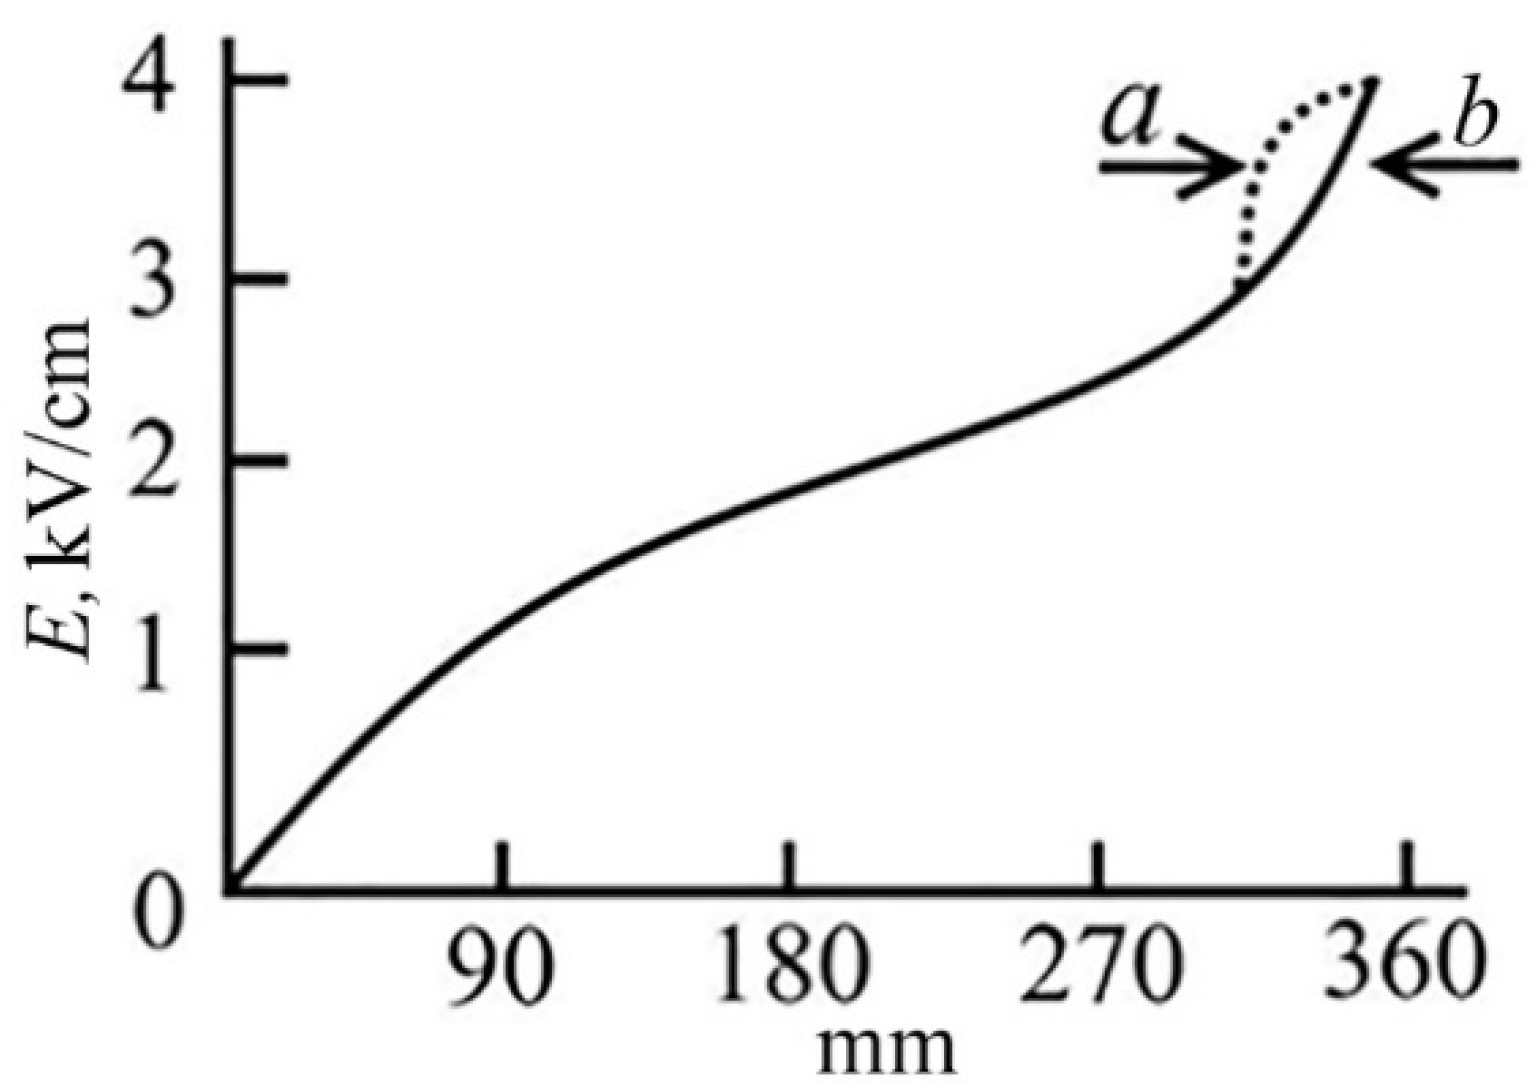
  14. Ramesh, M.; Cui, L.; Gorur, R.S. Impact of superficial and internal defects on electric field of composite insulators. Electr. Power Energy Syst. 2019, 106, 327–334. [Google Scholar] [CrossRef]
  15. Callender, G.; Lewin, P.L. Modeling Partial Discharge Phenomena. IEEE Electr. Insul. Mag. 2020, 36, 29–36. [Google Scholar] [CrossRef]
  16. Long, J.; Wang, X.; Zhou, W.; Zhang, J.; Dai, D.; Zhu, G. Comprehensive Review of Signal Processing and Machine Learning Technologies for UHF PD Detection and Diagnosis (I): Preprocessing and Localization Approaches. IEEE Access 2021, 9, 69876–69904. [Google Scholar] [CrossRef]
  17. Sikorski, W.; Walczak, K.; Gil, W.; Szymczak, C. On-Line partial discharge monitoring system for power transformers based on the simultaneous detection of high frequency, ultra-high frequency, and acoustic emission signals. Energies 2020, 13, 3271. [Google Scholar] [CrossRef]
  18. Zhou, N.; Luo, L.; Song, H.; Sheng, G.; Jiang, X. A substation UHF partial discharge directional of arrival estimation method based on maximum likelihood estimation. Trans. China Electr. Soc. 2019, 34, 3285–3292. [Google Scholar]
  19. Usachev, A.E.; Kubarev, A.Y. Problems of Insulation Diagnostics of Power Equipment by the Method of Partial Discharges. E3S Web Conf. 2021, 288, 01077. [Google Scholar] [CrossRef]
  20. Ilkhechi, H.D.; Samimi, M.H. Applications of the Acoustic Method in Partial Discharge Measurement: A Review. IEEE Trans. Dielectr. Electr. Insul. 2021, 28, 42–51. [Google Scholar] [CrossRef]
  21. Ghosh, R.; Chatterjee, B.; Dalai, S. A Method for the Localization of Partial Discharge Sources using Partial Discharge Pulse Information from Acoustic Emissions. IEEE Trans. Dielectr. Electr. Insul. 2017, 24, 237–243. [Google Scholar] [CrossRef]
  22. Sikorski, W. Development of Acoustic Emission Sensor Optimized for Partial Discharge Monitoring in Power Transformers. Sensors 2019, 19, 1865. [Google Scholar] [CrossRef] [PubMed] [Green Version]
  23. Pang, X.; Wu, H.; Li, X.; Qi, Y.; Jing, H.; Zhang, J.; Xie, Q. Partial discharge ultrasonic detection based on EULER-MUSIC algorithm and conformal array sensor. IET Gener. Transm. Distrib. 2018, 12, 3596–3605. [Google Scholar] [CrossRef]
  24. Azadifar, M.; Karami, H.; Wang, Z.; Rubinstein, M.; Rachidi, F.; Karami, H.; Ghasemi, A.; Gharehpetian, G.B. Partial discharge localization using electromagnetic time reversal: A performance analysis. IEEE Access 2020, 8, 147507–147515. [Google Scholar] [CrossRef]
  25. Gao, S.; Zhang, Y.; Xie, Q.; Kan, Y.; Li, S.; Liu, D.; Lü, F. Research on partial discharge source localization based on an ultrasonic array and a step-by-step over-complete dictionary. Energies 2017, 10, 593. [Google Scholar] [CrossRef] [Green Version]
  26. Luo, Y.; Li, Z.; Wang, H. A review of online partial discharge measurement of large generators. Energies 2017, 10, 1694. [Google Scholar] [CrossRef] [Green Version]
  27. Runde, D.; Brunken, S.; Rüter, C.E.; Kip, D. Integrated Optical Electric Field Sensor Based on a Bragg Grating in Lithium Niobate. Appl. Phys. B 2006, 86, 91–95. [Google Scholar] [CrossRef]
  28. Golenishchev-Kutuzov, A.V.; Golenishchev-Kutuzov, V.A.; Kalimullin, R.I. Photon, and Phonon Crystals: Formation and Application in Opto-Acoustoelectronics; Fizmatlit: Moscow, Russia, 2010; p. 158. [Google Scholar]
  29. Zaripov, D.; Nasibullin, R. Experimental system for continuous monitoring of overhead power lines and substations insulation. In E3S Web of Conferences; Voropai, N., Ed.; EDP Sciences: Les Ulis, France, 2020; Volume 216. [Google Scholar] [CrossRef]
  30. Phung, B.T.; Blackburn, T.R.; Liu, Z. Acoustic measurements of partial discharge signals. J. Electr. Electron. Eng. 2001, 21, 41–47. [Google Scholar]
  31. Lundgaard, L. Partial discharge. XIII. Acoustic partial discharge detection-fundamental considerations. IEEE Electr. Insul. Mag. 1992, 8, 25–31. [Google Scholar] [CrossRef]
  32. Rohwetter, P.; Habel, W.; Heidmann, G.; Pepper, D. Acoustic emission from DC pre-treeing discharge processes in silicone elastomer. IEEE Trans. Dielectr. Electr. Insul. 2015, 22, 52–64. [Google Scholar] [CrossRef]
  33. Silverman, H.F.; Yu, Y.; Sachar, J.M.; Patterson, W.R. Performance of real-time source-location estimators for a large-aperture microphone array. IEEE Trans. Speech Audio Process. 2005, 13, 593–606. [Google Scholar] [CrossRef]
  34. Lundgaard, L.; Tangen, G.; Skyberg, B.; Faugstad, K. Acoustic diagnoses of GIS; field experience and development of expert system. IEEE Trans. Power Del. 1992, 7, 287–294. [Google Scholar] [CrossRef]
  35. Pan, C.; Chen, G.; Tang, J.; Wu, K. Numerical Modeling of Partial Discharges in a Solid Dielectric-bounded Cavity: A Review. IEEE Trans. Dielectr. Electr. Insul. 2019, 26, 981–1000. [Google Scholar] [CrossRef] [Green Version]
  36. Xie, Q.; Li, T.; Tao, J.; Liu, X.; Liu, D.; Xu, Y. Comparison of the acoustic performance and positioning accuracy of three kinds of planar partial discharge ultrasonic array sensors. IET Radar Sonar Navigat. 2016, 10, 166–173. [Google Scholar] [CrossRef]
  37. Ultrasonic Sensor Murata MA40S4S/MA40S4R: Data Sheet. Available online: https://www.murata.com/-/media/webrenewal/products/sensor/ultrasonic/open/datasheet_maopn.ashx (accessed on 7 January 2021).
  38. Yaroslavsky, D.A.; Ivanov, D.A.; Sadykov, M.F.; Goryachev, M.P.; Savelyev, O.G.; Misbakhov, R.S. Real-Time Operating Systems for Wireless Modules. J. Eng. Appl. Sci. 2016, 11, 1168–1171. [Google Scholar] [CrossRef]
  39. Ivanov, D.A.; Golenishchev-Kutuzov, A.V.; Yaroslavsky, D.A.; Sadykov, M.F. Portable complex for remote control of high-voltage insulators using wireless data collection and transmission module. ARPN J. Eng. Appl. Sci. 2018, 13, 2358–2362. [Google Scholar]
  40. Ivanov, D.; Sadykov, M.; Golenishchev-Kutuzov, A.; Yaroslavsky, D.; Galieva, T.; Arslanov, A. The application of the technology of sensor networks for the intellectualization of the overhead power transmission lines. In E3S Web of Conferences; Art. No. 01071; Fedyukhin, A., Dixit, S., Eds.; EDP Sciences: Les Ulis, France, 2020; Volume 220. [Google Scholar] [CrossRef]
  41. Golenishchev-Kutuzov, A.V.; Golenishchev-Kutuzov, V.A.; Mardanov, G.D.; Khusnutdinov, R.A. Method of Contactless Remote Diagnostics of High-Voltage Insulators. Russian Federation Patent No. 2597962, 20 September 2016. [Google Scholar]
  42. Golenishchev-Kutuzov, A.V.; Golenishchev-Kutuzov, V.A.; Ivanov, D.A.; Mardanov, G.D.; Semennikov, A.V. Integrated Noncontact Diagnostics of the Operable Condition of High-Voltage Insulators. Russ. J. Nondestruct. Test. 2019, 55, 596–602. [Google Scholar] [CrossRef]
  43. Bogdanova, K.G.; Bulatov, A.R.; Golenishchev-Kutuzov, A.V.; Golenishchev-Kutuzov, V.A.; Kalimullin, R.I.; Potapov, A.A. Formation of Submicron Partially Ordered Domain Structures in Ferroelectric and Magnetic Materials. Phys. Solid State 2011, 53, 2263–2265. [Google Scholar] [CrossRef]
  44. Golenishchev-Kutuzov, A.V.; Golenishchev-Kutuzov, V.A.; Kalimullin, R.I.; Mardanov, G.D.; Potapov, A.A. Ultrasonic Tunable Transducer on Domain Structures. Ferroelectrics 2012, 441, 25–29. [Google Scholar] [CrossRef]
  45. Golenishchev-Kutuzov, A.V.; Golenishchev-Kutuzov, V.A.; Ivanov, D.A.; Mardanov, G.D.; Semennikov, A.V. Remote Testing for Defects in In-Service High-Voltage Insulators. Russ. J. Nondestruct. Test. 2018, 54, 682–686. [Google Scholar] [CrossRef]
  46. Golenishchev-Kutuzov, A.V.; Golenishchev-Kutuzov, V.A.; Ivanov, D.A.; Mardanov, G.D.; Semennikov, A.V.; Van’kov, Y.V. Complex Diagnostics of Defects in High-Voltage Insulators. Bull. Russ. Acad. Sci. Phys. 2019, 83, 1490–1493. [Google Scholar] [CrossRef]
  47. Andreev, N.K. Influence of sensitivity and specifity of measuring methods on their informativity and hardware requirements. In E3S Web of Conferences; Art. No. 05043; Shamsutdinov, E.V., Ed.; EDP Sciences: Les Ulis, France, 2019; Volume 124. [Google Scholar] [CrossRef]
  48. Golenishchev-Kutuzov, A.V.; Golenishchev-Kutuzov, V.A.; Ivanov, D.A.; Mardanov, G.D.; Semennikov, A.V. Method of Contactless Remote Diagnostics of High-Voltage Insulators. Russian Federation Patent No.2679759, 12 February 2019. [Google Scholar]
  49. Ivanov, D.; Galieva, T.; Sadykov, M.; Golenischev-Kutuzov, A.; Naumov, A. Method for the diagnosis of high-voltage dielectric elements during operation based on dynamic registration of electromagnetic radiation. In E3S Web of Conferences; Art. No. 01061; Voropai, N., Ed.; EDP Sciences: Les Ulis, France, 2020; Volume 216. [Google Scholar] [CrossRef]
  50. Golenishchev-Kutuzov, A.V.; Ivanov, D.A.; Kalimullin, R.I.; Semennikov, A.V. Remotely Measured Diagnostic Parameters for Estimating the Residual Life of High Voltage Insulators. Bull. Russ. Acad. Sci. Phys. 2020, 84, 1502–1504. [Google Scholar] [CrossRef]
Figure 1. Flowchart of a non-contact diagnostic device.
Energies 14 05670 g001
Figure 2. The monitoring system: MC—measuring cell, CC—the control center.
Energies 14 05670 g002
Figure 3. Flowchart the use of a portable device.
Energies 14 05670 g003
Figure 4. Flowchart of the device.
Energies 14 05670 g004
Figure 5. General scheme for measuring electric field gradients. The AID-70M is installed for testing dielectrics.
Energies 14 05670 g005
Figure 6. Flowchart of the measuring device.
Energies 14 05670 g006
Figure 7. The signal of one PD received by each ultrasonic receiver of the microphone array.
Energies 14 05670 g007
Figure 8. Single PD signal received by the EM channel of the portable device.
Energies 14 05670 g008
Figure 9. Dependence of the value of the reflection coefficient R on the change in the resonant wavelength.
Energies 14 05670 g009
Figure 10. Distribution of the field strength between the ends of the defective (a) and defect-free (b) insulators. The change in the field on the defect is shown by a dotted line.
Energies 14 05670 g010
Figure 11. PD parameters for HVI samples with small defects: 1—measurement by an electromagnetic sensor, 2—measurement by an acoustic sensor, and 3—distribution of the number of PDs depending on the intensity.
Energies 14 05670 g011
Figure 12. Spatial representation of the microphone array.
Energies 14 05670 g012
Figure 13. Parameters of PD and induced field gradients in polymer HVI, measured by electromagnetic and electro-optical sensors, respectively: 1, 2—small defects; 3, 4—large defects; and 5—spatial distribution of induced field gradients.
Energies 14 05670 g013
Table 1. PD performance parameters for the polymer HVI series.
HVI No.∆φq, pCN∆φq, pCN
145–6560200220–240601600
240–6060220225–235502000
350–6570200230–250601900
450–6560150220–240651000
545–7570180230–250751700
640–50290250230–2403002600
735–45270280220–2352702550
Publisher’s Note: MDPI stays neutral with regard to jurisdictional claims in published maps and institutional affiliations.

