Abstract
The aim of the study is to present the implemented “smart” solutions and the developed indicators of their measurement in the context of the city of Częstochowa (Poland), as well as a participant in the “Benchmarking—we are looking for the best smart city solutions”. In order to achieve the assumed goal, a traditional review of the literature on the subject in the field of “smart city” was carried out. Then, the methodological assumptions related to developing a model set of indicators for cities participating in the program have been presented. In addition, a comparative analysis of the obtained indicators values for cities, Częstochowa and Bydgoszcz, has been carried out in the scope of one exemplary measure. The proposed research procedure can be used to analyze and evaluate cities in the country, as well as to select alternative solutions in the context of other urban features. Due to the fact that other cities in Poland will also participate in the study, the significance of this work will have a wide impact. The research presented in the article is only a part of an intended larger initiative in which several dozen Polish cities will take part.
1. Introduction
In recent decades, it is evidenced that there is a rapid growth of urban areas. Due to the progressive development of industry and new technologies, people migrated from rural areas to urban agglomerations seeking work and housing. Mass urbanization places cities around the world at the center of social and environmental challenges. The increasing population of cities negatively affects the quality of life and resource consumption [1]. It raises a variety of problems that tend to endanger the environmental, economic, and social sustainability of cities [2,3].
Therefore, the management of urban areas has become one of the most important development challenges of the 21st century. There is a need for highly effective solutions generating sustainable economic growth and social welfare, reflected in the improvement of the quality of life of their residents. Contemporary cities should be modern cities in terms of infrastructure and management. These are ecological and sustainable cities, exploiting the achievements of science and technology. These are cities implementing new-generation information and communication technologies (supporting the service of residents), ecological innovations leading to the reduction of carbon dioxide emissions, or the effective use of energy resources, and modern social solutions. The answer to the challenges faced by modern cities is the concept of a smart city.
Nowadays, the concept of “smart cities” is a common topic in the literature. It concerns a variety of activities not only related to the digital transformation of public administration (smart public administration) but also economy (smart economy), mobility (smart mobility), environment and energy (smart environment), people (smart people), and quality of life (smart life) [4,5]. However, what makes a city “smart”, and how can it be further developed and targeted? Which methods ought to be used to measure its smartness and determine at what level it is now?
It has been attempted to answer these questions in the article. The study aims to present the implemented “smart” solutions and the developed indicators of their measurement on the example of the city of Częstochowa, which is one of the largest cities in the Silesian Voivodeship, associated with the Silesian Union of Municipalities and Poviats (SUMP), as well as a participant in the “Benchmarking—we are looking for the best smart city solutions”. As part of this project, SUMP has established working teams to develop an initial proposal of areas and indicators for monitoring development in the smart city area. As a result, designated areas, proposed measures, and specific indicators are presented in the article.
In order to achieve the assumed goal, a traditional review of the literature on the subject in the field of “smart city” has been carried out. Then, the methodological assumptions related to the development of a model set of indicators for associated cities participating in the program are presented.
The development of model indicators for measuring implemented smart city solutions is essential to limit the observed tendency of cities to “race” against each other in the diversity of implementation of such solutions without verifying their quality, level of advancement and importance for the inhabitants and the region. Such an initiative has come from the Silesian Union of Municipalities and Poviats together with several cities. In addition, the “smart” solutions, which have so far been applied in Częstochowa, are discussed, and then comparative analysis of the obtained indicators values for two cities, Częstochowa and Bydgoszcz, has been carried out in the scope of one exemplary measure, which is local transport. This measure has been included in area 1—Mobility, concerning local transport, national and international accessibility, ICT infrastructure, and sustainable transport system.
The proposed research procedure can be used to analyze and evaluate cities in the country, as well as to select alternative solutions in the context of other urban features. Since other cities in Poland will also participate in the study, the significance of this work will have a wide impact. The research presented in the article is only a part of an intended larger initiative in which several dozen Polish cities will take part. The article describing the research methodology in smart cities will provide city managers with a compendium of information on the variables and tools that are important for governing the cities of the future.
2. Literature Review
2.1. Smart City Definitions
A smart city is now a commonly used concept, which is at the same time followed by real changes. Urban areas are becoming more and more adapted to the needs of people, and it is proved that the latest solutions can improve the quality of life. A smart city literally means an intelligent city. However, this term does not describe this concept well because it is not only about intelligence.
There are many concepts that describe the idea of a smart city. A literature review in the field of the smart city concept was carried out, among others, by Ramaprasad et al. [6], Albino, Berardi, and Dangelico [7], Anthopoulos [8], Gill-Garcia et al. [9], Neirotti et al. [2], Chourabi et al. [10], Chatterjee and Kar [11], Sinkiene et al. [12], Kobayashi Kaneko et al. [13], Szarifi et al. [14], or Mora et al. [15]. A review regarding information systems was performed, inter alia, by Ismagilova et al. [16]. A critical analysis of the concept was also conducted by researchers De Santis et al. [17], Hollands [18], or the Focus Group on Smart Sustainable Cities ITU-T [19].
According to the traditional approach presented by the Committee of Digital and Knowledge-based Cities, “a smart city is (…) a city that uses information and communications technology to make both its critical infrastructure, its components and utilities more interactive, efficient, making citizens more aware of them” [20].
In the wider definition of this Committee, a city can be considered as “smart” when its investment in human and social capital and communications infrastructure actively promotes sustainable economic development and high quality of life, including the wise management of natural resources through participatory government [21].
However, while analyzing the literature on the subject, it can be noticed that despite the discussion on the conceptual framework for smart cities that has been ongoing for many years, it has not been possible yet to work out a single, unambiguous definition [2,22,23,24], mainly due to the multitude aspects of urban development, increasing challenges facing local authorities in the field of solving climate, and energy and urbanization problems [25,26]. The key to solving these problems in the cities is the development and implementation of advanced technologies aimed at improving the quality of life in the city and reducing the costs of its operations while taking into account the goals of sustainable development [24,27]. Currently, the smart city concept is studied and researched considering technical, social, environmental, and economic factors [19]. In its essence, the concept of a smart city concentrates on the use of advanced technologies, including information technology, and the activity and creativity of its inhabitants [24]. Authors can focus their research on the quality of life, public services, sustainable development, and/or ICT solutions [28].
The issues of defining a smart city are also complicated by orbiting visions and concepts of cities containing elements of modernity, technological development and digitization (for more see [4,29,30,31,32,33], i.e., digital city [34,35,36], creative city [37,38], knowledge city [39], intelligent city [40], information city [41,42], green city (eco-city) [43,44], ubiquitous city (u-City) [29], and learning city [45,46].
However, it is the smart city concept that has become predominant among these variants, especially at a city policy level, globally as well as in Europe. The first attempts to define the concept have focused on the implementation of ICT in the area of public services. Smart cities are characterized by the use of IT systems to coordinate the development of urban infrastructure, which contributes to the improvement of its functionality and efficiency for residents [4,6,20,30,40,47,48,49].
Other later definitions, while retaining ICT’s important role, provide a broader perspective. The approach suggested by Schaffers et al. [36] also emphasizes sustainability, quality of life, and urban welfare creation through social participation, for example, by addressing societal challenges such as energy efficiency, environment, and health. Similarly, the definition of ITU-T Focus Group on Smart Sustainable Cities [10] emphasizes four aspects in defining a smart city: (1) society, (2) economy, (3) governance, and (4) environment. Authors of the report, after analyzing around 120 definitions of a smart city, concluded that: “A smart sustainable city (SSC) is an innovative city that uses information and communication technologies (ICTs) and other means to improve quality of life, efficiency of urban operation and services, and competitiveness, while ensuring that it meets the needs of present and future generations with respect to economic, social and environmental aspects” [19].
It should be noted that the concept of a sustainable smart city is now more and more often mentioned during scientific disputes [27,50,51,52,53,54,55,56,57]. A literature review in this field was carried out, among others, by Bibri and Krogstie [1], Yigitcanlar et al. [26].
In studies on the development of smart cities, there is usually agreement regarding the pursuit, through appropriate decisions and actions, of sustainable economic growth and improvement in the quality of life within the city, where the reduction of negative impacts on the environment becomes an important element [50,58,59].
According to Sikora-Fernandez [60], the smart city concept is moving towards the concept of a “sustainable city”, in which resource-saving concerns are not only the environmental aspect but also are economic, social, and spatial aspects in the context of the city’s operations. In this case, a smart city means sustainable development of urban areas while improving the attractiveness of urban space and maintaining a high quality of life and health of inhabitants (see for example [1,61,62]). Rapid urbanization requires adapting the processes taking place in the urban issue to increase the quality of life of its inhabitants in parallel with the development of cities. This applies to the improvement of mobility, digital innovation, modernization of facilities, and implementation of smart services. Developing the economic attractiveness of metropolitan areas should not endanger natural resources; therefore, one should aim at reducing the environmental impact of cities. In searching for innovations, a sustainable model of urbanization and regional development should be planned—only this will make smart cities a real chance for a better life for the community [21,63].
Another very important aspect that is taken up in the definitions of a smart city is the role and participation of citizens in the smart city. According to Simonofski, Van Den Storme, and Meers, the participation of the citizen in the context of smart cities has gained considerable attention from researchers and practitioners [64]. The authors presented the categorization of roles that citizens can play in the smart city as well as a detailed evaluation tool. The role of citizens in the smart city is also referred to by Vanalo, who explores alternative ways in which citizens are positioned within different imaginaries of the smart city [65]. Joining the discussion, Cardullo and Kitchin critically appraise citizens’ participation in the smart city [66]. They create the ‘Scaffold of Smart Citizen Participation’—a conceptual tool to unpack the diverse ways in which the smart city frames citizens, to then measure citizens’ inclusion and involvement as well as empowerment in smart city initiatives in Dublin, Ireland. The role of human capital and education in the development of cities is emphasized, among others, by Kuźniar [67], Bibri and Krogstie [1], Dameri, Dameri et al. [68], Szapiro [69], Hollands [70], Giffinger et al. [5], Winters [71], Lee et al. [50], Pichlak [72], Caragliu et al. [51], Russo et al. [73], Schipper and Silvius [57], and Allahar [74]. According to European Parliament [4], a smart city consists of components and people. Securing the participation of citizens and relevant stakeholders in the smart city is, therefore, another success factor.
The group of consulting companies, Smart City Council, indicates three basic characteristics of a smart city [75]:
- Livability: Cities that provide clean, healthy living conditions without pollution and congestion. With a digital infrastructure that makes city services instantly and conveniently available anytime and anywhere.
- Workability: Cities that provide the enabling infrastructure—energy, connectivity, computing, and essential services—to compete globally for high-quality jobs.
- Sustainability: Cities that provide services without stealing from future generations.
For the purposes of this study, the authors assume that a smart city is a city that exploits human and technological potential for its sustainable development.
2.2. Smart City Areas
Building a smart city is a set of different activities that can be applied in various areas. At least a few are worth mentioning, such as smart public and road lighting, communications and telecommunications, video protection, transport and mobility, infrastructure for education and healthcare, tools for public services, water treatment, and waste treatment, and air quality measurement (see, for example, [76,77,78]).
The area of activity belongs to many sectors such as local authorities, health care, education, training and research, commercial buildings and retail trade, places of rest and leisure, culture, sport, religion, conventions, communication networks, and public transport [79,80].
In order to improve the quality of life and functioning in the city in every aspect, smart cities use advanced technologies, e.g., intelligent construction [81]. According to this assumption, residents should live better and more comfortably, and at the same time, the costs of the functioning of the entire urban organism should be as low as possible (see, for example, [82]).
The manifestation of a well-planned smart city is the satisfaction of its inhabitants. A smart city is not about demolishing everything that has arisen so far and building a new city of the future, but about using the existing infrastructure as efficiently as possible. Thanks to applying IT and communication solutions, smart cities use resources more efficiently and improve the quality of life of their inhabitants. Most often, smart city solutions are introduced in such areas as (see, e.g., [2,19,74,76]): (1) public transport, (2) traffic management, (3) public offices and services, (4) energy, (5) built environment and city infrastructure (6), development of the local community, and (7) health. In addition, [6] the following aspects are also indicated: (1) city administration and management, (2) policies and other institutional arrangements, (3) governance engagement and collaboration, (4) human capital and creativity, (5) knowledge economy and pro-business environment, (6) natural environment and ecological sustainability, (7) ICT and other technologies, and (8) data and information.
Smart transport is most often referred to in the context of a smart city. There is a reason for this, such as traffic jams, noise and pollution are problems in many cities. The introduction of comprehensive solutions in this area allowed many authorities to deal with these problems. The assignment of Intelligent Transport System (ITS) is to solve the problems posed by rising traffic.
The key to effective management will be the combination of various solutions and intelligent systems on a city-wide scale. However, the integration and the possibility to take advantage of the benefits of ITS and Smart City solutions addressed to different users are still a major challenge (see, for example, [83]).
The burden of individual smart city elements in the general concept of a smart city depends on the development priorities adopted in a given geographical area. In the United States, this concept is inclined to the theory of “smart growth”, in which the greatest importance is attached to such spatial planning as to focus the city’s growth in its center, whilst limiting the disadvantages resulting from an excessive concentration of buildings and people. In addition, information and communication technologies (ICT) [70], which can be used in virtually every area of the city’s operations, are considered to be the decisive factors of city success. In Australia, the role of digital media, creative industries, and cultural initiatives [60,84] are more often emphasized.
The smart city concept in EU documents originally focused only on the possibility of rapid progress in achieving the goals of the EU energy strategies and climate targets. Its intention was initially to support cities and regions in pioneering greenhouse gas reduction through a sustainable energy economy [85,86,87] and then evolved towards an information and communication infrastructure to support the city’s harmonious development in such areas as economy, transport, environment, society, quality of life, and co-ordination [4,24].
Jelonek and Hajduk consider that “the concept of a smart city should put more emphasis on energy, which, if implemented in a sustainable manner, is likely to contribute to the reduction of city maintenance costs, economic growth, and to fulfill the obligations imposed on the member states by the European Union regarding pollutant emissions and respect for the natural environment” [88].
Sustainable, smart urban planning is a rapidly growing market with some very strong growth drivers. Other countries, including Poland, are starting to approach e-mobility, which has been developed for many years and is particularly important in France, Germany, Switzerland, and the Benelux countries, where government funds favor development.
2.3. Smart City Advantages and Pitfalls
The idea of a smart city is a sustainable development supported by modern technologies, which, on the one hand, contributes to the improvement of the quality of life of residents, and on the other hand, reduces the excessive use of natural resources [40,82]. Residents of many cities are already able to use smart solutions. For instance, thanks to ITS, drivers can see real-time traffic jams in the city, and public transport passengers can find out when a tram or bus will arrive if there are any delays or any other accidents. Because of the applications, passengers and drivers find the fastest way to get to the selected destination. On the other hand, the management system analyzes the traffic in the city on an ongoing basis and adjusts the light cycles to its intensity. These technologies serve to smoothen traffic, contribute to the reduction of energy and fuel consumption, and consequently limit exhaust emissions (see, for example, [89]). These solutions have not only improved transport and increased security but have also contributed to the rise of information flow, thanks to which it is possible to plan public transport timetables much better.
However, this integration’s main benefits consist of further improvement of public transport, improving its safety, increasing mobility, and indirectly—obtaining beneficial effects of environmental protection by reducing traffic jams and smoke in the cities. Another such example is smart pedestrian crossings that improve safety [90]. Examples of introducing modern solutions in a smart city are, for instance [2,19]:
- parking spaces—an application that allows to search for free parking spaces
- use of renewable energy sources
- energy self-sufficient buildings
- applications that allow buying tickets for parking spaces and use services in administrative offices
- measurements of water and energy consumption
- garbage collection
- intelligent city lighting
- e-payments
- participatory budgets
- city bikes and scooters
Smart cities are supposed to be a response to progressive urbanization and its consequences.
Currently, the greatest challenge is the necessity to integrate these solutions to complement each other, improve road traffic, and that the information not only serves one user but also can be used in a comprehensive and integrated manner.
The development of modern technologies, which allows for fast data transfer, widespread availability of databases (“public cloud”), the emergence of better and easily scalable infrastructure, and an expanded network of sensors and controllers make cities more and more computerized. The main benefit is improving the quality of services provided to city users and savings in financial spending, time, and energy for the city’s operations [91,92].
All solutions introduced as part of the smart city concept improve important aspects of residents’ lives. However, they bring not only opportunities but also threats. The very idea of smart cities raises more and more doubts among city authorities, mainly concerning the collected data and their processing. In this context, important questions arise as to who actually should have access to this data and whether surveillance of citizens is not excessively used.
Together with the establishment of new applications and solutions, cities become vulnerable to external attacks on their infrastructure. They face the challenge of ensuring that information is protected against unauthorized access by third parties. This, in turn, will generate increasing costs related to data protection and access to its own infrastructure.
The cities of the future face many challenges. One of them is dealing with the excess of digital data and, most importantly, guaranteeing information protection against unauthorized access. Leaving the systems with the so-called remote access to devices controlling traffic lights, lighting or the power grid without adequate security is a huge risk for all residents functioning in smart urban ecosystems [93].
Another smart city challenge is associated with digital and technological exclusion. The digital divide has been in discussion since the emergence of Information and Communication Technologies (ICT) and the Internet [94,95]. Initially, the digital divide has revolved mainly around the issue of access to the internet and ICT, which is now considered the first level of the digital divide [96,97]. Later studies have identified two successive levels of digital divide [96,98,99,100,101], namely the ability to apply modern technologies (level II) [102,103,104] and measurable benefits and consequences of using technological solutions (level III) see, for example, [100]. Increasingly, considerations refer to the digital exclusion of seniors. It is essential from the point of view of implementing smart city solutions because older people, who cannot use smartphones and the Internet, and new technologies are difficult to understand for them, often even unintuitive, cannot fully use solutions of a smart city. Therefore, the lack of proper introduction of these solutions for use by the elderly may, in some cases, result in frustration and nervousness, which will directly translate into distrust of the city authorities [105,106].
Differences that can be observed between cities in the implementation of “smart” solutions may often result from the lack of a long-term strategy and vision of city authorities who are afraid to make bold decisions. Another barrier is low awareness of residents and low saturation of cities with ICT solutions, including necessary infrastructure.
2.4. Smartness Evaluation Frameworks
Evaluating cities in terms of their effectiveness in achieving assumptions of the Smart City concept is not an easy initiative for one important reason. Scientists have to consider many factors, some of which are interdependent and adjust the assessment to the overall social and economic situation of the country.
Most often, smart city models are implemented using the main areas, which researchers [107] identify as the smart economy (competitiveness), smart mobility (transport and ICT), smart environment (natural resources), smart people (social and human capital), smart living conditions (quality life) and smart governance (participation). Most usually, the above-mentioned factors (all or partially) are considered while creating annual smart city rankings.
As Zakrzewska-Półtorak [108] argues that measuring the level of smartness in cities is a key issue (developing a coherent methodology for measuring smart cities enables their comparing), while the most important determinant of selection of indicators and measures is the limited availability of statistical data. There are already many studies on social, economic, and environmental criteria for assessing the smartness of cities in the literature. Komninos and Sefertzi [109] have proposed a methodology, including 40 standardized indicators in four categories:
- (1)
- education and skills
- (2)
- knowledge and innovation institutions
- (3)
- digital infrastructure and e-services
- (4)
- results of innovation
Lazaroiu and Roscia [48] have developed a methodology for estimating one aggregate measure of smart cities based on the concept of fuzzy sets, which means that partial indicators (they included 18 of them) that make up the main measure are not homogeneous and require a significant amount of data.
On the other hand, Lombardi, Giordano, Farouh, and Yousef [49], based on the Quadruple Helix model, taking into account the mutual relations occurring in the process of creating knowledge between research centers, local government institutions, industry, and society, have developed a methodology for measuring the smartness of cities using 60 partial indicators in five categories:
- (1)
- smart economy (related to competitiveness)
- (2)
- smart environment (related to natural resources)
- (3)
- smart living (related to the quality of life)
- (4)
- smart human capital (related to people)
- (5)
- smart governance (related to participation)
The team led by Prof. Rudolf Giffinger from the Vienna University of Technology [110], who included in the developed model as many as 90 partial indices making up 27 standardized measures, in six key dimensions:
- (1)
- smart economy
- (2)
- smart environment
- (3)
- smart living
- (4)
- smart people
- (5)
- smart governance
- (6)
- smart mobility
In 2007, 2013, and 2014, they analyzed over 70 medium-sized European cities, selected according to (1) the population criterion (from 100,000 to 500,000 inhabitants), (2) independence (range of influence up to 1.5 million inhabitants), and (3) knowledge (existence of at least one university).
In 2015, version 4.0 described the results of studies of larger cities with a population of 300,000 up to 1 million inhabitants. The team included 90 cities from 21 EU countries and assessed their smartness level in the six categories. It should be mentioned that the first model developed by Giffinger’s team has become the basis for research and measurements created by subsequent investigators.
Another well-known methodology for measuring smart cities is the Motion Index, prepared by IESE Business School. The authors evaluate and rank cities in terms of the economic situation, technology, mobility and transport, environment, management, human capital, social ties, spatial planning, and international projects [111].
In addition to the above-mentioned smart city measurement methodologies, many others are mentioned both in the literature and in practice [112,113]. The most popular smart city measurement methodology is included in ISO 37120: Sustainable Community Development (see, for example, [114,115]), British Standards Institute Maturity Model (BSI), and International Data Corporation Maturity Scape (IDC).
The indicators detailed in ISO 37120 have quickly become the international reference point for sustainable cities. The ISO 37120 norm has used 46 basic and 54 additional indicators, including 17 thematic groups [116]. ISO/TC 268/WG2 experts have identified the need for additional indicators for smart cities.
ISO 37122 complements ISO 37120 and “establishes indicators with definitions and methodologies to measure and consider aspects and practices that dramatically increase the pace at which cities improve their social, economic and environmental sustainability outcomes”. When used in conjunction with ISO 37120, this document helps cities identify indicators for applying city management systems, such as ISO 37101, and to implement smart city policies, as well as various programs and projects [63].
The discourse on urban and sustainable development indicators highlights the challenges of indicator relevance, measurability, complexity, and usability. According to Carid, these challenges address “developing valid approaches to mapping indicators and metrics onto standards and goals; the measurability of tangible and/or intangible indicators to support comparability; the representation and measurement of complexity in urban systems; and designing standardized smart city indicators with utility and value for different purposes and urban contexts” [113]. An ideal set of indicators should contain crucial, measurable, and transparent indicators for a specific goal and audience [117].
The efficient system of smart city indicators should be based on the already existing indicators of the city’s development, taking into consideration at the same time operational, political, and strategic levels. It is assumed that the development of this system will take place with the participation of a group of stakeholders who, on the one hand, are required to involve relevant research groups and the entire community for cooperation, and on the other hand, to be open to improvements and future innovations. In addition, an ideal system should perform a comparative analysis between cities, which will allow for the assessment and transparent documentation of their development towards smart cities [113].
3. Materials and Methods
Despite the considerable interest in smart city solutions, assessing the effectiveness of the implemented assumptions of individual solutions is not a simple undertaking. Previous studies indicate that there is a diversity of procedures for testing and assessing the intelligence of cities [112,113]. Section 2.4 presents a few selected methodologies that were the starting point for the development of a model set of indicators by municipalities and cities associated with the Silesian Association of Communes and Districts (ŚZGiP), as well as other cities in Poland invited to cooperate under the “Benchmarking—we are looking for the best solutions” program.
This study focuses on presenting the prepared model set of criteria for monitoring development in the smart city area for the Silesia region and then presenting a case study on the example of the city of Częstochowa, which is one of the program participants.
The primary objective of this study was a necessity of acquiring knowledge on the application of “smart city” solutions in the city of Częstochowa as well as a pilot comparative analysis with the city of Bydgoszcz in the scope of the use of one selected measure, which is local transport (from area 1—Mobility).
While beginning the development of measurement indicators, the participants of the program used the experience of European cities and scientific studies in the field of a smart city. Due to the fact that many cities associated with the Silesian Union of Municipalities and Poviats already implement, according to their assumptions, activities aimed at the smart city in selected and monitored areas, the most important task for the implementation of the program in the initial phase was their unification and standardization.
For measuring smart city from the Silesia region, a list of standardized indicators grouped in six areas/categories has been prepared (own study based on data from the City of Częstochowa, as part of the “Benchmarking—we are looking for the best solutions” program):
- mobility
- economy
- environment
- management
- education and skills
- quality of life
The areas were defined based on the analysis of existing publications, own previous experiences of cities, and a general discussion in the form of “brainstorming” carried out as part of working meetings of public officials and representatives of the program coordinator. The basic assumption was that as many common areas as possible coincide with the areas defined so far by individual cities, as well as that these areas should best reflect the development directions of the cities of the future. An example is the City of Częstochowa (discussed in detail in the next chapter), amongst the six areas selected by the city so far, only one—“People” have changed to “Education and skills”. In the case of Częstochowa, it was decided that the new area will partially complement the existing one, and at the same time, it will more closely reflect the city’s long-term moving towards openness, cultural diversity, or actions for a common Europe. It is worth mentioning that Częstochowa was the first city in Poland, Central and Eastern Europe, that received the Honorary Flag of the Council of Europe in 1993, the Council of Europe Award in 1995, and the highest laurel the Council of Europe awarded to European self-government, i.e., the Europe Award—PRIX DE l’EUROPE 1998 [118].
The next step was to determine the initial measures and partial indicators for individual areas by the working parties established for this purpose, consisting of representatives of 2–3 cities. All indicators were measurable, and the data had to be available either from the Central Statistical Office or from the cities’ own resources. The developed measures were discussed within the teams, in which practitioners from particular fields participated and then analyzed and assessed by all contestants of the program. The basic assumption was the application of appropriate and representative criteria in order to precisely define the current and target state of development.
Certain indicators that were deemed relevant by the teams and raised doubts about the properties and methodology of adopted measurement were analyzed in detail. Such indicators include “The number of airports within a radius of 120 min away by public or individual transport from the city center”. Having analyzed the location of international airports in Poland (also at the border to the Silesia region) and the maximum travel time acceptable for most, a radius of 120 min drive to the airport from the center of a given city was assumed. For cities with their airport, the optimal travel time is approximately 30 min. Częstochowa, as the northernmost city in the Silesian region, has access to four airports in this assumption. However, the airport in Warsaw is already at the border time. It was also determined that the basic indicators (obligatory for everyone), which will be a model set of criteria for monitoring development in the area of smart city, cannot derive from paid resources, and their access cannot be limited in any way. There are no such restrictions for the remaining optional indices.
The adopted research time frames for cities from the Silesian region and those invited to the program from outside the region currently apply to the next few years. These terms will probably be modified subsequently, depending on the dissemination of good practices and the creation of a nationwide network of smart cities. 2017 was the zero year from which the measurements of changes in the functioning of cities began. It is an optimal year in which most cities in the region can indicate directions and activities in the field of smart city solutions. Thanks to this, analyzing indices in the initial phase of the program may become a source of interesting insights for application by others.
Table 1 presents the areas of research with the specification of measures assigned to individual categories.

Table 1.
Basic areas/categories of comparative research.
The areas accepted for research are placed within the framework of the methodological solutions presented above, developed by various research teams worldwide. The applied areas correspond to the uniqueness of the region and adopted development strategy, and enable acquisition of necessary data. The data has usually come from the Central Statistical Office (CSO) and the calculations of individual cities (Town Hall) as well as their organizational units (Water and Wastewater Company) participating in the research.
Table 2, Table 3, Table 4 and Table 5 below present examples of indicators concerning the area of city operation in the area of smart solutions (smart city).
Table 2.
Area 1 concerning local transport, national and international accessibility, ICT infrastructure, sustainable transport system. The measure—“local transport”.
Table 3.
Area 2 on innovation, entrepreneurship, city image, efficiency, labor market and international integration.
Table 4.
Area 3 on air quality, environmental awareness, and sustainable resource management.
Table 5.
Area 4 on civic awareness, public and social services, and efficient and transparent administration. The measure—“informed citizens and public and social services”.
For the purposes of this measure, data on such partial indicators as the number of low-emission buses, city bikes, and/or the number of “Park & Ride” parking spaces were analyzed. Indicators such as road safety, i.e., the number of road accidents or the number of casualties and/or seriously injured pedestrians, are also worth noting.
Table 3 below shows the measures for second area/category related to innovation, entrepreneurship, city image, productivity, labor market and international integration
For the purposes of measurement in this category, data on such partial indicators as the number of international projects, economic entities with foreign capital, and/or even the number of international students studying at universities in a given city were analyzed.
Table 4 defines the measures for the third category related to air quality, environmental awareness and sustainable resource management.
For the purposes of measurement in this category, data on such partial indicators as the volume of gaseous and dust pollutant emissions from particularly burdensome plants located in the city or the percentage of residents connected to the water and sewage system were analyzed. Indicators such as the percentage of residents declaring waste segregation or the percentage of waste collected selectively in relation to total waste are also worth noting.
Due to the fact that multi-family housing prevails in the cities of the Silesian region, and the current waste segregation system does not work as it should, the measurement and analysis of this indicator may give a “green light” to the application of digital and organizational solutions by cities in order to monitor and improve segregation and predicting the amount of waste produced by residents. An interesting example in this regard is Chicago, where sensors were installed in garbage cans, and over time, a really practical analytical tool was obtained that could correctly predict the amount of garbage. As a result, the city authorities did not only optimize the routes of municipal services collecting waste but also, at the same time, it was possible to reduce the rat population by 20%. Seoul authorities also decided to use such a mechanism, thanks to which the city began to save money and became a friendlier place.
To conduct analysis in area 4, Table 5 has been prepared, showing one of the three measures in the field of “informed citizens and public and social services”.
In this category, attention is drawn to indicators such as the number of reported initiatives under the participatory budget, turnout in voting on proposals for the participatory budget, or even the number of resolutions submitted by residents.
Since the studies have not been completed yet, and for areas 5 and 6, final arrangements in working groups are still in progress, the article does not include specific indicators for these areas.
The development of these types of reports and measures aims to highlight those cities at the forefront of smart growth, but mainly to facilitate others learning from those cities that are characterized by an impressive drive to make life easier for their residents in every possible area. Comparing cities with each other and exchanging experiences and comments will contribute to their better development by implementing smart solutions, reducing errors, and optimizing costs when implementing them.
4. Results—Application of Smart City Solutions in the Context of Częstochowa
One of the associates in the Silesian Association of Communes and Districts (ŚZGiP) and cooperating in the program “Benchmarking—we are looking for the best solutions” is the city of Częstochowa. While preparing to implement smart city solutions, the city analyzed many different factors. First of all, the needs and expectations of residents, direction of the city’s development, applied solutions and technologies (functionalities and energy-saving technologies), data security and system management, implementation and operating costs have been analyzed.
The implementation of smart city solutions in Częstochowa assumes optimization of the use and development of new services on the basis of existing municipal infrastructure, both energy and telecommunications (electrical networks, fiber-optic and radio networks), and the adaptation of existing applications.
Częstochowa is a city that focuses on the future, oriented towards sustainable development and the needs of its residents. Taking the effort to gradually implement new technologies and encourage investments in advanced technologies in the city, it is a developing center among several sectors of the economy, open to innovation, attractive, and friendly to business and investors.
Figure 1 shows the identified areas (categories) in which individual implementations of smart solutions have been made.
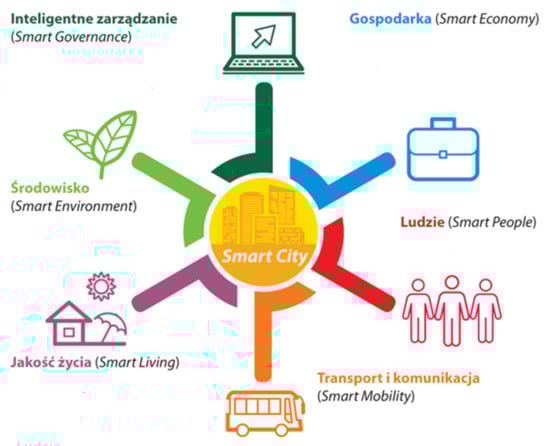
Figure 1.
Smart city area identified and implemented by the city of Częstochowa. Source: own study based on TUWIEN (Technische Universität Wien) European Smart Cities.
Częstochowa has a vision of a smart city in which various modern systems interact with each other in order to ensure the proper functioning of the urban organism and improve the quality of life of residents.
Ultimately, it is the human being that is most important. That is why many innovative projects are located in the social sphere [92].
While preparing to implement a smart city, first, it is necessary to define the most important goals that should be achieved. Therefore, the city has to:
- be oriented towards sustainable development and the needs of residents;
- be innovative and open-minded;
- use technology efficiently;
- be ecological;
- provide a convenient and effective infrastructure (traditional, information and social);
- be managed in an integrated manner.
Appendix A presents the activities that have been implemented by the City of Częstochowa in the particular areas of the smart city, as shown in Figure 1.
The city has been implementing solutions related to the smart city for many years. So far, however, it has not participated in the analysis of each area in such a detailed and extensive scope. Therefore, the authors of this study, wanting to present the essence of the action itself, and at the same time to expose the advantages and weaknesses of the proposed solution, prepared a list of indicators in relation to an exemplary selected measure, which is local transport. The summary was drawn up based on the model set of indicators described in the previous chapter.
To better illustrate the measurements made, the analysis includes indicators calculated for two cities: the City of Częstochowa and the City of Bydgoszcz (invited to the ŚZGiP program).
Table 6, for area 1, contains measures for the cities of Bydgoszcz and Częstochowa without considering the differences between these cities with regard to the number of inhabitants and the occupied area.
Table 6.
Area 1 concerning local transport, national and international accessibility, ICT infrastructure, sustainable transport system. The measure—“local transport”.
As already mentioned, the above table compares the indicators for the cities of Bydgoszcz and Częstochowa in accordance with the formula presented in the previous chapter. The only distinction is the omission of the detailed indicator for which both cities are equal to 0, or the data have not been confirmed at the moment. Therefore, the division into public transport lines, electrically assisted bicycles, bicycle parking lots, the number of parking spaces in the Park and Ride parking lots, or the indicator of transport connections for the Upper Silesian Agglomeration was not taken into account.
Comparing the first indicators concerning the application of low-emission transport by cities, the aspiration of the city of Częstochowa to be an ecological city is clearly visible. Already in June 2019, the city had almost 40% of low-emission transport in its fleet (it would also be necessary to compare the amount of total passenger transport by buses and trams in this regard. It should also be mentioned that trolleybuses were not used in both cities). While analyzing the obtained results, it can be observed that there are large differences in the indicators: concerning the number of passengers, which are four times higher in Bydgoszcz than Częstochowa, the vehicle-kilometers traveled, or the number of available city bike points and the number of bikes, of which there are nine times more in Bydgoszcz than Częstochowa. The next visible differences concern the number of road accidents and, associated with this, the number of pedestrians killed and seriously injured in road collisions. Despite twice as many road accidents in total in Bydgoszcz, the number of seriously injured people was almost three times smaller than in Częstochowa. The number of fatalities in Bydgoszcz is decreasing yearly, unlike in Częstochowa, where it has raised by about 40% compared to the previous year. This unfavorable trend was most likely due to, among others, several critical intersections and pedestrian crossings, where the most frequent accidents occurred. A significant part of them has already been rebuilt, and the lights have been installed.
It is also worth noting that, in Bydgoszcz, more than half of the traffic lights at intersections were included in ITS already in 2017 when the intelligent transport system in Częstochowa was launched in 2020. The first conclusions from its application will therefore be possible to draw in the coming years. Nevertheless, one can already benefit from the experience of other cities in order to make the most of ITS.
Presumably, already at the present stage, a detailed analysis of the differences that occurred in the analyzed cities, Bydgoszcz and Częstochowa in the transport indicators, may contribute to increasing the attractiveness of public transport over private cars. With the number of inhabitants in Bydgoszcz 50% higher, there are as many as 450% more public transport users. It should be pointed out that in both cities the number of cars per 1000 inhabitants is comparable. Additionally, while analyzing the current indicators, it is difficult to conclude whether the application of, for example, ITS (intelligent transport system) by Bydgoszcz much earlier than in Częstochowa contributed, inter alia, to shorten the travel time by public transport (using the green wave) and therefore to its attractiveness. Perhaps it will be appropriate to supplement the indicators with detailed data from this system, which may give interesting comparisons regarding their functioning in cities. One should also take into account incorrect input data or imprecise input. The quality of the research will largely depend on their proper harmonization.
However, for a better comparison of the results regarding city bikes, it would be worth developing and introducing to the set of indicators in this area a detailed indicator of their application by residents because their number alone does not provide complete information. Only their degree of exploitation, the analysis of the location of access points, or the system used to operate them (fees and incentives) can provide interesting information for usage by the city of Częstochowa and other cities.
To analyze the presented results, it would be important to develop benchmarks/comparisons in the context of the six selected areas. Determining the average values of indicators for smart cities would significantly facilitate monitoring the current development level of cities from the Silesia region in this area.
It follows from the above considerations that in the comparative analysis of cities with different areas and population sizes, for some partial indicators, to better reflect them and validate errors, it is worth considering these variables in the calculations. Based on these assumptions, Table 7 has been constructed.
Table 7.
Area 1 concerning local transport, national and international accessibility, ICT infrastructure, sustainable transport system. The measure—“local transport”—list of indicators including the variables: area and number of inhabitants.
The table above presents the modified indicators that consider the variables, such as the area occupied (in km2) and the number of inhabitants. Indicators for vehicle kilometers, number of lines, and road length were incorporated, introducing a unit per 1 km2. Also, the indicators concerning access points for city bikes and the number of accidents were modified and presented for 1000 inhabitants. As a result, indicators that can be influenced by area and population may be applied regardless of the size of the city.
The most significant difference in modifying these calculations is visible for the indicator related to access points for city bikes and the number of these bikes available to residents. While calculating the indicators without taking into account the size of the inhabitants, the difference is, respectively, 7.7 and 9.1 times greater in favor of Bydgoszcz. However, having regard to the variable concerning the size of inhabitants in the calculation, this difference decreases successively to 5 and 5.9 times. More than 50% more inhabitants live in Bydgoszcz than in Częstochowa, while the area is only 9% larger in Bydgoszcz. The small difference in the occupied area of the analyzed cities causes the size of the indicators in which this variable was taken into account to differ only slightly and have no major impact on the final result of calculations and conclusions.
Nevertheless, it is worth taking into account additional variables when comparing and measuring the development in the smart area of cities of different sizes in order to eliminate the impact of these differences on the final result. As the example above shows, these differences can be significant.
5. Discussion and Conclusions
The transformation of current cities towards a smart city has been clearly accelerating recently. It has been becoming more and more effective and brings benefits to residents. It is important to use standardized measures in this process and define what we want to achieve in the end.
Therefore, cities associated with the Silesian Association of Commune and Districts under the “Benchmarking—we are looking for the best solutions” program decided to develop and then examine six most important areas using a standardized set of measures of smart city implementation. Due to the fact that most cities in the Silesia region carry out their implementations without a detailed strategy and the possibility of benchmarking and comparing the effects of activities, this idea deserves special recognition and appreciation. Lack of such reference and comparison, and more importantly, acquiring knowledge about how to do it in the best and most efficient way, may ultimately bring much smaller benefits but will increase the costs of their operation by inappropriate optimization of the use of existing infrastructure.
Already, a dozen or so years ago, the city of Częstochowa, Poland, implemented many interesting and widely available public services that are well rated by residents (annual customer satisfaction surveys). They enable more effective service of clients in the town hall and its subordinate units. One of such services, as requested by inhabitants, is the possibility of booking a wedding date electronically or booking a specific date (day and time) to settle a particular official matter (i.e., collecting an ID card, driving license, vehicle card, etc.). For this purpose, an electronic queuing system has also been launched (allowing for a one-month reservation of a queue), which is available on the Office’s website. These solutions significantly limited “wasting” time by inhabitants (reduction of hour-long queues) and positively affected the assessment of the city’s functioning.
Moreover, services related to the provision of information from the Office’s databases on a dedicated portal, only with the goal of servicing of state institutions (ZUS, Court and Tax Office), reduced the sending of correspondence (in paper form) between them by several thousand items per year.
Thanks to the implementation of the Integrated Spatial Information System, however, investors and residents can save time to obtain the necessary maps and plans for their needs, and most importantly, they can do it at a convenient time. Noticing these advantages, the city has been encouraging to use e-services for a number of years, including by providing electronic inboxes on the ePUAP platform (Public Administration Services Platform), which during the crisis related to the pandemic and the closure of public institutions resulted in disproportionate benefits for residents (reducing the nuisance associated with it). From March 2020 to March 2021, there was a 63% [119] increase in the number of electronically handled services compared to the period before the pandemic. The residents found out that many basic matters can be settled without coming to the Office.
It is also worth emphasizing that the public institution of Częstochowa, Poland is the first city for implementing electronic document management a dozen years ago, and it is considered the seed for deploying current e-services. Apart from facilitating the management of matters, this solution has contributed to reducing the consumption of paper and toner cartridges by almost 45% [119] already in the first period from complete implementation.
Częstochowa is also known for many interesting initiatives and social activities. Thanks to the project “Professional cooperation”—paid professional internships were completed by 1000 students at 150 employers. The launched portal www.praca.czestochowa.pl has enabled the cooperation of administrative units, employers, and schools. It demonstrates the possibilities of training in professions sought on the labor market, suggests new profiles in the offer of vocational schools, and inspires people to find a better job in the city. On the other hand, thanks to the “Competence Development Academy” project, several hundred people could raise their qualifications in specialties sought after on the local labor market. Częstochowa has become the undisputed leader of the social economy and professional activation in the region. Due to the use of social clauses in tenders, since 2013, approx. 700 people have found employment. By establishing the Civic Activity Center, it has become possible to offer full support in one place from the instant capability of using the bathhouse, receiving clothes, meals, and assistance in producing documents through long-term support, social work, and activation aimed at independence and overcoming problems. The outcome of all these activities in several identified areas was, recorded at the end of January 2020, one of the lowest regional unemployment rates [120].
5.1. Practical and Theoretical Implications
In order to achieve indicators allowing to define a given city as smart, local authorities should implement a specific management policy. Contemporary cities face the challenge of defining directions of development and rules that should be followed in decision-making processes related to their functioning. In a smart city, well-thought-out activities are implemented, and the city authorities flexibly react to any changes in the environment and new challenges.
Cities around the world have recently experienced a pandemic crisis. Calls related to the restriction of movement, closure of offices, and suspension of public transport contributed to the implementation of solutions facilitating the functioning of residents. In many cases, these solutions meet the criterion of building a smart city. Some of them will probably stay with us for longer, maybe even permanently.
A similar situation has also occurred in the case of the city of Częstochowa. Because the city has been implementing for several years a variety of solutions to facilitate the settling of matters by its inhabitants, it has contributed to the more efficient adaptation of the city to the prevailing conditions.
This study contributes to the literature in presenting a model set of indicators and identifying the degree of smart city implementation in the cities of the Silesian region in Poland. Most existing studies refer to large cities and are based on previously mentioned methodologies of measuring the smartness of cities in order to determine their position in the ranking (see for example [24,67,72,121]). This research concerns cities with county rights (small and medium-sized) located in the Silesia region and other Polish cities. The criterion for selecting a city for the present study does not depend on the number of inhabitants of a given city or the existence of, for instance, universities or scientific institutes. It is essential because not only large cities with thriving research and scientific-academic units can be smart and should be subjected to various analyses and rankings. Contrary to prior investigations, more detailed indicators have been prepared and presented in the study, which are being used not only for the positioning (ranking) of a given city in terms of the smart solutions applied, but mainly for the purpose of analyzing the effectiveness and efficiency of their implementations and promoting good practices between the cities concerned. This research will serve to better identify cities, their directions, and sustainable development as well as support the implementation of the strategic goals of the region. In addition, all indicators will be based on uniform data obtained or collected in an agreed manner, which will significantly reduce errors in the final calculations.
The presented comments and conclusions fill the identified research gap. The findings made as a result of the research are, in the opinion of the authors, significant and useful, not only for the practice of implementing smart cities but also for theory. They point out that even though the smart city itself is very popular in the literature on the subject, the degree of its application and the method of its measurement in Poland is still ineffective. Consequently, it is worth promoting the suitability of model indicators for improving the management of contemporary cities. This study can be a useful aid for cities that are focused on the quality and effectiveness of implemented smart solutions.
As the basic obstacles to faster implementation and development of the smart city in Polish cities can be indicated time-consuming, labor intensity, the lack of detailed models for measurement, planning, efficiency control and cost analysis, low level of employee qualifications, and the lack of financial resources and city debt. Moreover, a considerable barrier is the lack of interest of the managerial staff in implementing new and unknown solutions.
With the purpose of a more detailed analysis of smart cities and the application of information by cities, case studies from other cities should be used more widely. This method would allow a detailed look at how solutions were implemented in a particular city, how they function and how they are used, and finally, how and whether they are modified. From the point of view of scientific research, it may be curious to analyze the effectiveness and quality of smart implementations by individual cities by questioning:
- What factors implement the same or similar solutions produce significantly different results?
- How do the inhabitants perceive such actions, and how do the authorities of these cities deal with their persuasion? The experience of, among others, the city of Częstochowa, shows that the implementation of new solutions that directly concern the residents is not always associated with their acceptance and may generate large conflicts—despite the fact that later it is perceived very positively (an example may be the implementation of an electronic monthly ticket and resignation from its paper version).
- How do cities approach their smart activities? Are they more related to “fashion and the willingness to climb” only in the rankings, or are they strictly focused on solving the real problems of the inhabitants and improving the functioning of the city?
Based on this group, it is possible to examine the reasons for abandoning the implementation of some smart city solutions.
5.2. Research Limitations
While preparing this type of program, as presented in this article, attention should be paid to the large diversity of cities in the Silesia region participating in the investigation. The differentiation concerns the size of the area, population density, level of industrialization, the type and structure of this industry, striving for development in the area of smart city, as well as tasks that must be implemented in order for cities to achieve the goals set in their strategies. In such a situation, it is advisable to adopt uniform areas to achieve coherent and comparable measures based on which the directions of future activities will be determined.
However, the described diversity of the cities implies, at the stage of consulting common indicators, numerous ambiguities, and doubts, for instance, regarding environmental issues. Admittedly, in the region of Silesia, there are cities in which no plants with particular nuisance exist; however, such plants are located right next door in a neighboring town. The short distance and unfavorable wind pattern cause their constant pollution. Such cities have a negligible, direct impact on the change of the main indicator in the area of the environment, which in turn (apart from the low score in this category) directly contributes to the reduction in their attractiveness for living. There are some doubts in each area, e.g., in the field of local transport. Due to the fact that cities create joint public transport in the Upper Silesian Agglomeration, the measurement indicators for individual cities included in it will be averaged and unreal. In this case, the agglomeration was assumed as a whole for this measure. A similar approach should be applicable to the previously described situation related to the indicators of gaseous and dust pollutants [122].
In addition, separating indicators to application in the division into obligatory and optional will have positive effects and at the same time will not cause that some cities from the region will not take part in the study or their results will be incomparable.
5.3. Future Research Directions
In the near future, it will probably be revealed whether the implementation of a given measure in the model set of indicators was right or not. As cities begin the testing phase, preparing reports and comparing the first results on a larger scale, the indicators may be adjusted. Such action will be the most appropriate direction.
The comparative list of indicators for the measure, local transport for the cities of Częstochowa and Bydgoszcz, prepared by the authors, on the basis of a model set of indicators, will allow illustrating the essence of the prepared program on a much larger scale, and at the same time to reveal the advantages and possible weaknesses of the solution, which, together with the experience gained in this regard, will be leveled.
Author Contributions
Conceptualization, R.B. and M.B.; methodology, R.B. and M.B.; writing—original draft preparation, R.B. and M.B.; introduction, R.B.; literature review, R.B.; materials, methods, and results, R.B. and M.B.; discussion and conclusions, R.B. and M.B. Both authors have read and agreed to the published version of the manuscript.
Funding
This research received no external funding.
Institutional Review Board Statement
Not applicable.
Informed Consent Statement
Not applicable.
Data Availability Statement
Not applicable.
Acknowledgments
The authors are grateful to the anonymous referees of the journal for their extremely useful suggestions to improve the quality of the paper. The authors are also very grateful to Editor-in-Chief, Managing Editor, and the MDPI editorial team members for their support.
Conflicts of Interest
The authors declare no conflict of interest.
Appendix A
Table A1.
Implementation of activities by the City of Częstochowa related to the areas of smart city.
Table A1.
Implementation of activities by the City of Częstochowa related to the areas of smart city.
| Smart City Implementation Areas | Implementation of Activities by the City of Częstochowa Influencing the Development in the Area of Smart City |
|---|---|
| The first area of Smart Economy implementation |
|
| The second area of Smart People implementation |
|
| The third area of Smart Mobility implementation |
|
| The fourth area of Smart Living implementation |
|
| The fifth area of Smart Environment implementation |
|
| The sixth area of Smart Governance implementation |
|
Source: own study based on data obtained from the City of Częstochowa.
References
- Bibri, S.E.; Krogstie, J. Smart sustainable cities of the future: An extensive interdisciplinary literature review. Sustain. Cities Soc. 2017, 31, 183–212. [Google Scholar] [CrossRef]
- Neirotti, P.; De Marco, A.; Cagliano, A.; Mangano, G.; Scorrano, F. Current trends in Smart city initiatives: Some stylised facts. Cities 2014, 38, 25–36. [Google Scholar] [CrossRef]
- Frick, S.A.; Rodríguez-Pose, A. Average city size and economic growth. Camb. J. Reg. Econ. Soc. 2016, 9, 301–318. [Google Scholar] [CrossRef]
- European Parliament. Mapping Smart Cities in the EU, Directorate General for Internal Policies, Policy Department A: Economic and Scientific Policy, IP/A/ITRE/ST/2013-02, PE 507.480; European Parliament: Brussels, Belgium, January 2014; pp. 21–26. Available online: http://www.europarl.europa.eu/studies (accessed on 6 June 2021).
- Giffinger, R.; Fertner, C.; Kramar, H.; Kalasek, R.; Meijers, E.; Pichler-Milanovi, N. Smart Cities: Ranking of European Medium-sized Cities; Centre of Regional Science, University of Technology: Vienna, Austria, 2007. Available online: http://www.smart-cities.eu/download/smart_cities_final_report.pdf (accessed on 12 May 2021).
- Ramaprasad, A.; Sánchez-Ortiz, A.; Syn, T. A unified definition of a smart city. In EGOV 2017; LNCS 10428; Janssen, M., Axelsson, K., Glassey, O., Klievink, B., Krimmer, R., Lindgren, I., Parycek, P., Scholl, H.J., Trutnev, D., Eds.; Springer International Publishing: Cham, Switzerland, 2017; pp. 13–24. [Google Scholar] [CrossRef]
- Albino, V.; Berardi, U.; Dangelico, R.M. Smart cities: Definitions, dimensions, performance, and initiatives. J. Urban Technol. 2015, 22, 3–21. [Google Scholar] [CrossRef]
- Anthopoulos, L.G. Understanding the smart city domain: A literature review. In Transforming City Governments for Successful Smart Cities, Public Administration and Information Technology; Rodríguez-Bolívar, M.P., Ed.; Springer International Publishing: Cham, Switzerland, 2015. [Google Scholar] [CrossRef]
- Gill-Garcia, J.R.; Pardo, T.A.; Nam, T. What makes a city smart? Identifying core components and proposing an integrative and comprehensive conceptualization. Inf. Polity 2015, 20, 61–87. [Google Scholar] [CrossRef]
- Chourabi, H.; Nam, T.; Walker, S.; Gil-Garcia, J.R.; Mellouli, S.; Nahon, K.; Pardo, T.A.; Scholl, H.J. Understanding smart cities: An integrative framework. In Proceedings of the 45th Hawaii International Conference on System Sciences, Maui, HI, USA, 4–7 January 2012; pp. 2289–2297. [Google Scholar] [CrossRef]
- Chatterjee, S.; Kar, A.K. Smart Cities in developing economies: A literature review and policy insights. In Proceedings of the International Conference on Advances in Computing, Communications and Informatics (ICACCI), Kochi, India, 10–13 August 2015; pp. 2335–2340. [Google Scholar] [CrossRef]
- Sinkiene, J.; Grumadaite, K.; Liugailaite-Radzvickiene, L. Diveristy of theoretical approaches to the concept of smart city. In Proceedings of the 8th International Scientific Conference “Business and Management 2014”, Vilnius, Lithuania, 15–16 May 2014. [Google Scholar] [CrossRef]
- Kobayashi Kaneko, A.R.; Kniess, C.T.; Ribeiro Serra, F.A.; Nogueira Ferraz, R.R.; Ruiz, M.S. Smart sustainable cities: Bibliometric study and patent information. Int. J. Innov. 2017, 5, 77–96. [Google Scholar] [CrossRef]
- Sharifi, A.; Allam, Z.; Feizizadeh, B.; Ghamari, H. Three decades of research on smart cities: Mapping knowledge structure and trends. Sustainability 2021, 13, 7140. [Google Scholar] [CrossRef]
- Mora, L.; Bolici, R.; Deakin, M. The first two decades of smart-city research: A bibliometric analysis. J. Urban Technol. 2017, 24, 3–27. [Google Scholar] [CrossRef]
- Ismagilova, E.; Hughes, L.; Dwivedi Yogesh, K.; Raman, K. Ravi, Smart cities: Advances in research-An information systems perspective. Int. J. Inf. Manag. 2019, 47, 88–100. [Google Scholar] [CrossRef]
- De Santis, R.; Fasano, A.; Mignolli, N.; Villa, A. Smart City: Fact and Fiction. MPRA. 2014. Available online: https://mpra.ub.uni-muenchen.de/54536/1/MPRA_paper_54536.pdf (accessed on 6 June 2021).
- Hollands, R. Critical interventions into the corporate smart city. Camb. J. Reg. Econ. Soc. 2015, 8, 61–77. [Google Scholar] [CrossRef]
- Focus Group on Smart Sustainable Cities ITU-T (International Telecommunication Union). Smart Sustainable Cities: An Analysis of Definitions. In Focus Group Technical Report. 2014. Available online: https://www.itu.int (accessed on 1 June 2021).
- Azkuna, I. Smart Cities Study. International Study on the Situation of ICT, Innovation and Knowledge in Cities; The Committee of Digital and Knowledge-based Cities of UCLG: Bilbao, Spain, 2012; Available online: https://www.uclg.org/en/media/news/smart-cities-study-situation-ict-innovation-and-knowledge-cities (accessed on 1 June 2021).
- Aburto, J.M. Smart Cities Study 2017. International Study on the Situation of ICT, Innovation and Knowledge in Cities; The Committee of Digital and Knowledge-Based Cities of UCLG: Bilbao, Spain, 2017; p. 12. Available online: https://issuu.com/uclgcglu/docs/smart_cities_2017_en (accessed on 6 June 2021).
- Ibrahim, M.; El-Zaart, A.; Adams, C. Smart sustainable cities roadmap: Readiness for transformation towards urban sustainability. Sustain. Cities Soc. 2018, 37, 530–540. [Google Scholar] [CrossRef]
- Dameri, R.P. Smart City Implementation. Creating Economic and Public Value in Innovative Urban Systems; Springer International Publishing: Cham, Switzerland, 2017. [Google Scholar] [CrossRef]
- Sikora-Fernandez, D. Smarter cities in post-socialist country: Example of Poland. Cities 2018, 78, 52–59. [Google Scholar] [CrossRef]
- Yigitcanlar, T.; Kamruzzaman, M.; Buys, L.; Ioppolo, G.; Sabatini-Marques, J.; Costa, E.; Yun, J.J. Understanding ‘smart cities’: Intertwining development drivers with desired outcomes in a multidimensional framework. Cities 2018, 81, 145–160. [Google Scholar] [CrossRef]
- Yigitcanlar, T.; Kamruzzaman, M.; Foth, M.; Sabatini-Marques, J.; da Costa, E.; Ioppolo, G. Can cities become smart without being sustainable? A systematic review of the literature. Sustain. Cities Soc. 2019, 45, 348–365. [Google Scholar] [CrossRef]
- Ahvenniemi, H.; Houvila, A.; Pinto-Seppӓ, I.; Airaksinen, M. What are the differences between sustainable and smart cities? Cities 2017, 60, 234–245. [Google Scholar] [CrossRef]
- Hajduk, S. Modele smart city a zarządzanie przestrzenne miast. Gospod. Nar. Pol. J. Econ. 2020, 2, 123–139. [Google Scholar] [CrossRef]
- Ishida, T. Digital City, Smart City and Beyond. In Proceedings of the International World Wide Web Conference, Smart City Workshop (AW4City), Perth, Australia, 3 April 2017. [Google Scholar]
- Nam, T.; Pardo, T.A. Conceptualizing Smart City With Dimensions of Technology, People, and Institutions. In Proceedings of the 12th Annual International Digital Government Research Conference: Digital Government Innovation in Challenging Times, College Park, MD, USA, 12–15 June 2011; ACM: New York, NY, USA, 2011. Available online: https://inta-aivn.org/images/cc/Urbanism/background%20documents/dgo_2011_smartcity.pdf (accessed on 6 June 2021).
- Duran-Sanchez, A.; Rio-Rama, M.C.; Sereno-Ramirez, A.; Bredis, K. Sustainability and quality of life in smart cities: Analysis of scientific production. In Sustainable Smart Cities. Creating Spaces for Technological, Social and Business Development; Peris-Ortiz, M., Bennett, D.R., Perez-Bustamante Yaba, D., Eds.; Springer: Berlin/Heidelberg, Germany, 2016; pp. 159–181. [Google Scholar] [CrossRef]
- Veselitskaya, N.; Karasev, O.; Beloshitskiy, A. Drivers and barriers for smart cities development. Theor. Empir. Res. Urban Manag. 2019, 14, 85–110. [Google Scholar]
- Thompson, E.M. What makes a city smart? Int. J. Archit. Comput. 2016, 14, 358–371. [Google Scholar] [CrossRef]
- Yovanof, G.S.; Hazapis, G.N. An architectural framework and enabling wireless technologies for digital cities & intelligent urban environments. Wirel. Pers. Commun. 2009, 49, 445–463. [Google Scholar] [CrossRef]
- Shaping Europe’s Digital Future, Communication from the Commission to the European Parliament, the Council, the European Economic and Social Committee and the Committee of the Regions, Brussels, 19 February 2020 COM(2020) 67 Final. Available online: https://ec.europa.eu/info/sites/default/files/communication-shaping-europes-digital-future-feb2020_en_3.pdf (accessed on 1 June 2021).
- Cocchia, A. Smart and digital city: A Systematic literature review. In Smart City: How to Create Public and Economic Value with High Technology in Urban Space; Dameri, R.P., Rosenthal-Sabroux, C., Eds.; Springer: Cham, Switzerland, 2014; pp. 13–43. [Google Scholar] [CrossRef]
- Hall, P. Creative cities and economic development. Urban Stud. 2000, 37, 639–649. [Google Scholar] [CrossRef]
- Florida, R. The Rise of the Creative Class: And How It’s Transforming Work, Leisure, Community, and Everyday Life, 2019 ed.; Basic Books: New York, NY, USA, 2002. [Google Scholar] [CrossRef]
- Carrillo, F.J. Capital cities: A taxonomy of capital accounts for knowledge cities. J. Knowl. Manag. 2004, 8, 28–46. [Google Scholar] [CrossRef]
- Harrison, C.; Eckman, B.; Hamilton, R.; Hartswick, P.; Kalagnanam, J.; Paraszczak, J.; Williams, P. Foundations for smarter cities. IBM J. Res. Dev. 2010, 54, 1–16. [Google Scholar] [CrossRef]
- Sairamesh, J.; Lee, A.; Anania, L. Information cities. Commun. ACM 2004, 47, 28–31. [Google Scholar] [CrossRef]
- Sproull, L.; Patterson, J.F. Making information cities livable. Commun. ACM 2004, 47, 33–37. [Google Scholar] [CrossRef]
- Zygiaris, S. Smart city reference model: Assisting planners to conceptualize the building of smart city innovation ecosystems. J. Knowl. Econ. 2013, 4, 217–231. [Google Scholar] [CrossRef]
- Beretta, I. The social effects of eco-innovations in Italian smart cities. Cities 2018, 72, 115–121. [Google Scholar] [CrossRef]
- Campbell, T. Learning cities: Knowledge, capacity and competitiveness. Habitat Int. 2009, 33, 195–201. [Google Scholar] [CrossRef]
- Plumb, D.; Leverman, A.; McGray, R. The learning city in a ‘planet of slums’. Stud. Contin. Educ. 2007, 29, 37–50. [Google Scholar] [CrossRef]
- Washburn, D.; Sindhu, U. ‘Helping CIOs Understand “Smart City” Initiatives’, Growth. Forrester Making Leaders Successful Every Day, February 2010. Available online: https://s3-us-west-2.amazonaws.com/itworldcanada/archive/Themes/Hubs/Brainstorm/forrester_help_cios_smart_city.pdf (accessed on 30 April 2021).
- Lazaroiu, G.C.; Roscia, M. Definition methodology for the smart cities model. Energy 2012, 47, 326–332. [Google Scholar] [CrossRef]
- Lombardi, P.; Giordano, S.; Farouh, H.; Yousef, W. Modelling the smart city performance. Innov. Eur. J. Soc. Sci. Res. 2012, 25, 137–149. [Google Scholar] [CrossRef]
- Lee, J.H.; Hancock, M.G.; Hu, M.C. Towards an effective framework for building smart cities: Lessons from Seoul and San Francisco. Technol. Forecast. Soc. Chang. 2014, 89, 80–99. [Google Scholar] [CrossRef]
- Caragliu, A.; Bo Del, C.; Nijkamp, P. Smart cities in Europe. J. Urban Technol. 2011, 18, 65–82. [Google Scholar] [CrossRef]
- Höjer, M.; Wangel, S. Smart sustainable cities: Definition and challenges. In ICT Innovations for Sustainability; Hilty, L., Aebischer, B., Eds.; Springer: Berlin/Heidelberg, Germany, 2015; pp. 333–349. [Google Scholar] [CrossRef]
- Kramers, A.; Wangel, J.; Höjer, M. Governing the smart sustainable city: The case of the Stockholm Royal Seaport. In Proceedings of ICT for Sustainability; Atlantis Press: Amsterdam, The Netherlands, 2016; Volume 46, pp. 99–108. [Google Scholar] [CrossRef]
- Rivera, M.B.; Erik sson, E.; Wangel, J. ICT practices in smart sustainable cities—In the intersection of technological solutions and practices of everyday life. In Proceedings of the 29th International Conference on Informatics for Environmental Protection (EnviroInfo 2015), Third International Conference on ICT for Sustainability (ICT4S 2015). Copenhagen, Denmark, 7–9 September 2015; Atlantis Press: Dordrecht, The Netherlands, 2015; pp. 317–324. [Google Scholar] [CrossRef]
- Bifulco, F.; Tregua, M.; Amitrano, C.C.; D’Auria, A. ICT and sustainability in smart cities management. Int. J. Public Sect. Manag. 2016, 29, 132–147. [Google Scholar] [CrossRef]
- Huston, S.; Rahimzad, R.; Parsa, A. ‘Smart’ sustainable urban regeneration: Institutions, quality and financial innovation. Cities 2015, 48, 66–75. [Google Scholar] [CrossRef]
- Schipper, R.P.J.R.; Silvius, A.J.G. Characteristics of small sustainable city development: Implications for Project management. Smart Cities 2018, 1, 75–97. [Google Scholar] [CrossRef]
- Why Smart Cities? European Smart Cities 4.0. 2015. Available online: http://www.smart-cities.eu/?cid=01&ver=4 (accessed on 6 June 2021).
- Min, K.; Yoon, M.; Furuya, K. A comparison of a smart city’s trends in urban planning before and after 2016 through keyword network analysis. Sustainability 2019, 11, 3155. [Google Scholar] [CrossRef]
- Sikora-Fernandez, D. Smart city jako nowa koncepcja funkcjonowania i rozwoju miast w Polsce. Pr. Nauk. Uniw. Wrocławskiego 2014, 339, 175–181. [Google Scholar] [CrossRef]
- Morelli, V.G.; Weijnen, M.; Van Bueren, E.; Wenzler, I.; De Reuver, M.; Salvati, L. Towards intelligently-sustainable cities. TeMA J. Land Use Mobil. Environ. 2013, 6, 73–86. [Google Scholar] [CrossRef]
- Battarra, R.; Pinto, F.; Tremiterra, M.R. Indicators and Actions for the Smart and Sustainable City: A Study on Italian Metropolitan Cities. In Smart Planning: Sustainability and Mobility in the Age of Change. Green Energy and Technology; Papa, R., Fistola, R., Gargiulo, C., Eds.; Springer: Cham, Switzerland, 2018; pp. 83–107. [Google Scholar] [CrossRef]
- ISO 37122:2019, Sustainable Cities and Communities—Indicator for Smart Cities. Available online: https://www.iso.org/standard/69050.html (accessed on 10 April 2021).
- Simonofski, A.; Van Den Storme, S.; Meers, H. Towards a Holistic Evaluation of Citizen Participation in Smart Cities. In Proceedings of the 21st Annual International Conference on Digital Government Research, Seoul, Korea, 17–19 June 2020; pp. 82–89. [Google Scholar] [CrossRef]
- Vanolo, A. Is there anybody out there? The place and role of citizens in tomorrow’s smart cities. Futures 2016, 82, 26–36. [Google Scholar] [CrossRef]
- Cardullo, P.; Kitchin, R. Being a ‘citizen’ in the smart city: Up and down the scaffold of smart citizen participation in Dublin, Ireland. GeoJournal 2019, 84, 1–13. [Google Scholar] [CrossRef]
- Kuźniar, W. The image of a smart city in the context of its impact on the residents. Zesz. Nauk. Organ. Zarządzanie Politech. Śląska 2019, 139, 257–265. [Google Scholar] [CrossRef]
- Dameri, R.P.; Negre, E.; Rosenthal-Sabroux, C. Triple helix in smart cities: A literature review about the vision of public bodies, universities, and private companies. In Proceedings of the 49th Hawaii International Conference on System Sciences (HICSS), Koloa, HI, USA, 5–8 January 2016; pp. 2974–2982. [Google Scholar] [CrossRef]
- Shapiro, J.M. Smart cities: Quality of life, productivity, and the growth effects of human capital. Rev. Econ. Stat. 2006, 88, 324–335. [Google Scholar] [CrossRef]
- Hollands, R.G. Will the real smart city please stand up? City 2008, 12, 303–320. [Google Scholar] [CrossRef]
- Winters, J.V. Why are smart cities growing? Who moves and Sho stays. J. Reg. Sci. 2011, 51, 253–270. [Google Scholar] [CrossRef]
- Pichlak, M. Inteligentne miasta w Polsce—Rzeczywistość czy utopia? Zesz. Nauk. Politech. Śląskiej Ser. Organ. Zarządzanie 2018, 127, 191–206. [Google Scholar] [CrossRef]
- Russo, F.; Rindone, C.; Panuccio, P. European plans for the smart city: From theories and rules to logistics test case. Eur. Plan. Stud. 2016, 24, 1709–1726. [Google Scholar] [CrossRef]
- Allahar, H. What are the challenges of building a Smart city? Technol. Innov. Manag. Rev. 2020, 10, 38–48. [Google Scholar] [CrossRef]
- Smart Cities Council. Available online: https://smartcitiescouncil.com/article/about-us-global (accessed on 10 May 2021).
- European Commission. What Are Smart Cities? Available online: https://ec.europa.eu/info/eu-regional-and-urban-development/topics/cities-and-urban-development/city-initiatives/smart-cities_en (accessed on 10 May 2021).
- Noori, N.; Hoppe, T.; de Jong, M. Classifying pathways for smart city development: Comparing design, governance and implementation in Amsterdam, Barcelona, Dubai, and Abu Dhabi. Sustainability 2020, 12, 4030. [Google Scholar] [CrossRef]
- Appio, F.P.; Lima, M.; Paroutis, S. Understanding smart cities: Innovation ecosystems, technological advancements, and societal challenges. Technol. Forecast. Soc. Chang. 2019, 142, 1–14. [Google Scholar] [CrossRef]
- Ferrara, R. The smart city and the green economy in Europe: A critical approach. Energies 2015, 8, 4724–4734. [Google Scholar] [CrossRef]
- European Commission. Integrated Sustainable Urban Development, Cohesion Policy 2014–2020; European Commission: Brussels, Belgium, 2012; Available online: https://ec.europa.eu/regional_policy/sources/docgener/informat/2014/urban_en.pdf (accessed on 10 May 2021).
- Badii, C.; Bellini, P.; Cenni, D.; Difino, A.; Nesi, P.; Paolucci, M. Analysis and assessment of a knowledge based smart city architecture providing service APIs. Future Gener. Comput. Syst. 2017, 75, 14–29. [Google Scholar] [CrossRef]
- Kola-Bezka, M.; Czupich, M.; Ignasiak-Szulc, A. Smart cities in Central and Eastern Europe: Viable future or unfulfilled dream. J. Int. Stud. 2016, 9, 76–87. [Google Scholar] [CrossRef]
- Meijer, A.; Bolivar, M.P.R. Governing the Smart city: A review of the literature on smart urban governance. Int. Rev. Adm. Sci. 2016, 82, 392–408. [Google Scholar] [CrossRef]
- Murray, A.; Minevich, M.; Abdoullaev, A. The Future of the Future: Being Smart about Smart Cities. KMWorld. 2011. Available online: https://www.kmworld.com/Articles/Column/The-Future-of-the-Future/The-Future-of-the-Future-Being-smart-about-smart-cities-77848.aspx (accessed on 10 May 2021).
- European Commission. Communication from the Commission. In Smart Cities and Communities—European Innovation Partnership; European Commission: Brussels, Belgium, 2012; Available online: https://ec.europa.eu/digital-single-market/en/news/smart-cities-and-communities-european-innovation-partnership-communication-commission-c2012 (accessed on 10 May 2021).
- Revising Europe’s ICT Strategy, Report from the Information Society Technologies Advisory Group (ISTAG). 2009. Available online: https://ec.europa.eu/eurostat/cros/system/files/16_Revising%20Europes%20ICT-strategy.pdf (accessed on 10 May 2021).
- Strategic Energy Technologies Information System. Available online: https://ec.europa.eu/jrc/sites/default/files/jrc_setis_en.pdf (accessed on 10 May 2021).
- Hajduk, S.; Jelonek, D.A. Decision-making approach based on TOPSIS method for ranking smart cities in the context of urban energy. Energies 2021, 14, 2691. [Google Scholar] [CrossRef]
- Schaffers, H.; Komninos, N.; Pallot, M.; Trousse, B.; Nilsson, M.; Oliveira, A. Smart cities and the future internet: Towards cooperation frameworks for open innovation. In The Future Internet. FIA 2011; Lecture Notes in Computer Science Series; LNCS 6656; Domingue, J., Galis, A., Gavras, A., Zahariadis, T., Lambert, D., Cleary, F., Daras, P., Krco, S., Müller, H., Li, M.-S., et al., Eds.; Springer: Berlin/Heidelberg, Germany, 2011. [Google Scholar] [CrossRef]
- Abella, A.; Ortiz-de-Urbina-Criado, M.; De-Pablos-Heredero, C. A model for the analysis of data-driven innovation and value generation in smart cities’ ecosystems. Cities 2017, 64, 47–53. [Google Scholar] [CrossRef]
- Kramers, A.; Höjer, M.; Lövehagen, N.; Wangel, J. Smart sustainable cities-Exploring ICT solutions for reduced energy use in cities. Environ. Model. Softw. 2014, 56, 52–62. [Google Scholar] [CrossRef]
- Jelonek, D.; Turek, T.; Stępniak, C. Prosumpcja w regionalnych społecznościach elektronicznych dla potrzeb przedsięwzięć miejskich. Stud. Ekon. 2015, 243, 151–164. [Google Scholar]
- Silva, B.N.; Khan, M.; Han, K. Towards sustainable smart cities: A review of trends, architectures, components, and open challenges in smart cities. Sustain. Cities Soc. 2018, 38, 697–713. [Google Scholar] [CrossRef]
- Ferreira, D.; Vale, M.; Carmo, R.M.; Encalada-Abarca, L.; Marcolin, C. The three levels of the urban digital divide: Bridging issues of coverage, usage and its outcomes in VGI platforms. Geoforum 2021, 124, 195–206. [Google Scholar] [CrossRef]
- Reggi, L.; Gil-Garcia, J.R. Addressing territorial digital divides through ICT strategies: Are investment decisions consistent with local needs? Gov. Inf. Q. 2021, 38, 101562. [Google Scholar] [CrossRef]
- Ragnedda, M. The Third Digital Divide. A Weberian Approach to Digital Inequalities; Routledge: London, UK; New York, NY, USA, 2017. [Google Scholar]
- Van Deursen, A.; Van Dijk, J. The first-level digital divide shifts from inequalities in physical access to inequalities in material access. New Media Soc. 2019, 21, 354–375. [Google Scholar] [CrossRef]
- Van Deursen, A.; Van Dijk, J. The digital divide shifts to differences in usage. New Media Soc. 2014, 16, 507–526. [Google Scholar] [CrossRef]
- Van Deursen, A.; Mossberger, K. Any thing for anyone? A new digital divide in internet-of-things skills. Policy Internet 2018, 10, 122–140. [Google Scholar] [CrossRef]
- Scheerder, A.; Van Deursen, A.; Van Dijk, J. Determinants of Internet skills, uses and outcomes. A systematic review of the second-and third-level digital divide. Telemat. Inform. 2017, 34, 1607–1624. [Google Scholar] [CrossRef]
- Lutz, C. Digital inequalities in the age of artificial intelligence and big data. Hum. Behav. Emerg. Technol. 2019, 1, 141–148. [Google Scholar] [CrossRef]
- Helsper, E.J.; van Deursen, A.J.A.M. Do the rich get digitally richer? Quantity and quality of support for digital engagement. Inf. Commun. Soc. 2017, 20, 700–714. [Google Scholar] [CrossRef]
- Roberts, E.; Beel, D.; Philip, L.; Townsend, L. Rural resilience in a digital society. J. Rural Stud. 2017, 54, 355–359. [Google Scholar] [CrossRef]
- Roberts, E.; Anderson, B.A.; Skerratt, S.; Farrington, J. A review of the rural-digital policy agenda from a community resilience perspective. J. Rural Stud. 2017, 54, 372–385. [Google Scholar] [CrossRef]
- Friemel, T.N. The digital divide has grown old: Determinants of a digital divide among seniors. New Media Soc. 2016, 18, 313–331. [Google Scholar] [CrossRef]
- Reneland-Forsman, L. ‘Borrowed access’—The struggle of older persons for digital participation. Int. J. Lifelong Educ. 2018, 37, 333–344. [Google Scholar] [CrossRef]
- Jankowska, M. Smart city jako koncepcja zrównoważonego rozwoju miasta—Przykład Wiednia. Stud. Pr. Wydziału Nauk Ekon. Zarządzania Uniw. Szczecińskiego 2015, 42, 173–182. [Google Scholar] [CrossRef][Green Version]
- Zakrzewska-Półtorak, A. Inteligentne miasto katalizatorem rozwoju regionu? Pr. Nauk. Uniw. Ekon. We Wrocławiu 2016, 443, 282–291. [Google Scholar] [CrossRef][Green Version]
- Komninos, N.; Sefertzi, E. Intelligent Cities: R&D Offshoring, Web 2.0 Product Development and Globalization of Innovation Systems. In Proceedings of the Second Knowledge Cities Summit, Shenzhen, China, 5–6 November 2009; pp. 1–8. Available online: https://www.researchgate.net/publication/253386773_Intelligent_Cities_RD_offshoring_web_20_product_development_and_globalization_of_innovation_systems (accessed on 10 May 2021).
- TUWIEN (Technische Universität Wien). European Smart Cities 1.0, 2.0, 3.0, 4.0 (2007, 2013, 2014, 2015). Available online: http://www.smart-cities.eu (accessed on 10 May 2021).
- IESE Cities in Motion Index. 2020. Available online: https://media.iese.edu/research/pdfs/ST-0542-E.pdf (accessed on 20 May 2021).
- Hajduk, S. The smartness profile of selected European cities in urban management—A comparison analysis. J. Bus. Econ. Manag. 2018, 19, 797–812. [Google Scholar] [CrossRef]
- Caird, S. City approaches to smart city evaluation and reporting: Case studies in the United Kingdom. Urban Res. Pract. 2018, 11, 159–179. [Google Scholar] [CrossRef]
- Lynch, M. Standardized Indicators for Resilient Cities: ISO 37120 & The World Council on City Data. 2015. Available online: http://resilientcities2015.iclei.org/fileadmin/RC2015/files/pptx/Opening_Plenary_Lynch.pdf (accessed on 1 June 2021).
- McCarney, P. The evolution of global city indicators and ISO 37120: The first international standard on city indicators. Stat. J. IAOS 2015, 31, 103–110. [Google Scholar] [CrossRef]
- Marsal-Llacuna, M.L. Building universal socio-cultural indicators for standardizing the safeguarding of citizens’ rights in smart cities. Soc. Indic. Res. 2015, 130, 563–579. [Google Scholar] [CrossRef]
- Holman, N. Incorporating local sustainability indicators into structures of local governance: A review of the literature. Local Environ. 2009, 14, 365–375. [Google Scholar] [CrossRef]
- Europe Prize. Available online: https://www.czestochowa.pl/nagroda-europy (accessed on 2 June 2021).
- WIOŚ. Program Ochrony Powietrza dla Stref Województwa Śląskiego, w Których Stwierdzone Zostały Ponadnormatywne Poziomy Substancji w Powietrzu. Aglomeracja Górnośląska. Wyniki Pomiarów Stężeń Benzopirenu w Aglomeracji Górnośląskiej w Latach 2005–2007; WIOŚ: Katowice, Poland, 2014. [Google Scholar]
- National Census of Population and Housing. Available online: https://katowice.stat.gov.pl (accessed on 5 June 2021).
- Sobol, A. Inteligentne miasta versus zrównoważone miasta. Stud. Ekon. Zesz. Nauk. Uniw. Ekon. w Katowicach 2017, 320, 75–86. [Google Scholar]
- Województwo Śląskie. Załącznik do Uchwały nr VI/24/1/2020 Sejmiku Województwa Śląskiego z Dnia 19 Październik 2020. In Strategia Rozwoju Województwa Śląskiego “Śląskie 2030”; Województwo Śląskie: Katowice, Poland, 2020. [Google Scholar]
- Częstochowa is an Unexpected Winner of the "Forbes" Ranking. Available online: https://www.forbes.pl/gospodarka/ranking-forbesa-najbardziej-innowacyjne-miasta-w-polsce/we22dl4 (accessed on 12 May 2021).
Publisher’s Note: MDPI stays neutral with regard to jurisdictional claims in published maps and institutional affiliations. |
© 2021 by the authors. Licensee MDPI, Basel, Switzerland. This article is an open access article distributed under the terms and conditions of the Creative Commons Attribution (CC BY) license (https://creativecommons.org/licenses/by/4.0/).