Article

Cost–Benefit Analysis of Solar Thermal Plants with Storage in a Hydrothermal System

by
Cibelle Pereira Trama
1,*,
Amaro Olímpio Pereira Júnior
1,
Ana Paula Cardoso Guimarães
2,
André Luiz Diniz
2 and
Leonardo dos Santos Reis Vieira
2
1
Energy Planning Program, Alberto Luiz Coimbra Institute for Graduate Studies and Engineering Research, Federal University of Rio de Janeiro (PPE/COPPE-UFRJ), Rio de Janeiro 21941-914, RJ, Brazil
2
Electrical Energy Research Center (CEPEL), Rio de Janeiro 21941-911, RJ, Brazil
*
Author to whom correspondence should be addressed.
Energies 2021, 14(18), 5662; https://doi.org/10.3390/en14185662
Submission received: 16 June 2021 / Revised: 10 August 2021 / Accepted: 19 August 2021 / Published: 9 September 2021
(This article belongs to the Section A: Sustainable Energy)

Abstract

:
Economic feasibility studies of concentrated solar power (CSP) plants with thermal energy storage (TES) systems have been mainly based on the levelized cost of electricity (LCOE), disregarding the economic benefits to the electricity system resulting from the dispatchability of the CSP plants. The analysis of these benefits is essential since the existence of storage can provide greater operating flexibility to the system. Although there are few studies on the benefits of CSP plants in thermoelectric systems, this analysis has not yet been done in a predominantly hydroelectric system. In this paper, CSP plants with TES systems were inserted in a hydrothermal system in order to estimate the economic benefits and the net cost of electricity generated by those plants. The System Advisor Model (SAM) and the hydrothermal scheduling model DESSEM were used in a real case study of inclusion of CSP plants in the Brazilian system. The results indicate that the cost of a CSP plant, previously estimated by the LCOE, can be reduced by at least 37% when considering its benefits to a hydrothermal system, increasing its competitiveness with other technologies. Therefore, we propose the use of the net cost for an appropriate comparison among energy sources.

Graphical Abstract

1. Introduction

Electricity generation systems have undergone a significant transformation by the growing use of intermittent power sources, such as wind and solar photovoltaic (PV) energy, due to a reduction in their costs and policies to encourage renewable technologies. Despite the recent cost reduction and the low environmental impact of wind and solar PV plants without batteries, these generation technologies have low flexibility, since they rely on intermittent resources and do not have energy storage systems, causing numerous technical and economic challenges in the planning and operation of electricity systems. Therefore, the expansion of wind and solar PV energy and the changes in the form and variability of demand require greater flexibility of electricity systems to guarantee security of supply [1].
A concentrated solar power (CSP) plant with a thermal energy storage (TES) system is a technology able to modulate generation during the day and is, thus, adequate to meet the grid demand with greater reliability [2]. In this type of plant, the electricity is generated by the concentration of solar radiation in a solar field, where concentrating mirrors focus the direct component of solar irradiation on a receiver tube through which a heat transfer fluid (HTF) circulates. The HTF can be thermal oil or molten salt. The thermal energy contained in this fluid, heated to high temperature, is used in a power turbine generation cycle [3].
Due to the thermal nature of the process, a storage system is easily incorporated into CSP plants. In the TES system, the heat is generally stored in tanks containing molten salt, allowing operation of the CSP plant at night and/or on cloudy days, adding flexibility to plant operation and electricity dispatch [3].
Despite having a low variable operating cost due to the use of solar radiation, a CSP plant requires high investment for the solar field, making it generally uncompetitive with other renewable sources if the comparison is based on the levelized cost of electricity (LCOE), which is an economic evaluation metric that considers a constant value of electricity during the day. Thus, the economic and energy benefits resulting from the dispatchability of a CSP plant (due to its TES system) are not considered when using the LCOE, which is the usual economic practice.
In Brazil, the great majority of consumers and generators are connected to the National Interconnected System (Sistema Interligado Nacional (SIN)), a large-scale hydro–thermal–wind system in which thermal plants support the system in the periods of higher energy demand [4]. Characterized by the predominance of large hydroelectric plants with reservoirs capable of multiannual regularization, the SIN system has been expanded through wind and solar PV power plants, without batteries, as well as run-of-river plants in view of environmental restrictions. As these generation technologies are intermittent, other renewable technologies whose dispatch can be controlled, such as CSP with TES, are likely to expand in the future.
Brazil has a significant potential for solar thermal generation in its semi-arid region, where the direct normal irradiation (DNI) index, which is the main parameter for the implementation of CSP plants, is greater than 5.0 kWh/m2/day on average, reaching 2.2 MWh/m²/year [5], with low variability during the year. These figures are adequate for the development of commercial plants [6]. In Brazil, new power plants are selected by means of auctions, in which the main selection criterion is the lowest electricity cost bid, disregarding the short-term generation characteristics and the value that each plant can add to the power system.
In the global scenario, so far in the literature, the economic feasibility of CSP plants has been evaluated based solely on the levelized cost of electricity (LCOE), except for a few cases based on predominantly thermal systems, such as in Colorado, California, Algeria, and Morocco [7,8,9,10,11,12]. However, this kind of analysis is not sufficient to fully assess the benefits of the inclusion of CSP plants, which have not become competitive as compared to other generation technologies in studies that are based only on the LCOE calculation, without computing the economic benefits of the aggregation of such plants to the electricity system. To the best of the authors’ knowledge, the economic feasibility of CSP plants, taking into account their costs and benefits in complex predominantly hydropower systems, such as in Brazil and Norway [13], has not yet been analyzed in the literature. To fill this gap, the main contribution of this paper is to evaluate the economic benefits of the CSP plants in hydrothermal systems with predominantly hydropower generation and also to compute the net cost of the electricity generated by CSP plants, which is based on the difference between the sum of the capital and the operation cost of the plant and the economic benefits of its inclusion in the system.
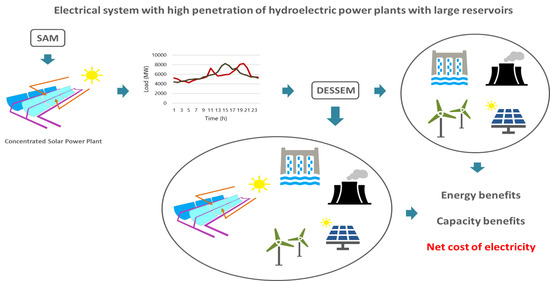
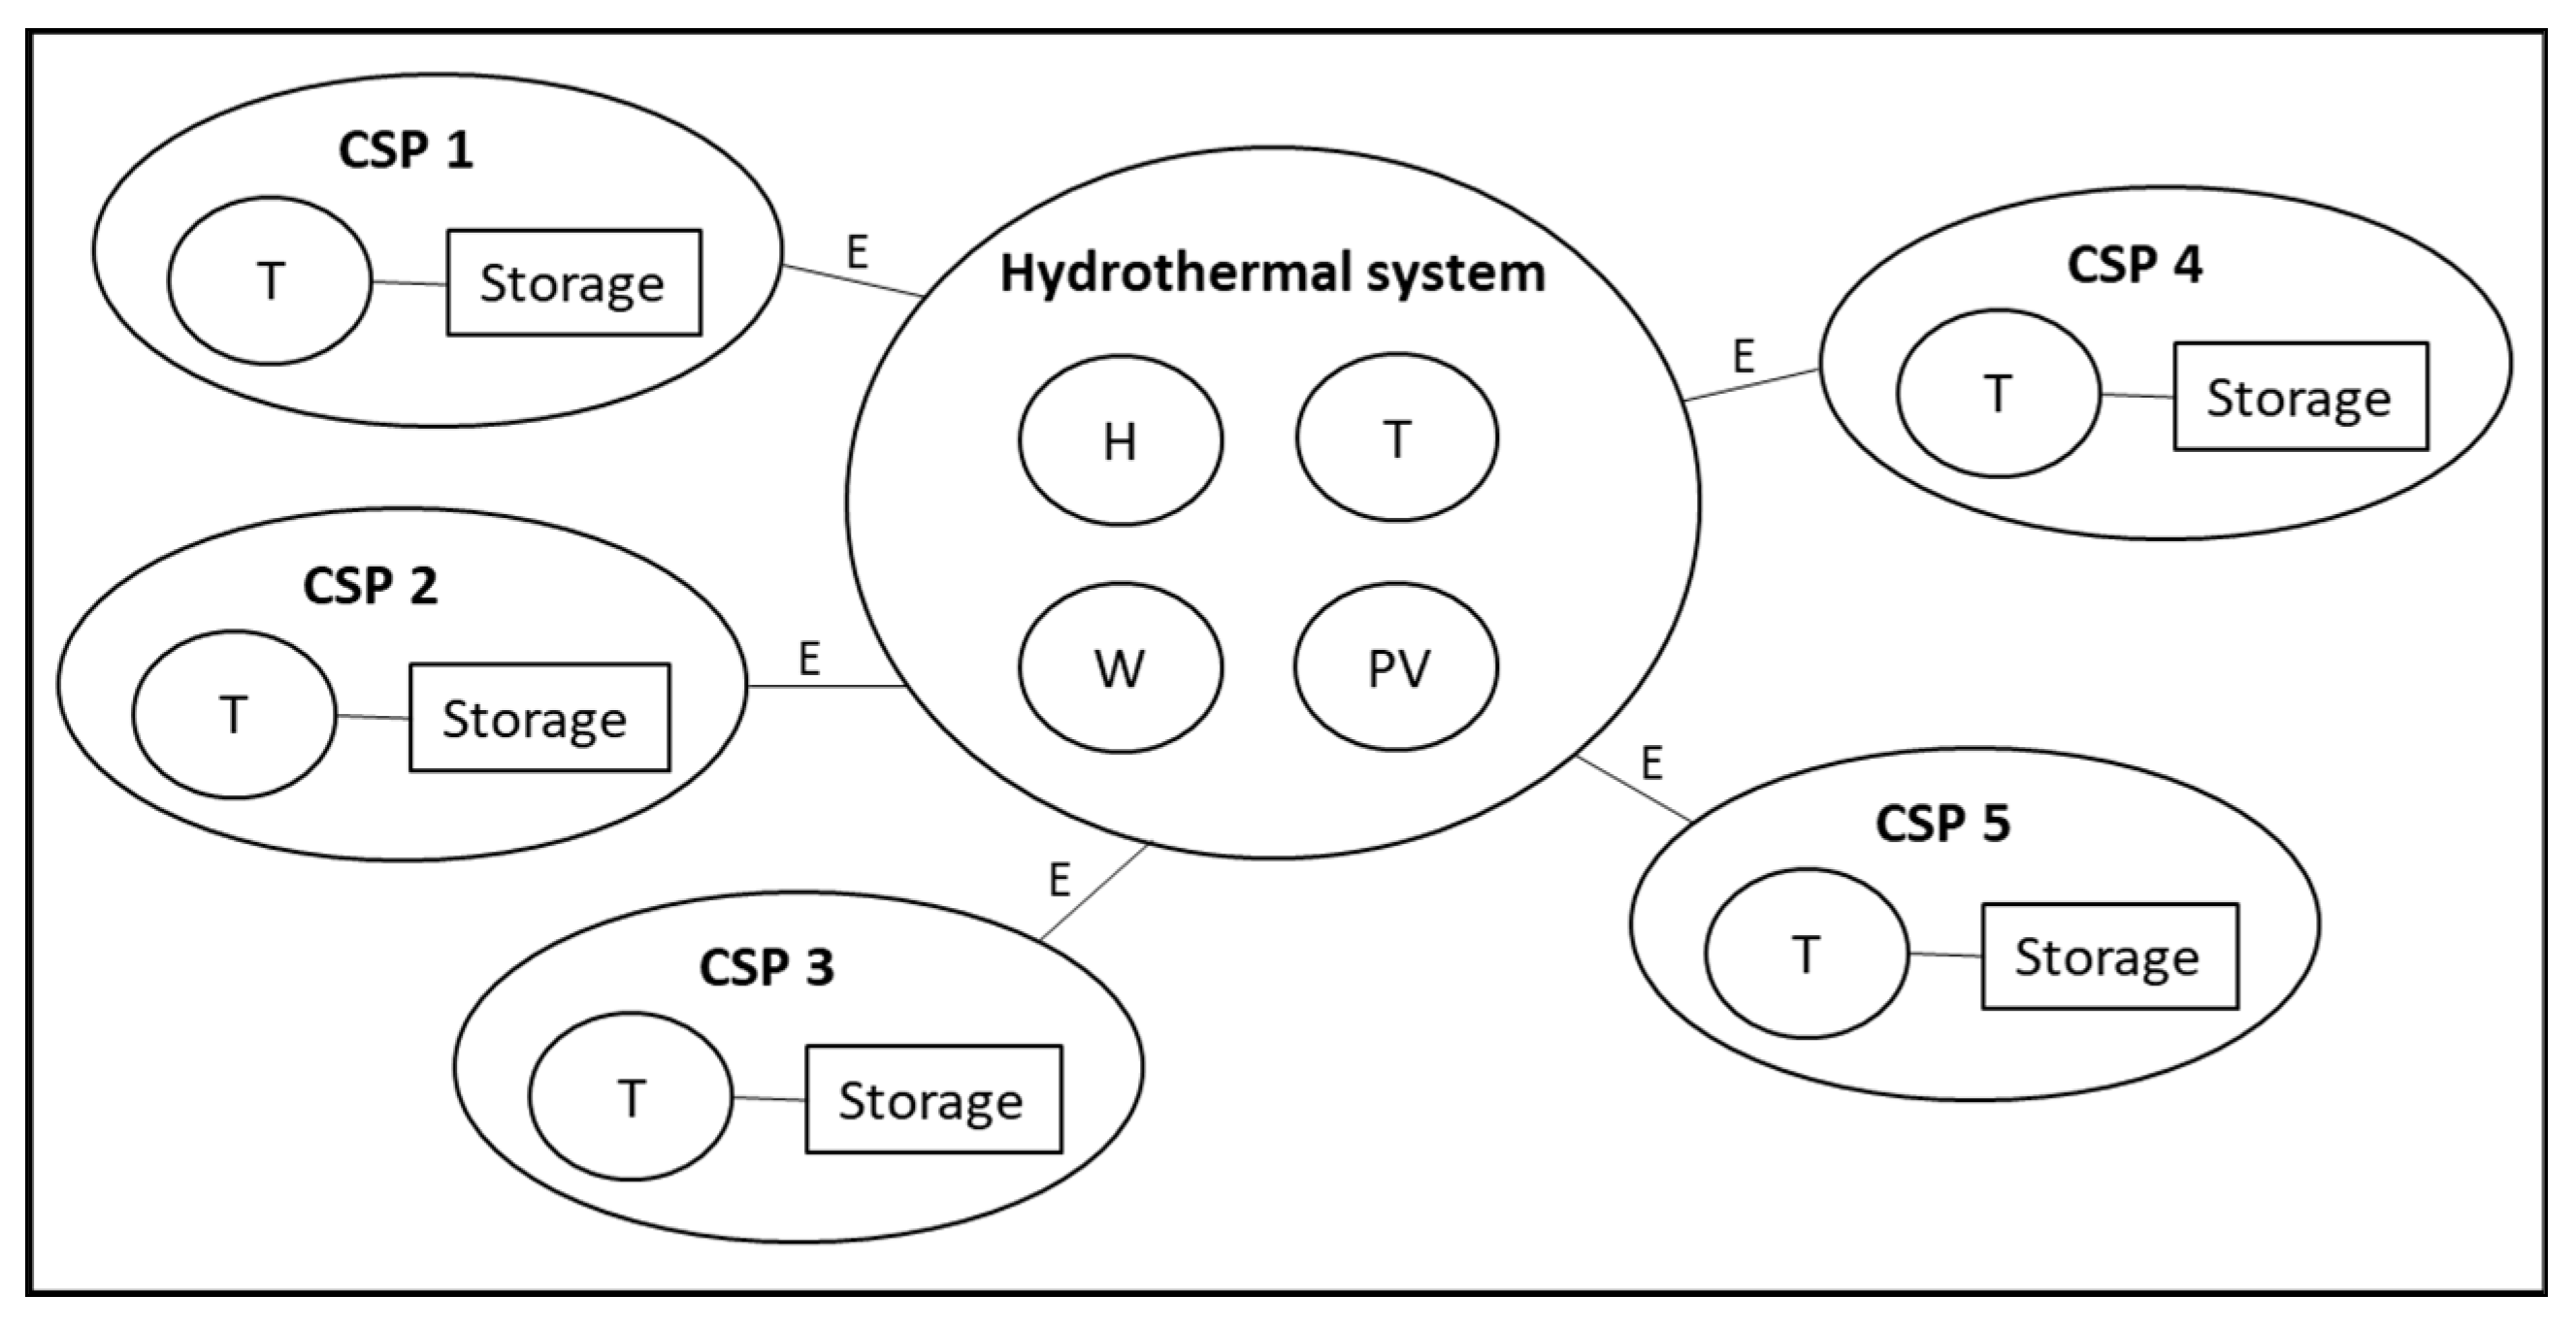
In addition, the proposed approach is applied to real data related to the Brazilian system to evaluate the operation of CSP plants in a municipality located in the semi-arid portion of the northeast region of Brazil. Toward this goal, we perform simulations using the NREL’s System Advisor Model (SAM) computational program [14], which is well-known techno-economic software for decision making in the renewable energy industry, and also model the operation of these plants in the DESSEM program, developed by the Brazilian Electric Energy Research Center (CEPEL), located in Rio de Janeiro, Brazil. DESSEM is the official tool used by the Brazilian independent system operator (ONS) and the market operator for the day-ahead hydrothermal dispatch of the system and to set hourly prices in Brazil. DESSEM is a mixed-integer optimization model for the unit commitment problem in hydrothermal systems, which takes into account detailed modeling and several constraints for the hydropower plants, thermal plants, and the electrical network and also includes other generation sources, such as wind and solar power plants [15].
The rest of the paper is organized as follows: Section 2 briefly reviews the literature on costs and value of electricity; Section 3 details the method of analysis, describing the case study, the electricity system, the modeling of the CSP plants with SAM and DESSEM, and the calculation of the net electricity cost; Section 4 presents the numerical results; and Section 5 reports the conclusions.

2. Costs and Value of Energy Sources: A Literature Review

2.1. Levelized Cost of Electricity

The most commonly used metric to estimate the costs of electric power generation technologies is the levelized cost of electricity (LCOE) [16,17,18,19]. The calculation of this indicator considers all costs (investment, operation and maintenance, fuel, and decommissioning) at the present value and the energy generated during the life span of the plant according to Equation (1) [20], where Ii is the investment cost in year i, Oi is the operation and maintenance cost in year i, Fi is the fuel cost in year i, Ei is the electric power generated in year i, r is the discount rate, and n is the plant’s life span. Thus, when applied to a specific generation technology, the LCOE measures the total life cycle cost per energy unit produced.
L C O E = { i = 0 n [ ( I i + O i + F i ) / ( 1 + r ) n ] } / { i = 1 n [ E i / ( 1 + r ) n ] }
The LCOE is widely used to compare the competitiveness of generation technologies that differ both in their cost structures and in their dispatchability characteristics. It is used to make a comparison between plants with low variable costs (renewable sources) and plants with significant variable costs (conventional fuel sources) [17]. It is also used do compare dispatchable plants (coal, natural gas, nuclear, geothermal, and biomass) with non-dispatchable plants (wind and solar PV) [19].
However, there is some criticism in the literature regarding the use of the LCOE to compare the economic attractiveness of dispatchable generation technologies with that of intermittent technologies [17,18,21,22,23,24]. According to Joskow [21], the economic evaluation of a power generation technology should consider the costs and the economic value of the generated electricity, which is a value that varies along the day due to the oscillations between supply and demand and the high cost of energy storage. Since LCOE considers electricity as a homogeneous product that always has the same value, it is not an adequate metric for economic analysis of energy generation technologies [21].
When comparing two electricity generation technologies with similar levelized costs (e.g., one dispatchable plant with a capacity factor of 90% and one intermittent plant with a capacity factor of 30%) in a market with two electrical demand periods (peak and off-peak), Joskow [21] highlighted the fragility of the LCOE indicator. In his example, he demonstrated that the economic value of intermittent generation can vary significantly according to the period of the day. If production occurs mainly during off-peak hours, the plant will not produce sufficient revenue to cover its costs, while if the generation is concentrated in the peak demand period, the energy provided by the plant will have great economic value, surpassing the economic value of a dispatchable source. Therefore, even though the economic feasibility of the intermittent generation plant is different in these two situations, it will be the same using the LCOE methodology.
Dowling et al. [18] analyzed energy market prices in California in 2015 and strengthened Joskow’s criticism by verifying the possibility of obtaining additional revenue of 400,000 dollars per year by displacing 10 MW from the average price period to other periods with higher prices. Ueckerdt et al. [17], Hirth [23], and Hirth et al. [24] highlighted another fragility of the LCOE: it disregards the impacts of the insertion of variable renewable energy (VRE) sources, such as wind and solar PV energy, in electricity systems. The LCOE does not capture additional costs (infrastructure and ancillary services, among others) and avoids costs or benefits (fuel, emissions, and capacity, among others) and the need for investment in other technologies (demand response and energy storage) when VRE is added to the system [22].
CSP is still an expensive renewable energy generation technology on an LCOE basis, averaging 0.182 US$/kWh in 2019 [25]. Several studies have estimated the LCOE of CSP plants in different regions with different technologies [26,27,28,29,30,31,32,33], whose values are in the range of 0.04–0.38 US$/kWh.
With respect to the LCOE indicator, we highlight the following conclusion of Musi et al. [27] regarding the analysis of 74 CSP plants with specific technical characteristics (technology, refrigeration, DNI, area of solar collectors, and capacity factor): the authors identified that CSP plants with TES systems have a higher capacity factor and lower LCOE values than plants without storage. Therefore, the additional cost of TES should be considered, even from the standpoint of LCOE evaluation. Besides this, it allows the CSP plant to complement the generation from intermittent technologies due to its dispatchability, which is not computed in the LCOE.
In this work, the LCOE of the CSP plants is calculated through the simulation of plants in a location in the Brazilian semi-arid region.

2.2. Levelized Avoided Cost of Electricity

With the expansion of intermittent renewable generation, various studies have indicated the need to consider economic benefits that are not computed in economic feasibility analysis based on LCOE. The TES system of CSP plants can provide several benefits to the electricity system associated with (i) energy, due to the substitution of conventional power plants, avoiding variable fuel and operating costs; (ii) firm capacity to meet system demand, replacing investment in new plants; and (iii) the possibility of providing some ancillary services [34]. These economic benefits, which reflect the value of the CSP in terms of energy, capacity, and ancillary services, consist of the costs avoided by the solar thermal technology and constitute the levelized avoided cost of electricity (LACE).
The National Renewable Energy Laboratory (NREL) carried out most of the studies on the impact of inserting CSP plants into the electric power systems from the central and western regions of the United States, based on the planning of the renewable portfolio for 2020. In these systems, thermoelectric generation accounts for most of the electricity produced, unlike the situation in the predominantly hydropower systems, as in Brazil.
Denholm and Mehos [7] evaluated the impact of a CSP plant with an 8 h TES system on the electricity system in southeastern USA. The authors added the energy generation obtained from CSP plant simulations with the SAM computational program (a program created by the NREL for financial and performance modeling of solar plants) to the input data for REFlex software (a dispatch model that compares the load with the renewable resources and calculates the quantity of energy to be cut back according to the flexibility of the grid.) and concluded that the introduction of CSP generation could reduce load shedding, increase the grid’s flexibility, and contribute to the insertion of intermittent sources.
Madaeni et al. [35] presented two methods to estimate the capacity credit of a CSP plant, i.e., the contribution of the plant to meet the firm capacity of the system: the effective load-carrying capability (ELCC) and the approximation method. The ELCC is the amount by which the system load can increase when a generator is included, while maintaining the same level of reliability, analyzed in terms of the loss of load probability (LOLP) and loss of load expectation (LOLE). To obtain the capacity credit, the system’s LOLE is estimated with the inclusion of the CSP plant in comparison with the LOLE of a conventional thermal power plant. When the system’s LOLE with a CSP plant equals the system’s LOLE with a conventional generator, the values added for conventional and solar thermal generation are compared to find the CSP plant’s capacity credit.
Since the ELCC is a computationally costly method and requires a large amount of data and detailed information, the approximation method can be used, which consists of finding a CSP plant’s capacity credit according to its estimated generation during the most critical hours (highest gross load, net load (total load of the system minus contributions of wind and solar power generation), or energy price) of the year. The expected capacity factor of the plant in these hours corresponds to the capacity credit in percentage terms. In this respect, Madaeni et al. [35] found that the use of 10 critical load hours over an annual period is the most consistent alternative with the ELCC metric according to the estimated capacity value of CSP plants with and without TES systems in locations in the USA (Arizona, California (Imperial Valley and Death Valley), Nevada, and New Mexico).
The approximation method of Madaeni et al. [35] was applied to solar PV and CSP plants with and without TES systems in the USA by some utility companies, such as Tucson Electric Power, Public Service of Colorado, Arizona Public Service, and Idaho Power. The results showed that the capacity credits of the CSP plants with storage were up to 54% and 30% higher than those of solar PV plants and CSP plants without storage, respectively [34].
Denholm and Hummon [8], Denholm et al. [9], Jorgenson et al. [10], and Jorgenson et al. [11] estimated the capacity value and the operational value (avoided costs of fuel, variable O&M, and startup) of CSP plants and other generation technologies in different places in the USA and in various renewable insertion scenarios (Table 1). To estimate the economic benefits of the inclusion of CSP plants in the power systems, the authors used the SAM and the Plexos Integrated Energy Model (PLEXOS) computational program, an economic model of energy dispatch aiming at the lowest cost. The energy availability from the CSP plants, obtained from the SAM, was added to PLEXOS input data, together with other operational characteristics and price forecast. The authors used the same method to estimate the capacity value of the plants: they estimated the capacity credits of the CSP plants, which were multiplied by the annual cost of an available conventional generator, and the result was divided by the annual power generated. The capacity credits were obtained using the approximation method of Madaeni et al. [35] but for different periods: Denholm and Hummon [8] and Jorgenson et al. [10] analyzed the credits during the period of 10 most critical hours, while Denholm et al. [9] applied this analysis to the 876 h with the highest energy price, and Jorgenson et al. [11] applied it to the 100 h with the highest net load. All these works considered a minimum and a maximum cost to the available conventional generator, resulting in two capacity values for each plant. Denholm et al. [9] considered 55 US$/kW and 212 US$/kW as the minimum and maximum annual cost, respectively, while in [8,10,11], the authors used 77 US$/kW and 147 US$/kW. The operational value of each technology was found by dividing the avoided generation cost (output data from PLEXOS when the plant was inserted into the system) by the estimated generation of the plant. In [9,11], the avoided costs of emissions were also included in this value. Denholm et al. [9] also considered the benefit of the CSP plant in supplying operating reserves (ancillary services that include spinning reserve, regulation reserve, and load-following reserve) to the system by comparing the generation, spinning reserve, total reserve, and storage during the plant’s operation at each hour.
In general, the value of the CSP plant with storage was higher than the value of other plants (Table 1) with the displacement of the most expensive thermal generators of the system. The greater participation of renewable resources in the system can lead to an increase in the value of CSP capacity as compared to other generation technologies.
In Brazil, the electrical system is different from the above-mentioned systems because it is composed predominantly of hydroelectric plants. Similar to [8,9,10,11], the energy and capacity values of the plants are also calculated in this paper. However, in [8,9,10,11], only the generation cost of conventional thermal generators was considered in the calculation of the capacity value and the PLEXOS model was used, whereas in this paper, we also take into account the value of power generation in hydropower plants and DESSEM is applied to simulate the system operation.
According to Denholm et al. [36], the energy value can be calculated through either a dispatch model with predetermined energy prices or a dispatch model based on cost minimization, which is the case in our work. The latter is most commonly used and is suitable for analyzing the benefits that the plant provides to the system. The period of the highest net load is the most adequate to achieve the capacity credit with the method of Madaeni et al. [35] and possible long-term economic benefits that can arise, such as a reduction in the natural gas price, which can be partially replaced by CSP with storage [36].
A study on the value of CSP plants conducted outside the USA estimated the value of CSP dispatchability (the difference between the costs of systems with CSP plants without and with storage) for the electricity systems of Algeria and Morocco, where natural gas and coal-fired plants are predominant, respectively [12]. The authors found out that CSP plants have a greater value in Morocco, where the generators are less flexible. The CSP plant with the TES system increased the operational flexibility of the system.
The above studies calculated only the economic benefits, while the present study estimates not only the benefits but also the net cost of the electricity generated by CSP plants in a hydrothermal system, with application to the real Brazilian system.

2.3. Net Cost of Electricity

To support the selection of the resources for renewable portfolios, Mills and Wiser [34] suggested calculation of the net cost (Equation (2)) for each resource. The net cost is the difference between the cost of adding the resource and the costs avoided by displacing other resources. These avoided costs correspond to the capacity value and to the energy value. The resources with the lowest net cost should compose the portfolio.
N e t   c o s t   ( $ / M W h ) = R e s o u r c e   d e l i v e r e d   c o s t   ( $ / M W h ) A v o i d e d   c o s t s   ( $ / M W h )  
The CSP Alliance [2] included in the net cost calculation (which can also be applied to other technologies) the costs related to transmission, integration, and the value of ancillary services (Equation (3)). The transmission cost corresponds to the cost of the outlay to construct a transmission network, the integration cost refers to the additional cost to regulate the load beyond historical levels, and the benefits of ancillary services result from the provision of these types of services by some technologies, such as CSP with storage, which can supply operating and regulation reserves and other ancillary services rendered by synchronous generators, such as frequency regulation and voltage control. However, the estimation of the integration cost and the value of ancillary services requires sub-hourly dispatch models and greater computational effort.
N e t   c o s t = L C O E   ( o r   b i d   c o s t ) + T r a n s m i s s i o n   c o s t + I n t e g r a t i o n   c o s t E n e r g y   b e n e f i t s C a p a c i t y   b e n e f i t s A n c i l l a r y   s e r v i c e   b e n e f i t s
Mehos et al. [37] estimated the net value (the difference between the total value (operational and capacity) and the LCOE) of CSP plants in the electricity system of California for 2013 and 2020. The authors used the SAM to obtain the LCOE, the method described in [9] to calculate the operational value and the period with the highest net load to analyze the capacity credits. The results indicated that the value of CSP plants increases with a higher storage capacity and declines for larger solar fields.
According to the reviewed literature, a CSP plant with storage can avoid costs related to energy and capacity supply, but these benefits have been estimated for predominantly thermoelectric systems. Furthermore, the studies did not estimate the net electricity cost. In this sense, the contribution of this work consists in calculating the economic benefits and the net cost of the electricity (R$/MWh) that one or more CSP plants provide to a predominantly hydroelectric system. Therefore, the analysis of the CSP plant’s economic feasibility, considering its costs and the benefits to a complex hydrothermal system, is the main objective of this work.

3. Methodology

This section describes the hydrothermal system and each step of the methodology that has been considered in this work.

3.1. Generation Mix

We consider in this study a hydrothermal generation mix, with a total installed capacity of 10.633 GW, consisting of 10 hydropower plants, 10 thermal plants, 6 wind farms, and 2 solar PV plants, corresponding to 65.6%, 24.8%, 8.2%, and 1.4% of the installed capacity, respectively. Although reduced in size, this system approximately represents, in percentage terms, the composition of the SIN Brazilian system with respect to the relative participation of each source. All the generators considered in the simulations are real plants, whose data are provided by ONS.

3.2. Steps

The analysis of the economic feasibility of the CSP plants, considering their benefits to the electricity system, was carried out in six steps (Figure 1): (1) selection of the CSP plants, (2) scenario definition, (3) optimization of the hydrothermal system without CSP plants, (4) implementation of the CSP plants in DESSEM, (5) optimization of the hydrothermal system with CSP plants, and (6) calculation of the net cost of electricity from the CSP plants.

3.2.1. Selection of CSP Plants

Step 1 consisted of choosing CSP plants. We considered CSP plants with parabolic-trough collector (PTC) technology due to its greater technological maturity and greater worldwide application [3,25]. The plants were modeled with the SAM [38] in Bom Jesus da Lapa, a municipality located in Brazil’s semi-arid region with a DNI of 6.02 kWh/m²/day. The region has availability of transmission lines, substation, water resources, and low coefficient of variation of the monthly average DNI [38,39], which is considered appropriate for the installation of CSP plants and compatible with other areas where thermal power plants in operation are located.
All CSP plants were simulated with 100 MWe net power, in the same location, and represent plants designed for commercial operation. Due to the availability of water on site, wet cooling was chosen, with higher efficiency and lower cost than dry cooling [40]. The TES system consists of a two-tank molten salt system. All CSP plants were simulated with indirect PTC technology, which uses thermal oil as an HTF and molten nitrate salt to store energy in the TES system, the configuration of most CSP plants built in other countries [41].
A parametric analysis was conducted to select the CSP plants’ solar multiple (SM, the ratio between the size of the solar field and the power block) and the number of storage hours of the TES system so as to minimize the LCOE. In this analysis, SM values ranged between 1.1 and 2.7 at intervals of 0.4 and the number of hours ranged from 0 to 12, with 3 h intervals. Additional technical parameters are presented in Table 2, economic parameters are listed in Table 3, and the specific costs of the PTC technology are indicated in Table 4.
Figure 2 shows the LCOE of the CSP plants for the various values of SM and storage hours. The CSP plant with SM equal to 1.5 and the 6 h TES system was selected because the influence of the solar multiple in the LCOE is lower for the 6 h TES system than for other TES sizes and also because it showed the lowest levelized cost for the CSP plant.

3.2.2. Scenario Definition

In step 2, four typical 1-day scenarios were built: (i) a wet/night scenario, (ii) a wet/day scenario, (iii) a dry/night scenario, and (iv) a dry/day scenario. The first two scenarios represent the hydrothermal system on a day in January (wet season), with maximum loads at night and during the day, respectively (Figure 3), while the last two scenarios denote the hydrothermal system of a day in August (dry season), with the same load profiles as those in the wet season scenarios.
Although the analysis of the annual hourly performance of the plant would be important, we consider that the evaluation of combinations of two different daily load profiles in two different seasons of the year, to represent the seasonality of energy resources, is able to provide a first assessment of the economic feasibility of the insertion of CSP plants, which can be further refined with more detailed system data and number of scenarios, as needed.
The months of January and August were chosen because of the significant differences in their wind and solar generation as well as in water inflows and reservoir levels, which have a strong impact on the operation of hydropower systems, as in Brazil. The solar thermal generation profile forecast in these months is also substantially different, which affects the simulations carried out with SAM software, as detailed in Section 3.2.1.
For the simulations, a typical day in each month was defined based on the average monthly data on the hourly generation of wind farms and solar PV plants, also considering the monthly variable unit cost of each thermoelectric plant, with reference to January and August 2019 [44,45]. In each scenario, up to five CSP plants were inserted to evaluate the impact of the inclusion of each plant in a hydrothermal generation system.

3.2.3. Optimization of the Hydrothermal System without CSP Plants

The operation of the hydrothermal system was simulated by employing DESSEM software [15], which is the optimization model that has been officially used by the Brazilian Independent System Operator (ONS) to determine the day-ahead dispatch and since 2021 by the market operator to establish hourly prices for the Brazilian system. The short-term hydrothermal unit commitment problem is modeled in DESSEM as a mixed-integer linear programming problem that aims to minimize the operating cost of the system, taking into account detailed constraints for the hydropower plants, thermoelectric plants, and the power grid. The main constraints and characteristics considered in this model are as follows:
  • Thermal unit commitment constraints, such as minimum generation, minimum up/down times, ramp constraints, and startup and shutdown trajectories
  • Operation of combined-cycle thermal plants, which are modeling by a configuration-mode approach
  • A DC power flow model of the electrical network, with flow limits constraints for individual lines and/or a combination of lines
  • Dynamic security constraints for the electrical network, which are defined by tables of by piecewise linear functions
  • Hydropower balance in the reservoirs, taking into account water delay times for hydropower plants in cascade, a linear model for evaporation, and water intakes for other uses
  • A four-dimensional piecewise linear model for the hydropower production function of the hydropower plants, to take into account variation of efficiency with the water head
  • Other renewable resources, such as wind power plants, whose power can be curtailed, when needed, due to feasibility of optimality reasons
DESSEM applies the CPLEX solver with the branch-and-cut algorithm to solve the problem, with an optimality tolerance of 0.05%. The main outputs of the model are the half-hourly generation targets for each hydroelectric and thermoelectric plant, as well as the evolution of all reservoirs and the flows in all transmission lines of the system along the day, in order to meet the load and satisfy all constraints for the system and its components.
Details on the modeling of the system components, problem formulation, and solving strategy of DESSEM can be found in [15] and references therein.
The results of step 3 are the total operating cost of the system in the proposed scenarios and the generation of each plant, whose values were subsequently used to calculate the net cost and to analyze the impact of the CSP plants on the system.

3.2.4. Implementation of CSP Plants in DESSEM

We used some features of DESSEM to emulate the inclusion of CSP plants in a hydrothermal system. Figure 4 illustrates step 4 of this study, which consisted in modeling each CSP plant in DESSEM.
Since CSP plants are not explicitly represented by DESSEM, these plants were emulated as a thermoelectric plant linked to an energy storage device, both located in a separate fictitious electricity system connected to the hydrothermal system of this study, as depicted in Figure 5.
First, an hourly electricity production curve of the CSP plant was generated from the SAM simulation with the parabolic-trough collector physical model but without considering the thermal storage. Although the chosen CSP plant has SM equal to 1.5 and 6 h thermal storage, for evaluating the net cost, it was simulated without considering the storage, since the storage operation will be decided by DESSEM. The electric power availability curve of the plant without storage was obtained from the thermal energy curve that enters the thermal cycle of the CSP plant multiplied by the gross efficiency of the thermal cycle of electric power generation, since the energy losses and parasitic loads were also considered in DESSEM. In the implementation with DESSEM, this amount of energy can be stored in the energy storage device located at the same fictitious region to which the CSP plant belongs or supplied for consumption through the interconnection between such region and the rest of the system.
Since the study concerns one-day-ahead operation scheduling, the hourly electric power curves of 18 January and 23 August were used to model each CSP plant in the wet and dry scenarios, respectively, since they reflect the solar thermal generation profile according to the daily average DNI values in those months.
The electric power curve of the CSP plant without storage obtained from SAM simulations was emulated in DESSEM as a time-varying maximum thermoelectric generation capacity in each hour. In DESSEM, the electrical systems are interconnected through energy exchanges, which are interconnection tie lines between systems, with limited energy transfer capacity. Thus, in DESSEM, the interchange limit between each fictitious electricity region and the rest of the system was considered equal to the nominal power of the CSP plant. The CSP parasitic load was represented by the demand of the system where the plant was inserted.
The 6 h TES system was modeled as a storage device whose capacity is equal to the useful capacity of the 6 h TES system, given by the difference between the maximum capacity of the TES and the minimum energy volume stored in the tanks necessary to prevent degradation of the storage fluid. The efficiency of the TES system, about 93% due to efficiency losses in the heat exchangers and long-term thermal losses [40], was represented by the storage device’s efficiency.
The variable O&M cost of the CSP plant should be allocated to the interchange lines since it represents the costs incurred in the turbine. Since DESSEM does not consider an explicit cost to each interchange line, this cost was modeled as the variable unit cost of the thermoelectric plant, hypothesizing that the total available solar power (the sum of daytime hours) and the energy generated by the turbine are similar, except for the losses due to turbine efficiency.

3.2.5. Optimization of the Hydrothermal System with CSP Plants

Step 5 consisted of simulating the electricity system with the introduction of the CSP plants, as presented in Section 3.2.4. Simulations were carried out with one, two, three, four, and five CSP plants in the system, determining the dispatch on an hourly basis of all the plants composing the system.

3.2.6. Calculation of Net Cost of Electricity from the CSP Plants

Step 6 involved calculating the net cost of electricity (NCE) generated by the CSP plants through the method applied by the CSP Alliance [2], represented in this study by Equation (4), equivalent to Equation (3) with the terms related to the benefits grouped. CT denotes the transmission cost; CI denotes the integration cost; and the avoided costs of energy, capacity, and ancillary services are represented by CEE, CEC, and CEAS, respectively. CEE includes avoided costs of fuel and variable O&M. Since one to five CSP plants were inserted in the system, NCE was estimated for each plant and each set of plants, composed of net powers up to 500 MW.
C L E = L C O E + C T + C I ( C E E + C E C + C E A S )
The LCOE of the CSP plant was obtained from SAM simulations (step 1). CT was considered equal to zero in this study because the CSP plants were simulated in a location with an available transmission network. CI was also considered equal to zero, as described in [2,34], due to the CSP plants’ dispatchability. It should be mentioned that Equation (4) can be applied to any generation technology, and for other types of plants, such as wind and solar PV, CI may be a non-zero value.
The CEE value of a set of CSP plants was obtained by dividing the energy benefit resulting from the addition of the set to the system (i.e., the difference in system operation cost between the simulations with and without the set) by the generation of the set of plants (Equation (5)), where COi is the avoided operating cost in period i, n is the number of hours in the day, and Gi is the generation in period i.
C E E = ( i = 1 n C O i ) / ( i = 1 n G i )
Since all CSP plants generated the same amount of energy in the whole day, the CEE of each CSP of a set of plants was calculated by dividing the avoided operating cost (in R$) of this set by the number of CSP plants in the set, and the result was divided by the generation of the plant, obtaining the CEE of each plant in R$/MWh.
The CEC values of the set of CSP plants and of each plant were obtained via Equation (6) [34], where FCpeak represents the annualized fixed investment cost of a plant operating to satisfy peak demand ($/MW/yr), CCS is the capacity credit of the CSP plant (% of nominal power), and CFS is the capacity factor of the CSP plant (%).
C a p a c i t y   v a l u e = [ ( F C p e a k /   8760   h / y r ) ]   x   ( C C S / C F S )
The CCS values were calculated by applying the method described by Madaeni et al. [35], considering the contribution of the plants to the system’s firm capacity during the period of the highest net load, as proposed by [36]. The periods of the highest net load comprise the intervals between 18:00 and 21:00, when the maximum load occurs at night, and between 13:00 and 16:00, when this peak load occurs during the day.
The annualized fixed investment cost of a peak plant (FCpeak) was estimated based on the corresponding generation technologies often activated in periods of highest loads (Table 5). While studies conducted for thermal systems typically consider gas or internal combustion turbines in the FCpeak, in a hydrothermal system, the hydroelectric plants with reservoirs have also been considered in calculating FCpeak, since they play an important role. In this study, FCpeak is composed of the annualized investment cost added to the fixed O&M cost of each generator. The generators costs were determined according to their technology, as defined in the National Energy Plan 2050 [43], except for oil-fired plants, whose cost was obtained as defined in the National Energy Plan 2030 [46], because the National Energy Plan 2050 does not consider oil-fired plants. The FCpeak values obtained for the thermoelectric plants were within the range of costs used by [9]. The FCpeak values of large hydroelectric and oil-fired plants were selected because these technologies are most frequently replaced by CSP plants in this study, resulting in the lowest and highest CEC values, respectively, corresponding to the maximum and minimum values of NCE.
The metric CEAS was not included in calculating NCE in this study, because it was not possible to estimate the costs of supplying ancillary services by the CSP plants with the tools that were used. However, the operation of one CSP plant was simulated in the wet scenarios with the minimum power reserve equal to 22.2 MW (20% of nominal power) between 10:00 and 16:00, when wind generation tends to be low. The operation of this CSP plant to supply energy and power reserve to the system is presented in the next section.

4. Results and Discussion

Simulations of the hydrothermal system without CSP plants indicated that the generation from hydro-, thermal, and intermittent (wind and photovoltaic) sources was, respectively, 70%, 22%, and 8% of the total generation in the wet scenarios and 63%, 27%, and 10%, respectively, in the dry scenarios. These figures represent approximately the participation of these sources in the energy generation of the SIN in the considered periods.
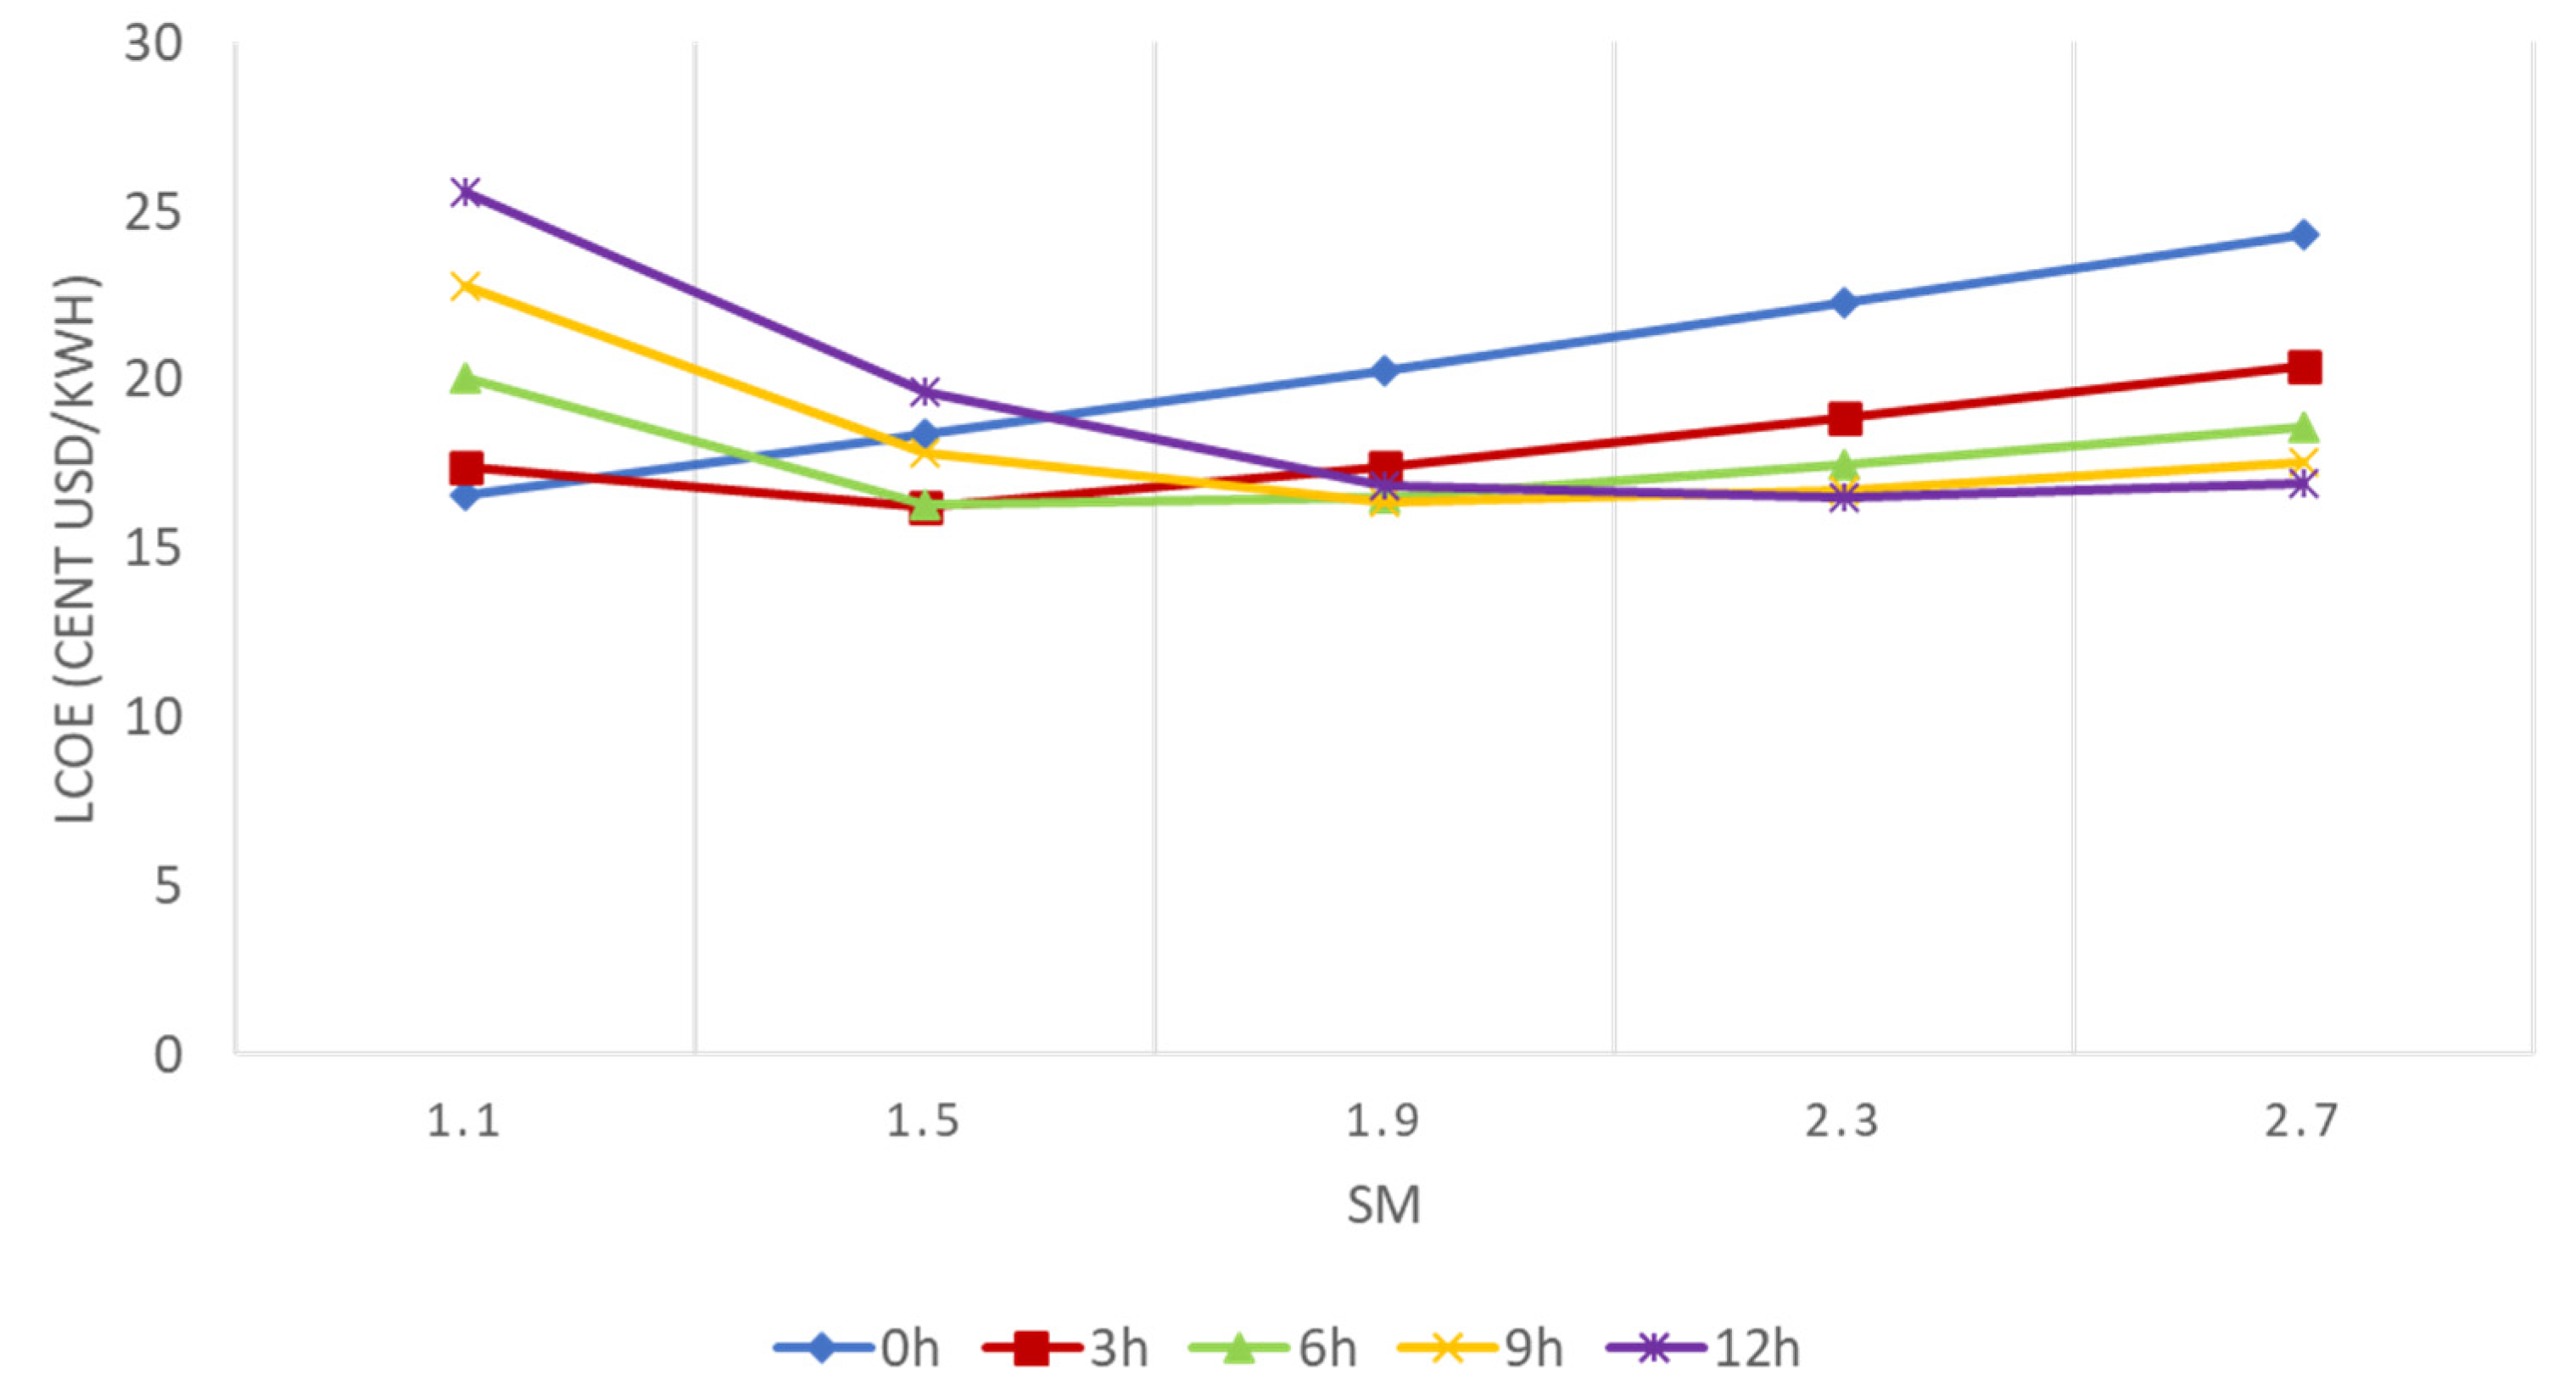
As a result of the various simulations carried out with the SAM to obtain a CSP plant with a low LCOE, the CSP plant considered in this study has an LCOE equal to 644.64 R$/MWh (approximately 0.16 US$/kWh), a value within the range of LCOE values mentioned in Section 2.1 but still much higher than for other generation technologies. In the last auction to contract new generators in Brazil, in 2019, the most expensive technology was a small hydroelectric plant contracted for 234.63 R$/MWh (equal to 0.06 US$/kWh at the average exchange rate for that year) [47]. This demonstrates the low competitiveness of solar thermal technology in Brazil when evaluated only by the LCOE. The results from DESSEM with the insertion of CSP plants are presented next, in which CSP 1 refers to CSP plant 1 (first plant added to the system), CSP 2 refers to CSP plant 2 (second plant added to the system), and so on. The base case refers to the simulation of the system without CSP plants, and the nomenclature 1 CSP means one CSP plant in operation, 2 CSP denotes two CSP plants in operation, and so on.
The operation of CSP plant 1 is illustrated in Figure 6 for the various scenarios, where the solar inflow curve refers to the electric equivalent of the energy supplied by the solar field and the storage curve represents the level of the plant’s useful storage system (without considering the minimum necessary storage). Despite the different DNI profiles, the DESSEM output indicated the storage of part of the energy available from the CSP plant for dispatch at night in the majority of the scenarios. In the dry/day scenario, the plant would start operating in the period of the highest daytime load and would also generate energy at night.
In each scenario, the CSP plants would be able to generate energy during the periods of peak load (Figure 7). However, CSP 4 and CSP 5 would also generate electricity at times with lower load and, hence, lower energy prices.
The benefits of including CSP plants in the hydrothermal system include reduction in the marginal operating cost (which is determined by DESSEM), the substitution of non-renewable sources, and the complementarity with intermittent sources.
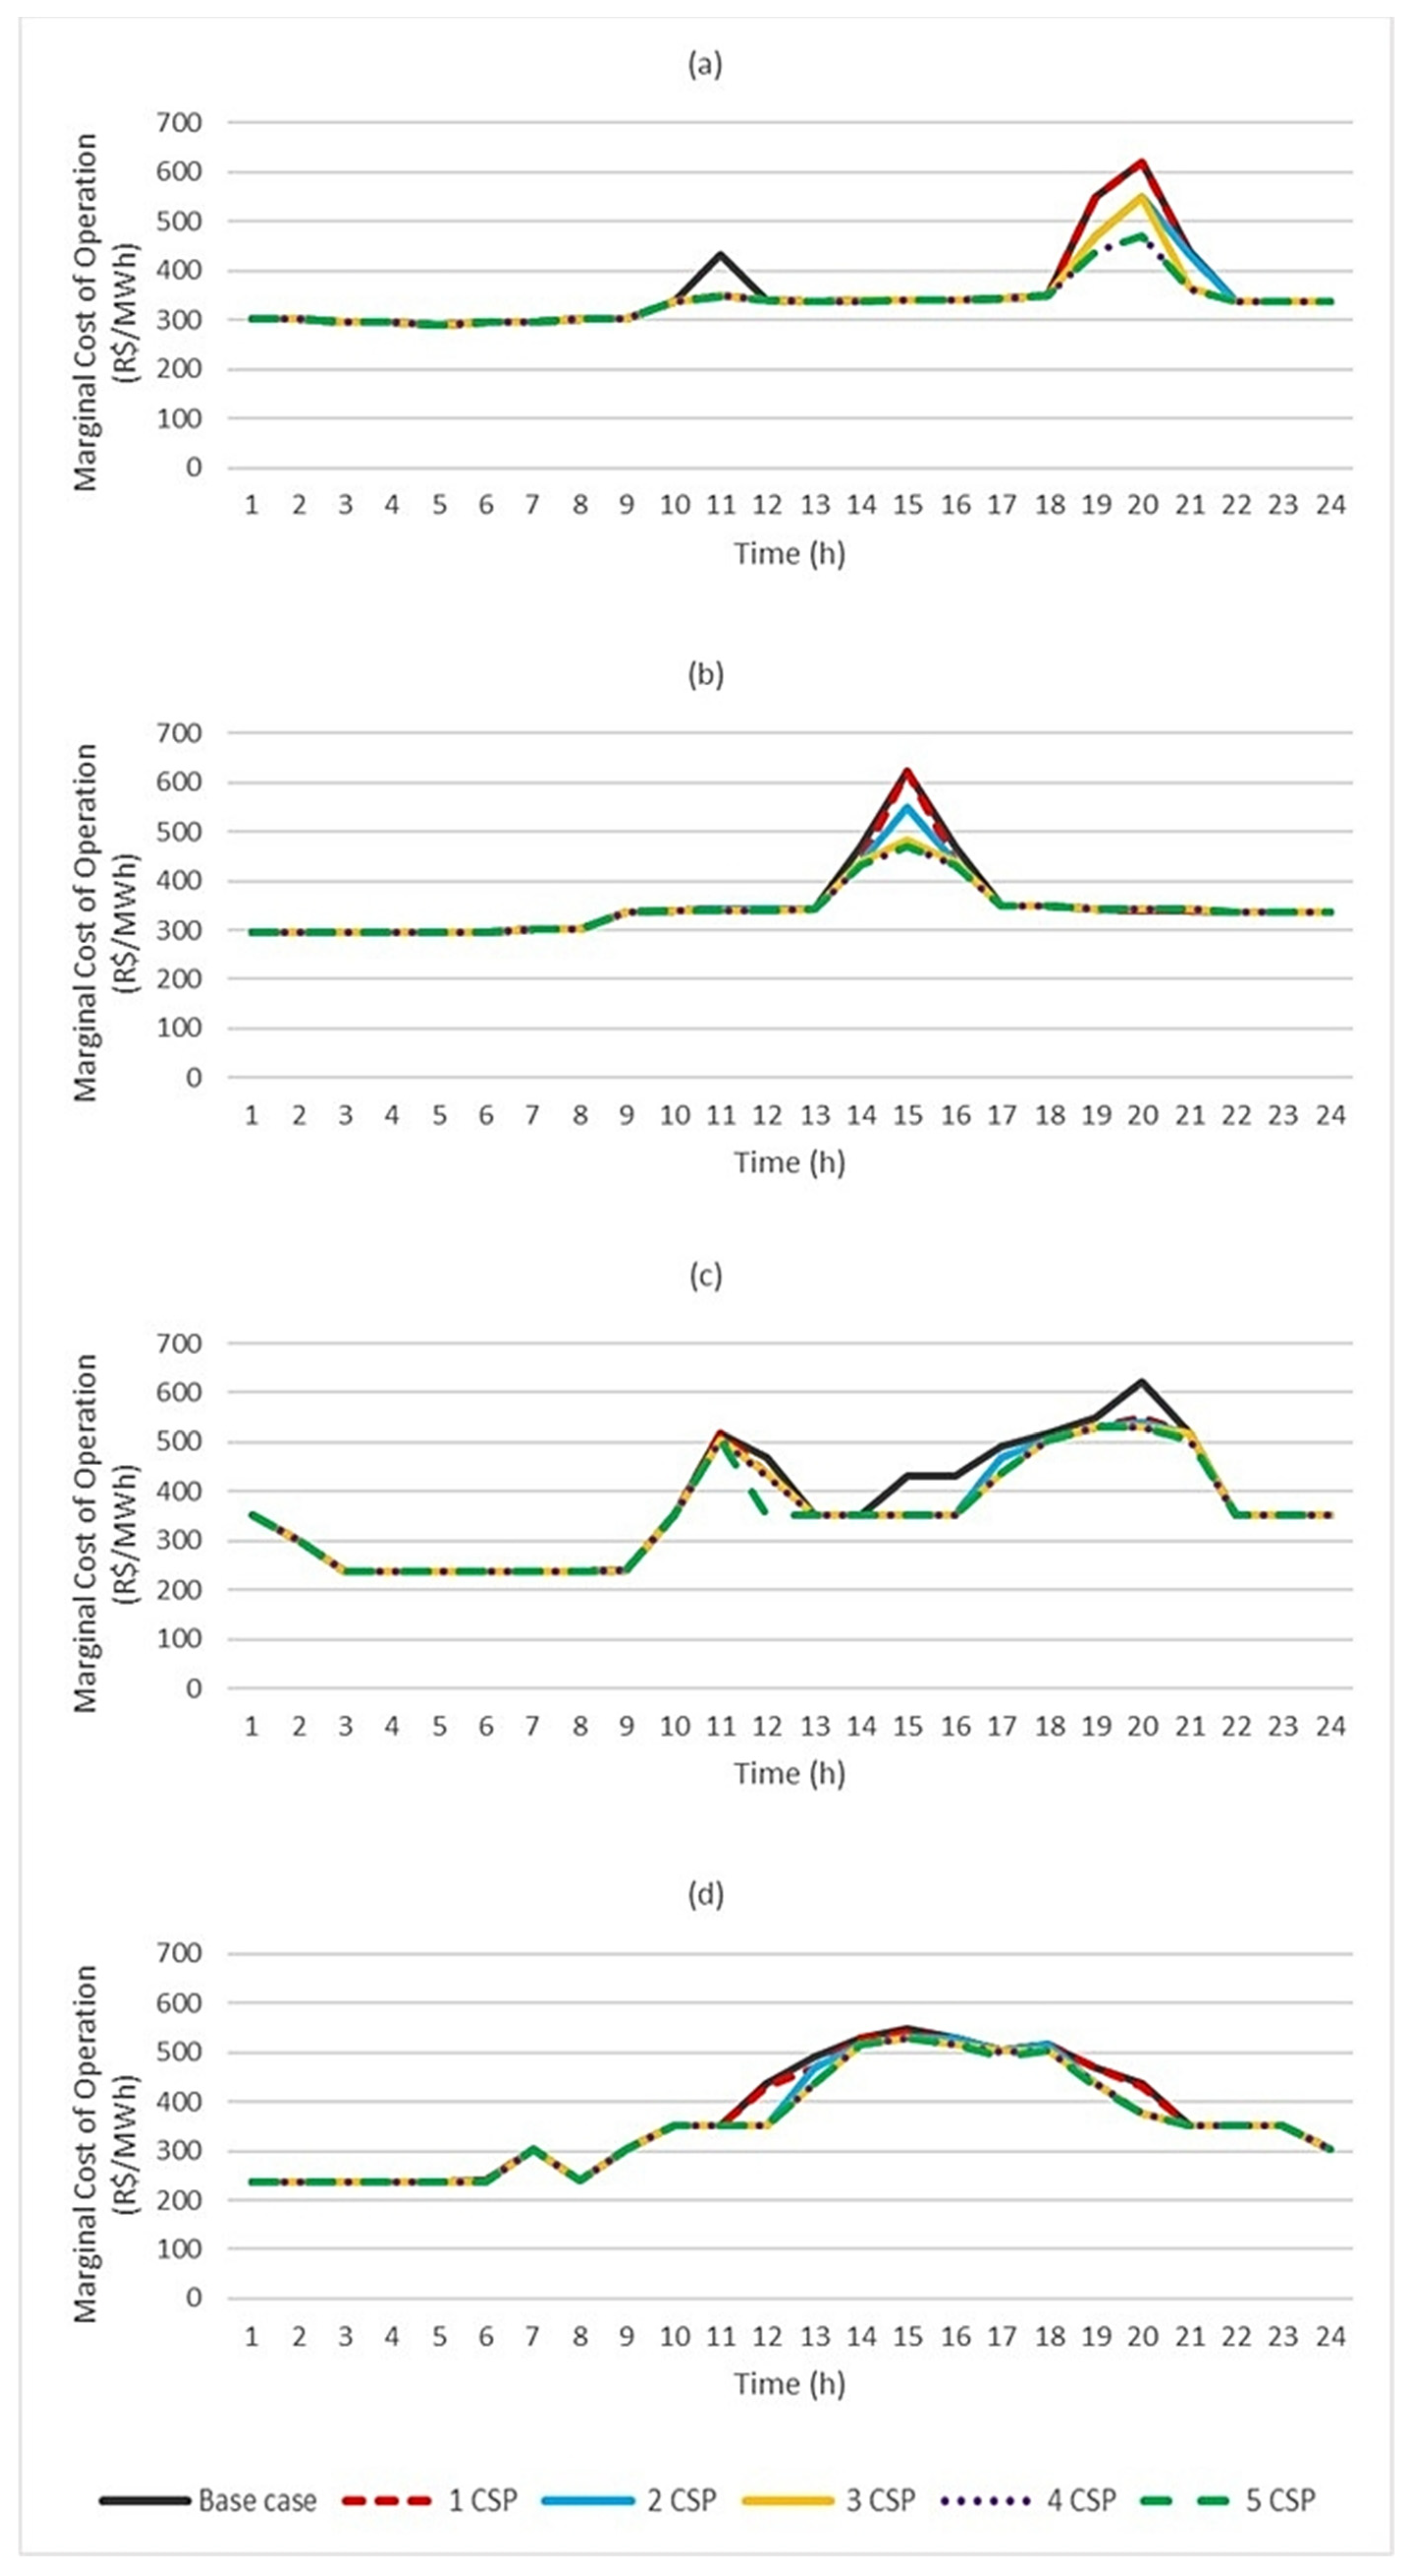
With respect to the marginal operating cost of the system, Figure 8 depicts the reduction achieved during the 24 h period for the typical days used in the simulations. In the wet/night scenario, the introduction of one CSP plant reduced the cost from 432.05 R$/MWh to 350.41 R$/MWh at 10:00 and adding two plants decreased the cost from 621.46 R$/MWh to 548.96 R$/MWh at 19:00. The cost declined to 470.34 R$/MWh with four CSP plants. In the wet/day scenario, the highest marginal operating cost reduction occurred during the period of the highest load, and the introduction of CSP plants reduced the cost from 621.46 R$/MWh to 548.96 R$/MWh, although at 14:00. In the dry/night scenario, the greatest reduction of this cost with the introduction of one CSP plant happened at 14:00 and 15:00, and the cost declined from 431.76 R$/MWh to 350.41 R$/MWh, and also at 19:00, with cost reduction from 621.46 R$/MWh to 548.96 R$/MWh. Finally, in the dry/day scenario, the greatest reduction occurred with the insertion of two CSP plants in the system, from 438.52 R$/MWh to 350.41 R$/MWh at 11:00 and from 438.52 R$/MWh to 376.80 R$/MWh at 19:00. In general, in the dry season scenarios, the impact of CSP plants on the marginal operating cost occurred more often in the day and the introduction of five CSP plants can reduce that cost by up to 26%.
The substitution of other generation technologies due to the insertion of CSP plants in the system is illustrated in Figure 9, where 1 CSP T means the reduction of thermal generation with the addition of one CSP plant to the system, 2 CSP T means the reduction of thermal generation with the addition of two CSP plants to the system, and so on, and analogously, 1 CSP H denotes the reduction of hydroelectric generation with the addition on one CSP plant, and so on. In general, the CSP plants can displace thermoelectric and/or hydroelectric plants in a hydrothermal system. Table 6 reports the reduction, in MW and percentage terms, afforded by each technology by the insertion of one and five CSP plants in the system. With the insertion of one CSP plant in the system in the wet/night scenario, all the reduced thermal generation refers to oil-fired plants and all the reduced hydroelectric generation refers to large hydropower plants. In the same scenario with five CSP plants, 73% of the reduction in the thermal generation refers to oil-fired plants. In the other scenarios, the CSP plants mainly replace the power generated by large hydropower plants. The replacement of hydroelectric generation, mainly in the dry season, means that the value of the water stored in reservoirs is higher than the cost of thermal plants. However, the CSP plants also replace thermoelectric plants, especially oil-fired ones, due to their high cost of fuel, contributing to minimizing the negative environmental impacts.
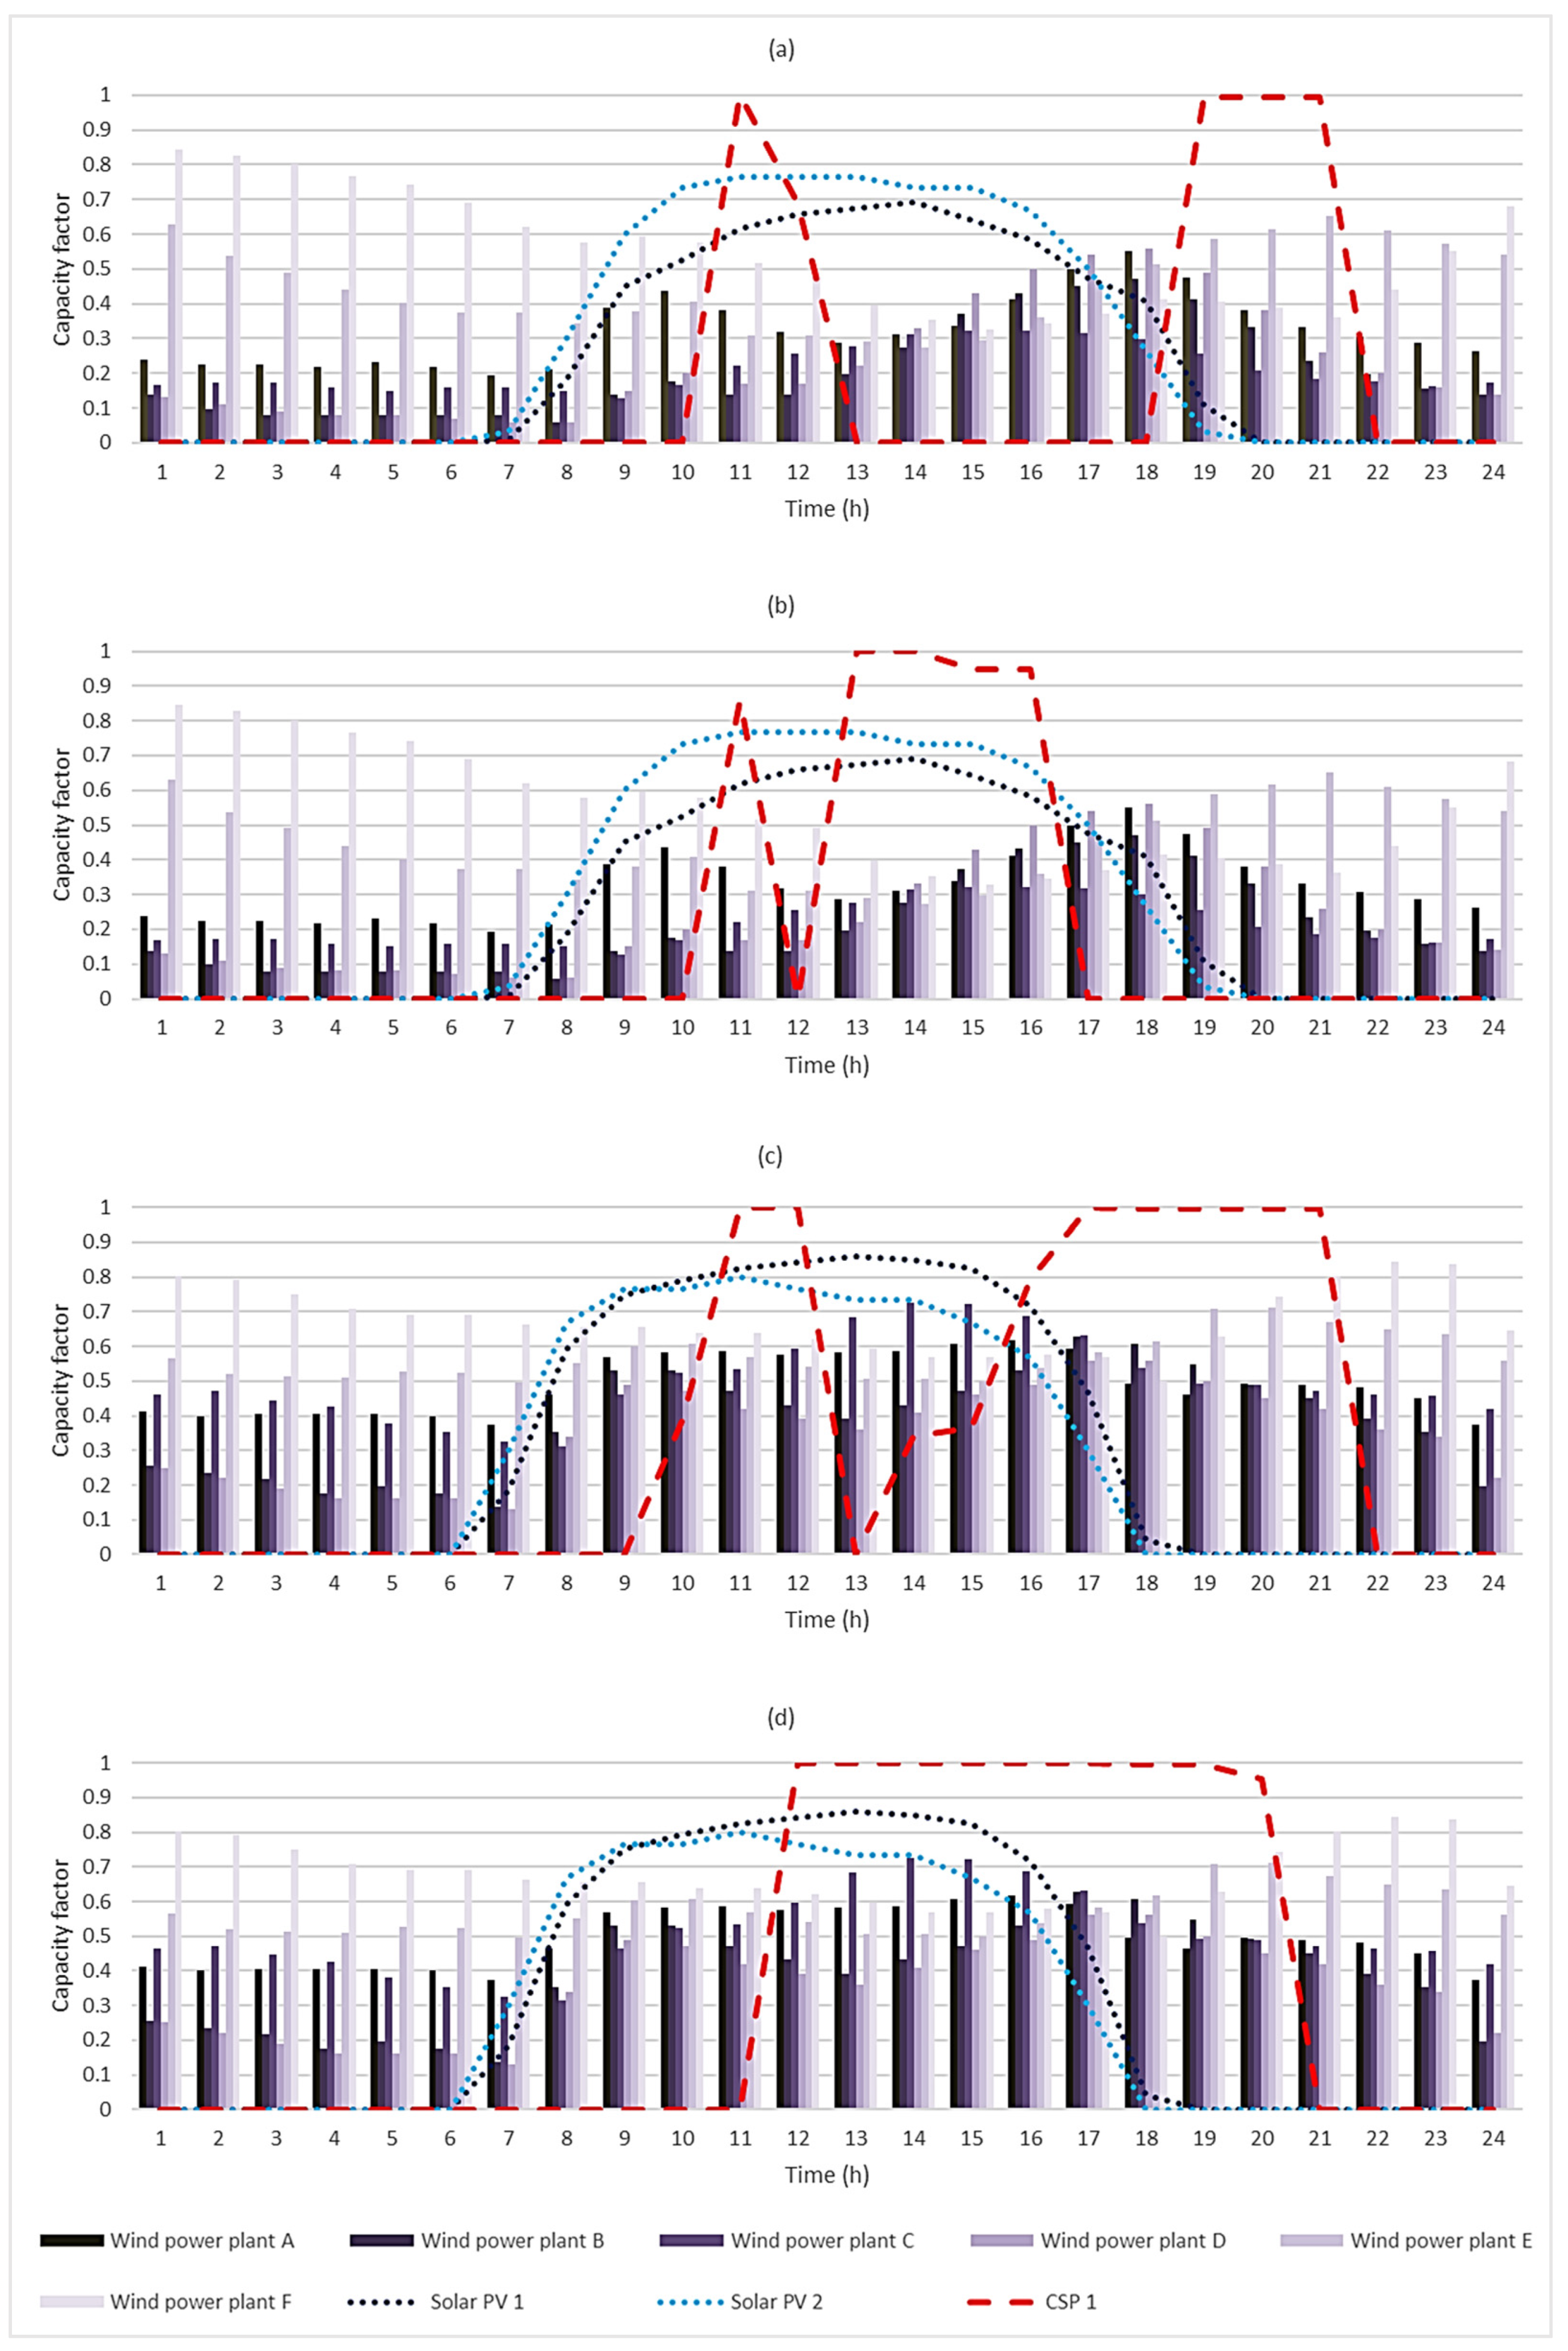
With respect to complementarity with intermittent sources, Figure 10 shows the capacity factor of wind farms, solar PV plants, and CSP 1 at each hour. The storage system of CSP 1 provides a higher capacity factor in comparison to the other plants, especially during critical hours. Besides this, in the wet scenarios, the wind farms and the solar PV plants deliver to the system approximately 65% and 80% of the energy delivered in the dry scenarios, respectively. Therefore, the CSP plant can complement photovoltaic generation in all the scenarios and wind generation mainly in the summer, when the capacity factor of the wind farms is lower.
Table 7 presents the economic benefits afforded by including CSP sets of up to five plants in the system and the corresponding net electricity costs.
To validate the results for capacity credits, avoided energy, and capacity costs that were obtained, the results were compared to those of Denholm and Hummon [8] (reported in Table 1), carried out in a predominantly thermoelectric system for a scenario with 13% of generation supplied by wind and solar PV, similar to the Brazilian system, where the authors inserted a CSP plant also with PTC technology and a 6 h TES system. In relation to the capacity credit, the CCS value of one CSP plant (1 CSP) included in the hydrothermal system varied from 97% to 100%, an interval containing the credit obtained by those authors, equal to 98%. The sets of CSP plants simulated in the hydrothermal system also presented, in the majority of scenarios, high capacity credits (above 90%). This means that even in a system with substantial hydropower generation, CSP plants are activated during the period of the highest net load and they generate electricity with a high capacity factor in this period. With respect to the avoided capacity cost, the lowest value of CEC for a CSP plant (158.99 R$/MWh or approximately 40 US$/MWh) found in this study is similar to the capacity value in [8]: 40.4 US$/MWh. Concerning the avoided energy cost, the lowest CEE of a CSP plant in this study (on average 178 R$/MWh, or approximately 45 US$/MWh) is similar to the operating value in [8]: 42.1 US$/MWh. In this sense, the solar thermal technology with storage can avoid energy and capacity costs even in systems with large hydropower generation.
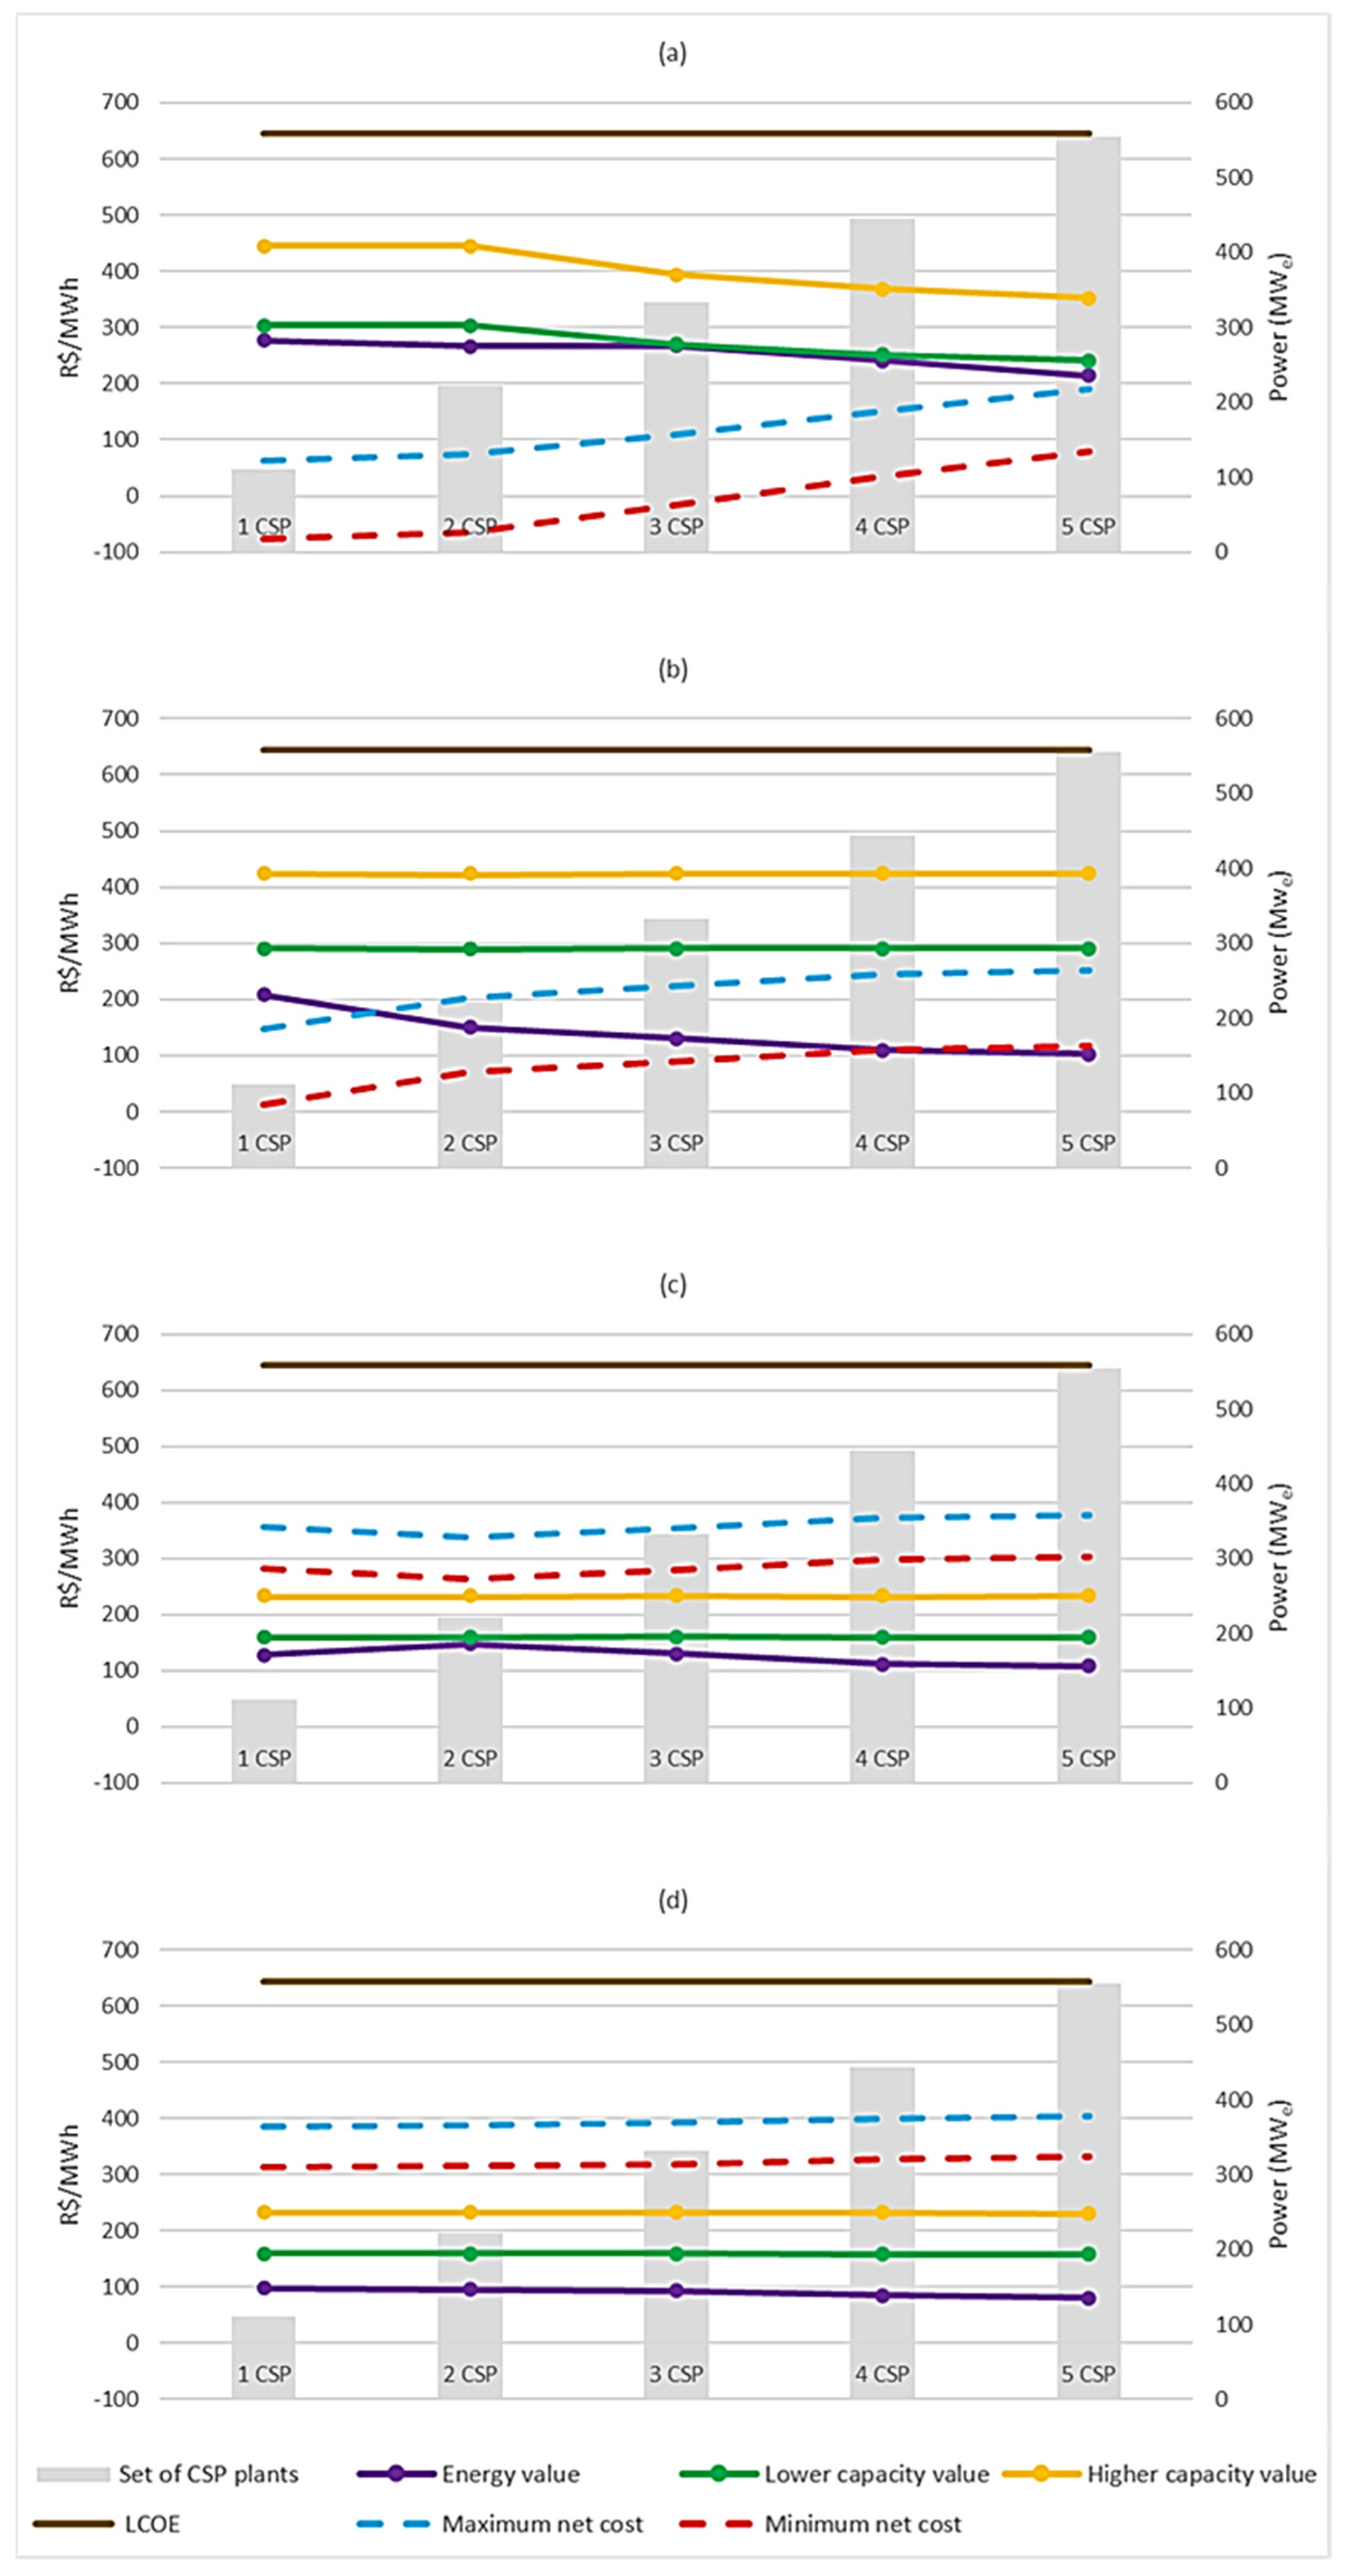
Figure 11 illustrates the costs and benefits of including sets of CSP plants in the hydrothermal system. The energy value curve refers to the CEE, and the lower capacity value and higher capacity value curves correspond to the lowest and highest values of CEC, respectively. The capacity benefits are virtually constant with the insertion of any set of CSP in the scenarios analyzed, the exception being the wet/night scenario, when the capacity credits of the sets with three, four, and five CSP plants decline, in turn reducing the capacity benefits. In general, the energy benefits decrease with the inclusion of a set of two or more CSP plants, due to the lesser substitution of thermoelectric plants, except in the dry/night scenario, when the reduction in the energy benefit occurs with the insertion of at least four CSP plants. In the dry scenarios, the benefits are lower than in the wet scenarios: the lower capacity benefit is due to the greater capacity factor of the CSP plants in the dry season, and the lower energy benefit is due to the greater displacement of hydropower plants, whose fuel cost is zero, in order to store water in the reservoirs. Based on the mentioned results and on the fact that NCE is greater than the benefits with insertion of any CSP plant in the dry scenarios, the addition of up to two CSP plants in the hydrothermal system is recommended.
The addition of CSP plants with storage to the hydrothermal system leads to a reduction in the system’s total operating cost due to a decrease in the variable costs of fuel and O&M. Besides this, the application of the solar thermal technology allows reducing future investments in thermoelectric plants and consequently the fixed costs that are necessary for the maintenance and operation of these generators. CSP plants also complement hydropower generation.
Table 8 presents the maximum and minimum net costs of each CSP plant added to the system in the scenarios with different sets of plants. The NCE of each plant increases with the inclusion of other plants, and the highest value obtained was 405.84 R$/MWh—the maximum NCE of CSP plants 2 and 4 with five CSP plants in operation in the dry/day scenario. Thus, the cost of a CSP plant, previously estimated by the LCOE at 644.64 R$/MWh, can be reduced by at least 37%.
The importance of systemic benefits should be considered in the analysis of economic feasibility. The cost of power generated by CSP plants significantly declines when considering the benefits of the energy and capacity supplied by each plant in the system, showing that the use of the LCOE as an indicator to make the decision for the most economical new plants in the system is not adequate. The cost of electricity generation from competing technologies should also consider the possible energy and capacity benefits to the system. In the dry/day scenario, when CSP aggregates lower value to the system, the maximum NCE of each plant is, on average, 398 R$/MWh. This net cost is still high compared to the LCOE of other generation technologies, but it can change the scenario for the choice of new projects and contribute to a more renewable expansion of the system.
CSP plant 1 was also simulated to supply energy and power reserve to the system. This is shown in Figure 12. The plant was able to supply minimum power reserve in the period between 10:00 and 16:00, but its hourly generation during the period, mainly when the highest load occurred during the daytime, decreased by up to 20% in relation to the simulations without supply of power reserve by the CSP. Therefore, CSP plants with storage can also aggregate value to the hydrothermal system due to the supply of power reserve. However, they should be remunerated for this service. A suggestion in this respect is to remunerate the generator at its opportunity cost, what it would earn if the stored energy were sold in the market. Besides providing greater flexibility to the system, this additional benefit could increase the competitiveness of CSP plants with storage in comparison with other intermittent sources without batteries.
The results show that CSP plants can bring benefits to the hydrothermal system and their economic viability may be different when estimated based on the net cost methodology. However, it is important to highlight that the DNI has a strong influence on the performance of the CSP plants. The results reflect the benefits of these plants when installed in the appropriate locations (see Section 3.2.1). The operation of solar thermal technology in other locations, especially outside the Brazilian semi-arid region and with an insufficient DNI index for the development of commercial plants, can reduce power generation and the systemic benefits, increasing the net cost of the CSP plant and compromising its economic viability.

5. Conclusions

Currently, CSP plants are still too expensive when evaluated on an LCOE basis, a usual economic practice that does not capture the benefits of energy generation technologies to the electrical system in terms of energy and economics. CSP plants with TES systems can be considered a dispatchable source (i.e., their power injection in the system can be controlled), contrary to other renewable energy sources, such as wind and photovoltaic plants without batteries. However, this difference is not yet considered in energy pricing models.
Unlike studies that have analyzed the economic benefits provided by CSP plants with storage in predominantly thermoelectric systems, this study evaluated the net cost and added value of CSP plants in a hydrothermal system, with predominantly hydroelectric generation and high energy storage capacity, with application to the real Brazilian system. To this aim, we employed the official day-ahead hydrothermal scheduling and hourly price setting model of the Brazilian hydro–thermal–wind system (DESSEM), and the minimum costs of operating the system with and without the CSP plants were obtained, enabling the calculation of the systemic benefits of CSP in terms of energy and capacity. The modeling of each CSP plant was implemented as a thermoelectric plant with attached storage, located in a separate electrical system connected to the original hydrothermal system.
We included up to five CSP plants in the hydrothermal system, taking into account scenarios with significant differences in inflows and variations in wind and solar generation. The economic benefits and the net cost of electricity were calculated for each plant and each set of plants. In general, the introduction of CSP plants allowed a cost reduction in operating the system, replacement of the thermal generators, and complementarity with intermittent sources. As a conclusion for the system under study, it is recommended to add up to two CSP plants in the considered region.
The results show that the LCOE does not reveal the real cost of each generation technology for the electricity system, since the cost of the CSP plant can decrease by at least 37% if its systemic benefits are considered, increasing its competitiveness with other technologies. The method used to calculate the net cost of electricity from CSP plants can be applied not only to Brazil but also to other regions with sufficient potential for solar thermal generation and inserted in a robust electricity system, such as in Spain. It can be also applied to locations with large potential for the development of CSP plants that need to reduce the high share of non-renewable energy resources in the energy mix, as in Australia, Algeria, Morocco, and India. Finally, for a more appropriate comparison between energy sources, it is also proposed to evaluate generation technologies according to their net cost.

Author Contributions

Conceptualization, A.O.P.J., A.P.C.G. and C.P.T.; methodology, C.P.T. and A.O.P.J.; modeling and software, A.L.D.; formal analysis, A.P.C.G., L.d.S.R.V. and A.O.P.J.; writing—original draft preparation, C.P.T.; writing—review and editing, C.P.T., L.d.S.R.V., A.P.C.G., A.L.D. and A.O.P.J.; supervision, A.O.P.J. All authors have read and agreed to the published version of the manuscript.

Funding

This work was supported by the National Council for Scientific and Technological Development (CNPq)—grant number 140432/2017-5, and CEPEL.

Data Availability Statement

Not applicable.

Acknowledgments

The authors thank the support provided by CNPq and CEPEL for the development of this study through the concession of research grants. The authors also thank Carlos Henrique Medeiros de Sabóia for his contribution with DESSEM model.

Conflicts of Interest

The authors declare no conflict of interest.

References

  1. International Energy Agency. Electricity Security in Tomorrow’s Power Systems. 2020. Available online: https://www.iea.org/articles/electricity-security-in-tomorrow-s-power-systems (accessed on 7 December 2020).
  2. Concentrating Solar Power Alliance. The Economic and Reliability Benefits of CSP with Thermal Energy Storage: Literature Review and Research Needs, Technical Report; CSP Alliance: USA, 2014; Available online: http://www.inship.eu/docs/TES%204%20the_economic_and_reliability_benefits_of_csp_with_thermal_storage_2014_09_09_final.pdf (accessed on 30 August 2021).
  3. Islam, M.T.; Huda, N.; Abdullah, A.B.; Saidur, R. A comprehensive review of state-of-the-art concentrating solar power (CSP) technologies: Current status and research trends. Renew. Sustain. Energy Rev. 2018, 91, 987–1018. [Google Scholar] [CrossRef]
  4. Operador Nacional do Sistema. O Sistema Interligado Nacional. 2020. Available online: http://ons.org.br/pt/paginas/sobre-o-sin/o-que-e-o-sin (accessed on 27 November 2020).
  5. Martins, F.R.; Abreu, S.L.; Pereira, E.B. Scenarios for solar thermal energy applications in Brazil. Energy Policy 2012, 48, 640–649. [Google Scholar] [CrossRef]
  6. Trieb, F.; Schillings, C.; O‘Sullivan, M.; Pregger, T.; Hoyer-Klick, C. Global potential of concentrating solar power. In Proceedings of the 15th SolarPACES International Conference, Berlin, Germany, 15–18 September 2009. [Google Scholar]
  7. Denholm, P.; Mehos, M. Enabling Greater Penetration of Solar Power via the Use of CSP with Thermal Energy Storage, Technical Report; NREL: Golden, CO, USA, 2011; NREL/TP-6A20-52978. [Google Scholar]
  8. Denholm, P.; Hummon, M. Simulating the Value of Concentrating Solar Power with Thermal Energy Storage in a Production Cost Model, Technical Report; NREL: Golden, CO, USA, 2012; NREL/TP-6A20-56731. [Google Scholar]
  9. Denholm, P.; Wan, Y.; Hummon, M.; Mehos, M. An Analysis of Concentrating Solar Power with Thermal Energy Storage in a California 33% Renewable Scenario, Technical Report; NREL: Golden, CO, USA, 2013; NREL/TP-6A20-58186. [Google Scholar]
  10. Jorgenson, J.; Denholm, P.; Mehos, M.; Turchi, C. Estimating the Performance and Economic Value of Multiple Concentrating Solar Power Technologies in a Production Cost Model, Technical Report; NREL: Golden, CO, USA, 2013; NREL/TP-6A20-58645. [Google Scholar]
  11. Jorgenson, J.; Denholm, P.; Mehos, M. Estimating the Value of Utility-Scale Solar Technologies in California Under a 40% Renewable Portfolio Standard, Technical Report; NREL: Golden, CO, USA, 2014; NREL/TP-6A20-61685. [Google Scholar]
  12. Brand, B.; Stambouli, A.B.; Zejli, D. The value of dispatchability of CSP plants in the electricity systems of Morocco and Algeria. Energy Policy 2012, 47, 321–331. [Google Scholar] [CrossRef] [Green Version]
  13. Helseth, A.; Melo, A.C.G. Scheduling Toolchains in Hydro-Dominated Systems: Evolution, Current Status and Future Challenges for Norway and Brazil, Technical Report; SINTEF Energy Research: Norway, August 2020; SINTEF/ 2020:00757; Available online: https://sintef.brage.unit.no/sintef-xmlui/bitstream/handle/11250/2672581/2020-00757.pdf?sequence=2&isAllowed=y (accessed on 30 August 2021).
  14. Blair, N.; DiOrio, N.; Freeman, J.; Gilman, P.; Janzou, S.; Neises, T.; Wagner, M. System Advisor Model (SAM General Description (Version 2017.9.5), Technical Report; NREL: Golden, CO, USA, 2018; NREL/ TP-6A20-70414. [Google Scholar]
  15. Santos, T.N.; Diniz, A.L.; Saboia, C.H.; Cabral, R.N.; Cerqueira, L.F. Hourly pricing and day-ahead dispatch setting in Brazil: The dessem model. Electr. Power Syst. Res. 2020, 189, 106709. [Google Scholar] [CrossRef]
  16. Edenhofer, O.; Hirth, L.; Knopf, B.; Pahle, M.; Schlömer, S.; Schmid, E.; Ueckerdt, F. On the economics of renewable energy sources. Energy Econ. 2013, 40, S12–S23. [Google Scholar] [CrossRef]
  17. Ueckerdt, F.; Hirth, L.; Luderer, G.; Edenhofer, O. System LCOE: What are the costs of variable renewables? Energy 2013, 63, 61–75. [Google Scholar] [CrossRef]
  18. Dowling, A.W.; Zheng, T.; Zavala, V.M. Economic assessment of concentrated solar power technologies: A review. Renew. Sustain. Energy Rev. 2017, 72, 1019–1032. [Google Scholar] [CrossRef]
  19. U.S. Energy Information Administration. Levelized Cost and Levelized Avoided Cost of New Generation Resources in the Annual Energy Outlook 2020. Available online: https://www.eia.gov/outlooks/aeo/pdf/electricity_generation.pdf (accessed on 3 December 2020).
  20. National Renewable Energy Laboratory. A Manual for the Economic Evaluation of Energy Efficiency and Renewable Energy Technologies. 1995. Available online: https://www.nrel.gov/docs/legosti/old/5173.pdf (accessed on 7 December 2020).
  21. Joskow, P.L. Comparing the Costs of Intermittent and Dispatchable Electricity Generating Technologies. Am. Econ. Rev. Pap. Proc. 2011, 101, 238–241. [Google Scholar] [CrossRef] [Green Version]
  22. International Energy Agency. Projected Costs of Generating Electricity, 2015 ed.; IEA: Paris, France, 2015. [Google Scholar]
  23. Hirth, L. The market value of variable renewables: The effect of solar wind power variability on their relative price. Energy Econ. 2013, 38, 218–236. [Google Scholar] [CrossRef] [Green Version]
  24. Hirth, L.; Uecherdt, F.; Edenhofer, O. Integration costs revisited—An economic framework for wind and solar variability. Renew. Energy 2015, 74, 925–939. [Google Scholar] [CrossRef]
  25. International Renewable Energy Agency. Renewable Power Generation Costs in 2019; IRENA: Abu Dhabi, United Arab Emirates, 2020; ISBN 978-92-9260-244-4. [Google Scholar]
  26. Gauché, P.; Backström, T.; Brent, A.; Rudman, J. CSP Opportunity and Challenges in a National System: The WWF Renewable Vision for a 2030 South African Electricity Mix. AIP Conf. Proc. 2016, 1734, 080002. [Google Scholar] [CrossRef] [Green Version]
  27. Musi, R.; Grange, B.; Sgouridis, S.; Guedez, R.; Armstrong, P.; Slocum, A.; Calvet, N. Techno-Economic Analysis of Concentrated Solar Power Plants in Terms of Levelized Cost of Electricity. AIP Conf. Proc. 2017, 1850, 160018. [Google Scholar] [CrossRef] [Green Version]
  28. Zhao, Z.Y.; Chen, Y.L.; Thomson, J.D. Levelized cost of energy modeling for concentrated solar power projects: A China study. Energy 2017, 120, 117–127. [Google Scholar] [CrossRef]
  29. Kassem, A.; Al-Haddad, K.; Komljenovic, D. Concentrated solar thermal power in Saudi Arabia: Definition and simulation of alternative scenarios. Renew. Sustain. Energy Rev. 2017, 80, 75–91. [Google Scholar] [CrossRef]
  30. San Miguel, G.; Corona, B. Economic viability of concentrated solar power under different regulatory frameworks in Spain. Renew. Sustain. Energy Rev. 2018, 91, 205–218. [Google Scholar] [CrossRef]
  31. Ling-zhi, R.; Xin-gang, Z.; Xin-xuan, Y.; Yu-zhuo, Z. Cost-benefit evolution for concentrated solar power in China. J. Clean. Prod. 2018, 190, 471–482. [Google Scholar] [CrossRef]
  32. Aly, A.; Bernardos, A.; Fernandez-Peruchena, C.M.; Jensen, S.S.; Pedersen, A.B. Is Concentrated Solar Power (CSP) a feasible option for Sub-Saharan Africa?: Investigating the techno-economic feasibility of CSP in Tanzania. Renew. Energy 2019, 135, 1224–1240. [Google Scholar] [CrossRef]
  33. Mena, R.; Escobar, R.; Lorca, A.; Negrete-Pincetic, M.; Olivares, D. The impact of concentrated solar power in electric power systems: A Chilean case study. Appl. Energy 2019, 235, 258–283. [Google Scholar] [CrossRef]
  34. Mills, A.; Wiser, R. An Evaluation of Solar Valuation Methods Used in Utility Planning and Procurement Processes; Ernest Orlando Lawrence Berkeley National Laboratory: Berkeley, CA, USA, 2012; LBNL-5933E. [Google Scholar]
  35. Madaeni, S.H.; Sioshansi, R.; Denholm, P. Capacity Value of Concentrating Solar Power Plants, Technical Report; NREL: Golden, CO, USA, 2011; NREL/TP-6A20-51253. [Google Scholar]
  36. Denholm, P.; Jorgenson, J.; Miller, M.; Zhou, E.; Wang, C. Methods for Analyzing the Economic Value of Concentrating Solar Power with Thermal Energy Storage, Technical Report; NREL: Golden, CO, USA, 2015; NREL/TP-6A20-64256. [Google Scholar]
  37. Mehos, M.; Jorgenson, J.; Denholm, P.; Turchi, C. An assessment of the net value of CSP systems integrated with thermal energy storage. Energy Procedia 2015, 69, 2060–2071. [Google Scholar] [CrossRef] [Green Version]
  38. National Renewable Energy Laboratory. System Advisor Model (Version 2018.11.11). 2020. Available online: https://sam.nrel.gov/ (accessed on 3 March 2020).
  39. Guimarães, A.P.C.; Vieira, L.S.R.; Serra, E.T.; Melo, S.R.F.C.; Macedo, N.G.L. Caracterização de Localidades do Semiárido para Implantação de um Sistema Piloto Heliotérmico de Geração Elétrica. In Proceedings of the III Congresso Brasileiro de Energia Solar, Belém, PA, Brazil, 21–24 September 2010. [Google Scholar]
  40. International Energy Agency. Technology Roadmap Solar Thermal Electricity, 2014 ed.; IEA: Paris, France, 2014. [Google Scholar]
  41. Ministério da Ciência, Tecnologia e Inovação; Deutsche Gesellschaft für Internationale Zusammenarbeit. Thermal Storage CSP Technology State of the Art and Market Overview, Projeto Energia Heliotérmica; MCTI-GIZ: Brasília, GO, Brazil, 2014. [Google Scholar]
  42. Tavares, R.F.A.M. Hibridização de Energia Heliotérmica com Gaseificação de Biomassa Para Geração de Energia Elétrica. Master’s Thesis, Federal University of Rio de Janeiro, Rio de Janeiro, RJ, Brazil, February 2016. [Google Scholar]
  43. Empresa de Pesquisa Energética. Premissas e Custos da Oferta de Energia Elétrica no Horizonte 2050, Nota Técnica PR 07/18; EPE: Rio de Janeiro, RJ, Brazil, 2018. [Google Scholar]
  44. Operador Nacional do Sistema. Resultados da Operação—Boletins da Operação. 2020. Available online: http://www.ons.org.br/paginas/resultados-da-operacao/boletins-da-operacao (accessed on 22 December 2020).
  45. Câmara de Comercialização de Energia Elétrica. Custo Variável Unitário. 2020. Available online: https://www.ccee.org.br/portal/faces/pages_publico/o-que-fazemos/como_ccee_atua/receita_vendas (accessed on 28 December 2020).
  46. Empresa de Pesquisa Energética. Plano Nacional de Energia 2030—Geração Termelétrica: Petróleo e Derivados; EPE: Rio de Janeiro, RJ, Brazil, 2007. [Google Scholar]
  47. Câmara de Comercialização de Energia Elétrica. Leilão. 2021. Available online: https://www.ccee.org.br/portal/faces/acesso_rapido_header_publico_nao_logado/biblioteca_virtual (accessed on 31 January 2021).
Figure 1. Methodological steps used in the case study.
Energies 14 05662 g001
Figure 2. Effect of solar multiple and thermal storage on the LCOE.
Energies 14 05662 g002
Figure 3. One-day load curves.
Energies 14 05662 g003
Figure 4. Process of implementing CSP. Adapted from [11].
Energies 14 05662 g004
Figure 5. Inclusion of CSP plants in the hydrothermal system. H, hydroelectric plants; T, thermoelectric plants; W, wind farms; PV, solar PV power plants; E, energy exchange.
Energies 14 05662 g005
Figure 6. Operation of CSP plant 1 in the following scenarios: wet/night (a), wet/day (b), dry/night (c), and dry/day (d).
Energies 14 05662 g006
Figure 7. Load and generation of five CSP plants in the hydrothermal system in the following scenarios: wet/night (a), wet/day (b), dry/night (c), and dry/day (d).
Energies 14 05662 g007
Figure 8. Marginal operating cost of the hydrothermal system in the following scenarios: wet/night (a), wet/day (b), dry/night (c), and dry/day (d).
Energies 14 05662 g008
Figure 9. Reduction in thermal and hydroelectric generation in the following scenarios: wet/night (a), wet/day (b), dry/night (c), and dry/day (d).
Energies 14 05662 g009
Figure 10. Capacity factor of wind farms, photovoltaic plants, and CSP 1 in the following scenarios: wet/night (a), wet/day (b), dry/night (c), and dry/day (d).
Energies 14 05662 g010
Figure 11. Economic benefits and the net cost of sets of CSP plants in the hydrothermal system in the following scenarios: wet/night (a), wet/day (b), dry/night (c), and dry/day (d).
Energies 14 05662 g011
Figure 12. Operation of CSP plant 1 with power reserve in the following scenarios wet/night (a) and wet/day (b).
Energies 14 05662 g012
Table 1. Operational and capacity values of CSP plants in thermal systems.
ReferencePlace/YearScenario
(% RE a)
TechnologyOperational Value ($/MWh)Capacity Credit (%)Capacity Value (Low/High) ($/MWh)
[8]Colorado/202013%Baseload33.31008.8/16.8
PV36.67029.7/56.6
CSP (PTC b/without TES)35.57529.1/55.3
CSP (PTC/6 h TES)42.19821.2/40.4
34%Baseload25.21008.8/16.8
PV22.3135.3/10.1
CSP (PTC/without TES)18.931.3/2.4
CSP (PTC/6 h TES)35.67817.1/32.6
[9]California/202033%Baseload60.61006.3/24.7
PV53.94710.7/41.3
CSP (PTC/6 h TES/without reserves)66.2--
CSP (PTC/6 h TES/with reserves)83.010013.6/ 52.3
[10]Colorado/202016%CSP (PTC/6 h TES)45.0--
CSP (ST c/without TES)34.0--
CSP (ST/3–12 h TES)41.0–48.010014.3–56.6
[11]California/202233%PV31.92215.2/26.3
CSP (ST/6 h TES)46.692.847.9/60.8
40%PV29.83.42.4/17.6
CSP (ST/6 h TES)48.096.649.8/63.1
a Percentage of renewable generation (mainly wind and solar PV) in each scenario. b Parabolic-trough collector. c Solar tower.
Table 2. Technical parameters of CSP plants.
ParameterValue
Solar field
TechnologyPTC
SM1.5
Irradiation at design750 W/m²
HTFTherminol VP-1
Field HTF min. operating temperature12 °C
Field HTF max. operating temperature400 °C
Collector modelSkyfuel SkyTrough (with an 80 mm OD receiver)
Receiver modelSchott PTR80
TES
Parallel tank pairs1
Storage HTF fluidHitec Solar Salt
Full load hours6
Power cycle
Installed capacity111 MWe
Efficiency (gross)39.3%
Design inlet temperature391 °C
Design outlet temperature293 °C
Min turbine operation0.25
Boiler operating pressure100 bar
Cooling type Wet
Table 3. Economic parameters used in the simulations [42,43].
ParameterValue
Analysis period30 years
Real discount rate8%/year
Internal rate of return11%/year
Federal income tax rate34%/year
Sales tax5% of total cost
Insurance rate0.5% of total cost
Amortization period16 years
Construction time5 years
Interest rate7.4%/year
Fraction of loan debt70%
Depreciation modeStraight line
Depreciation period15 years
Table 4. Specific costs of PTC technology [38].
ParameterValue
Solar field150 US$/m²
HTF system60 US$/m²
Storage62 US$/kWht
Power plant910 US$/kWe
Balance of plant90 US$/kWe
Contingency10%
Fixed cost by capacity66 US$/kW-year
Variable cost by generation4 US$/MWh
Table 5. Annualized fixed investment cost of a peaker plant.
TechnologyFCpeak ($/MW/yr)
Hydroelectric power plants
Medium size173,311
Large size132,095
Thermal power plants
Oil 193,741
Natural gas126,482
Note: Medium-size hydroelectric plants have capacities between 300 MW and 1000 MW, and large ones have capacities greater than 1000 MW.
Table 6. Reduction in thermal and hydroelectric generation with the insertion of 1 CSP and 5 CSP in the hydrothermal system.
Technology—Reduction in Generation
Thermal Power PlantsHydroelectric Power Plants
ScenarioSet of CSP PlantsOilNatural GasSmall SizeMedium SizeLarge Size
(MWe)%(MWe)%(MWe)%(MWe)%(MWe)%
Wet/night1 CSP289100000000229100
5 CSP939733562791700123393
Wet/day1 CSP106481145251170025883
5 CSP315522924885400194796
Dry/night1 CSP2347963213450065395
5 CSP1265832551761200333898
Dry/day1 CSP8738142622030074497
5 CSP848703653061200371398
Table 7. Economic benefits and the net cost of sets of CSP plants in the hydrothermal system.
ScenarioSet of CSP PlantsCEE (R$/MWh)CCS (%)CEC (Low/High) (R$/MWh)NCE (Maximum/Minimum) (R$/MWh)
Wet/night1 CSP276.8599303.96/444.4363.83/−76.64
2 CSP266.1899303.96/444.4374.50/−65.97
3 CSP267.2589269.27/393.70108.12/−16.31
4 CSP240.9683251.68/367.99152.00/35.69
5 CSP213.8680241.18/352.63189.61/78.15
Wet/day1 CSP207.7497290.27/424.42146.63/12.49
2 CSP150.3197290.47/424.41204.06/69.92
3 CSP130.3997290.47/424.41223.98/89.83
4 CSP109.5897290.47/424.41244.79/110.65
5 CSP102.8397290.47/424.41251.54/117.39
Dry/night1 CSP128.1599160.30/234.37356.20/282.12
2 CSP147.3599160.30/234.37336.99/262.91
3 CSP130.2299160.30/234.38354.12/280.05
4 CSP111.9499160.30/234.37372.40/298.32
5 CSP107.7199160.30/234.38376.63/302.55
Dry/day1 CSP98.30100159.76/233.59386.58/312.75
2 CSP95.41100159.74/233.56389.48/315.66
3 CSP93.20100159.32/232.95392.12/318.49
4 CSP85.26100159.12/232.65400.26/326.73
5 CSP80.51100158.99/232.47405.14/331.66
Table 8. Net cost of each CSP plant in the scenarios and sets of plants considered.
ScenarioCSP PlantSets of CSP Plants
1 CSP2 CSP3 CSP4 CSP5 CSP
NCE (Max/Min) (R$/MWh)NCE (Max/Min) (R$/MWh)NCE (Max/Min) (R$/MWh)NCE (Max/Min) (R$/MWh)NCE (Max/Min) (R$/MWh)
Wet/nightCSP 163.83/−76.6474.50/−65.97103.87/−22.46129.53/3.20156.38/30.05
CSP 2-74.50/−65.97103.87/−22.46142.21/21.54168.96/48.27
CSP 3--116.62/−4.03129.53/3.20232.69/140.52
CSP 4---206.14/113.97232.69/140.52
CSP 5----156.38/30.05
Wet/dayCSP 1146.63/12.49204.05/69.91223.98/89.84244.79/110.64251.53/117.39
CSP 2-204.06/69.92223.97/89.83244.79/110.65251.54/117.40
CSP 3--223.97/89.83244.79/110.64251.53/117.39
CSP 4---244.79/110.64251.53/117.39
CSP 5----251.53/117.39
Dry/nightCSP 1356.20/282.12336.99/262.91354.12/280.05372.40/298.32376.63/302.55
CSP 2-336.99/262.91354.13/280.05372.40/298.32376.63/302.56
CSP 3--354.12/280.05372.40/298.32376.63/302.55
CSP 4---372.40/298.32376.63/302.55
CSP 5----376.63/302.55
Dry/dayCSP 1386.58/312.75389.36/315.50391.33/317.47399.51/325.75403.89/330.03
CSP 2-389.61/315.82391.62/317.85401.17/327.92405.84/332.59
CSP 3--393.39/320.13399.18/325.32404.67/331.06
CSP 4---401.17/327.92405.84/332.59
CSP 5----405.43/332.04
Publisher’s Note: MDPI stays neutral with regard to jurisdictional claims in published maps and institutional affiliations.

