Article

Wind Energy Analysis in the Coastal Region of Bangladesh

1
Environmental Assessment and Technology for Hazardous Waste Management Research Center, Faculty of Environmental Management, Prince of Songkla University, Hat Yai, Songkhla 90110, Thailand
2
Department of Mechanical and Mechatronics Engineering, Faculty of Engineering, Prince of Songkla University, Hat Yai, Songkhla 90112, Thailand
3
Solar and wind Energy Research Laboratory, Thaksin University, Phatthalung 93110, Thailand
4
Geo-Informatics and Space Technology Development Agency (GISTDA), Chonburi 20230, Thailand
5
Faculty of Business Administration, King Mongkut’s Institute of Technology Ladkrabang, Bangkok 10520, Thailand
*
Authors to whom correspondence should be addressed.
Energies 2021, 14(18), 5628; https://doi.org/10.3390/en14185628
Submission received: 17 July 2021 / Revised: 27 August 2021 / Accepted: 31 August 2021 / Published: 7 September 2021
(This article belongs to the Special Issue Advanced Analytics in Renewable Energy)

Abstract

:
Diversifying the energy mix of Bangladesh is becoming indispensable not only to improve its energy security, but also for a more sustainable economic development. This study focused on mapping the wind potential of southern coastal areas of Bangladesh to estimate the wind energy potential, along with the reduction in carbon emissions due to wind energy. Analysis of the carbon footprint was based on the annual energy production (AEP) from the selected low-wind turbine generators (WTGs). The time series-measured and -predicted wind data were incorporated with the high-resolution mesoscale and microscale wind re-source mapping technique at 60, 80, and 100 m above ground level (AGL). Coupling mesoscale and microscale modeling provided reliable mapping results for the commercially exploitable wind resource and was verified by ground-based wind measurement. The results revealed that, among the selected areas, two sites named Charfashion and Monpura have a promising annual mean wind speed of 7.3 m/s at 100 m AGL for energy generation. Different WTGs with ranges of 1–3.3 MW were used to estimate the wind energy generation capacity at different sites in the study area. A WTG with a 1 MW wind energy generation capacity installed at 60 m AGL in the selected site has the potential to produce 2.79 GWh/year of clean energy, reducing 1781.689 tons of CO2 per year, whereas a 3.3 MW WTG at 80 m AGL can produce 18.99 GWh/year of energy, reducing 12,098.54 tons of CO2 per year, and a 1.6 MW WTG at 100 m AGL produces 11.04 GWh/year of energy, cutting 7035.028 tons of CO2 per year. With its reliable scientific and time-tested wind energy estimation method, this research is very important for the development of wind energy in the southern coastal areas of Bangladesh to meet the increasing energy demands through initiating the development of renewable energy to improve the energy security and reduce the carbon emissions of the country.

1. Introduction

Wind energy, along with solar energy, is among the fastest-growing renewable energy sources and destined to become the backbone of the future zero-carbon energy system. Due to fossil-based fuels being a global threat to the existence of humankind, a durable and sustainable energy transition mechanism for energy generation is needed. Wind resources are one of these sustainable energy sources, and estimates can be developed in several ways [1]. To test the potential of a particular area or site, high-resolution wind speed maps have to be developed. Wind resource maps are a tool that hold simulated wind speed data for a given area, which are usually correlated with the real wind speed data recorded from local meteorological stations. Wind maps can help identify potentially promising locations, aid utilities with long-range planning, and assist governments in formulating sustainable energy policy [2].
With increasing installations and technological innovations, wind energy has already become a cheaper alternative to coal and oil as an energy source [3] and is being increasingly considered as a preferred choice for energy production due to its wide accessibility, low investment cost, and so forth [4]. Wind energy, as one of the most productive renewable energy sources, is thus considered for energy generation in both developed and developing countries in order to tackle the growing environmental challenges, such as atmospheric pollution and global warming, while ensuring energy security and justice.
Bangladesh, as a developing economy, fulfills most of its energy requirements from fossil fuels, which are not only responsible for greenhouse gas (GHG) emissions, but also undermine the energy security of the country due to supply shortages, as the fossil fuels are imported from other countries. To meet the growing demand, Bangladesh’s government has to import electricity from neighboring countries such as India and Nepal [5]. In addition, natural gas accounts for 75% of the country’s electricity generation, followed by coal, which is both expensive and polluting. Bangladesh should opt for diversifying its energy through the induction of local renewable energy sources not only to improve its energy security, but also to decrease its carbon footprint, thereby fulfilling the Sustainable Development Goals (SDGs) proposed by the United Nations at the Paris Agreement (CoP21) in 2015.
The development of wind energy, along with other alternative energy sources such as solar energy, needs to be accelerated in Bangladesh to diversify its energy mix and to relieve the reliance on imported fossil fuels, thereby establishing a pathway toward energy transition. Long-time wind speed data are essential for the development of wind energy projects, but it has been found that the wind speed data recorded by the Bangladesh Meteorological Department (BMD) are not consistent and are high in terms of data analysis for theoretical power generation. Yet, some coastal studies have shown that the mean annual wind speeds are as high as 6.5 m/s recorded at 50 m above ground level (AGL) [6]. Several potential sites with higher wind speeds remain undiscovered due to a lack of sufficient wind speed data. All of the necessary mechanisms are to be employed in these areas so that the potential can be assessed. Bangladesh lacks a comprehensive high-resolution wind resource map, particularly of its coastal and offshore areas, which offer greater wind speeds, which is severely hindering the country’s prospects of wind development. A detailed assessment of the wind speeds of Bangladesh’s coastal areas through wind mapping and data analysis using different scientific models is thus very important for both de-carbonizing the environment and meeting the country’s growing energy demands. As the wind speeds in coastal areas are much higher than across the mainland [7], attention should be given to investigating the coastal areas of the country.
This research is focused on mapping the wind energy potential of the coastal areas of Bangladesh, employing time series wind speed data via reliable scientific techniques to utilize the data for estimating the annual energy production (AEP) from different types of low-wind speed wind turbines at different altitudes. The estimation of AEP using low-wind speed wind turbines at different altitudes is a novel idea, as it has not been carried out before in Bangladesh. This work also includes a calculation of the carbon footprint, which will play an important role in the global CO2 mitigation movement. This research is of paramount importance for Bangladesh in terms of energy transition, as it will help the country develop its wind energy resources to expand its energy mix, improve its energy security, and reduce its carbon footprint.

2. Methodology

This study incorporated the most well-recognized and suitable tools and methods. The related mathematical models, along with mapping techniques, are presented in this section.

2.1. Data Sources and Input Data

Wind data from both meteorological stations (where data are usually measured in time series of 1 min averaged data) and satellite (15 years (2001–2015) of predicted data) for the coastal areas of Bangladesh were used in this research. For the measured wind data, there are many instruments in meteorological stations that adopt the process of measuring. Traditionally, a cup anemometer (anemometer is the common name of the instrument used for measuring wind speed) is used for this purpose, comprised of three or four cups usually of conical shape placed on their sides at equal angles, which are then attached to a central mast that allows the cups to spin freely. The cups rotate when the wind blows, and the number of rotations for a specified time is recorded manually or by a computer system, which can then be converted to wind speed data. A sonic anemometer is another option for measuring wind speed, especially in a rough environment. An anemometer is often accompanied by a wind vane, which is used for finding the direction of the wind. The accuracy of the measured wind speed greatly depends on the precision of the anemometer used. However, for this analysis, 1 min averaged wind speed data recorded by BMD using a cup anemometer were used. To accord the analysis with the standard guidelines of the International Electrotechnical Commission (IEC; one of the international standards and conformity assessment bodies for all fields of electrotechnology), named IEC 61400-12-1, the 1 min wind speed data were transferred to 10 min averaged wind speed data using the weighted average method [8], which were then processed and analyzed with suitable computer tools.

2.2. Vertical Extrapolation

A suitable mathematical model was used to calculate the wind speeds at different altitudes above ground. For this purpose, the power law profile, along with regression analysis, were used to compute the wind speeds. This section describes the Hellman’s power law profile, which is the most well-recognized and commonly used mathematical formulae to determine the value of the power law exponent α that correlates wind speed at two different levels of altitude. Wind speed data are usually measured from the meteorological stations at a specified height, although other wind speed data are recorded at an unknown height, which is needed to estimate a required height. The exponent of Hellmann’s power law α is shown in Equation (1) [9,10].
α = ln ( v 2 v 1 ) ln ( z 1 z 2 )
From Equation (1), the required wind speed v2 at a specified height z2 can be calculated, and the new equation looks like Equation (2).
v 2 = v 1 ( z 2 z 1 ) α
Wind speed v2 at any specified and desired height can be predicted using Equation (2), where v1 is the reference wind speed (m/s), z1 is the reference height (m), and z2 is the height where v2 is calculated. The value of the power law exponent can again be computed using Equation (3) [11].
α = 0.37 0.088   ln ( v r e f ) 1 0.088 ln ( z r e f 10 )
In addition, α also can be estimated using Equation (4).
α = 0.37 0.088   ln ( v r e f ) .  
where vref is the reference wind speed (v1 in Equation (1)) and zref is the reference height (z1 in Equation (2)). The 1/7 power law explicitly uses 0.143 as the value of α, which is sometimes used even though it is not practical for offshore wind. The 1/7 power law usually yields conservative yet reasonable wind power estimates in situations where the roughness length for the projected sites is at least an order of magnitude smaller than the height of the reference level [12]. For offshore wind energy potential analysis, 1/9 is usually recommended for the power exponent value, as it has been found that under neutral stability conditions, the power law exponent value of 0.11 (1/9) provides a good approximation [13]. However, wind speed over different types of roughness of land cannot be estimated accurately using this method. As a result, the power law exponent needs to be estimated from the real wind speed data and other related information if available. However, for the current analysis, α was estimated using Equation (3), as both the reference wind speed vref and the reference height zref are known because the reference wind speed is the measured wind speed at a specified height.

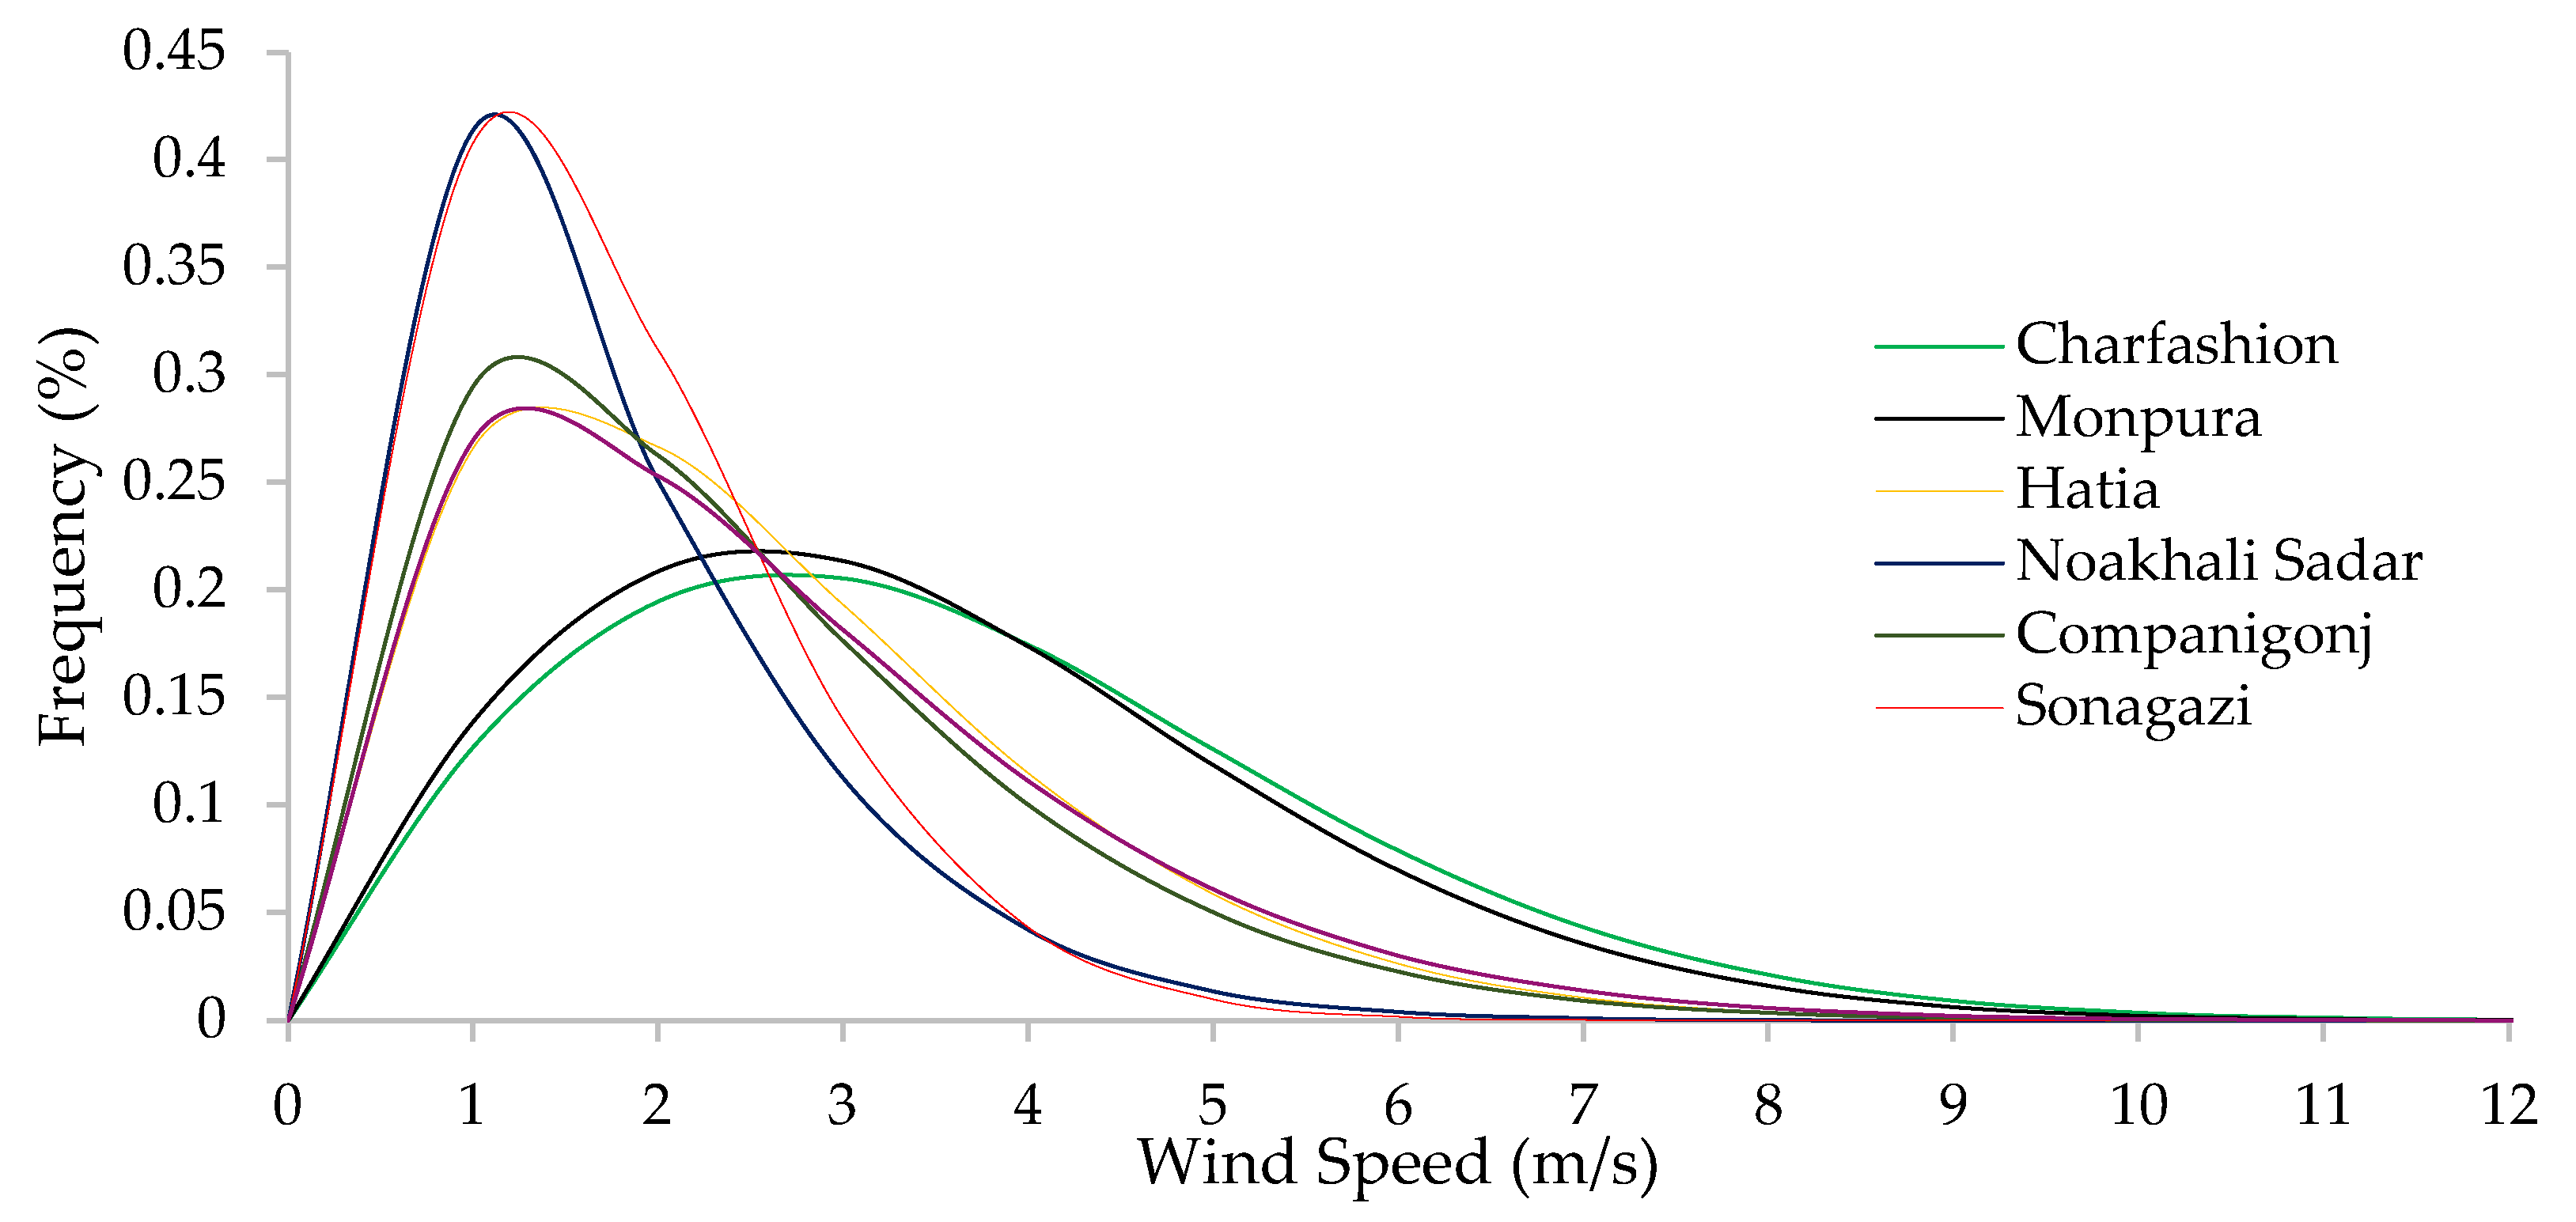
2.3. Distribution Function

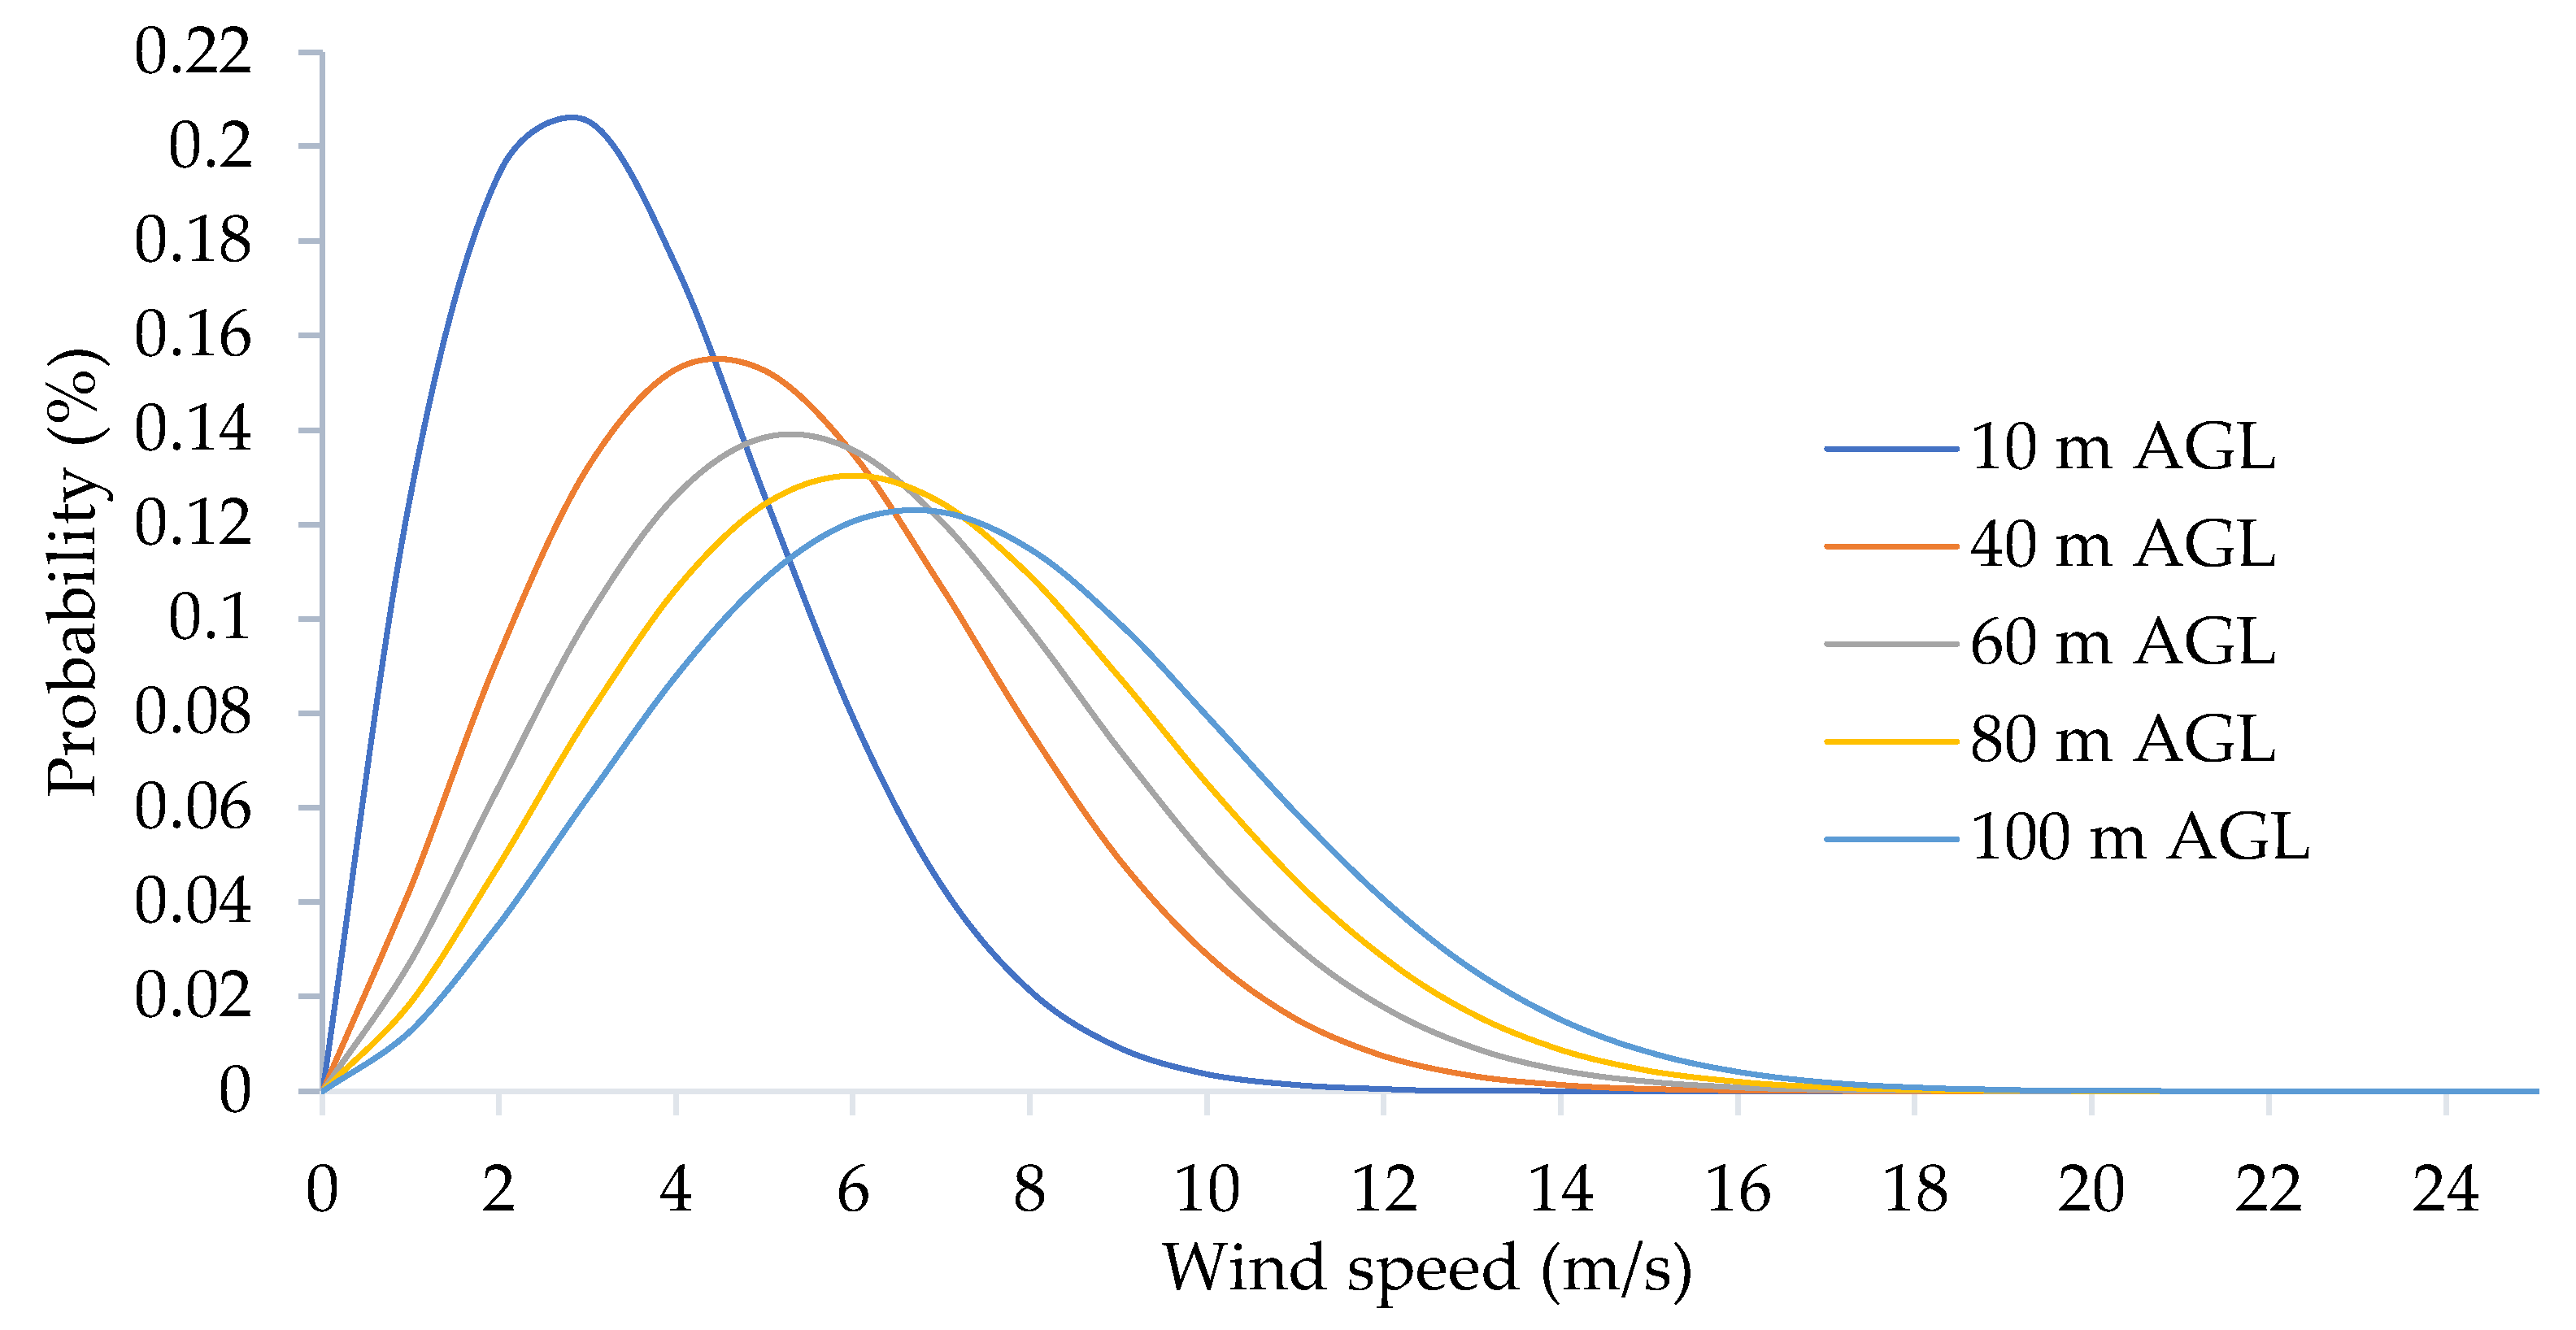
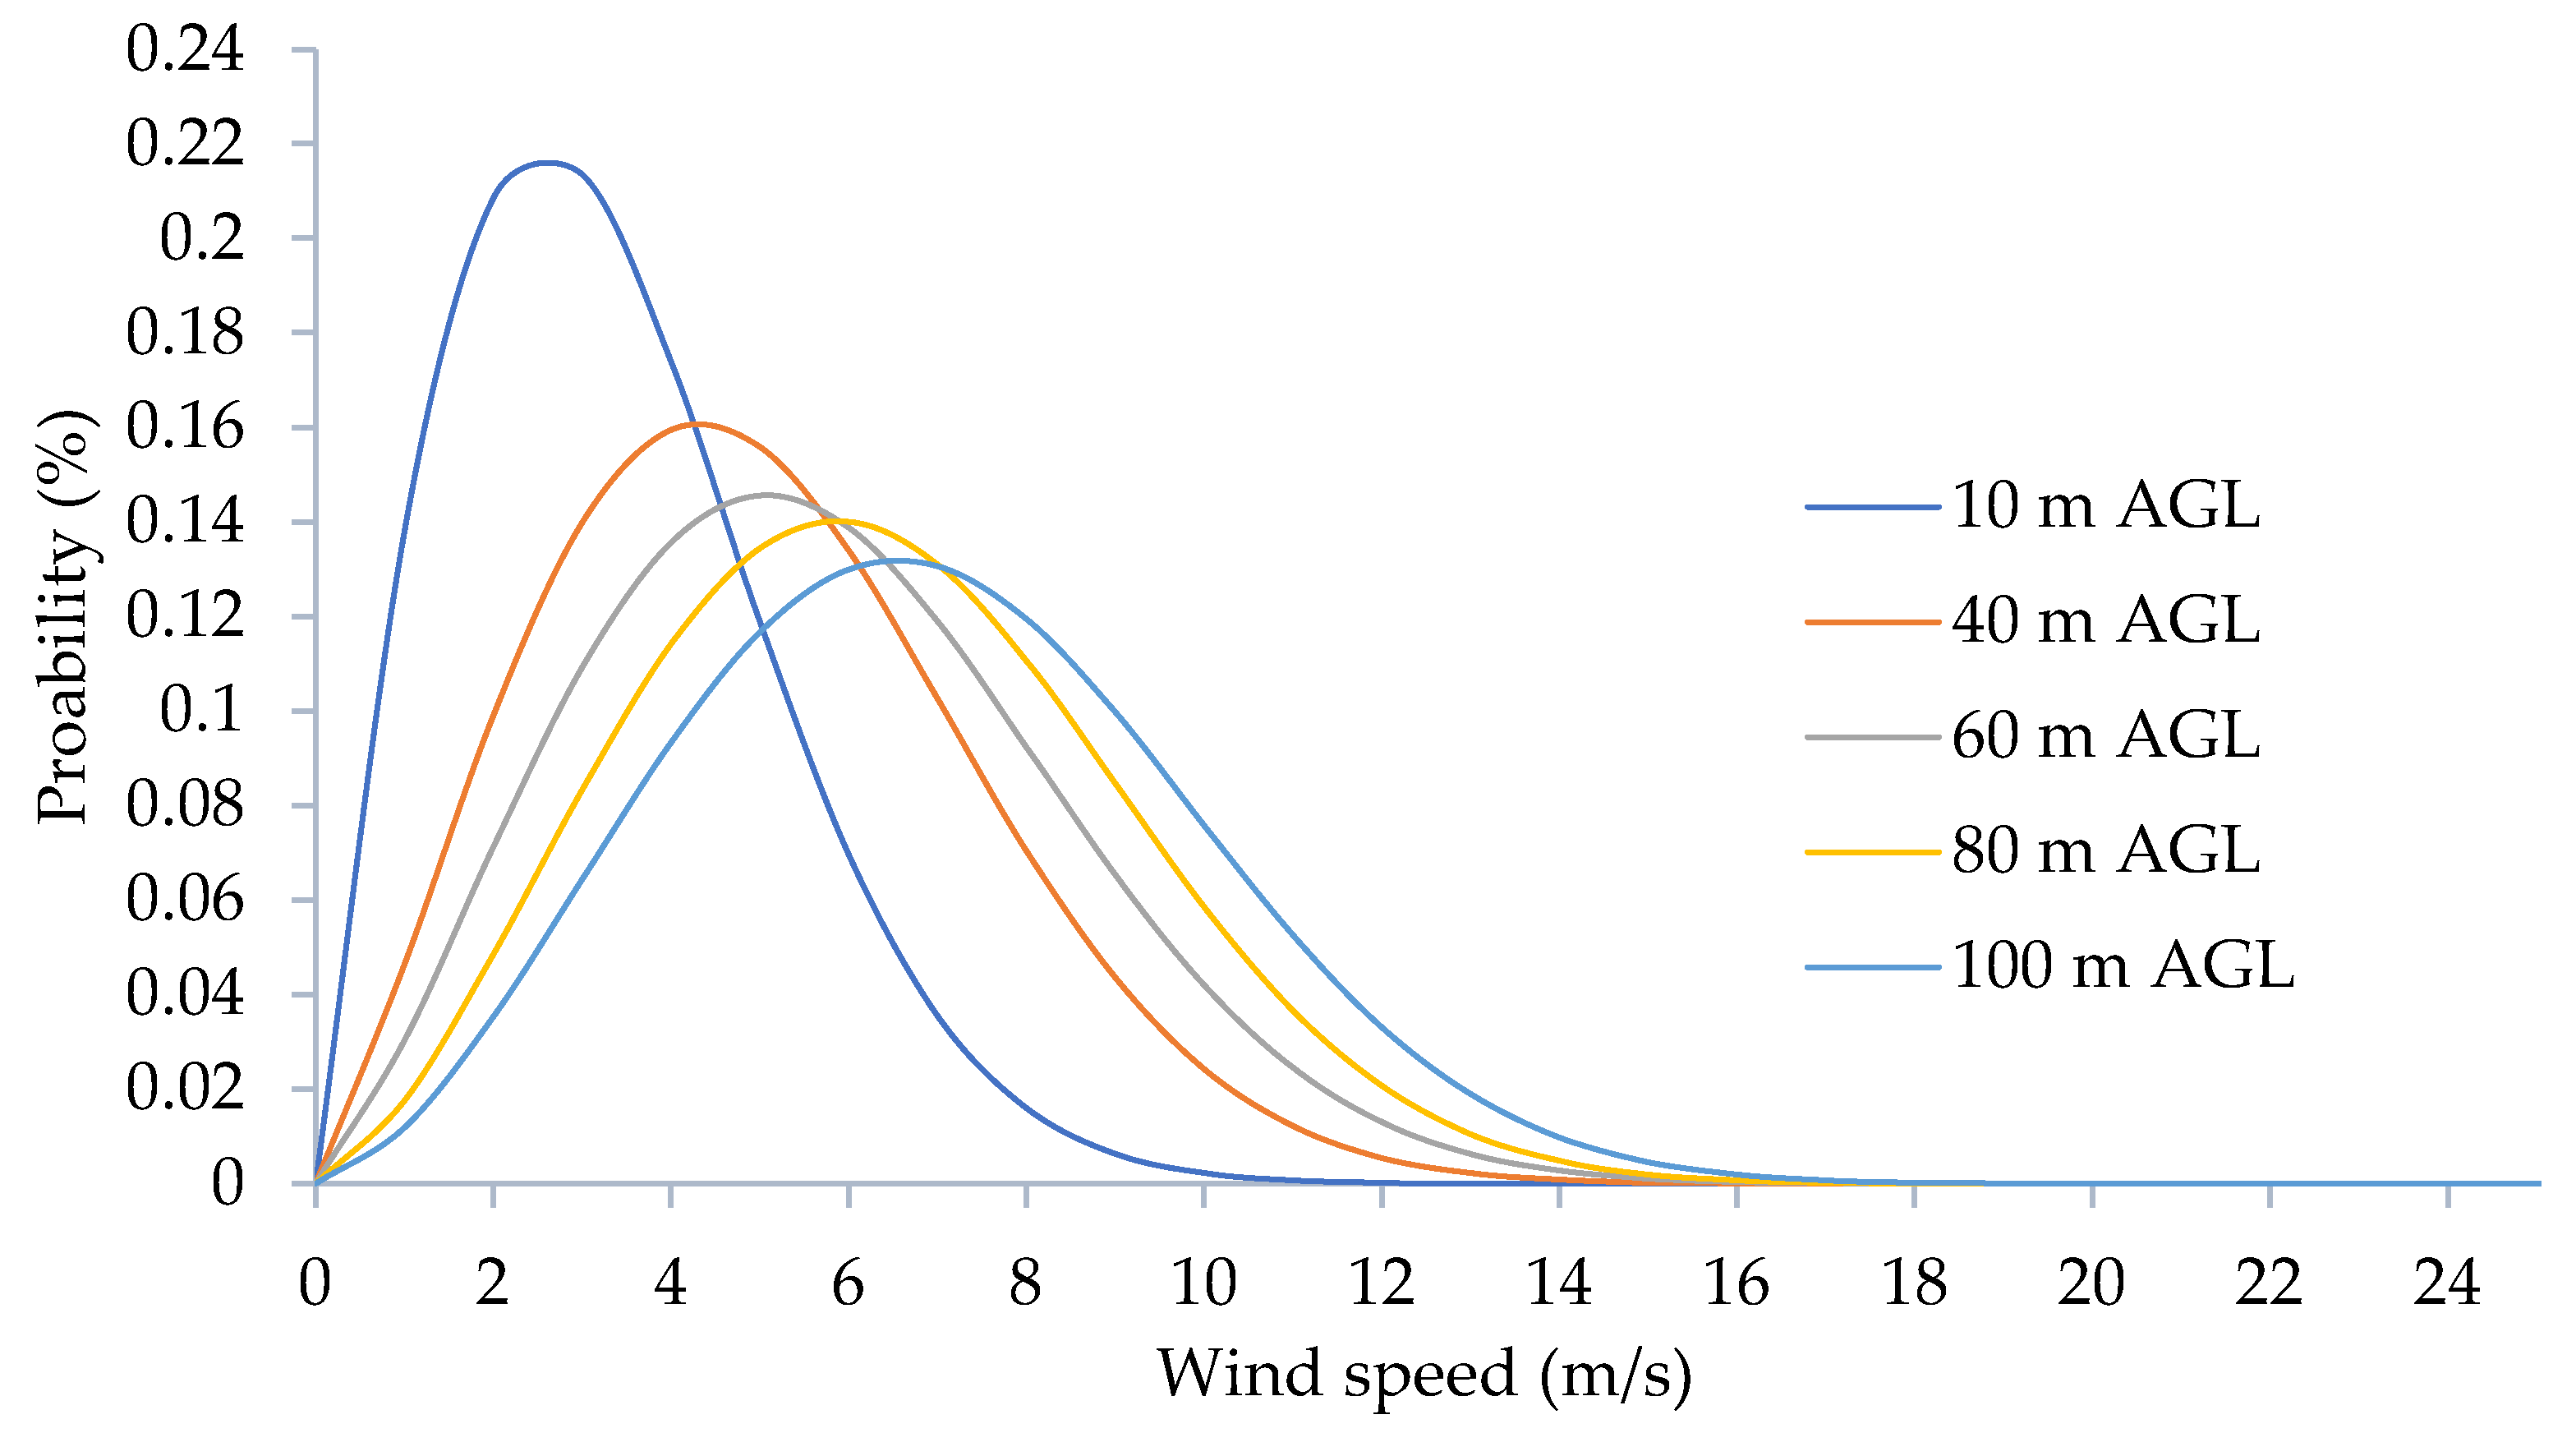
Wind data collected from meteorological stations usually recorded at 10 m AGL are illustrated by the most well-recognized distribution function of wind speed v, called the Weibull model, which is characterized by two parameters—the Weibull shape parameter k and the scale parameter C [14,15]. Wind speed data distributed as a function of the Weibull probability distribution function (PDF) use Equation (5) [16].
f ( v ) = k C ( v C ) k 1 e x p ( ( v C ) k )
The shape and scale parameters of the Weibull PDF are measured using Equations (6) and (7) [17].
k = ( σ v m ) 1.086
C = v m Γ ( 1 + 1 k )
where k is the Weibull shape parameter, vm is the mean wind speed shown in simple terms in Equation (8), and σ is the standard deviation of the wind data, which can be calculated using Equation (9) [17].
v m = 1 N ( i = 1 N v i )
σ = 1 N 1 i = 1 N ( v i v m ) 2
where vm is the mean wind speed, vi is the mean hourly wind speed, and N is the number of measured hourly wind speed data. However, for wind energy calculation, the wind speed is weighted for its power content and is calculated using Equation (10) [17].
v m = ( 1 N i = 1 N v i 3 ) 3
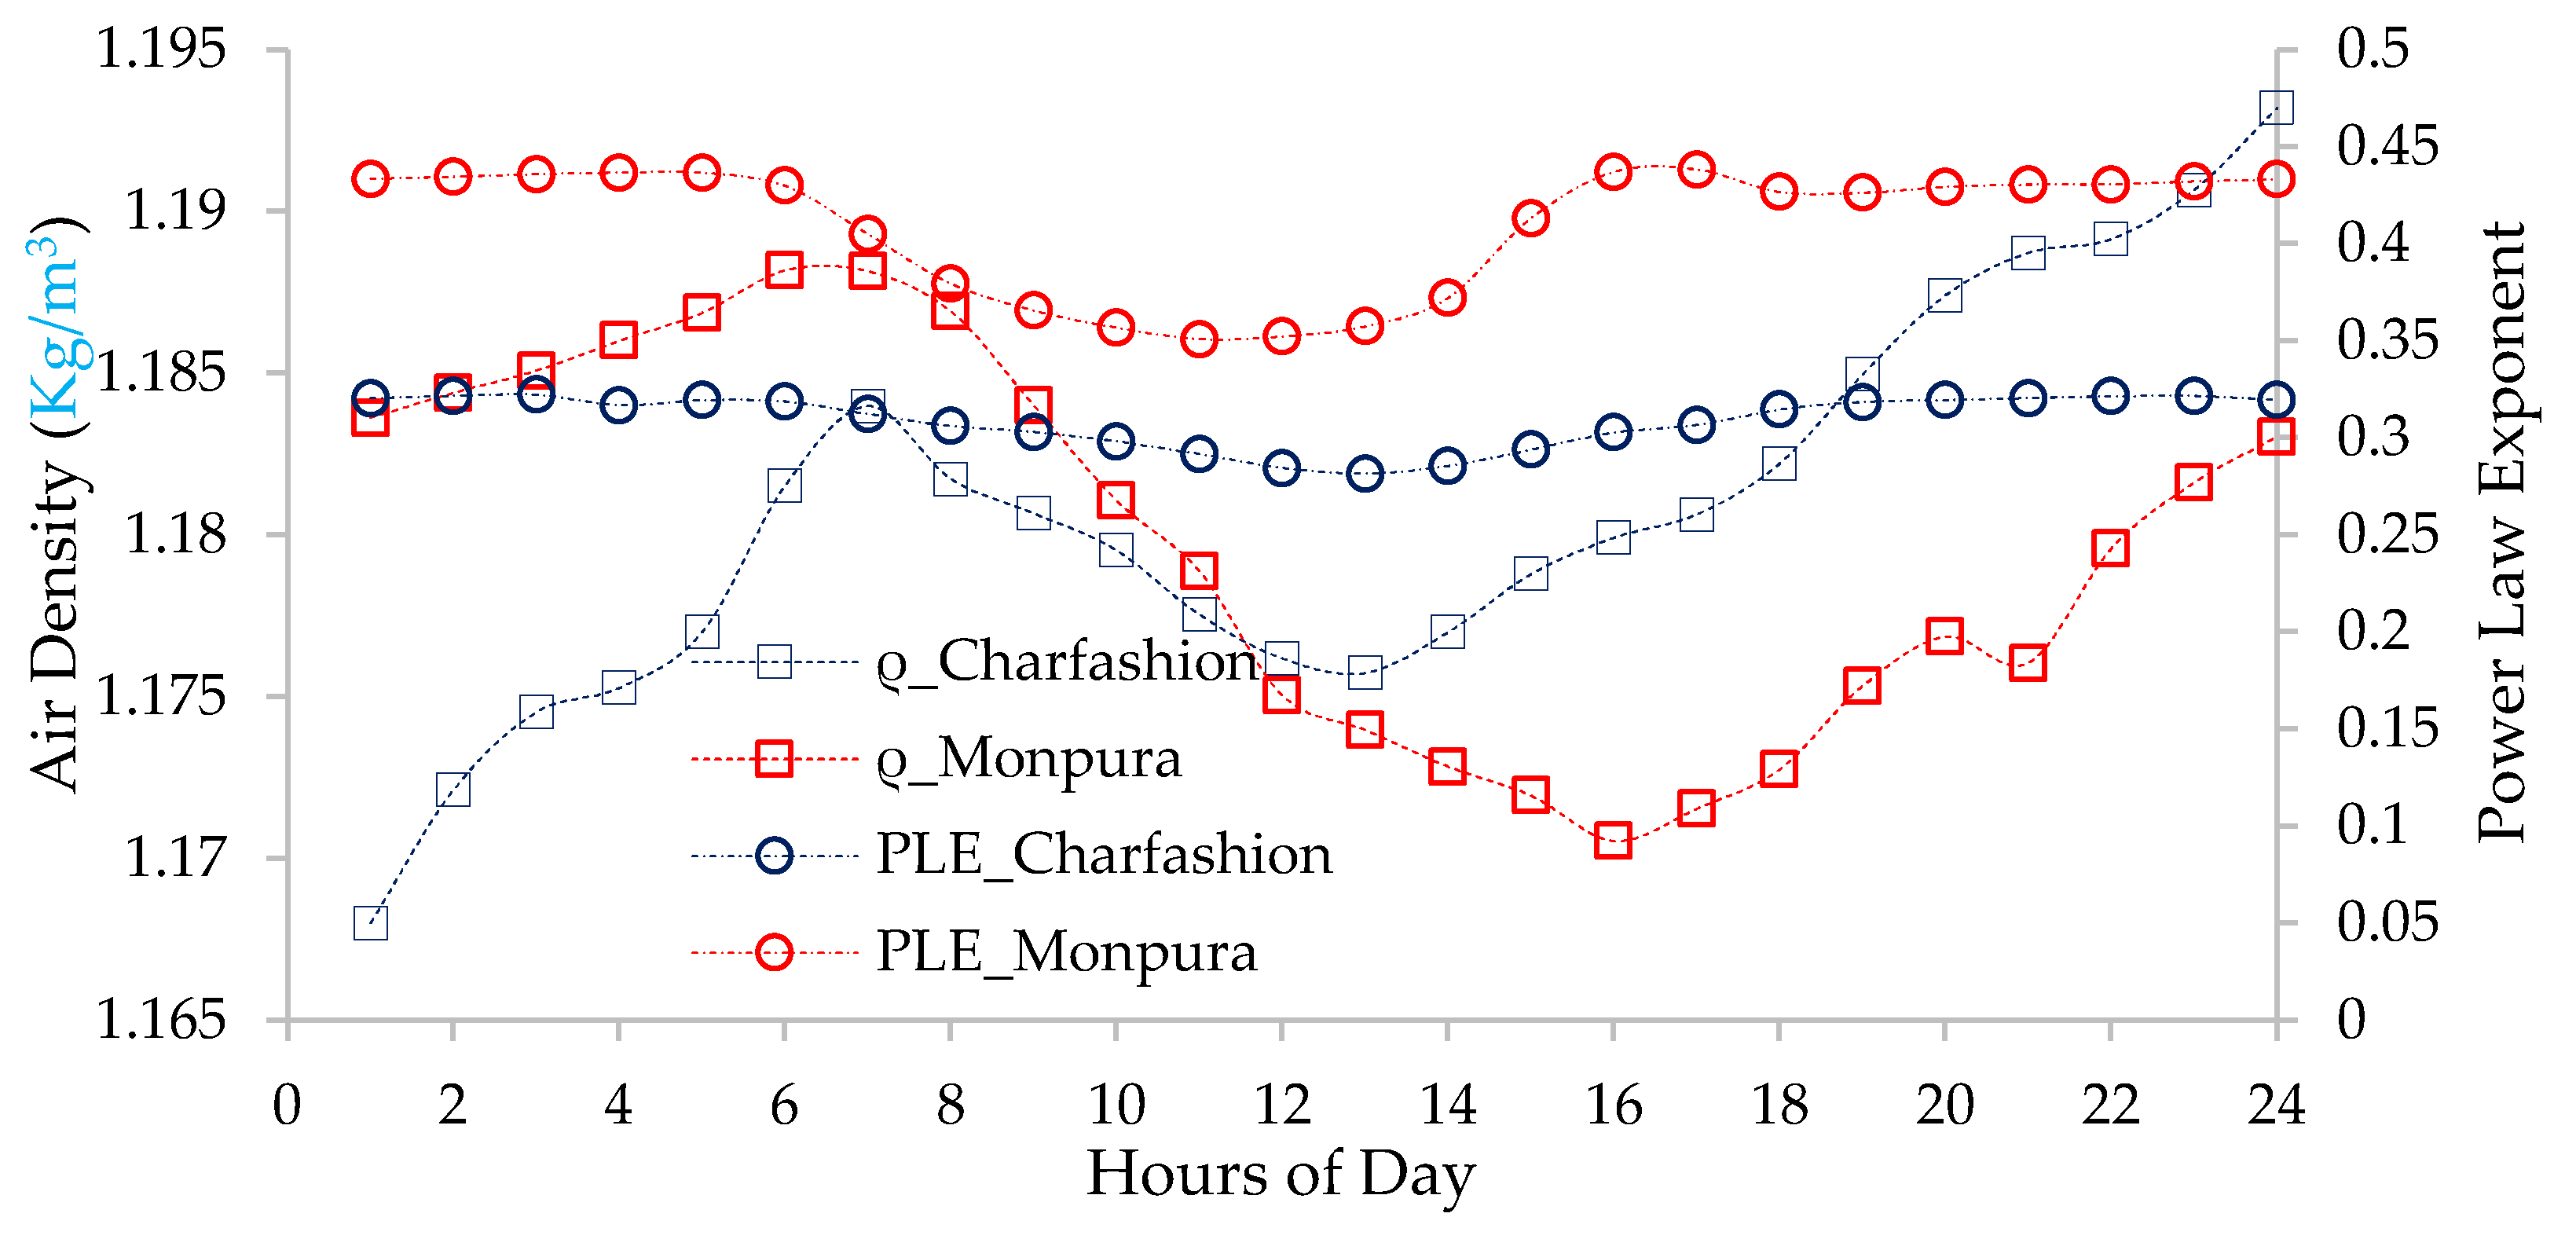
The average wind speed from Equation (10) at 10 m AGL needs to be converted to the wind speed at a desired height above ground level using the power exponent law. The wind power density is calculated by considering the calculated air density value in kg/m3 from Equation (11) [18].
P = 1 2 ρ A v 3
where P is the wind power, ρ is the air density measured in kg/m3, A is the wind turbine rotor swept area, and v is the mean wind speed. Consequently, power density estimation is carried out using Equation (12).
P A = 1 2 ρ v 3
The air density is calculated as shown in Equation (13) that uses the ideal gas law equation from the combinatorial relationship of Boyle’s Law, Charle’s Law, and Gay-Lussac’s Law, similarly to Equation (12) [19].
B = ρ R d T
where B is the measured 10 min averaged air pressure, ρ is the derived 10 min averaged air density, and T is the measured 10 min averaged absolute air temperature, all of which were measured in S.I. units for this equation to work, using the value of 287.05 J/(kg−1K) as a gas constant of dry air Rd.
These data need to meet the requirements prescribed by IEC 61400-12-1 standard shown in Table 1. In fact, the wind data in the current research were analyzed based on IEC 61400-12-1, because it gives an international standard of the investigation of wind energy in order to promote international cooperation that is concerned about the standardization of the energy fields. If sensors for air temperature and humidity are used, those shall be installed within 10 m of hub height, as prescribed by IEC 61400-12-1 (2017) [20]. The mean wind speed and power density should be measured in terms of both the rule of weighted average and cubic average as per international standards.
Assessing the economic feasibility for the installation of a WTG for the generation of power, AEP is determined as shown in Equation (14) [21].
A E P = 8760   v c i v c o P t ( v )   f ( v ) d v
The AEP produced from a WTG is estimated using the power curve of the respective WTG with the help of the frequency of hour of the measured data using the method of bin, the most prominent method for interpreting frequency distribution where the wind data are sorted by the discrete group into some wind speed intervals (usually intervals of 0.5 or 1 m/s). For each bin of the interval, the frequency of the wind speed is counted and then calculated to find the average wind speed. Once the annual energy of one year from the frequency distribution is estimated, the capacity factor (CF) can be calculated using Equation (15) [22].
CF = A E P 8760 · N · C R · 100 %
where AEP is the annual energy production in kWh/year, 8760 is the number of hours in a year, vci is the cut-in wind speed of the wind turbine, vco is the cut-off wind speed of the wind turbine, Pt is the power output curve of the wind turbine, N is the number of wind turbines, and CR is rated capacity. The CO2 emissions can be estimated from AEP using the country-wise carbon emission factor from the simple and straightforward Equation (16) [23].
G H G e = E F × A E P 1000000
where GHGe is the estimated reduction in greenhouse gas emissions in tons of CO2 per year, EF is the country-wise emission factor in g/kWh, and AEP is the annual energy production in kWh/year.

2.4. Wind Resource Mapping

This section discusses the overall mapping criteria for the study sites detailed herein.

2.4.1. Selected Area

It was found from a primary investigation that, based on the mean wind speed as the foremost priority, followed by heritage and environmental sensitivity, the coastal region of the country falls into the area of interest. Wind resource assessment studies can be placed into three basic categories—preliminary area identification, wind resource evaluation of that area, and micrositing [24].
For this work, the southern part of Bangladesh was taken as the overall region of preliminary investigation, whereas seven selected sites in the coastal area of the country were considered for in-depth analysis. The site-specific information is presented in Table 2. Figure 1 and Figure 2 show the selected working area.

2.4.2. Mapping Technique

This work manipulated a computerized wind resource mapping system, replacing the manual analysis that was conducted before suitable software was developed (previous-era mapping endeavors). Developing final wind resource maps has three steps: (1) preliminary map building, (2) validating the preliminary maps, and (3) revisions of the final maps [25]. Meanwhile, the modeling of the mapping system consists of three components, namely, models, databases, and computer and storage systems [26].

2.4.3. Coupling of Meso- and Microscale Modeling

Though the results are subject to significant uncertainties and thus measurements requiring confirmation of the modeling results [27], mesoscale modeling provides important values for reading the wind speed across a vast area. The meso-field resolves the meteorological conditions within its modeling domain through solving a set of equations that describe the atmosphere, which are the input into what is called microscale modeling. The average meso-field value is transferred and modeled through the microscale, and is thus coupled for finding the wind characteristics. Exploration of the wind resources within this atmosphere, both on a utility-scale and for small-scale applications, increasingly relies on advanced modeling tools and measurement techniques [28]. The output from the mesoscale wind pattern at 10–100 m AGL at different elevations has been used as a virtual meteorological mast in the most promising coastal areas of Bangladesh. The specifications of the meso- and microscale modeling used in this research are presented in Table 3.
A horizontal resolution of 3 km was chosen for the mesoscale analysis, because less than this is computationally too expensive and does not necessarily produce a more accurate result. Research suggests that using a grid spacing of 1.1 km for wind mapping does not improve a wind resource compared to a 3.3 km grid [29]. Consequently, a 3 km resolution was considered for the current mesoscale modeling, which is regarded as the most standard resolution value. The output of the mesoscale analysis was transferred to create coupled meso- and microscale modeling for in-depth analysis of wind speed. The Weibull probability distribution function (PDF) and a wind rose graph for a full reference year (i.e., 2017) were calculated from the real one-year (2017) wind dataset. The microscale modeling output that estimates wind power plants’ productivity was used as a source for identifying wind resource potential microsites in the coastal area of Bangladesh.

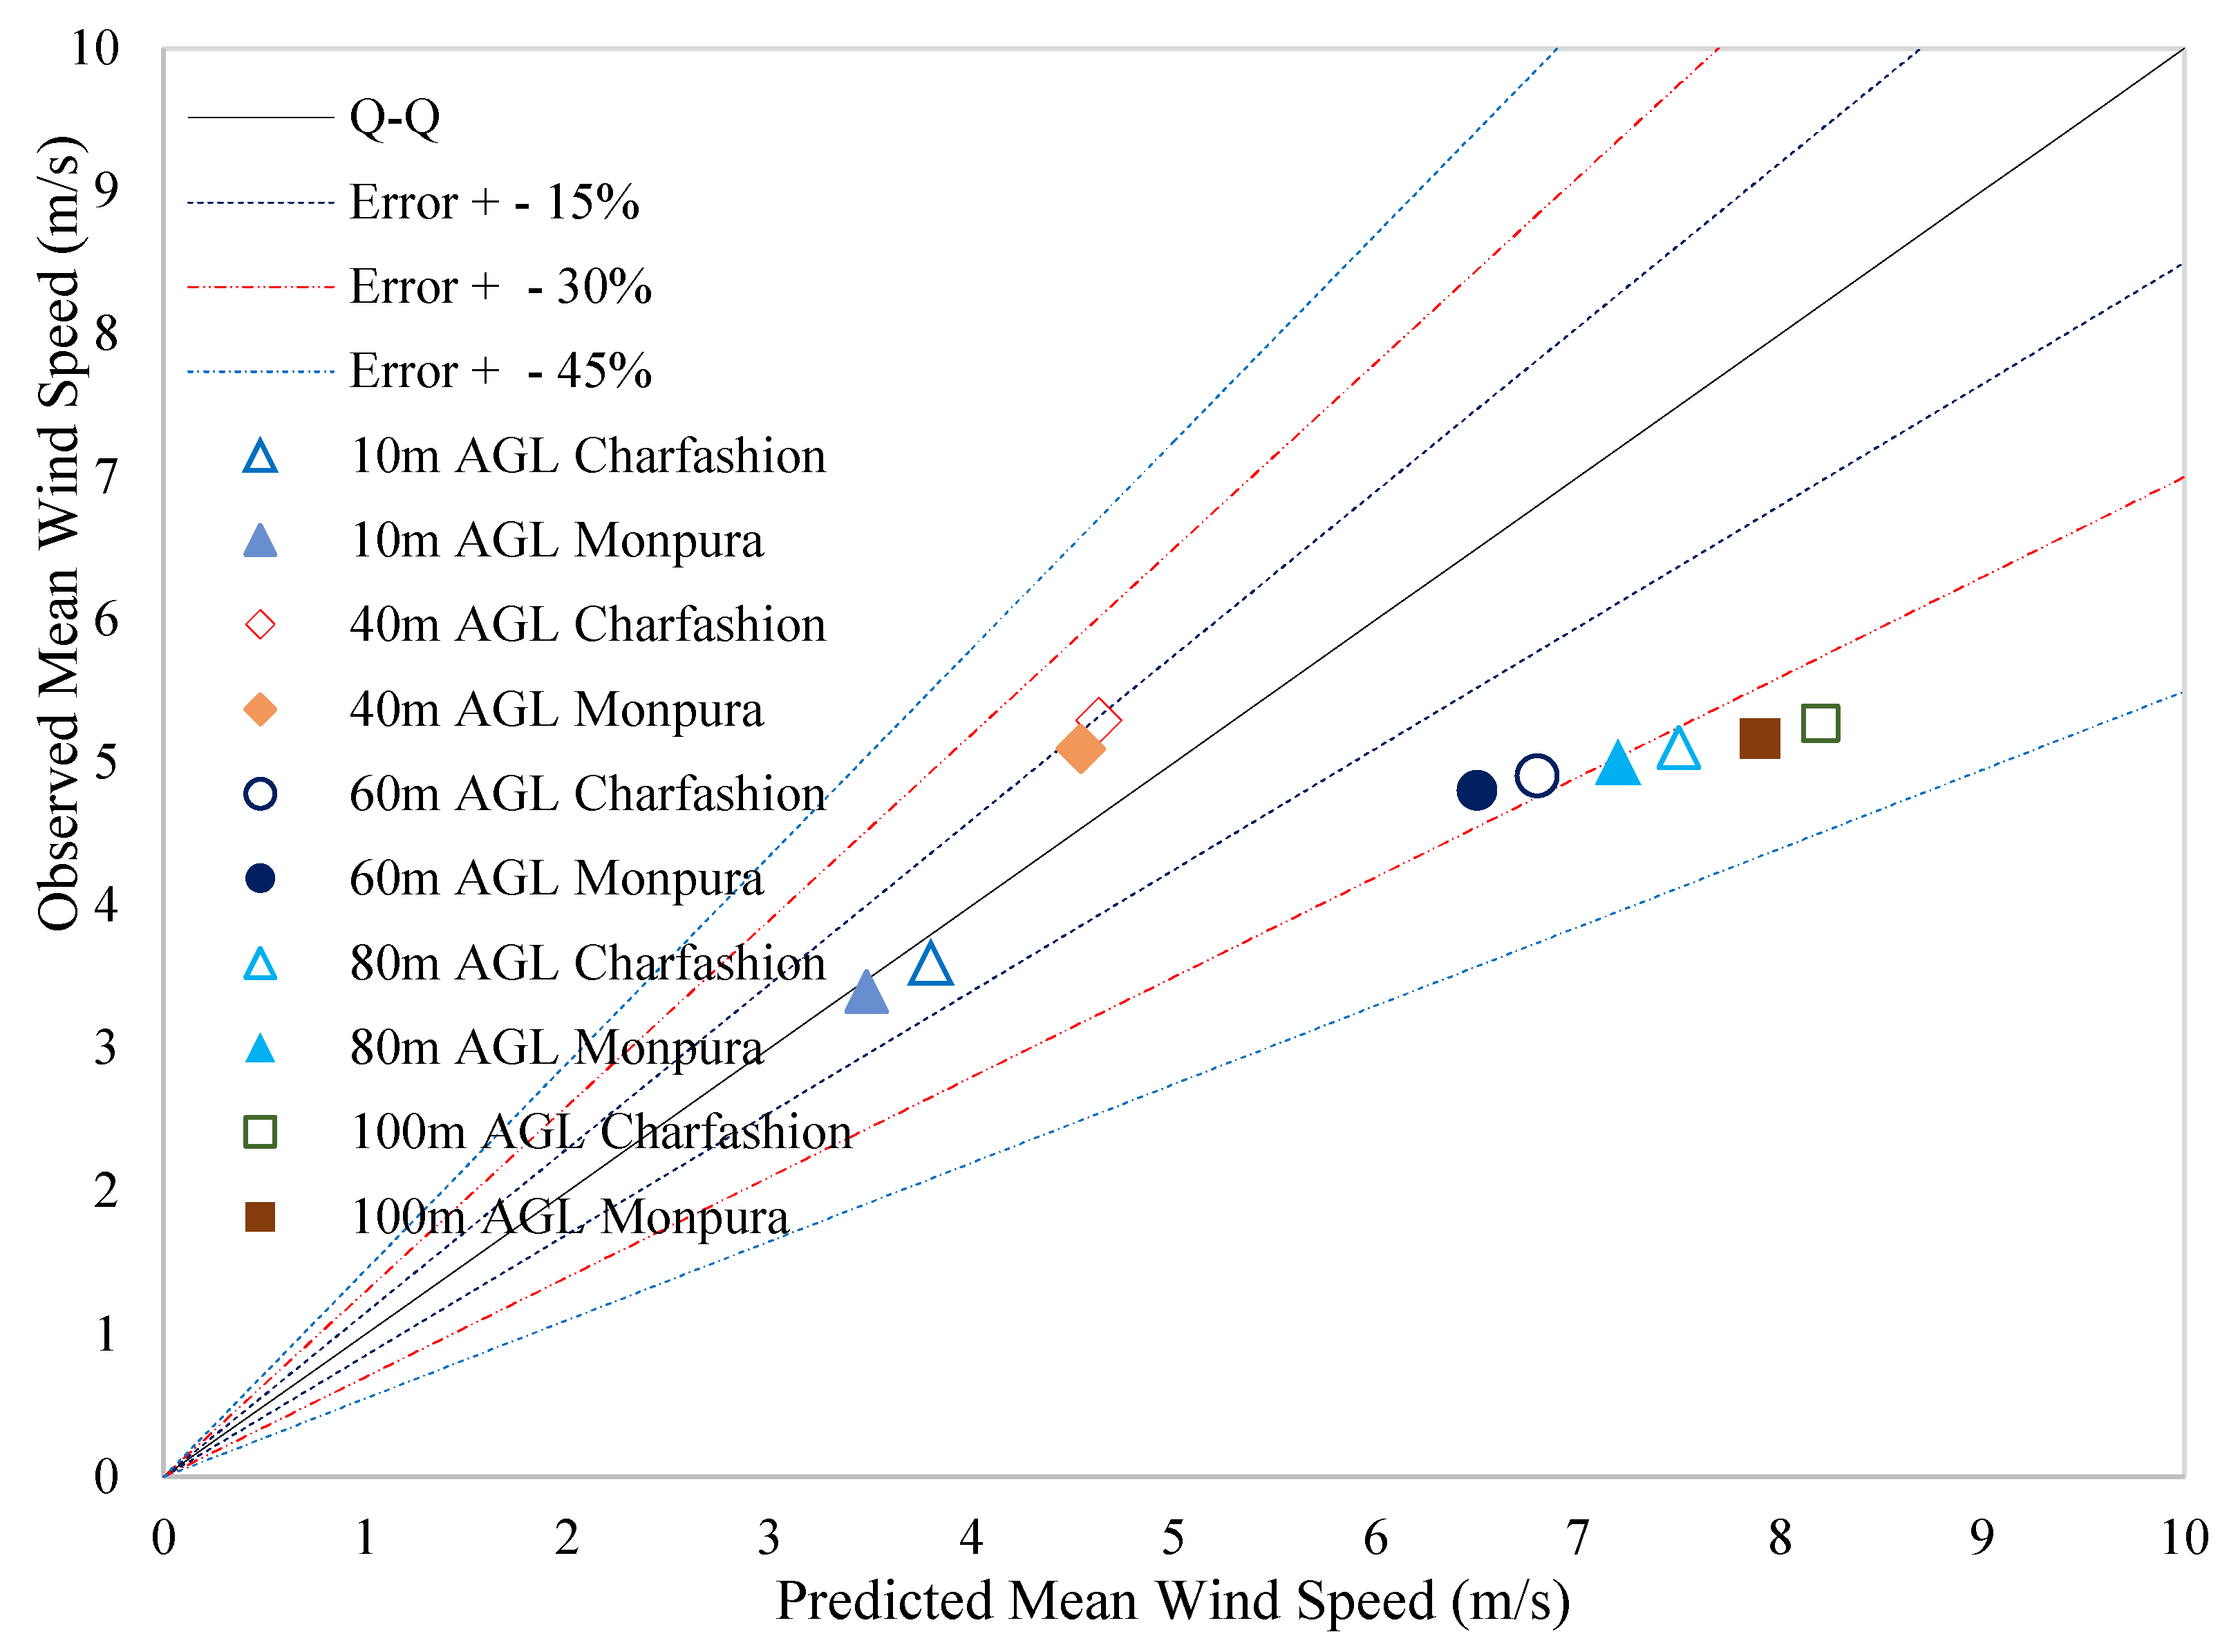
2.5. Validation of the Wind Resource Atlas

To validate the predicted map results, the simulated wind speed data of the map were compared to the measured wind speed. As part of the validation process, several statistical tests were performed. The measured vs. predicted ratio (M/P) is the simplest test, which is shown in Equation (17). Derivation of the percent mean relative error (PMRE) for the simulated wind speed is shown in Equation (18).
M P = O i P i
P M R E = 1 n i = 1 n ( O i P i ) O i × 100 %
where Oi and Pi denote the observed data and predicted data, respectively. In addition to the measurement of the performance, the root mean square error (RMSE) was also used, the expected value of which should be close to zero, and is expressed [25,26] in Equation (19).
R M S E = ( 1 n × i = 1 n ( O i P i ) 2 ) 1 2
where Oi and Pi are the observed and predicted wind speed respectively, both measured in m/s, and n is the number of wind data. In addition to the statistical tests, the measure–correlate–predict (MCP) method, a very useful tool by which the predicted wind speeds are correlated with the measured wind speeds, was utilized.

3. Results and Discussion

The results from both the statistical and the mapping analyses are presented in the following sections.

3.1. Data Analysis Outcome

The 10 min averaged wind data in this research were estimated from 1 min averaged met data recorded at 10 m AGL for the selected sites, as per the rule set by IEC 61400-12-1 [8], the statistical findings of which are presented in Table 4 and Table 5.
The wind power density distribution was computed using the measured mean wind data. The Weibull distribution is presented for all sites in Figure 3. The sites demonstrated in Table 4 and Table 5 and Figure 3 show that all of the areas, except two (i.e., Charfashion and Monpura), are not suitable for power generation.
The wind speeds of these two sites able to generate power commercially fall into IEC-61400-1 wind class IV/S. The suitable average wind speed for a profitable wind project should be more than 5.00 m/s. For this research, these two sites—Charfashion (5.3 m/s) and Monpura (5.1 m/s)—achieved this value. Several altitudes, such as 80 and 100 m AGL, were tried for estimating the energy from wind. If the height of the wind turbine was set to 100 m AGL, all the sites except for Noakhali Sadar (3.7 m/s) and Sonagazi (4.1 m/s) showed an average wind speed that exceeded 5.00 m/s at this height. As a result, for more details on the probability of wind speed at different wind shear values of the two prominent areas (Charfashion and Monpura), their Weibull PDFs are shown in Figure 4 and Figure 5.
From Figure 4 and Figure 5, it can be understood that there is a clear difference between the probabilities of wind speed when its value increases significantly at different wind shear values, which tends to be capable of producing commercial-level power. For a better understanding of the wind characteristics of these two sites, the movement of predominant wind speed must also be visualized through wind rose graphs, which are presented in Figure 6.
The power law exponent (PLE) value α, as derived from Equation (3), varies with the varying temperature. The ambient heat influences the atmospheric boundary layer movement and it significantly affects the PLE value. The PLE value is usually higher during the night, as the temperature decreases at night time, causing the wind above the ground to become cooler, thus providing denser air [27]. The diurnal variations for the power law exponent and air density for the two selected sites are shown in Figure 6. Additionally, the yearly average air density of the sites is presented in Table 6, as its calculation is important for the understanding of the varying nature of wind speed at different heights.
It is important to consider the recorded or mathematically calculated air density and thus the PLE values from the real temperature, as well as the pressure, for the estimation of the true wind speed of the selected sites, which was performed in the current analysis, as shown in Table 6 and Figure 7.
The standard value of air density considered for dry air, which is 1.225 kg/m3, should be ignored, as the values of temperature and pressure vary at different heights in a particular site, which importantly affects the wind speed.

3.2. Wind Resource Maps

This section presents the mesoscale and microscale maps of the southern and coastal regions of Bangladesh.

3.2.1. Mesoscale Wind Map

The spatial distribution of the wind resources obtained from the mesoscale wind resource maps of a 3000 m resolution are presented in this section. The average wind speed for the mesoscale modeling at different elevations for the coastal and near-coastal areas of Bangladesh is shown in Figure 8. The accumulated wind speed ranges for the maps of different heights are presented in Table 7.
The results obtained from the mesoscale map indicate the potential of the selected areas in terms of wind speed, showing a range of around 1.0–6.0 m/s at varying elevations. At a higher altitude, better wind resources were observed in the assessments, thus demanding a more in-depth investigation for micrositing, which is usually considered as the process of a technical feasibility assessment for wind power development.

3.2.2. Microscale Wind Map

The microscale wind maps of a 200 m resolution are presented in this section. The maps for the coastal area of Bangladesh are shown in Figure 6. The accumulated wind speed ranges for the maps of different heights are presented in Table 8. The results shown in Table 8 and Figure 9 for the microscale analysis reveal the fact that the wind speeds available in some of the selected areas are not viable for power generation.
However, the highest wind speed area is to become the location for future wind farm development. Table 9 shows the wind speed ranges for better potential sites in the coastal area, with mean wind speeds in the range of up to 5.0–6.5 m/s at a higher elevation. Nowadays, commercial wind turbines are available on the market, which can operate at low wind regimes. As a result, based on the wind speeds shown in the selected sites in the microscale maps, sufficient benefit from wind energy farms should eventually be obtained.
The two selected prominent wind energy sites identified from the microscale wind modeling are capable of producing sufficient wind energy.

3.2.3. Map Accuracy Calculation

The accuracy of the numerical wind data of the wind resource maps was computed by comparing the measured wind data.
Building a high-resolution and accurate wind map relies upon the quality of both the anticipated and estimated wind data. To confirm the precision of a map and whether the map validation process is supported, the same weather conditions should be mirrored when a specific wind site is considered. The validated results are shown in Table 10.
It can be noticed from the values derived for the M/P ratio that the real met station data and the simulated data coincide very well, as the best case M/P ratio is 1. The PMRE and RMSE both have very small values, which indicates the integrity of the data. Assessing the accuracy of a wind resource map is important; in light of this, the observed and predicted mean wind speeds are presented as a correlation in the quantile–quantile (Q–Q) plot. The observed–predicted wind speed data plotline should be expected to follow the solid line of the Q–Q slope, indicating that the predicted wind speeds are equal to the observed wind speeds. However, in practice, this does not happen.
As a result, the error range of the occurrences of points indicating the observed-predicted scenario between 0 and 15%, 15 and 30%, and 30 and 45% were added, as shown in Table 11 for understanding how deflected the data are from the ideal line (Q–Q line). The findings shown in Table 11 are well explained in Figure 10, where it can be noticed that the predicted and measured wind speeds coincide well at 10 m AGL. However, as the measured wind speeds were computed for different heights using the power law profile, overestimated wind resource data were provided, which tend to fall far from the Q–Q line. It was observed that the errors tended to increase when the heights increased from 40 to 100 m AGL, and thus determining and mitigating these kinds of test errors are very important. Regardless of whether the precision is improved in wind maps, the requirement for site-specific precision for utility-scale wind energy estimation is undeniable.
Presenting the wind speed data in x = y line, i.e., a Q–Q plot, can be thought of as a good way to understand the reliability of the data. It should be noted also that although spatial and temporal correlation analyses are essential for overall wind data analysis, the simulated reanalysis datasets from satellites, etc., also have many shortcomings and flaws concerning the discrepancy of the conditions at geographically proximate locations.

3.2.4. Annual Energy Production (AEP) and Carbon Mitigation

Table 12 shows the wind class as per IEC 61400-1:2019 [30]. It also provides the rate of measured data recovery for one complete year (i.e., 2017). Table 13 summarizes the amount of annual energy production for different wind turbine models, as well as the computed capacity factors of each turbine. It is not profitable to produce power at 60 m AGL with low wind speed, though there are WTGs that work on low wind speed. As can be seen from Table 13, a hypothetical WTG model (WinWinD-1/60) provides an annual energy amount of around 1.7 and 1.07 GWh with a capacity factor of 19.22 and 12.78% in Charfashion and Monpura, respectively.
For 80 m AGL, this paper chose Goldwind GW155-3.3MW WTG as a good option for lower wind speed, producing more than 10.0 and 8.0 GWh of electricity with a capacity factor of 37.38% and 28.32%, respectively.
For the same area, measuring the AEP at 100 m AGL with IEC class IIIB, the wind turbine tested with the WTG model GE1.6-100 demonstrated a capacity factor of 43.79% and 34.03%, respectively. The energy produced in one year is helpful for determining the reduction in CO2 for a single turbine at different heights, which is shown in Table 14. According to the estimation of the International Energy Agency (IEA), the estimated CO2 emission factors of Bangladesh are given in Table 15.
It can be well understood from the Table 15 that the generated wind power can significantly reduce CO2 emissions passively through a carbon emission avoidance mechanism, which is the most effective carbon management technique.

4. Conclusions

An investigation of the coastal and near-coastal wind power potentials of Bangladesh was carried out through real wind data statistical analysis as per the regulations of IEC-61400-12-1 standard, and via simulated wind energy mapping for mesoscale and microscale modeling. The analyses at 60, 80, and 100 m AGL all demonstrated the fact that there are several promising locations for wind power development in Bangladesh. Several WTGs with different models designed for low wind, such as WinWinD-1/60 for 60 m AGL, GW155-3.3 for 80 m AGL, and GE 1.6-100 for 100 m AGL, were applied to the selected coastal area, and it was identified that two microsites (i.e., Charfashion and Monpura) have promising wind speeds, reaching 7.3 m/s at 100 m AGL, meaning their south-east wind flow can produce significant energy. WTGs with a capacity factor of 19.22 and 12.78% for the two sites, respectively, installed at 60 m AGL have the potential to produce 2.79 GWh of wind power, thus reducing 1781.689 tons of CO2 per year, whereas a wind turbine installed at 80 or 100 m can produce 18.933 or 11.044 GWh power, reducing 12,098.54 or 7035.028 tons of CO2 per year, respectively. The capacity factor significantly increases as the height of a WTG increases (ranges between 28 and 43%). This reduction in carbon could play an important role for carbon trading if a wind power plant is registered as providing certified emission reductions (CERs). Unlike the carbon sequester method that captures carbon directly from the source of emission before its release into the atmosphere, this passive way of mitigating carbon through the generation of wind energy, along with other renewable energy, is safe for replacing the carbon-emitting source of energy. This can help to deal with the global challenges of climate change, thereby promoting sustainable development.
Meso and microscale modeling for wind mapping were validated with real wind resource data in the projected region and showed that, with a 15% error margin, wind speed tends towards a smooth over-estimation than with a 30 or 45% error margin (this is due to the variable roughness of the topography). Correlation and comparison analyses were performed to check the accuracy of the data. The coastal wind energy of Bangladesh can add more economic benefits through the reduction of GHG emissions, especially carbon dioxide.
This research estimated the wind power potential of coastal areas of Bangladesh using the most effective statistical tools, which helped the validation analysis of the meso- and microscale wind resource maps of the same region. The findings of this research can be used effectively to sustainably develop the wind power of Bangladesh’s coastal areas to meet the energy demands of the country and to help reduce its carbon footprint.

Author Contributions

Conceptualization, K.D.I.; Methodology, K.D.I.; Software, T.T. (Thanansak Theppaya) and T.T. (Tanita Suepa); Validation, T.T. (Teerawet Titseesang) and T.T. (Thanansak Theppaya); Formal analysis, J.T.; Investigation, J.T.; Resources, F.A.; Data curation, J.W.; Writing—original draft preparation, K.D.I.; Writing—review and editing, T.T. (Teerawet Titseesang), F.A., and K.D.I.; Visualization, T.S.; Supervision, K.T. and J.T.; Project administration, J.T.; Funding acquisition, J.T. and K.T. All authors have read and agreed to the published version of the manuscript.

Funding

This research received no external funding.

Institutional Review Board Statement

Not applicable.

Informed Consent Statement

Not applicable.

Data Availability Statement

Not applicable.

Acknowledgments

This work was supported by the Interdisciplinary Graduate School of Energy System (IGS-ENERGY), Prince of Songkla University, Hat Yai-90112, Songkhla, Thailand.

Conflicts of Interest

The authors declare no conflict of interest.

Abbreviations

AEPAnnual energy production
AGLAbove ground level
BMDBangladesh Meteorological Department
CO2Carbon dioxide
CoP21Conference of parties
CRRated capacity
GHGGreenhouse gas
GWECGlobal Wind Energy Council
GWhGigawatt hour
IECInternational Electrotechnical Commission
kgKilogram
kmKilometer
kWhKilowatt hour
MCPMeasure–correlate–predict
M/PMeasured/predicted
MWMegawatt
PDFProbability distribution function
PLEPower law exponent
PMREPercentage mean relative error
RMSERoot mean square error
SDGSustainable Development Goal
WAsPWind Atlas Analysis and Application Program
WTGWind turbine generator

References

  1. Clifton, A.; Hodge, B.-M.; Draxl, C.; Badger, J.; Habte, A. Wind and solar resource data sets. Wiley Interdiscip. Rev. Energy Environ. 2018, 7, e276. [Google Scholar] [CrossRef]
  2. Jacobson, M.; Draxl, C.; Jimenez, T.; O’Neill, B.; Capozzola, T.; Lee, J.A.; Vandenberghe, F.; Haupt, S.E. Assessing the Wind Energy Potential in Bangladesh Enabling Wind Energy Development with Data Product; Technical Report; National Renewable Energy Laboratory: Golden, CO, USA, 2018. [Google Scholar]
  3. Walwyn, D.R.; Brent, A. Renewable energy gathers steam in South Africa. Renew. Sustain. Energy Rev. 2015, 41, 390–401. [Google Scholar] [CrossRef] [Green Version]
  4. de Jong, P.; Kiperstok, A.; Sánchez, A.; Dargaville, R.; Torres, E.A. Integrating large scale wind power into the electricity grid in the Northeast of Brazil. Energy 2016, 100, 401–415. [Google Scholar] [CrossRef]
  5. Islam, M.T.; Shahir, S.A.; Uddin, T.I.; Saifullah, A.Z.A. Current energy scenario and future prospect of renewable energy in Bangladesh. Renew. Sustain. Energy Rev. 2014, 39, 1074–1088. [Google Scholar] [CrossRef]
  6. Farha, N.; Nur-Us-Safa, M.; Rahamatullah, B.D.; Ali, M.S. Prospects of Wind Energy in the Coastal Region of Bangladesh. Int. J. Sci. Eng. Res. 2012, 3. Available online: http://www.ijser.org (accessed on 17 July 2021).
  7. Bañuelos-Ruedas, F.; Angeles-Camacho, C.; Rios-Marcuello, S. Analysis and validation of the methodology used in the extrapolation of wind speed data at different heights. Renew. Sustain. Energy Rev. 2010, 14, 2383–2391. [Google Scholar] [CrossRef]
  8. International Electrotechnical Commission. International Standard, Wind Energy Generation Systems—Part 12-1: Power Performance Measurements of Electricity Producing Wind Turbines, IEC 61400-12-1, 2nd ed.; International Electrotechnical Commission: Geneva, Switzerland, 2017; ISBN 978-2-8322-4081-6. [Google Scholar]
  9. International Electrotechnical Commission. International Standard, Wind Energy Generation Systems—Part 12-2: Power Performance of Electricity-Producing Wind Turbines Based on Nacelle Anemometry, IEC 61400-12-2, 1st ed.; International Electrotechnical Commission: Geneva, Switzerland, 2013; ISBN 978-2-83220-658-4. [Google Scholar]
  10. Oh, K.Y.; Kim, J.Y.; Lee, J.K.; Ryu, M.S.; Lee, J.S. An assessment of wind energy potential at the demonstration offshore wind farm in Korea. Energy 2012, 46, 555–563. [Google Scholar] [CrossRef]
  11. Ahmed, S. Wind Energy Theory and Practice, 3rd ed.; PHI Learning Private Limited: Delhi, India, 2015; ISBN 978-81-203-5163-9. [Google Scholar]
  12. Sisterson, D.L.; Hicks, B.B.; Coulter, R.L.; Wesely, M.L. Difficulties in using power laws for wind energy assessment. Sol. Energy 1983, 31, 201–204. [Google Scholar] [CrossRef]
  13. Hsu, S.A.; Meindl, E.A.; Gilhousen, D.B. Determining the Power-Law Wind-Profile Exponent under Near-Neutral Stability Conditions at Sea. J. Appl. Meteorol. Climatol. 1994, 33, 757–765. [Google Scholar] [CrossRef] [Green Version]
  14. Elliott, D.; Schwartz, M.; Scott, G.; Haymes, S.; Heimiller, D.; George, R. Wind Energy Resource Atlas of Southeast China; November 2002 NREL/TP-500-32781, Prepared under Task Nos. WF981020 and DO401020; National Renewable Energy Lab.: Golden, CO, USA, 2002. [Google Scholar]
  15. Elliott, D.L.; Holladay, C.G.; Barchet, W.R.; Foote, H.P.; Sandusky, W.F. Wind Energy Resource Atlas of the United States; Solar Energy Research Institute: Golden, CO, USA, 1987. [Google Scholar]
  16. Celik, A.N. A statistical analysis of wind power density based on the Weibull and Rayleigh models at the southern region of Turkey. Renew. Energy 2004, 29, 593–604. [Google Scholar] [CrossRef]
  17. Mathew, S. Wind Energy Fundamentals, Resource Analysis and Economics; Springer: Berlin/Heidelberg, Germany; New York, NY, USA, 2006; ISBN -13 978-3-540-30905-5. [Google Scholar]
  18. Burton, T.; Sharpe, D.; Jenkins, N.; Bossanyi, E. Wind Energy Handbook; John Wiley & Sons, Ltd.: Chichester, UK, 2001. [Google Scholar]
  19. International Electrotechnical Commission. International Standard, Wind Energy Generation Systems—Part 12-4: Numerical Site Calibration for Power Performance Testing of Wind Turbines, IEC 61400-12-4, 1st ed.; International Electrotechnical Commission: Geneva, Switzerland, 2020; ISBN 978-2-8322-8781-1. [Google Scholar]
  20. Schwartz, M.; Elliott, D. Validation of Updated State Wind Resource Maps for the United States. In Proceedings of the World Renewable Energy Congress VIII, Denver, CO, USA, 29 August–3 September 2004. [Google Scholar]
  21. Brower, M.; Bailey, B.; Zack, J. Applications and Validations of the MesoMap Wind Mapping System in Different Wind Climates. In Windpower 2001 Proceedings; American Wind Energy Association: Washington, DC, USA, 2001; 10p. [Google Scholar]
  22. Ohunakin, O.S.; Akinnawonu, O.O. Assessment of wind energy potential and the economics of wind power generation in Jos, Plateau State, Nigeria. Energy Sustain. Dev. 2012, 16, 78–83. [Google Scholar] [CrossRef]
  23. Breisinger, M.; Boulet, E. Greenhouse Gas Assessment Emissions Methodology; Technical Note No. IDB-TN-455; Inter-American Development Bank: Washington, DC, USA, August 2012. [Google Scholar]
  24. Tindal, A.; Ma, J. Mesoscale Wind Mapping; Garrad Hassan (GL): Bristol, UK, 2012. [Google Scholar]
  25. Kidmo, D.K.; Danwe, R.; Djongyang, N.; Doka, S.Y. Performance Assessment of Two-parameter Weibull Distribution Methods for Wind Energy Applications in the District of Maroua in Cameroon. Int. J. Sci. Basic Appl. Res. 2014, 17, 39–59. [Google Scholar]
  26. Azad, A.K.; Rasul, M.G.; Yusaf, T. Statistical Diagnosis of the Best Weibull Methods for Wind Power Assessment for Agricultural Applications. Energies 2014, 7, 3056–3085. [Google Scholar] [CrossRef] [Green Version]
  27. Albani, A.; Ibrahim, M.Z. Wind Energy Potential and Power Law Indexes Assessment for Selected Near-Coastal Sites in Malaysia. Energies 2017, 10, 307. [Google Scholar] [CrossRef] [Green Version]
  28. Chavez, R.; Gomez, H.; Herbert, J.F.; Romo, A.; Probst, O. Mesoscale modeling and remote sensing for wind energy applications, Catedra de Investigacion en Energıa Eolica, Departamento de Fısica, Instituto Tecnologico y de Estudios Superiores de Monterrey, Av. Eugenio Garza Sada 250 Sur, Monterrey, N.L., CP 64849. Revista Mexicana de Fisica 2013, S59, 114–129. [Google Scholar]
  29. Draxl, C.; Purkayastha, A.; Parker, Z. Wind Resource Assessment of Gujarat (India); NREL/TP5000-61741; National Renewable Energy Laboratory: Golden, CO, USA, 2014. [Google Scholar]
  30. International Electrotechnical Commission. International Standard, Wind Energy Generation Systems—Part 1: Design Requirements, IEC 61400-1, 4th ed.; International Electrotechnical Commission: Geneva, Switzerland, 2019; ISBN 978-2-8322-6571-0. [Google Scholar]
Figure 1. The southern area of Bangladesh for mesoscale modeling analysis.
Energies 14 05628 g001
Figure 2. The coastal area of Bangladesh for microscale analysis.
Energies 14 05628 g002
Figure 3. The Weibull probability distribution for the selected coastal sites at 10 m AGL.
Energies 14 05628 g003
Figure 4. The Weibull probability distribution for the Charfashion site at different wind shear values.
Energies 14 05628 g004
Figure 5. The Weibull probability distribution for the Monpura site at different wind shear values.
Energies 14 05628 g005
Figure 6. The wind rose for the (a) Charfashion and (b) Monpura microsites at 10 m AGL.
Energies 14 05628 g006
Figure 7. The diurnal variation of the power law exponent (PLE) and the air density of the Charfashion and Monpura microsites.
Energies 14 05628 g007
Figure 8. Mesoscale wind resource maps of the coastal and near-coastal areas of Bangladesh at (a) 10 m AGL, (b) 40 m AGL, (c) 60 m AGL, (d) 80 m AGL, and (e) 100 m AGL and the (f) map specifications.
Energies 14 05628 g008
Figure 9. Microscale wind resource maps of the coastal area in Bangladesh at (a) 10 m AGL, (b) 40 m AGL, (c) 60 m AGL, (d) 80 m AGL, and (e) 100 m AGL and the (f) map specifications.
Energies 14 05628 g009
Figure 10. Quantile–quantile plot for the long-term measured and simulated mean wind speeds of the two prospective coastal sites (Charfashion and Monpura).
Energies 14 05628 g010
Table 1. IEC 61400-12-1 standard requirements for wind data analysis [8].
RequirementsDatabase CriteriaStatusRemarks
10 min averaged data10 min averaged dataPassMinimum of 65% of air density data are inside the range set by IEC 61400-12-1
Normalized wind speed data with two reference air density measurements if the site’s air density is out of the range of 1.225 ± 0.05Most of the air density inside the range required by IECPass
Database includes a minimum of 180 h of sample dataIncludes more than 8000 h of sample dataPass
Each bin shall consist of a minimum of 30 min of dataAt least 3 single 10 min averaged dataPass
Table 2. Site descriptions.
AreaCoordinatesMeasurement PeriodTopography
Charfashion 22.18° N, 90.75° E 1 January 2017
–31 December 2017
Near island, flat
Monpura 22.19° N, 90.95° E Near island, flat
Hatia 23.28° N, 85.30° E Near island, flat
Noakhali Sadar 22.82° N, 91.10° E Building, populous
Companigonj 22.82° N, 91.26° E Coastal and flat
Sonagazi 22.84° N, 91.39° E Coastal and flat
Sandweep 22.49° N, 91.42° E Near island, populous
Table 3. Wind resource mapping criteria.
Mapping CriteriaResolution (m)AGL (m)Remarks
Mesoscale mapping300010, 60, 80, and 100 mFor a rough idea of the wind of a bigger geographical area
Microscale mapping200For a better understanding of the wind of a particular place (e.g., a couple of sqkm)
Table 4. Weibull probability distribution function.
Station NameC(m/s), AGL (m)k, AGL (m)
106080100106080100
Charfashion4.06.87.58.21.92.32.42.5
Monpura3.86.57.27.91.92.32.52.6
Hatia2.74.85.46.01.61.92.02.1
Noakhali Sadar1.73.33.74.21.41.71.91.9
Companigonj2.54.55.15.61.51.81.92.0
Sonagazi1.93.64.14.61.72.12.12.2
Sandweep4.06.87.58.21.92.32.42.5
Table 5. Mean wind speed and power density estimation by WASP.
Station NameMean Wind Speed (m/s)Power Density (W/m2)
106080100106080100
Charfashion3.66.16.87.358225296372
Monpura3.45.86.57.147194258326
Hatia2.44.34.85.32194127164
Noakhali Sadar1.52.93.33.76334662
Companigonj2.24.04.55.01983113146
Sonagazi1.73.23.64.17375371
Sandweep2.44.44.95.42399134171
Table 6. Average air density for the selected coastal sites.
AreaCharfashionMonpuraHatiaNoakhali SadarCompanigonjSonagaziSandweep
Air density (ρ, kg/m3)1.1791.1771.1751.1761.1781.1741.173
Table 7. The wind speed ranges of the mesoscale maps of the coastal and near-coastal areas of Bangladesh.
Mapping Elevation (m)106080100
Wind speed range (m/s)0.83–3.832.32–4.892.52–5.022.45–5.31
Table 8. The wind speed range for the microscale maps in the coastal area of Bangladesh.
AreaMapping Elevation (m)Wind Speed Range (m/s)
Coastal area102.73–3.89
603.56–4.97
803.69–5.37
1003.83–6.37
Table 9. Wind speed ranges from the microscale maps of the Charfashion and Monpura microsites.
Site NameMapping Elevation (m)
106080100
Wind Speed Range (m/s)
Charfashion3.19–3.804.52–4.934.89–5.375.43–6.37
Monpura3.48–3.724.49–4.974.68–5.315.17–6.19
Table 10. Statistical tests for the two prospective coastal areas of Bangladesh.
Test MethodPMREM/PRMSE
MicrositesCharfashion5.55%0.950.20
Monpura2.35%0.980.08
Table 11. Q–Q plot statistics for the two selected microsites (Charfashion and Monpura).
Error RangeError ± (0–15)%Error ± (15–30)%Error ± (30–45)%Error ± (45–100)%
Percentage40%30%30%0%
Table 12. Wind class of the selected microsites as per IEC 61400-1-2.
Site NameIEC61400-1 Wind Class and Data Recovery Rate (%)
60 m AGL80 m AGL100 m AGL
CharfashionClass S (designer sp.) (96.27%)Class S (designer sp.) (94.56%)Class IIIB (93.58%)
MonpuraClass S (designer sp.) (77.56%)Class S (designer sp.) (77.34%)Class IIIB (77.92%)
Table 13. AEP for the selected microsites.
Site NameAnnual Energy Production (AEP)
60 m AGL (WinWinD-1/60)80 m AGL (GW155-3.3)100 m AGL (GE 1.6-100)
Charfashion1.718 GWh10.806 GWh6.215 GWh
Monpura1.079 GWh8.187 GWh4.829 GWh
Table 14. IEA composite electricity/heat factors of Bangladesh.
Electricity-Specific Factors (kgCO2/kWh)IEA Composite Electricity/Heat Factors (kgCO2/kWh)Difference (gCO2/kWh)Difference (%)
0.637143230.57370640.0634411.10%
Table 15. CO2 emission reductions for different types of WTGs at different heights.
Working AreaTotal Energy Produced (GWh/year) and CO2 Reduction
60 m AGL80 m AGL100 m AGL
Coastal (two microsites)2.79 GWh, 1781.689 tons of CO2 per year18.993 GWh, 12,098.54 tons of CO2 per year11.044 GWh, 7035.028 tons of CO2 per year
Publisher’s Note: MDPI stays neutral with regard to jurisdictional claims in published maps and institutional affiliations.

