Article

Bioenergy Production through Mono and Co-Digestion of Tomato Residues

by
Patrícia V. Almeida
,
Rafaela P. Rodrigues
,
Leonor M. Teixeira
,
Andreia F. Santos
,
Rui C. Martins
and
Margarida J. Quina
*
Department of Chemical Engineering, CIEPQPF—Chemical Process Engineering and Forest Products Research Centre, University of Coimbra, Rua Sílvio Lima, Pólo II—Pinhal de Marrocos, 3030-790 Coimbra, Portugal
*
Author to whom correspondence should be addressed.
Energies 2021, 14(17), 5563; https://doi.org/10.3390/en14175563
Submission received: 6 July 2021 / Revised: 20 August 2021 / Accepted: 31 August 2021 / Published: 6 September 2021

Abstract

:
The agro-industry of tomato generates three types of residues: ripe rotten tomato (unfit for consumption) (RT), green (unripe) tomato (GT), and tomato branches including leaves and stems (TB). These materials are commonly wasted or used as feed for livestock. Energy production through anaerobic digestion is an alternative way to manage and simultaneously valorise these materials. Initially, the operating conditions of mono anaerobic digestion were investigated using RT. Thus, a design of experiments based on a two-level fractional factorial design with resolution V was performed to determine the factors that affect biochemical methane potential (BMP). The substrate to inoculum ratio (SIR), total volatile solids concentration (VSt), working volume (WV), presence of nutrients (Nu), and the pre-incubation of the inoculum (Inc) were investigated. The results showed that SIR is the most important factor. The maximum BMP for RT was 297 NmLCH4/gVS with SIR = 0.5; tVS = 20 g/L; WV = 20%; no pre-incubation and the presence of nutrients. Using these optimum operating conditions, co-digestion was investigated through a mixture design approach. The substrates RT and GT presented similar BMP values, whereas TB led to a significantly lower BMP. Indeed, when high concentrations of TB were used, a significant decrease in methane production was observed. Nonetheless, the highest BMP was achieved with a mixture of 63% RT + 20% GT + 17% TB, with a production of 324 NmLCH4/gVS, corresponding to a synergetic co-digestion performance index of about 1.20. In general, although the substrate RT generates the highest BMP, the mixture with GT did not impair the methane yield. Overall, the co-digestion of tomato residues must be conducted with SIR close to 0.5 and the content of tomato branches in the reaction mixture should be kept low (up to 20%).

1. Introduction

Nowadays, energy is essential for the well-being of modern societies. However, the accelerated rate of the exploitation of fossil fuels has negatively contributed to climate change, in particular to the greenhouse effect. As a result, the demand for renewable energy sources has increased, and according to the European Union Directive 2018/2001 [1], by the end of 2030, 32% of the energy produced must come from renewable sources. In this scope, biomass is a relevant and abundant renewable energy source. The use of wood and crops (corn, sugar cane, and others) may lead to deforestation and competition with the food industry. Thus, to prevent food scarcity, preference should be given to organic matter unsuitable for consumption and/or derived from processing industries. The tomato industry is an important activity in the European Union producing about 16.5 × 10⁶ t of tomatoes in 2019 [2]. During the tomato harvest season, green tomato (unripe), tomato in an advanced stage of maturation (rotten), and tomato plant are commonly left in the agricultural fields or used for animal feed [3]. Considering the estimate proposed by Fritsch et al. [4] and a cultivation area of 235.1 × 10³ ha [2], about 7.8 × 10⁶ t of tomato residues is produced. These residues are examples of abundant and inexpensive biomass that can be valorized by extracting value-added compounds and/or for energy production. Indeed, possible routes for tomato residues management can involve solid–liquid extraction processes for compound recovery and waste to energy processes (e.g., anaerobic digestion and incineration).
Incineration and anaerobic digestion (AD) are two viable ways to produce energy from biomass, whereas the latter process is preferred to manage biodegradable residues with high moisture content. Besides, AD is an environmentally friendly (it occurs in nature) and cost-effective technology in terms of operational costs [5,6]. In practice, AD is a complex biological process that converts, in the absence of external electron acceptors (e.g., oxygen), organic matter into a value-added product, biogas. This gaseous mixture is mainly composed of methane (60–70%) and carbon dioxide (20–30%). In minor quantities, biogas also presents trace elements from the respiration of the microorganisms [6]. In addition to the energetic gas mixture, anaerobic digestion reduces the volume of substrates and may eliminate the pathogen microorganisms present in the reactional mixture. This process occurs in four stages: hydrolysis, acidogenesis, acetogenesis, and methanogenesis, involving a wide number of biochemical transformations and different enzymes [6]. Hydrolysis is considered the rate-limiting step, so pre-treatments can be implemented to make the organic matter more accessible to microorganisms [6,7]. In the literature, it is well established that methane yield depends on some important factors, such as operating conditions and mixture composition. Raposo et al. [8] highlighted that temperature is an important factor for anaerobic biodegradation, and three different temperature ranges can be used: psychrophilic, mesophilic, and thermophilic. Despite the fact that higher biodegradation rates are associated with higher temperatures, the majority of the studies in the literature have considered mesophilic conditions (around 35–37 °C), probably due to the costs involved and the ease of control. The reactional mixture pH is a critical parameter for the activity of the microorganisms [8], so it should range from 7.0 to 8.5 [9]. In this scope, if the reaction mixture does not present enough buffering capacity (alkalinity), the pH may change significantly and the methanogenic activity will be inhibited [8]. The substrate to inoculum ratio is also an important operating condition that influences the stability of the process as well as the kinetics of the anaerobic degradation [8]. Holliger et al. [9] recommend, for most applications, a substrate to inoculum ratio between 0.25 and 0.5. Moreover, the presence of nutrients and inhibitors (heavy metals, volatile fatty acids (VFAs), ammonium, and others) also influence substrate degradation mechanisms.
The anaerobic co-digestion (AcoD) process has been widely studied as an alternative to overcome some of the drawbacks of mono-digestion, by combining at least two different substrates. This type of operation provides an opportunity to compensate for the nutrient imbalance, increase the organic load rate, enhance system stability, improve buffering capacity, and create positive synergies on microorganisms [10,11,12,13]. Overall, through AcoD, the production and composition of biogas can be improved [10]. Furthermore, one of the most relevant advantages of AcoD is the possibility of simultaneously using several residues generated by the same industry [12], as in the tomato industry, or managing seasonal residues with others of continuous production (e.g., sewage sludge). This is one of the reasons why the publication of scientific papers regarding AcoD increased by about 121% (data recorded on the web of science platform) since 2016. According to Mata-Alvarez [10], between 2010 and 2013, agro-industry residues and organic fraction of municipal solid wastes were the main co-substrates considered. Despite the advantages mentioned, some antagonistic effects can lead to organic overloading, acidification, and system failure. So, the optimization of the composition blend in the AcoD is of high relevance. The synergetic effect of AcoD has been evaluated through the co-digestion performance index (CPI) by several authors [12,14,15]. This parameter corresponds to the ratio of ultimate methane potential of co-digestion and the weighted average of the ultimate methane potential of mono-digestion of each substrate. Antagonistic, additive, and synergistic interactions in AcoD are characterized by CPI below, equal, and above 1, respectively. In the literature, the co-digestion of food wastes resulted in a CPI ranging from 1.05 to 1.30 [12], revealing synergistic interactions. Ebner et al. [14] used 11 types of commercial food wastes to investigate the AcoD of 13 different blends, and 9 of them also revealed a synergistic effect.
The biodegradability of the substrate is commonly measured by the biochemical methane potential (BMP). This parameter corresponds to the maximum methane production (NmLCH4/g, in volatile solids basis) from biomass in the absence of oxygen. Thus, the BMP allows the assessment of the substrate potential for energy generation [9].
The AcoD is a challenging process due to the complexity that results from using different substrates with diverse composition. One of the biggest challenges is the optimization of the AcoD systems through the proper selection of feedstocks with complementary compositions [11] and combination ratios [12]. A thorough characterization of the residues and the development of multivariate regression models is needed to address the above-mentioned question. The regression models provide a fast and inexpensive strategy to predict the effect of mixing two or more substrates and achieve the optimum yield [10]. To the best of our knowledge, there are no studies that investigated the possibility of simultaneously treating tomato residues (fruit and plant) through anaerobic digestion, addressing the impact of the mixing ratios on methane production.
Therefore, this study aims to evaluate the anaerobic co-digestion of tomato residues (green tomato, rotten tomato, and tomato plant), whose synergy has not been evaluated in the literature so far. A design of experiments (DoE) is performed to optimize the operating conditions of the anaerobic digestion process and develop a model for BMP prediction as a function of the operating conditions. The kinetics of anaerobic co-digestion are also evaluated. The main novelty of this work is the development of a multivariate regression model for BMP prediction as a function of the tomato residue composition, i.e., the impact of the mixing ratios on AcoD performance stands out.

2. Materials and Methods

2.1. Substrates and Inoculum

Tomato residues, namely rotten tomato (RT), green tomato (GT), and tomato plant (branches and leaves—TB) were collected to be used as substrates in anaerobic digestion. Red-ripe tomatoes (Solanum lycopersicum) were acquired in a local supermarket and were left at room temperature to increase their maturation stage and be unfit for consumption (RT). Unripe tomatoes (GT) and tomato plants (TB) were obtained on a private farm located in the central region of Portugal. RT and GT were minced with a kitchen robot followed by a dehydration step. To reduce the moisture content of the fruits by >80%, filtration with a porous muslin tissue was performed. Then, the residues were stored at −4 °C until use. TB was dried in an oven at 40 °C until it had a constant weight, milled to reduce the particle size (<5 mm), and stored in a sealed and dry environment for further use.
Anaerobic digestion sludge was collected in a municipal wastewater treatment plant in the central region of Portugal to be used as inoculum in the anaerobic assays. The inoculum contained a low concentration of volatile solids (about 9 g/L). So, the sludge was concentrated by gravity action (sedimentation). Briefly, the wastewater was left for about 5 days, so the suspended solid particles progressively sedimented. Then, the upper phase composed of liquid with low suspended solids content was discarded to increase the volatile solids content of the inoculum to >23 g/L.

2.2. Residues Characterization

Total solids (TS) of the residues and the inoculum were determined by drying the samples at 40 °C and 105 °C, respectively, until constant weight. The dried samples were calcined in a furnace at 550 °C for 2 h to calculate the volatile solids (VS). The pH of tomato residues was obtained by suspending the solids in a ratio of 10 L/kg for 2 h. Standard methods (APHA, 1992) were used to measure the total chemical oxygen demand (CODt). A WTW CR3000 thermoreactor (Xylem, London, England) at 150 °C was used to digest the residues for 2 h. Then, the digestate was left to cool in the dark, and a WTW MPM 3000 Photometer (Xylem, New York, USA) was used to measure the absorbance at 605 nm. The elemental analysis (CHNS, %wt) was obtained through the Analyzer NA 2500 equipment (Xylem, New York, NY, USA). The cellulose (CL), hemicellulose (HM), and lignin contents (LG) were determined through the standard procedure from the National Renewable Energy Laboratory (NREL), NREL/TP-510-42618—Determination of Structural Carbohydrates and Lignin in Biomass [16]. The tomato residues samples (300 mg) previously dried at 40 °C were hydrolyzed with a sulfuric acid solution (72%) for 60 min at 30 °C. Then, the suspensions were diluted and autoclaved for 60 min at 121 °C. The suspension was filtered to separate the solid and liquid fractions. The acid-insoluble lignin was obtained by drying the solid fraction at 105 °C until constant weight. The acid-soluble lignin was measured through a Beckman DU 650 spectrophotometer (Beckman Instruments, Brea, CA, USA) at 205 nm. Calcium carbonate was added to the remaining liquid fraction to reach pH 5–6. The resultant suspension was filtered and analyzed by high-performance liquid chromatography (HPLC-RI, Knauer model K 301) (Knauer, Berlin, Germany) to determine the cellulose and hemicellulose contents. The quantification of the structural carbohydrates was obtained indirectly by the identification and quantification of the carbohydrate degradation products (organic acids, alcohols, and others). These compounds were detected with a Phenomenex Rezex ROA Organic Acid H+ column (300 × 7.8 mm) (Phenomenex, Torrance, CA, USA). More details are described in Gaspar et al. and Almeida et al. [17,18].

2.3. Design of Experiments for the Anaerobic Digestion

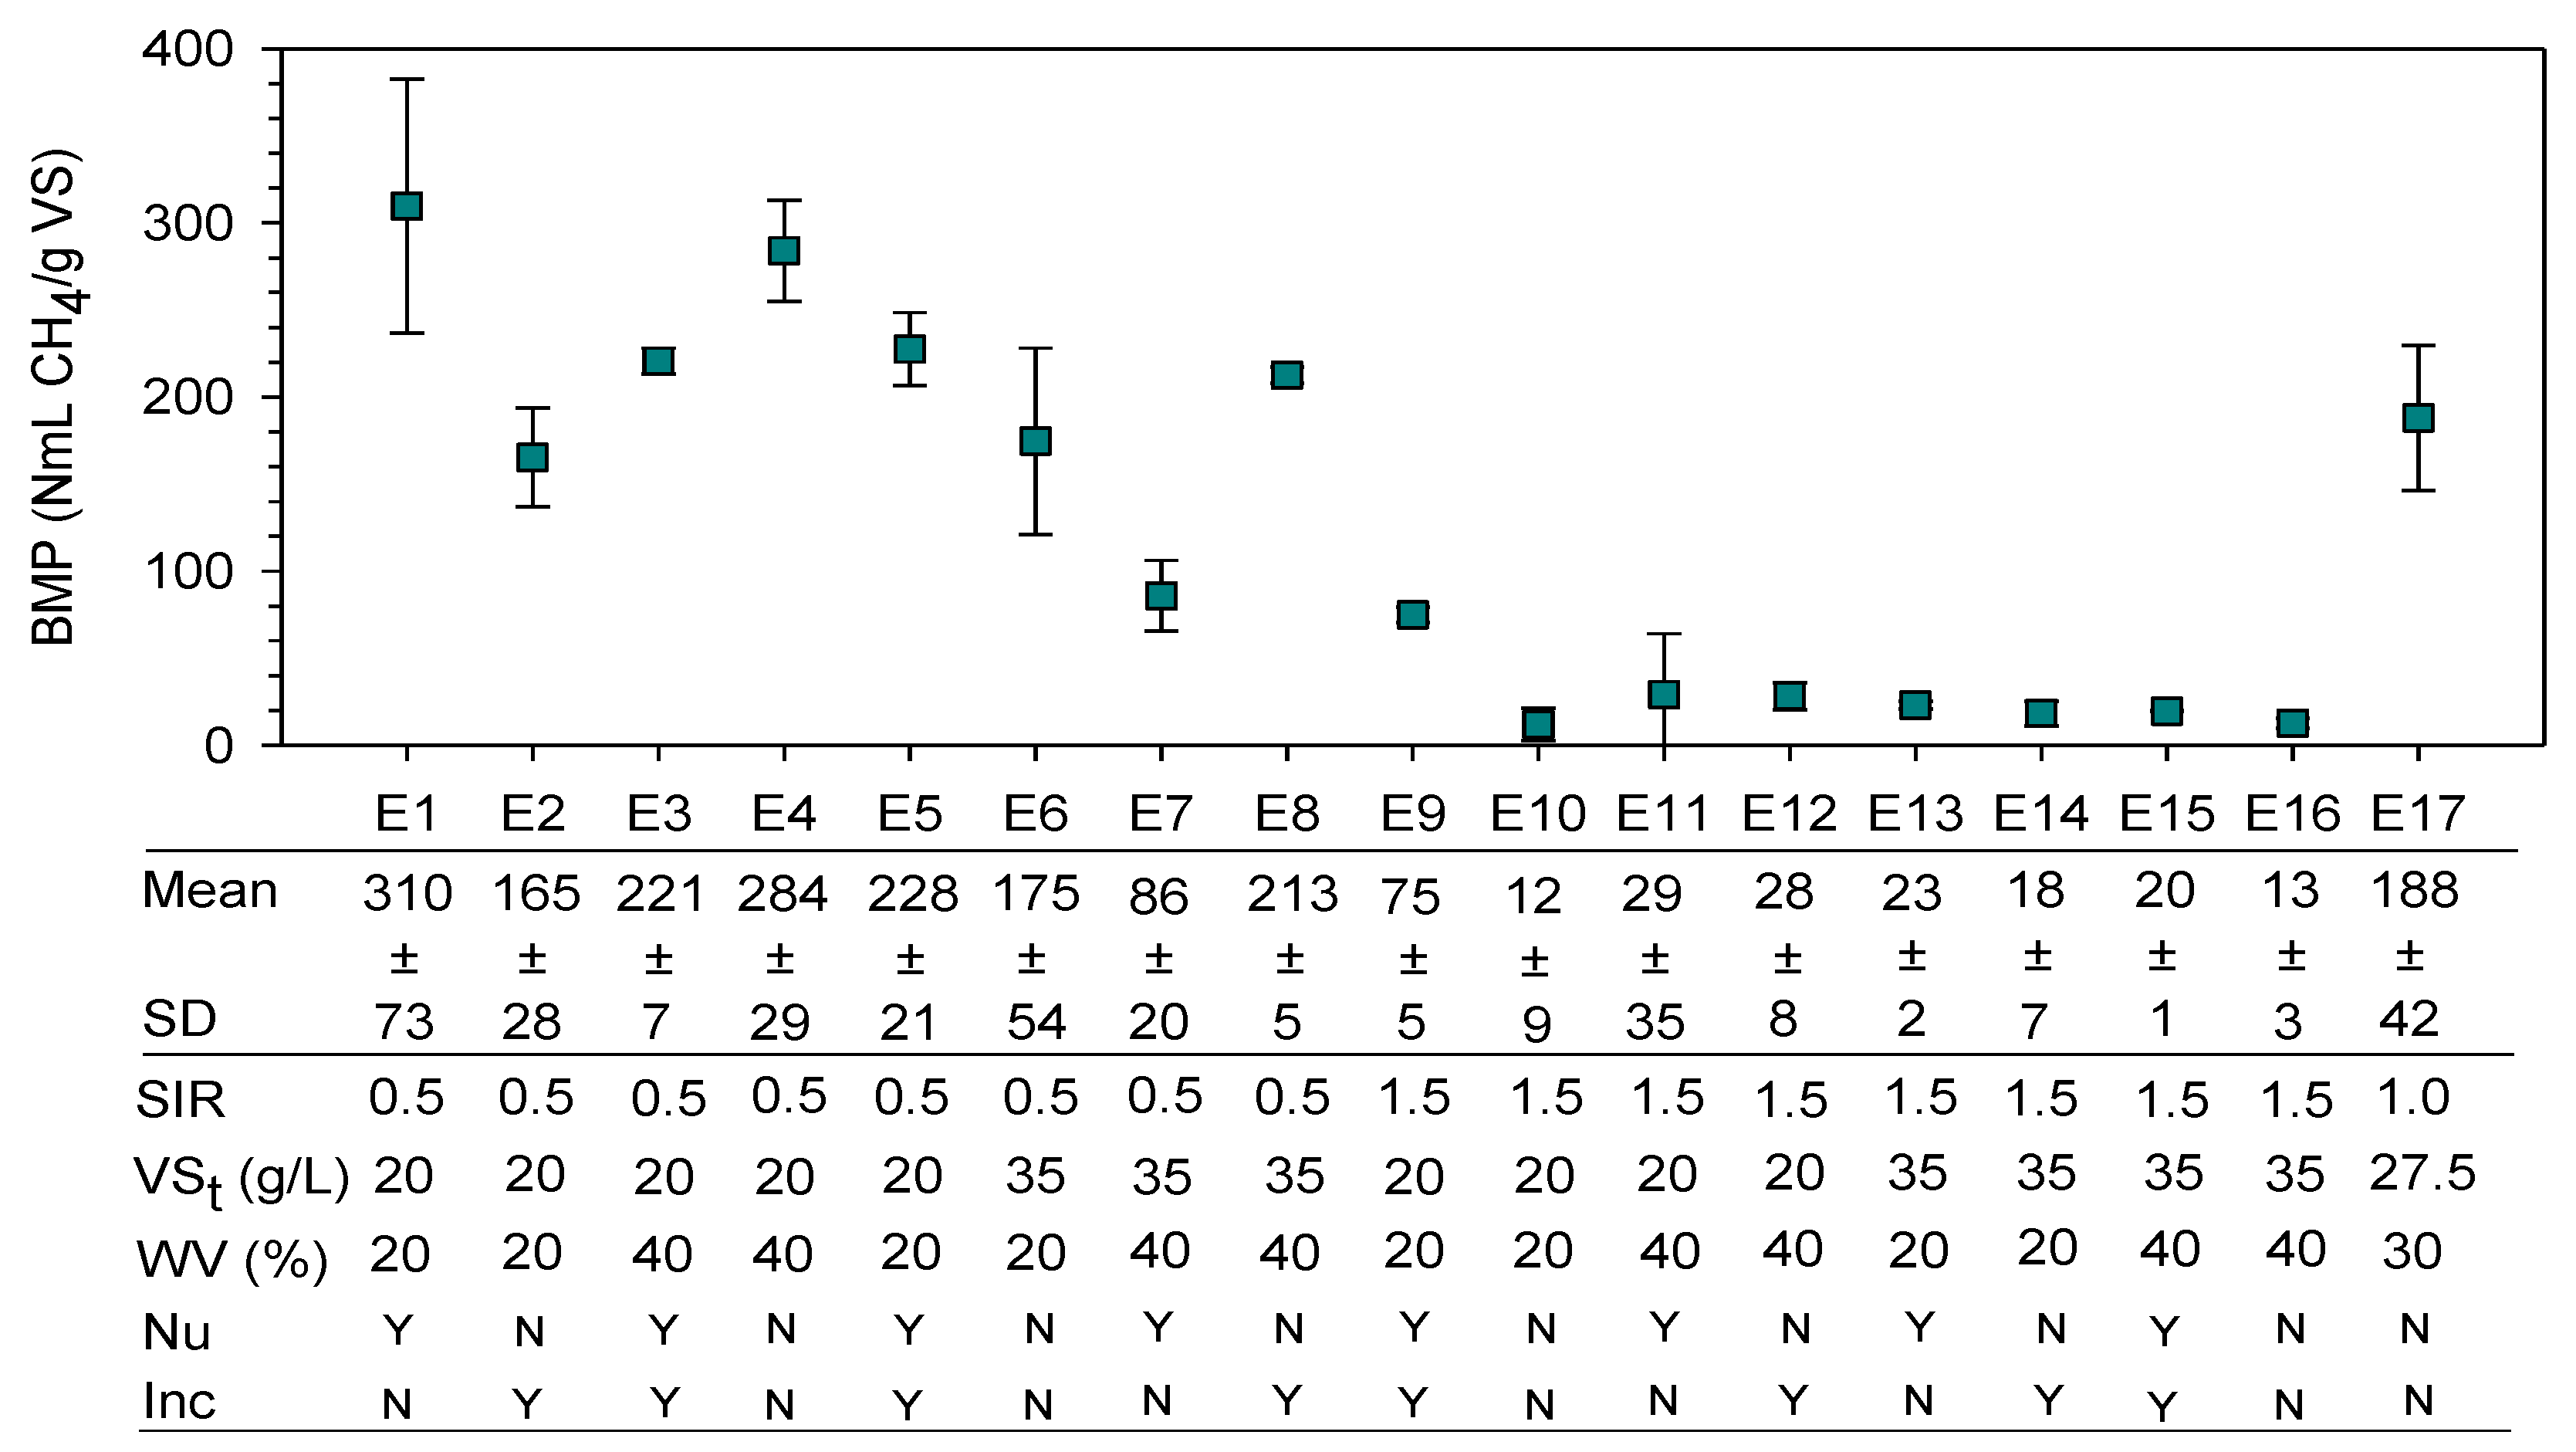
2.3.1. Optimization of Operating Conditions

The effect of some of the most important AD conditions was assessed using RT as the reference substrate. A 2-level fractional factorial design (25−1) with resolution V was conducted to select the most relevant factors and optimize them, using the JMP® Pro 15 software (SAS Institute, Cary, NC, USA). Three continuous and two nominal factors were selected: the substrate to inoculum ratio (SIR), the concentration of total volatile solids (VSt), the working volume (WV), nutrients (Nu), and inoculum incubation (Inc)—Table 1. Some authors recommend the use of a solution composed of micro and macronutrients essentials for the growth of microorganisms. This aspect was taken into account in a nominal variable “nutrients—Nu”. Moreover, the incubation of the inoculum was carried out to reduce the effect of methane production derived from the inoculum. Additionally, the relevance of the variable “incubation—Inc” was considered in the DoE as a nominal variable. The preparation of the nutrients solution and the incubation is described in Section 2.4. The experiments were performed in duplicate and randomized completing a set of 34 independent runs, including a central point. In the end, a 2nd-order regression model for BMP prediction was developed using a least-squares regression method. A set of four runs (in duplicate) with different operating conditions from the ones tested before were carried out to validate the model.

2.3.2. Optimization of Co-Digestion

A design of experiments (DoE) was carried out to determine the effect of different mixtures of all tomato residues (RT, GT, and TB) on the anaerobic digestion performance. For this purpose, an augmented simplex centroid design (ABCD design) was selected, since it includes runs with 100% of the substrates, combinations of 2 substrates, combinations of 3 substrates, and central points. The experiments were performed in triplicate, completing a set of 30 runs, and randomized by the software used (JMP® Pro 15) (SAS Institute, Cary, NC, USA). The optimal operating conditions previously determined for RT were applied in this set of assays. In the end, the canonical polynomials of Scheffé were used to fit experimental data and create a prediction model. Design-Expert® V12.0 software (StatEase, Minneapolis, USA) was also used to complement the analysis. A first-order kinetic model (FOKM) was applied to the experimental data to describe the kinetics of the AD process:
SMP   ( t ) =   SMP × ( 1   e µ t )
where SMP (NmLCH4/gVS) corresponds to cumulative specific methane production, SMP∞ (NmLCH4/gVS) corresponds to the maximum methane production, µ (1/d) is the rate constant of degradation, and t (d) is the time.
The co-digestion performance index (CPI) was calculated to evaluate the synergetic interactions in the optimum blend:
CPI = BMP i , n i n x i BMP i
where BMP i , n corresponds to the experimental biochemical methane yield obtained in the AcoD, x i represents the fraction of the substrate applied in the co-digestion, and BMP i refers to the experimental biochemical methane yield from the mono-digestion of the i substrate [15].

2.4. Anaerobic Digestion Procedure

The BMP was assessed in bottles of 1 L sealed with rubber stoppers. Reaction mixtures were prepared carefully by adding the inoculum, the substrate(s), and the nutrients and water whenever necessary to meet the defined operating conditions. The flasks were flushed with N2 for 10 min to ensure an inert atmosphere. The AD tests were carried out at 37 °C for 50 days and the bottles were manually shaken once a day for a few minutes (around 3 min). Gentle shaking is important so as to not break the cells of the microorganisms. Manometric measurements were used to estimate the volume of biogas produced and accumulated in the headspace of the flasks. Briefly, the pressure (P) inside each bottle was measured with a manometer sensor and the biogas volume at STP conditions was calculated as follows:
V biogas ( NmL g VS ) = V headspace PT STP P STP T
where V headspace corresponds to the volume of the headspace of the bottle, T STP and P STP are, respectively, temperature and pressure at 1 atm and 0 °C, and T corresponds to the temperature inside the reactional mixture. The content of methane, carbon dioxide, oxygen, and hydrogen sulfide were measured through GAS DATA (GMF 406) equipment. The methane produced by the inoculum activity was deducted from the total biogas produced. The nutrient solution was prepared as reported by Angelidaki et al. [19]. Before running the BMP assays, the inoculum was incubated at 37 °C for 4 days whenever necessary.

2.5. Statistical Analysis

Both designs of experiments were analyzed using the JMP® Pro 15 and Design-Expert® V12.0 software, and a significance level (α) of 0.05 was adopted to determine the relevant factors. Although the assays were performed for 50 days, the predictive models were developed based on experimental data obtained in the first 30 days. Indeed, for easily biodegradable substrates, a residence time ranging between 10 to 30 days is usually applied [8]. Kinetic curves were obtained by non-linear regression to experimental data using the SigmaPlot 11.0 software. The fitting capacity of all models was evaluated through the coefficient of determination (R2) and the root means square error (RMSE). The adjusted R-square (R2adj) was also considered for analyzing the multivariate regression models developed by the design of experiments.

3. Results and Discussion

3.1. Residues Characteristics

The main physical and chemical characteristics of tomato residues are presented in Table 2. Tomato fruits (RT and GT) present a similar solid content (lower than 8%) and an acidic pH around 4–5. The total solid content is higher for TB, while pH is around neutral (6.82). Moreover, all residues are mainly constituted by carbon and oxygen (>37% and >35%, respectively). According to the literature, the biodegradability of the materials is directly affected by the lignin content [8,20]. The equation developed by Chandler et al. [21] states that the maximum biodegradability fraction in anaerobic conditions is about 0.83 and the LG content should not exceed 20%. Thus, since TB presents higher content of this macromolecule, lower methane production is expected from this substrate. The results presented are in accordance with the literature [17,22,23,24,25]. The structural carbohydrates (cellulose and hemicellulose) were higher for GT. This may indicate that the maturation stage affects the nutritional value of tomato fruit, as stated by Petroupolous et al. [26]. However, the differences in the results can also be due to agronomic conditions [27].

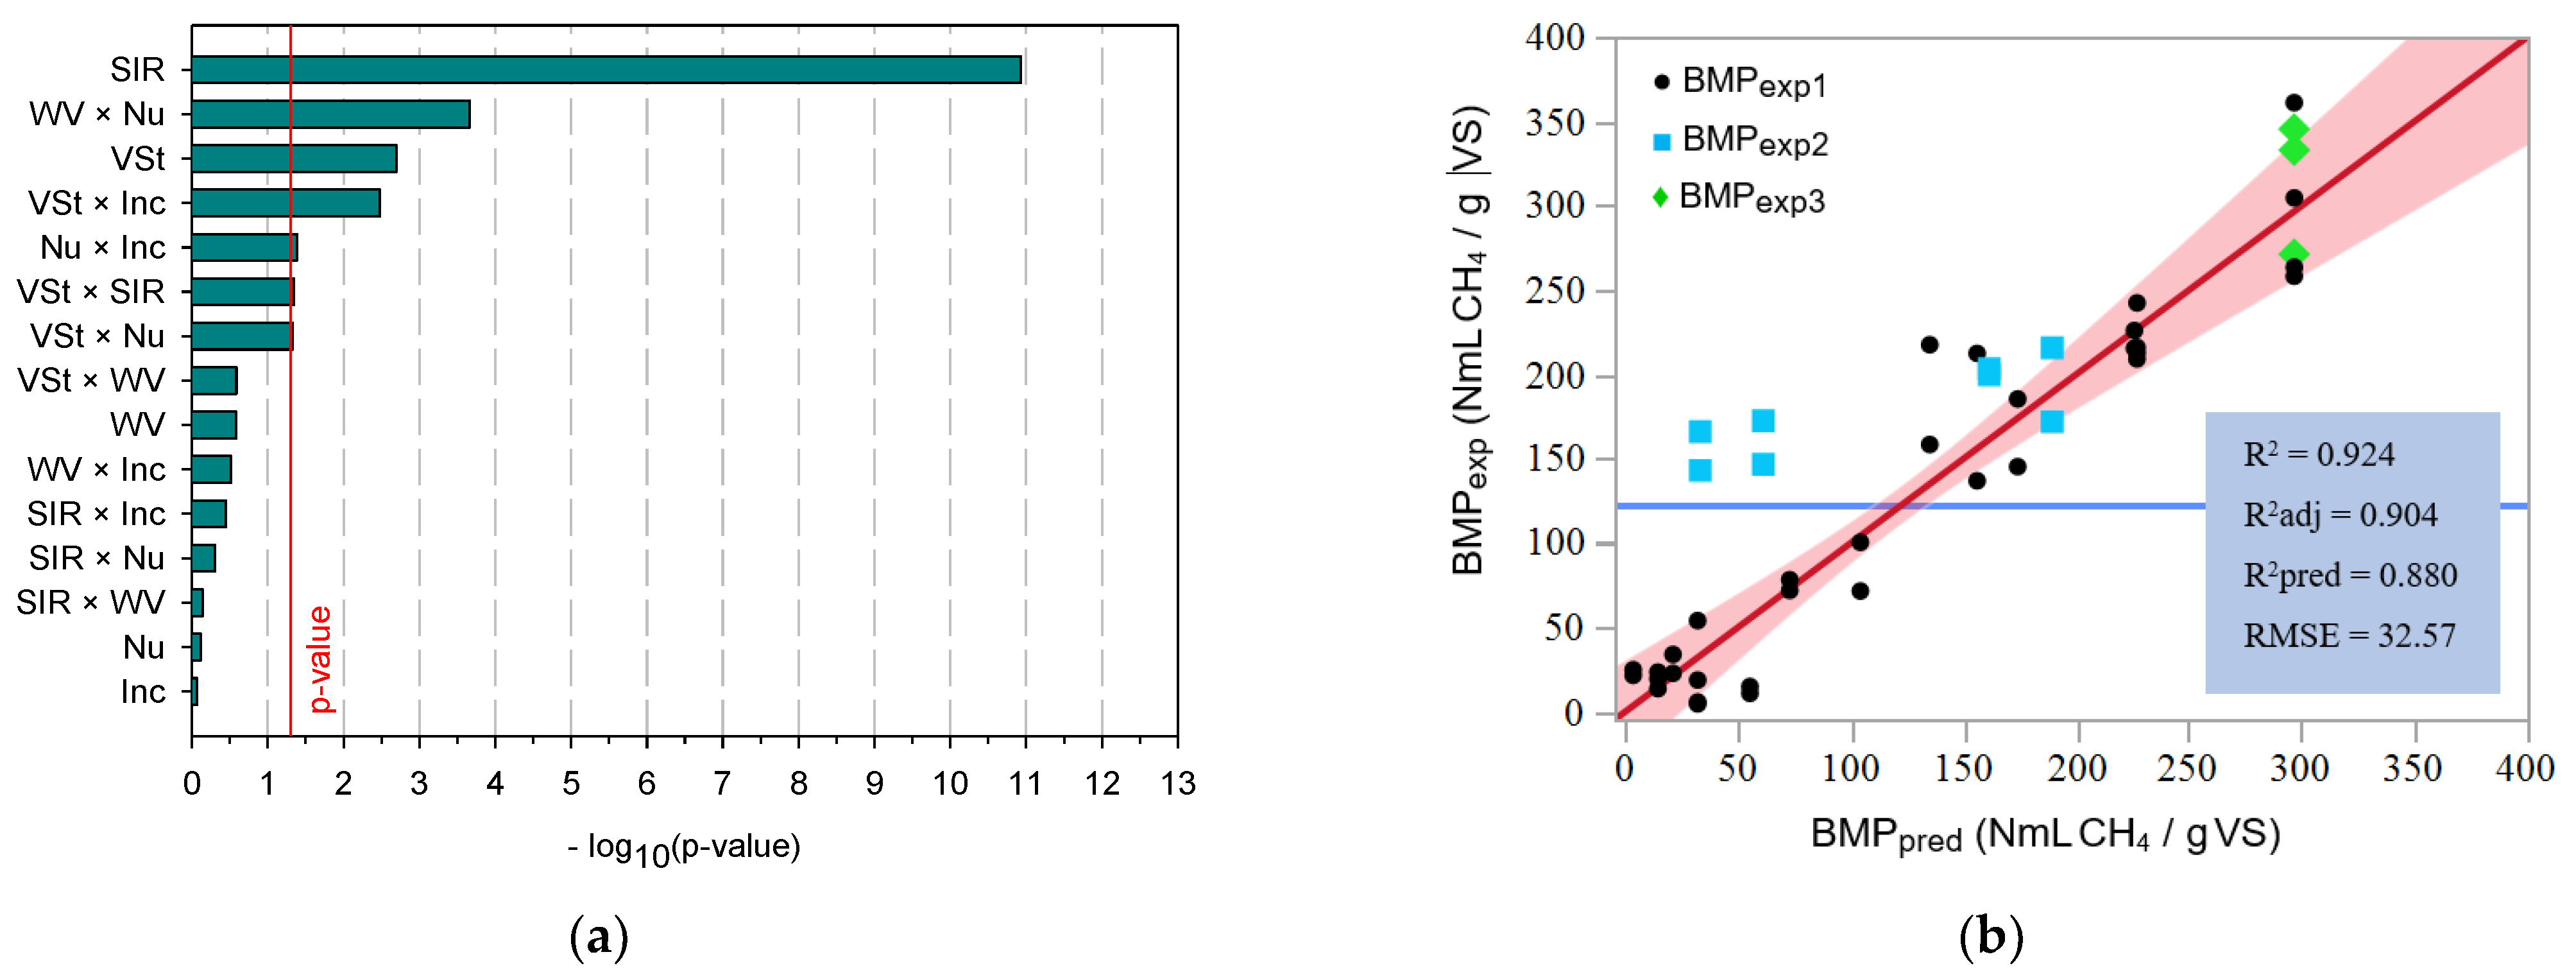
3.2. Optimization of the Anaerobic Digestion

The BMP results obtained by the 25−1 fractional factorial design are presented in Figure 1. From a macroscopic point of view, two major groups are identified: one characterized by higher methane productions in a range of 86 to 310 NmLCH4/gVS and another characterized by lower methane yields ranging from 12–75 NmLCH4/gVS. The main difference between these groups is the substrate to inoculum ratio (SIR). Indeed, an SIR of 0.5 was found to be the most favorable operating condition for the anaerobic digestion process and also the most significant factor. The excess of substrate present in the reactional mixture when an SIR of 1.5 was applied caused an inhibitory effect in the methane production, probably due to a rapid accumulation of fermentation intermediates (such as VFA). The overload of the substrate was also reported by other authors [9,28,29]. Liu et al. [29] investigated the impact of SIR on methane yield using food waste, green waste, and their mixture as substrates. The authors reported the SIR to range from 0.2 to 0.625 and reported a reduction in methane yield of 778 to 252 mLCH4/gVS for the anaerobic digestion of food waste. Raposo et al. [28] studied the anaerobic digestion of sunflower oil cake and reported a considerable decrease in methane yield from 227 to 107 mLCH4/gVS when the SIR increased from 0.33 to 2. Indeed, they observed an accumulation of VFA for a higher SIR (1.25–2), proving the imbalance of the process [28]. Moreover, the methane yields for AD of rotten tomato observed in this study are in agreement with the values found in the literature (211–341 NmLCH4/gVS) [17,20,30,31]. Rodrigues et al. [20] evaluated the anaerobic digestion of RT using flasks of 300 mL, a working volume of 75%, and a SIR of 0.5 at 37 °C, and reported a BMP of 295 NmLCH4/gVS. A lower value of 211 NmLCH4/gVS was obtained for the same substrate by Gunaseelan [31], while different operating conditions were applied. Gil et al. [30] fed the system with a synthetic medium to activate biomass before initiating the experiments and then performed an acclimatization step adding small amounts of the substrate over 15 days. This procedure allowed a BMP of 299 NmLCH4/gVS to be reached.
A second-order factorial model was applied to study the effect of each factor and the interactions between them on the response variable. The significance of the factors and interactions are shown in Figure 2a. In Figure 2b, experimental BMP (BMPexp) is compared with the predicted BMP (BMPpred). The terms that cross the red line in Figure 2a are those that have the most impact on the response variable (BMP). The insignificant factors were removed sequentially until only significant (α < 0.05) factors remained. The main factors SIR and VSt revealed a considerable effect on BMP as well as the interactions: WV × Nu, VSt × Inc, Nu × Inc, VSt × SIR, and VSt × Nu. The removal of the insignificant terms led to an increase in the adjusted R-squared (R2adj) and predicted R-square (R2pred) by 1% and 8%, respectively. Although the coefficient of determination decreased by 2%, the model still presented a good fit (R2 = 0.924). Since anaerobic digestion is a complex process with high standard deviations associated, an R2 close to 1 was not expected. In Table 3, the significant terms of the predictive model (Equation (4)) are reported. The SIR presented a coefficient with high magnitude and it is the factor that affects the response the most.
Four sets with intermediate levels of operating conditions were performed to validate the obtained model. The experimental data are presented in Figure 2b as blue squares. Four points are clearly far from the predicted BMP, indicating a lack of fit of the model for the respective operating conditions. These experiments were carried out with an SIR of 1.25, which may have caused the observed discrepancy. As previously stated, the SIR has a significant effect on the model. In fact, the assays performed with an SIR of 1.5 were revealed as unfavorable, and the tests with an SIR of 1.0 showed high uncertainties. However, the validation experiments with an SIR of 0.75 were well predicted by the model (Equation (4)). So, this model seems to lead to good BMP predictions for an SIR between 0.5 and 1.0.
The maximum BMP was determined by the optimization of the operating conditions through the maximization of the desirability function. The lower levels of the continuous factors (SIR = 0.5; VSt = 20 g/L; WV = 20%), the use of nutrients (Nu = Y), and the use of non-incubated inoculum (Inc = N) were found to be the optimum operating conditions. The model predicted a BMP of 296.7 ± 33.5 NmLCH4/gVS, which were validated by the experimental results (green marks in form of a diamond, presented in Figure 2b).

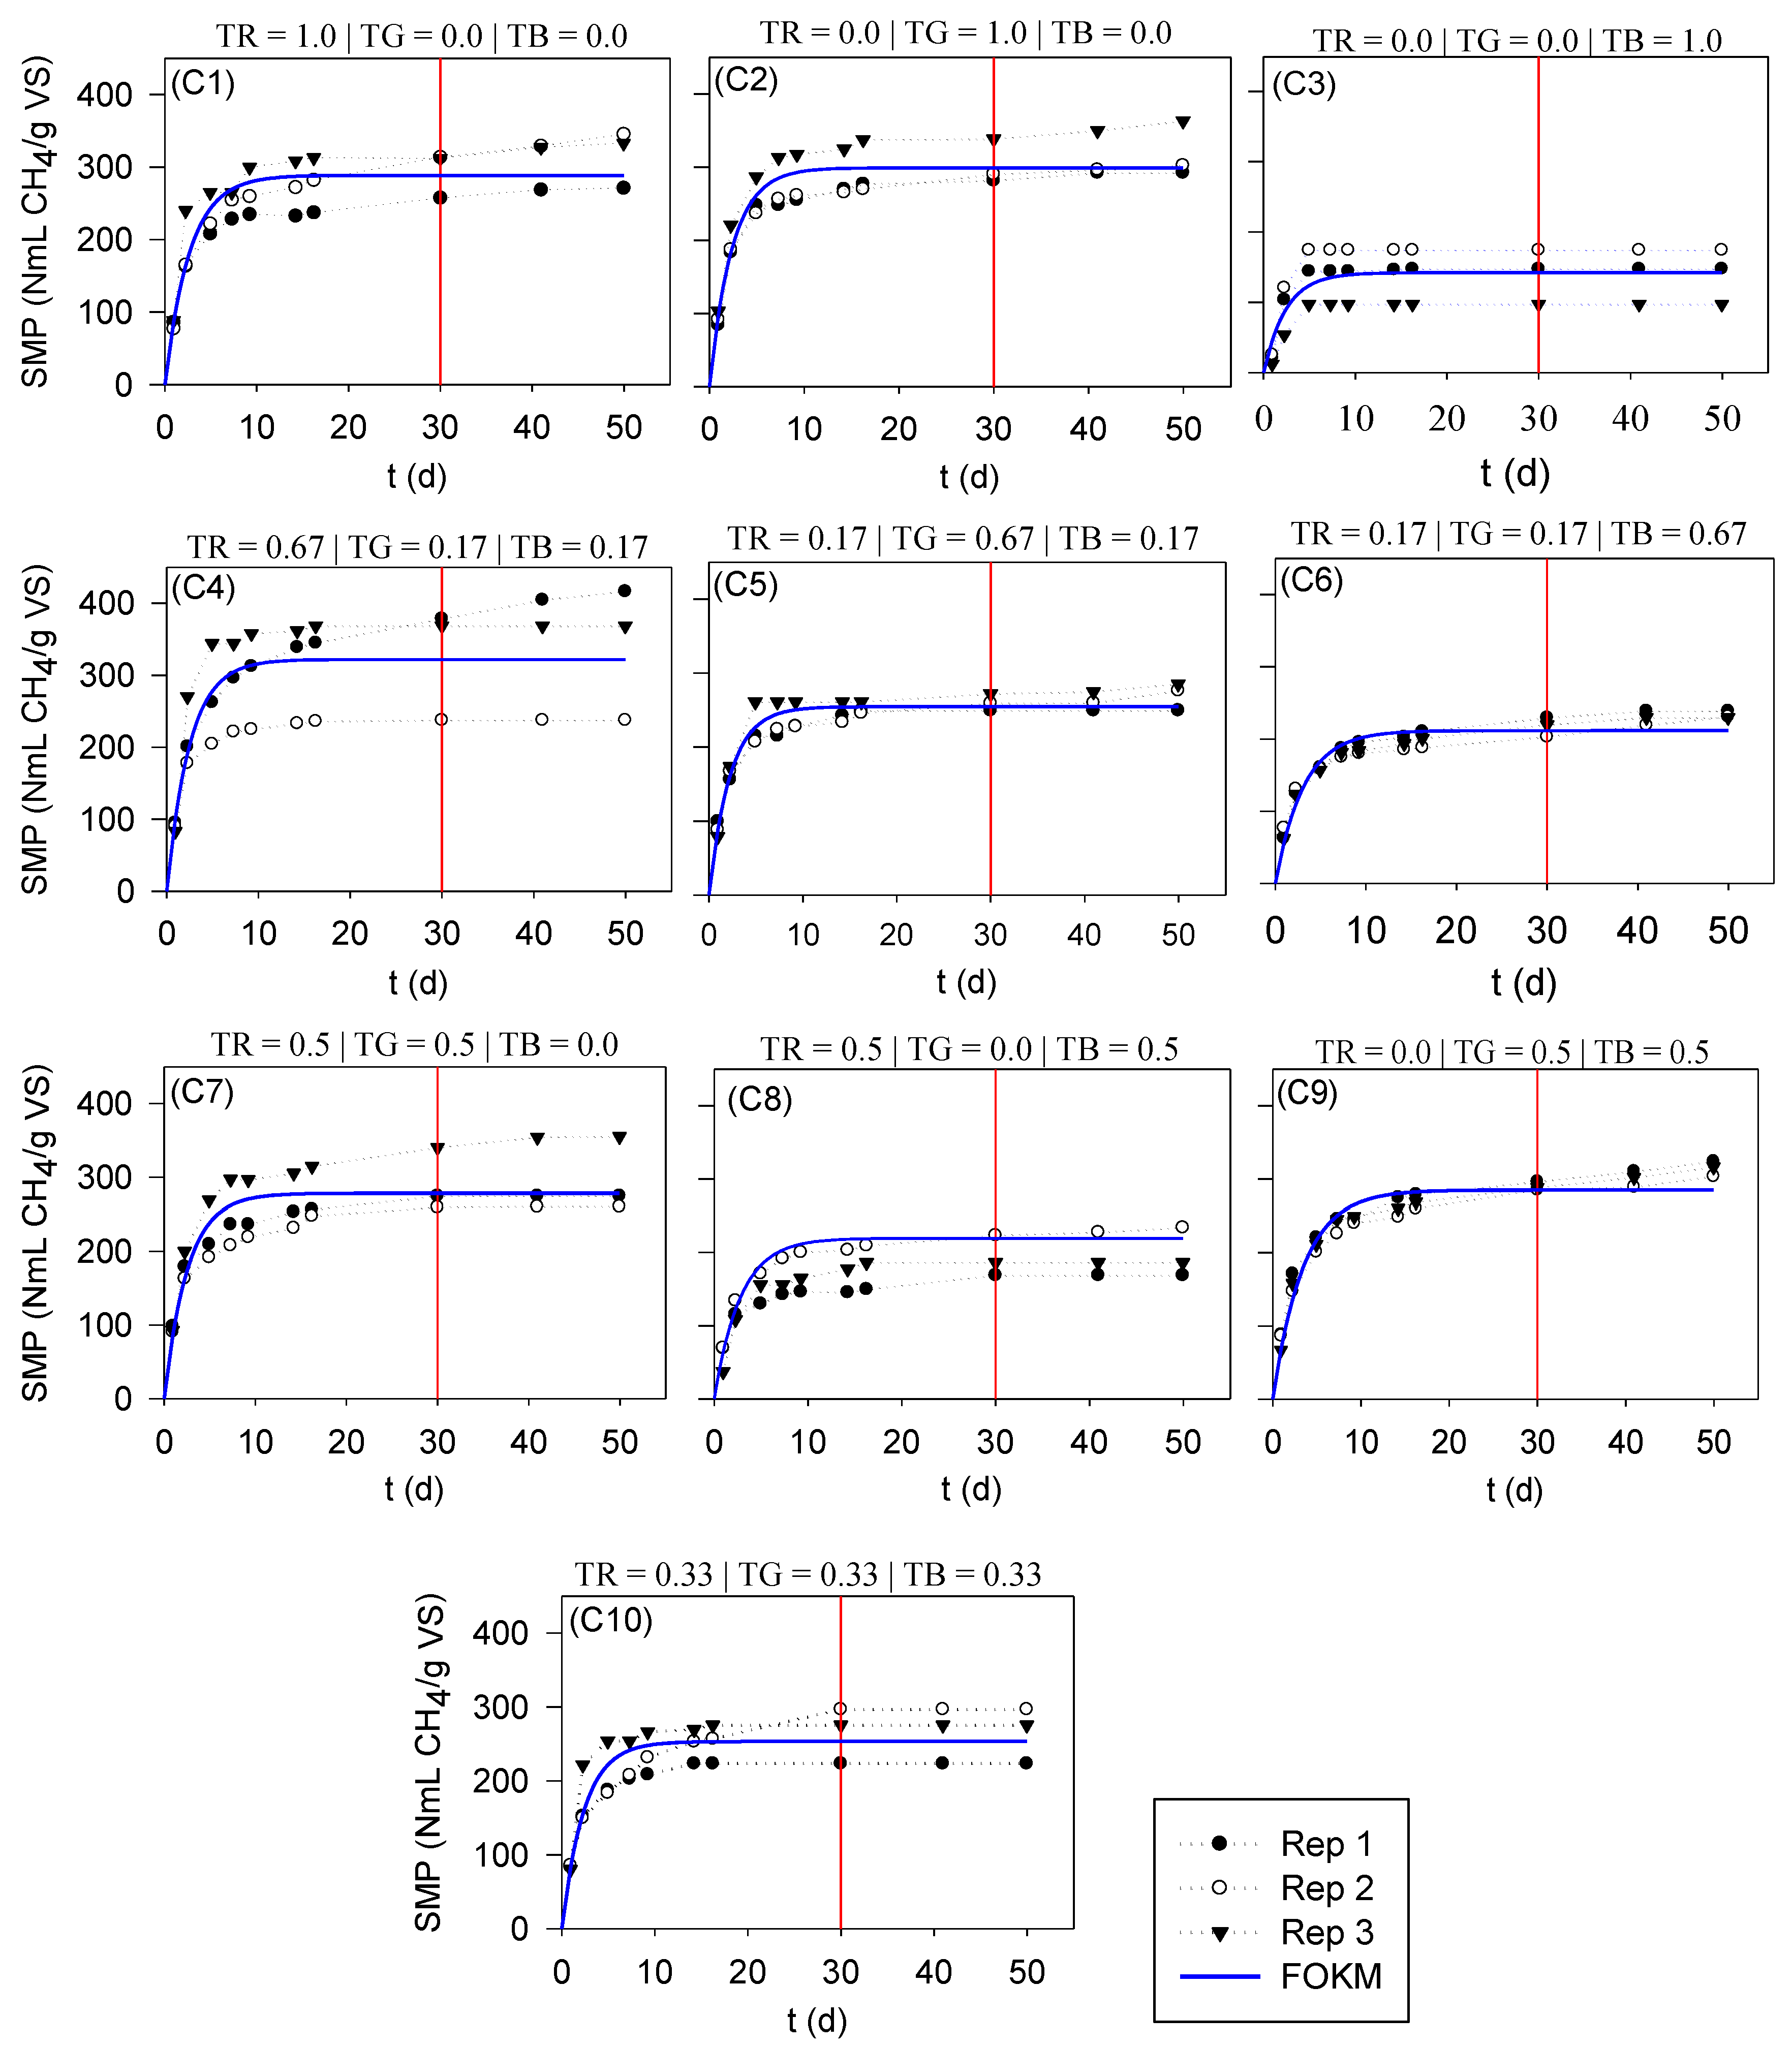
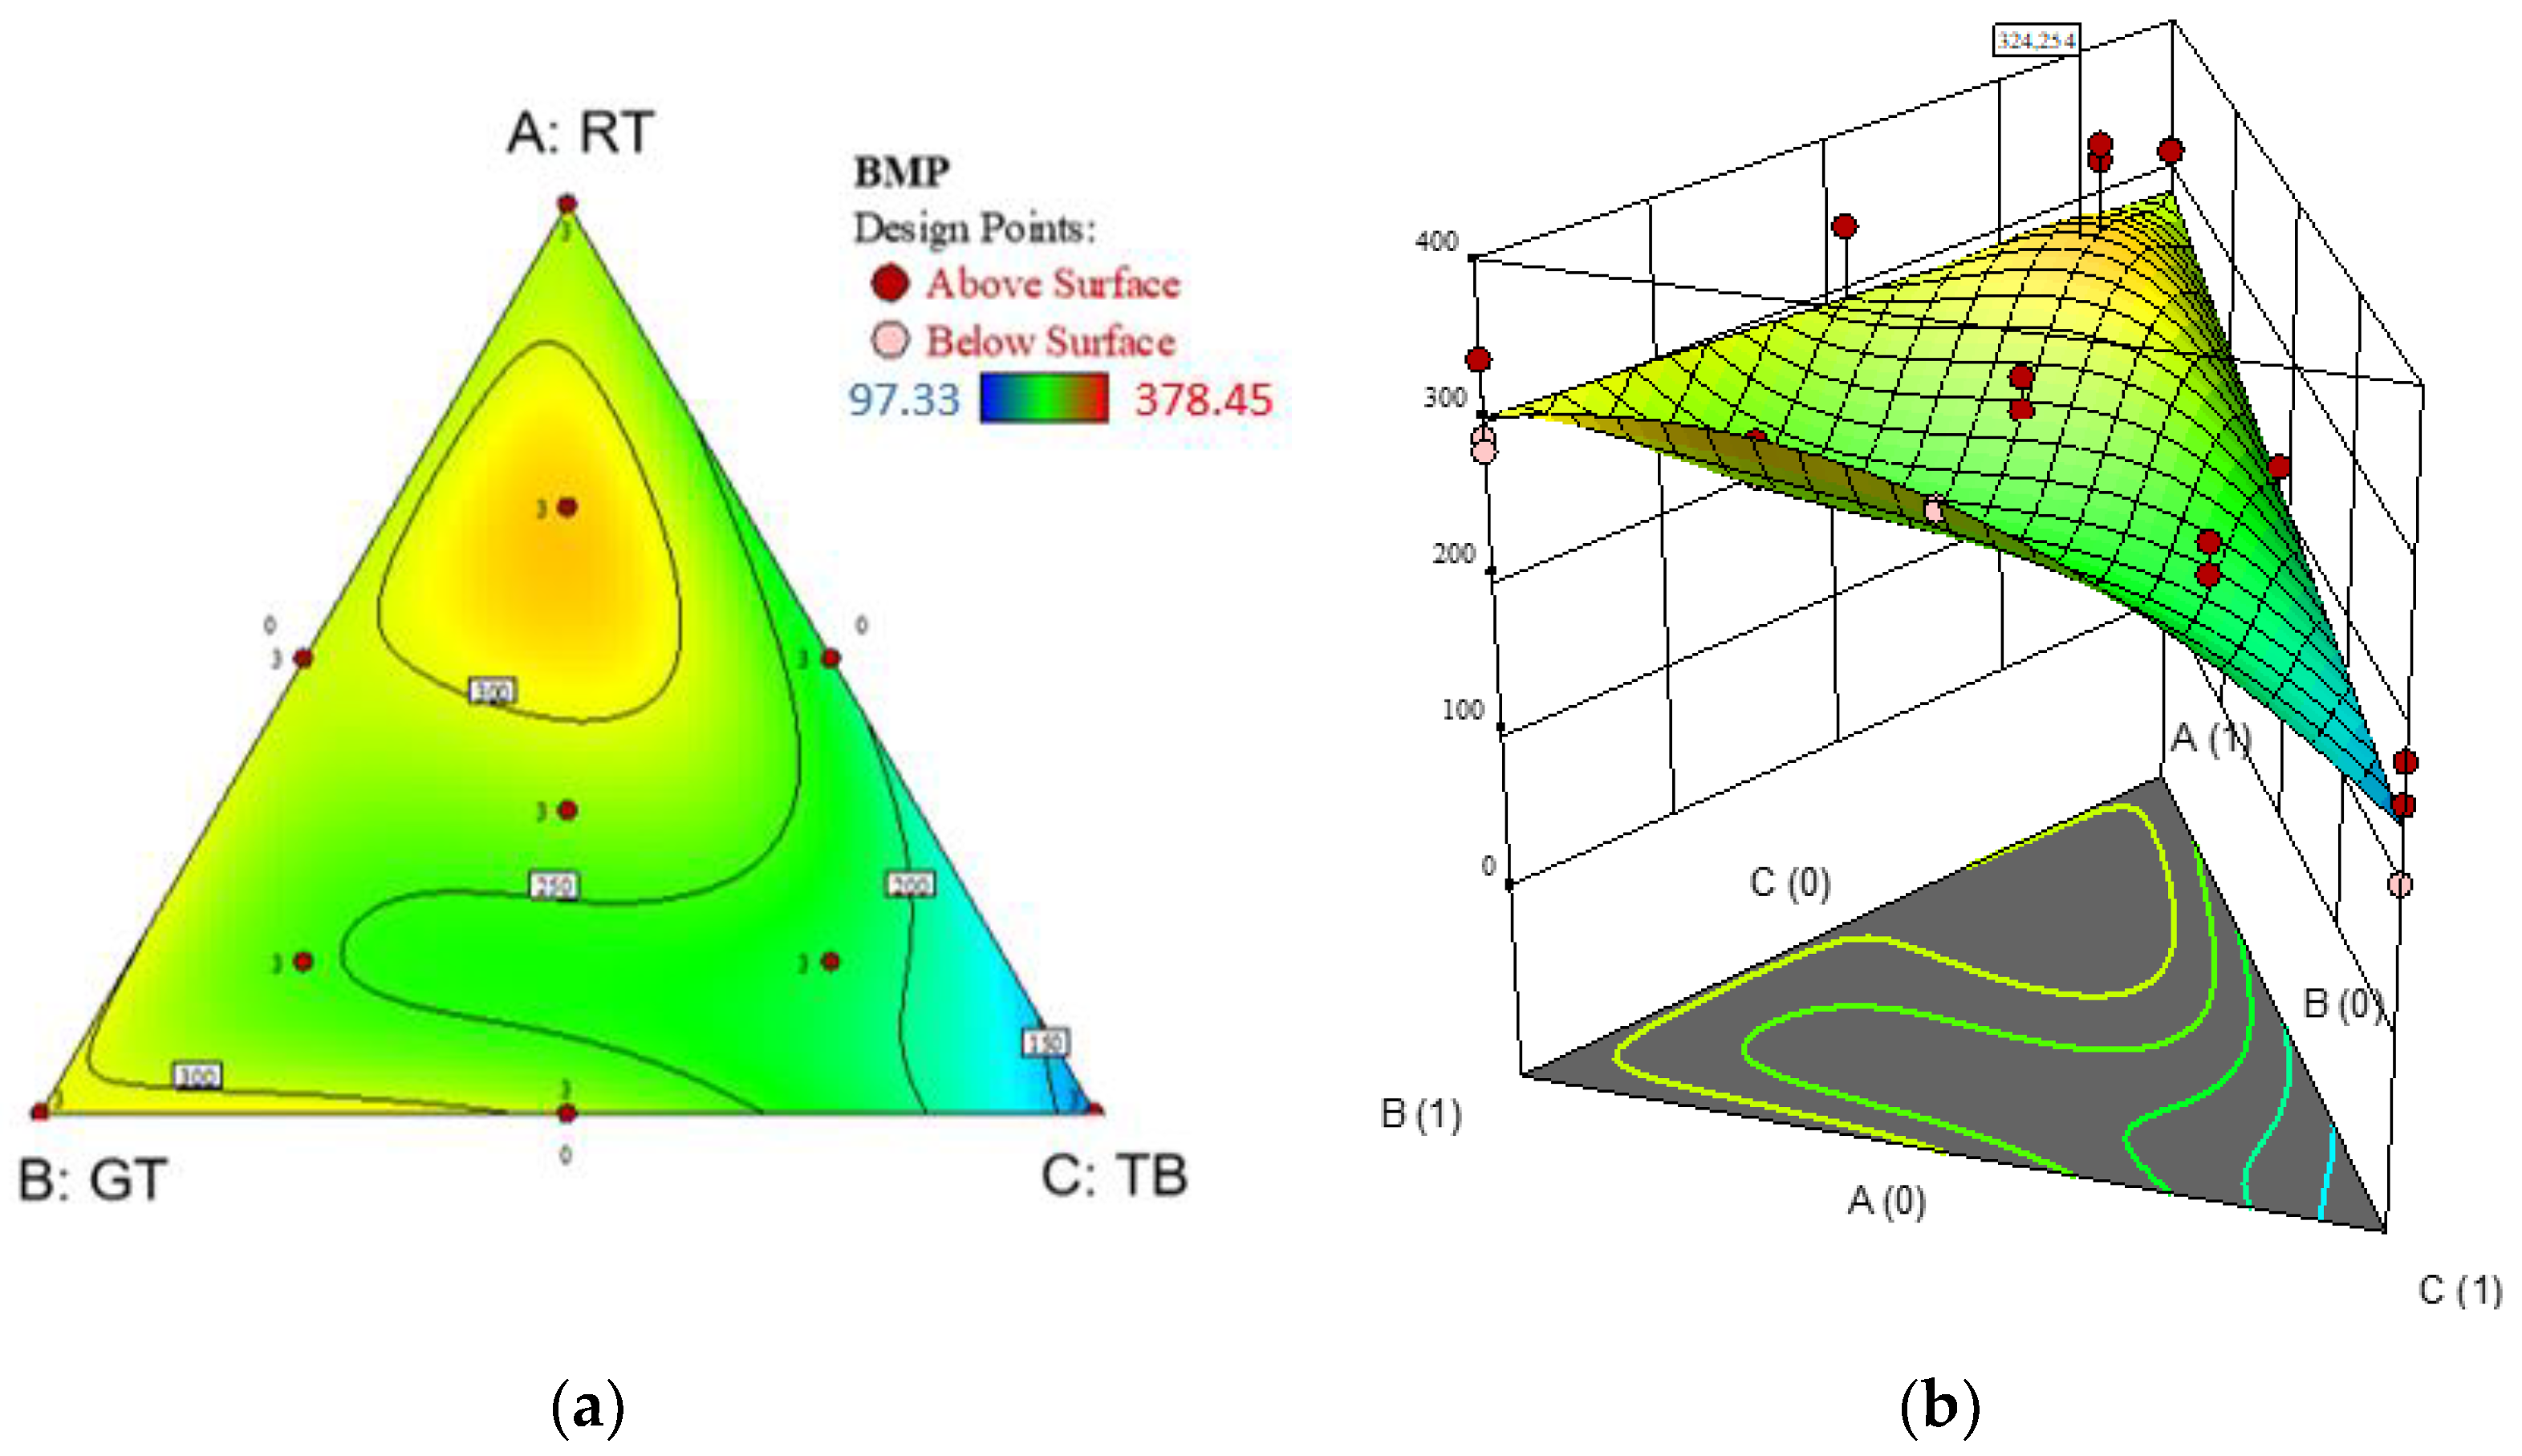
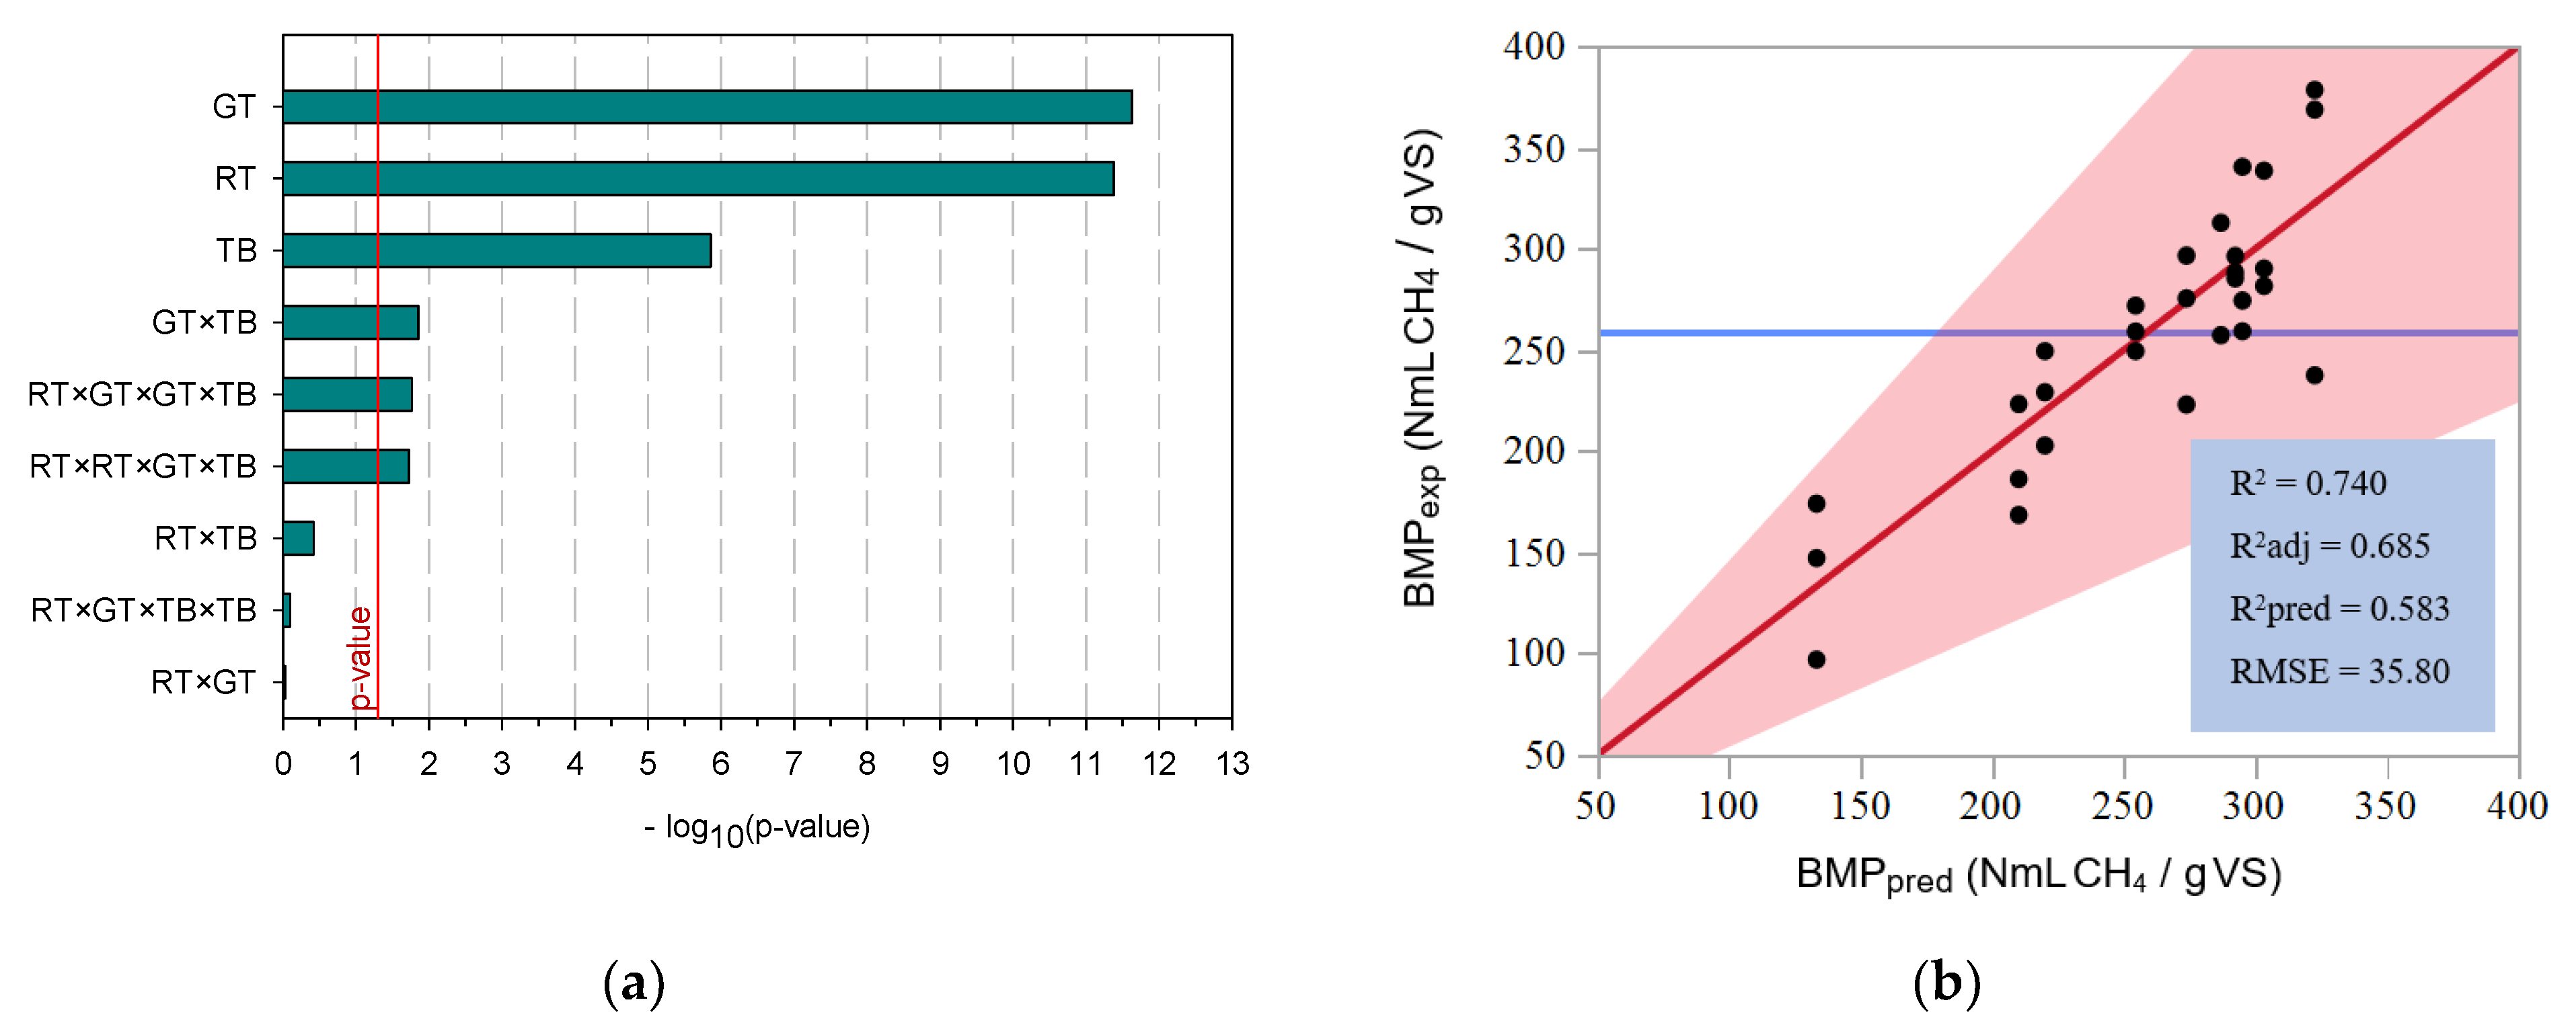
3.3. Co-Digestion of Tomato Residues

The AcoD of all tomato residues (RT, GT, and TB) was evaluated through a mixture design, considering the optimum operating conditions reported in Section 3.2. Figure 3 shows the specific methane production (SMP) over time (t) for each experiment. Regardless of the substrate, methane production followed a first-order kinetic model (FOKM). The kinetic model parameters for each substrate mixture obtained through a non-linear regression are presented in Table 4. In general, the fitting with FOKM shows good BMP prediction, with high R2 (>0.62) and reasonable RMSE (<39 NmLCH4/gVS). Higher methane production was observed when more than 50% of RT or GT were used in the reaction mixture. Methane production of 373 ± 7 NmLCH4/gVS was achieved for a substrate mixture composed of 67% RT, 17% GT, and 17% TB. On the other hand, the anaerobic digestion of 100% TB produced the lowest methane yields (140 ± 40 NmLCH4/gVS). This outcome was expected, since TB presents high lignocellulosic content, which is hardly biodegradable. Similar results for the mono-digestion of TB were found in the literature [32,33]. Indeed, Li et al. [32] studied the anaerobic digestion of different crop residues, including tomato plant. This study reported a BMP of 124 mLCH4/gVS for tomato plant using an SIR of 0.5, a working volume of 70%, and a temperature of 36 °C as operating conditions. Another study observed a slightly higher BMP (170 mLCH4/gVS) for tomato plant using similar operating conditions [33]. RT and GT produced similar (α < 0.05) volumes of methane.
A regression model was performed to evaluate the effects of the main factors and interactions on the response (BMP). Canonical polynomials of Scheffé were applied to fit the data using the Design-Expert® V12.0 software. The special quartic model was selected, since it presented higher R2 and R2adj and there were no aliased terms. The factors that most affect methane production are presented in Figure 4a. In Figure 4b, the experimental results versus the predicted values are presented. As in Section 3.2, the insignificant factors (α > 0.05) were removed successively, and at the end, only significant factors and interactions remained. Methane production in the co-digestion of tomato residues is mainly affected by the following factors and interactions: GT, RT, TB, GT × TB, RT × GT2 × TB, and RT2 × GT × TB.
After removing the insignificant terms, the special quartic model for BMP prediction in the anaerobic co-digestion of tomato residues is presented in Equation (5), considering RT, GT, and TB as fractions.
BMP = 287.015 × RT + 303.402 × GT + 133.452 × TB + 296.164 × GT × TB +5437.321 × (RT2 × GT × TB) −
5458.165 × (RT × GT2 × TB)
The removal of the insignificant terms led to an increase in the adjusted R-squared (R2adj) and predicted R-square (R2pred) values by 17% and 5%, respectively. This model explains about 75% of the variability of the response. However, anaerobic co-digestion processes present high variability, so an R2 far from 1 may make it reasonable to accept the obtained model.
The composition of the mixture that maximizes the methane production was obtained by maximizing the desirability function. Figure 5 presents an orange region that maximizes the response. As mentioned before, a mixture richer in RT instead of GT presented higher methane yields, while mixtures richer in TB led to lower BMP values. A maximum of 324 ± 38 NmLCH4/gVS can be achieved with a mixture composed of 63% RT, 20% GT, and 17% TB. This means that even if higher yields are achieved for mixtures richer in RT and/or GT, the presence of low amounts of TB in the reactional mixture does not impair methane production. Indeed, the CPI for the optimum blend is about 1.20, revealing a synergistic interaction.
As a final remark, it is important to note that both AD and AcoD were incrementally used because a considerable number of biodegradable residues can be managed to obtain renewable energy and nutrients recovery (digestate). Currently, mono-digestion is the most common process at the industrial scale [12]. However, the need to treat a huge number of residues, some of them produced in high quantities in modern society (e.g., industrial and agricultural residues, organic fraction municipal solid wastes, etc.) has boosted the interest in AcoD. The present study highlights the relevance of the composition of the reactional mixture in methane production and facilitates the selection of dosage rates, reducing the time and costs associated with laboratory experiments [10]. In the future, biorefinery approaches will be further explored, where processes of AD and/or AcoD will play a central role, due to the capacity of managing the fractions remaining in diverse processes (e.g., solid–liquid extraction for recovering value-added compounds) [17,18].

4. Conclusions

In this work, the volume of methane produced through the anaerobic digestion of tomato residues (rotten tomato, green tomato, and tomato plant) was assessed as well as the main variability sources. A two-level factorial design applied to the digestion of rotten tomato allowed the identification of the main operating condition that affects the anaerobic digestion process. The substrate to inoculum ratio was highlighted as the factor with the most impact on the biochemical methane potential (BMP). A substrate to inoculum ratio of 0.5 led to the best performances (86–310 NmLCH4/gVS). Indeed, the design of experiments revealed that the substrate to inoculum ratio and the total concentration of volatile solids were the main factors with a significant effect on the BMP, as well as some interactions. It was possible to obtain a second-order regression model with a good fit (R2 = 0.904) for predicting the BMP from the different operating conditions applied to the anaerobic digestion of rotten tomato. A maximum of 297 NmLCH4/gVS can be achieved with a substrate to inoculum ratio of 0.5, a total concentration of volatile solids of 20 g/L, a working volume of 20%, in the presence of nutrients and with non-incubated inoculum. A mixture design was performed to maximize the methane production in an anaerobic co-digestion process. This analysis revealed that the tomato plant content in the reaction mixture has a negative impact on the BMP. Moreover, rotten tomato and green tomato presented similar methane productions. A special quartic model was developed to estimate the BMP through the composition of the reactional mixture. The maximum BMP (324 NmLCH4/gVS) was found by mixing 63% rotten tomato, 20% green tomato, and 17% tomato plant, leading to a co-digestion performance index of about 1.20 (synergetic co-digestion operation).

Author Contributions

Investigation, P.V.A., R.P.R., L.M.T. and A.F.S.; Supervision, R.C.M. and M.J.Q.; Writing—original draft, P.V.A., R.P.R. and A.F.S.; Writing—review & editing, R.C.M. and M.J.Q. All authors have read and agreed to the published version of the manuscript.

Funding

This work was financially supported by Fundação para a Ciência e Tecnologia (FCT, Portugal) through the MultiBiorefinery project (POCI-01-0145-FEDER-016403) and CIEPQPF strategic project (UIDB/00102/2020). P.V. Almeida acknowledges FCT for the fellowship from the MultiBiorefinery project and the PhD grant (2020.08445.BD). R.P. Rodrigues also thanks to FCT for the PhD grant (SFRH/BD/145694/2019) and the fellowship from the project MATIS, Fundo Europeu de Desenvolvimento Regional (FEDER), através do Programa Operacional Regional do Centro (CENTRO2020) CENTRO-01-0145-FEDER-000014.

Institutional Review Board Statement

Not applicable.

Informed Consent Statement

Not applicable.

Data Availability Statement

Not applicable.

Conflicts of Interest

The authors declare no conflict of interest.

Nomenclature

BMPbiochemical methane potential (NmLCH4/gVS)
BMPexpexperimental biochemical methane potential (NmLCH4/gVS)
BMPpredpredicted biochemical methane potential (NmLCH4/gVS)
CLcellulose (%TS)
CODchemical oxygen demand (mg O2/g VS)
ttime (days)
HMhemicellulose (%TS)
Incincubation
LGlignin (%TS)
Nunutrients
R2R-squared
R2adjadjusted R-squared
R2predpredicted R-square
RSMEroot mean square error (NmLCH4/gVS)
SMPcumulative specific methane production (NmLCH4/gVS)
SMP∞maximum methane production (NmLCH4/gVS)
TStotal solids (%)
VSvolatile solids (%TS)
VStconcentration of total volatile solids (g/L)
WVworking volume (%)
Acronyms
AcoDanaerobic co-digestion
ADanaerobic digestion
CPIco-digestion performance index
DoEdesign of experiments
FOKMfirst order kinetic model
GTgreen tomato
RTrotten tomato
SIRsubstrate to inoculum ratio
TBtomato plant

References

  1. Directive (EU) 2018/2001. Directive (EU) 2018/2001 of the European Parliament and of the Council of 11 December 2018 on the Promotion of the Use of Energy from Renewable Sources. European Parliament, Council of the European Union. Available online: http://data.europa.eu/eli/dir/2018/2001/oj (accessed on 11 March 2021).
  2. FAOSTAT, Food and Agricultural Organization of the United Nations. 2019. Available online: http://www.fao.org/faostat/en/#data/QC (accessed on 9 February 2021).
  3. Pinela, J.; Prieto, M.; Barreiro, M.F.; Carvalho, A.M.; Oliveira, M.B.P.; Curran, T.P.; Ferreira, I.C. Valorisation of tomato wastes for development of nutrient-rich antioxidant ingredients: A sustainable approach towards the needs of the today’s society. Innov. Food Sci. Emerg. Technol. 2017, 41, 160–171. [Google Scholar] [CrossRef] [Green Version]
  4. Fritsch, C.; Staebler, A.; Happel, A.; Márquez, M.A.C.; Aguiló-Aguayo, I.; Abadias, M.; Gallur, M.; Cigognini, I.M.; Montanari, A.; López, M.J.; et al. Processing, Valorization and Application of Bio-Waste Derived Compounds from Potato, Tomato, Olive and Cereals: A Review. Sustainability 2017, 9, 1492. [Google Scholar] [CrossRef] [Green Version]
  5. Xu, W.; Long, F.; Zhao, H.; Zhang, Y.; Liang, D.; Wang, L.; Lesnik, K.L.; Cao, H.; Zhang, Y.; Liu, H. Performance prediction of ZVI-based anaerobic digestion reactor using machine learning algorithms. Waste Manag. 2021, 121, 59–66. [Google Scholar] [CrossRef]
  6. Ometto, F.; Karlsson, A.; Ejlertsson, J.; Björn, A.V.; Shakeri, S.Y. Anaerobic digestion: An engineered biological process. In Substitute Natural Gas from Waste; Materazzi, M., Foscolo, P.U., Eds.; Academic Press: Cambridge, MA, USA, 2019; pp. 63–74. [Google Scholar] [CrossRef]
  7. Appels, L.; Baeyens, J.; Degrève, J.; Dewil, R. Principles and potential of the anaerobic digestion of waste-activated sludge. Prog. Energy Combust. Sci. 2008, 34, 755–781. [Google Scholar] [CrossRef]
  8. Raposo, F.; De La Rubia, M.A.; Fernández-Cegrí, V.; Borja, R. Anaerobic digestion of solid organic substrates in batch mode: An overview relating to methane yields and experimental procedures. Renew. Sustain. Energy Rev. 2012, 16, 861–877. [Google Scholar] [CrossRef]
  9. Holliger, C.; Alves, M.; Andrade, D.; Angelidaki, I.; Astals, S.; Baier, U.; Bougrier, C.; Buffière, P.; Carballa, M.; De Wilde, V.; et al. Towards a standardization of biomethane potential tests. Water Sci. Technol. 2016, 74, 2515–2522. [Google Scholar] [CrossRef]
  10. Mata-Alvarez, J.; Dosta, J.; Romero-Güiza, M.; Fonoll, X.; Peces, M.; Astals, S. A critical review on anaerobic co-digestion achievements between 2010 and 2013. Renew. Sustain. Energy Rev. 2014, 36, 412–427. [Google Scholar] [CrossRef]
  11. Rabii, A.; Aldin, S.; Dahman, Y.; Elbeshbishy, E. A Review on Anaerobic Co-Digestion with a Focus on the Microbial Populations and the Effect of Multi-Stage Digester Configuration. Energies 2019, 12, 1106. [Google Scholar] [CrossRef] [Green Version]
  12. Karki, R.; Chuenchart, W.; Surendra, K.; Shrestha, S.; Raskin, L.; Sung, S.; Hashimoto, A.; Khanal, S.K. Anaerobic co-digestion: Current status and perspectives. Bioresour. Technol. 2021, 330, 125001. [Google Scholar] [CrossRef] [PubMed]
  13. Solé-Bundó, M.; Passos, F.; Romero-Güiza, M.S.; Ferrer, I.; Astals, S. Co-digestion strategies to enhance microalgae anaerobic digestion: A review. Renew. Sustain. Energy Rev. 2019, 112, 471–482. [Google Scholar] [CrossRef]
  14. Ebner, J.H.; Labatut, R.A.; Lodge, J.S.; Williamson, A.A.; Trabold, T.A. Anaerobic co-digestion of commercial food waste and dairy manure: Characterizing biochemical parameters and synergistic effects. Waste Manag. 2016, 52, 286–294. [Google Scholar] [CrossRef] [PubMed]
  15. Wei, Y.; Yuan, H.; Wachemo, A.C.; Li, X. Impacts of Modification of Corn Stover on the Synergistic Effect and Microbial Community Structure of Co-Digestion with Chicken Manure. Energy Fuels 2019, 34, 401–411. [Google Scholar] [CrossRef]
  16. Sluiter, A.; Hames, B.; Ruiz, R.; Scarlata, C.; Sluiter, J.; Templeton, D. Determination of Structural Carbohydrates and Lignin Inbiomass—Laboratory Analytical Procedure (LAP); Technical Report NREL/TP-510-42618; National Renewable Energy Laboratory: Golden, CO, USA, 2008. [Google Scholar]
  17. Gaspar, M.C.; Mendes, C.V.T.; Pinela, S.; Moreira, R.; Carvalho, M.G.V.S.; Quina, M.J.; Braga, M.E.M.; Portugal, A. Assessment of Agroforestry Residues: Their Potential within the Biorefinery Context. ACS Sustain. Chem. Eng. 2019, 7, 17154–17165. [Google Scholar] [CrossRef]
  18. Almeida, P.; Rodrigues, R.; Mendes, C.; Szeląg, R.; Pietrzyk, D.; Klepacz-Smółka, A.; Quina, M. Assessment of NIR spectroscopy for predicting biochemical methane potential of agro-residues—A biorefinery approach. Biomass-Bioenergy 2021, 151, 106169. [Google Scholar] [CrossRef]
  19. Angelidaki, I.; Alves, M.M.; Bolzonella, D.; Borzacconi, L.; Campos, J.L.; Guwy, A.J.; Kalyuzhnyi, S.; Jenicek, P.; Van Lier, J.B. Defining the biomethane potential (BMP) of solid organic wastes and energy crops: A proposed protocol for batch assays. Water Sci. Technol. 2009, 59, 927–934. [Google Scholar] [CrossRef] [Green Version]
  20. Rodrigues, R.; Klepacz-Smolka, A.; Martins, R.; Quina, M. Comparative analysis of methods and models for predicting biochemical methane potential of various organic substrates. Sci. Total Environ. 2019, 649, 1599–1608. [Google Scholar] [CrossRef]
  21. Chandler, J.A.; Jewell, W.J.; Gossett, J.M.; Vansoest, P.; Robertson, J. Predicting methane fermentation biodegradability. Biotechnol. Bioeng. 1980, 22, 93–107. [Google Scholar]
  22. Şevik, F.; Tosun, I.; Ekinci, K. Composting of olive processing wastes and tomato stalks together with sewage sludge or dairy manure. Int. J. Environ. Sci. Technol. 2016, 13, 1207–1218. [Google Scholar] [CrossRef] [Green Version]
  23. Monterumici, C.M.; Rosso, D.; Montoneri, E.; Ginepro, M.; Baglieri, A.; Novotny, E.H.; Kwapinski, W.; Negre, M. Processed vs. Non-Processed Biowastes for Agriculture: Effects of Post-Harvest Tomato Plants and Biochar on Radish Growth, Chlorophyll Content and Protein Production. Int. J. Mol. Sci. 2015, 16, 8826–8843. [Google Scholar] [CrossRef] [Green Version]
  24. Ferrer, P.; Cambra-Lopez, M.; Cerisuelo, A.; Peñaranda, D.S.; Moset, V. The use of agricultural substrates to improve methane yield in anaerobic co-digestion with pig slurry: Effect of substrate type and inclusion level. Waste Manag. 2014, 34, 196–203. [Google Scholar] [CrossRef]
  25. Li, Y.; Lu, J.; Xu, F.; Li, Y.; Li, D.; Wang, G.; Li, S.; Zhang, H.; Wu, Y.; Shah, A.; et al. Reactor performance and economic evaluation of anaerobic co-digestion of dairy manure with corn stover and tomato residues under liquid, hemi-solid, and solid state conditions. Bioresour. Technol. 2018, 270, 103–112. [Google Scholar] [CrossRef] [PubMed]
  26. Petropoulos, S.A.; Fernandes, Â.; Katsoulas, N.; Barros, L.; Ferreira, I.C. The effect of covering material on the yield, quality and chemical composition of greenhouse-grown tomato fruit. J. Sci. Food Agric. 2019, 99, 3057–3068. [Google Scholar] [CrossRef]
  27. Acosta-Quezada, P.G.; Raigón, M.D.; Riofrío-Cuenca, T.; García-Martínez, M.D.; Plazas, M.; Burneo, J.I.; Figueroa, J.G.; Vilanova, S.; Prohens, J. Diversity for chemical composition in a collection of different varietal types of tree tomato (Solanum betaceum Cav.), an Andean exotic fruit. Food Chem. 2015, 169, 327–335. [Google Scholar] [CrossRef]
  28. Raposo, F.; Borja, R.; Rincon, B.; Jiménez-Rodríguez, A.-M. Assessment of process control parameters in the biochemical methane potential of sunflower oil cake. Biomass-Bioenergy 2008, 32, 1235–1244. [Google Scholar] [CrossRef]
  29. Liu, G.; Zhang, R.; El Mashad, H.; Dong, R. Effect of feed to inoculum ratios on biogas yields of food and green wastes. Bioresour. Technol. 2009, 100, 5103–5108. [Google Scholar] [CrossRef]
  30. Gil, A.; Siles, J.Á.; Serrano, A.; Martín, M.Á. Mixture optimization of anaerobic co-digestion of tomato and cucumber waste. Environ. Technol. 2015, 36, 2628–2636. [Google Scholar] [CrossRef] [PubMed]
  31. Gunaseelan, V. Biochemical methane potential of fruits and vegetable solid waste feedstocks. Biomass-Bioenergy 2004, 26, 389–399. [Google Scholar] [CrossRef]
  32. Li, P.; Li, W.; Sun, M.; Xu, X.; Zhang, B.; Sun, Y. Evaluation of Biochemical Methane Potential and Kinetics on the Anaerobic Digestion of Vegetable Crop Residues. Energies 2018, 12, 26. [Google Scholar] [CrossRef] [Green Version]
  33. Andriamanohiarisoamanana, F.J.; Yasui, S.; Yamashiro, T.; Ramanoelina, V.; Ihara, I.; Umetsu, K. Anaerobic co-digestion: A sustainable approach to food processing organic waste management. J. Mater. Cycles Waste Manag. 2020, 22, 1501–1508. [Google Scholar] [CrossRef]
Figure 1. Mean of the BMP and respective standard deviation (SD), and operating conditions for each experiment.
Energies 14 05563 g001
Figure 2. (a) Statistical significance of the terms included in the complete 2nd-order factorial model. (b) Comparison between predicted and experimental BMP values obtained from the 25−1 fractional factorial design.
Energies 14 05563 g002
Figure 3. Cumulative specific methane produced though anaerobic co-digestion, over time (days), from different mixtures of RT + GT + TB, considering the following operating conditions: SIR = 0.5; VSt = 20 g/L; WV = 20%; Nu = Y; Inc = N.
Energies 14 05563 g003
Figure 4. (a) Statistical significance of the terms included in the complete special quartic model. (b) Comparison between predicted and experimental BMP values obtained from the mixture design.
Energies 14 05563 g004
Figure 5. Contour (a) and surface (b) plot of the BMP response described by the special quartic model.
Energies 14 05563 g005
Table 1. Levels selected for each factor corresponding to the fractional factorial design 25−1 and operating conditions for the validation assays.
Factorial Design 25−1
ContinuousNominal
SIRVSt (g/L)WV (%)NuInc
Level−10.52020NN
01.027.530n.a.n.a
+11.53540YY
Validation Experiments
V10.752525YN
V20.752535YN
V21.253025YN
V41.253035YN
n.a.—not applicable; N—no; Y—yes.
Table 2. Characterization of rotten tomato (RT), green tomato (GT), and tomato plant (TB).
RTGTTB
TS (%)5.99 ± 0.467.76 ± 0.0771.4 ± 1.14
VS (%TS)86.0 ± 0.188.0 ± 0.380.0 ± 0.3
pH4.75 ± 0.044.00 ± 0.046.82 ± 0.02
COD (mg O2/g VS)1517 ± 191223 ± 441592 ± 73
C (%TS)42.0 ± 0.138.4 ± 0.137.3 ± 0.1
N (%TS)2.43 ± 0.042.01 ± 0.022.87 ± 0.02
O (%TS)35.1 ± 0.241.7 ± 0.134.7 ± 0.1
H (%TS)6.49 ± 0.125.98 ± 0.045.10 ± 0.03
LG (%TS)7.87 ± 0.294.11 ± 0.8520.27 ± 0.44
CL (%TS)15.45 ± 0.0623.15 ± 0.8323.99 ± 0.19
HM (%TS)16.33 ± 0.2131.02 ± 0.9917.57 ± 0.24
Table 3. Second-order factorial model for BMP (NmLCH4/gVS) prediction through the operating conditions of anaerobic digestion.
BMP = +480.554 − 278.423 × SIR − 6.392 × VSt + 3.477 × SIR × VSt + a1 × (VSt − 27.5) +
a2 × (WV − 30) + a3 × (VSt − 27.5) + a4
(4)
Coefficients
(Nu,Inc)a1a2a3a4
(Y,Y)−1.726−2.7952.73112.951
(Y,N)−1.726−2.795−2.731−12.951
(N,Y)1.7262.7952.731−12.951
(N,N)1.7262.795−2.73112.951
Y/N (yes/no) corresponds to the presence/absence of nutrients or the addition/not addition of incubated sludge.
Table 4. Parameters of the first-order kinetic model corresponding to each experiment of the mixture design and respective experimental BMP.
C1C2C3C4C5C6C7C8C9C10
BMPexp294304140374260217291193290286
BMP289299142322255212273220258253
µ0.3710.4170.4100.3990.4450.3210.3880.3580.2880.418
R20.7960.8410.7510.5970.9130.8970.7280.7150.9230.764
RMSE33.0928.8332.5760.3216.7116.1636.7939.3819.6030.21
BMPexp, BMP and RMSE are expressed as NmLCH4/gVS; µ is expressed as 1/d.
Publisher’s Note: MDPI stays neutral with regard to jurisdictional claims in published maps and institutional affiliations.

