Article

Bass Diffusion Model Adaptation Considering Public Policies to Improve Electric Vehicle Sales—A Brazilian Case Study

1
Electrical Energy Department, Federal University of Juiz de Fora (UFJF), Juiz de Fora 36036-900, Brazil
2
Electrical Engineering Department, Federal Fluminense University (UFF), Niteroi 24210-240, Brazil
*
Author to whom correspondence should be addressed.
Energies 2021, 14(17), 5435; https://doi.org/10.3390/en14175435
Submission received: 26 July 2021 / Revised: 3 August 2021 / Accepted: 6 August 2021 / Published: 1 September 2021
(This article belongs to the Section E: Electric Vehicles)

Abstract

:
The global fleet of electric vehicles (EV) has been rising in recent years, and public policies can play an important role in this scene. The objective of this work is to evaluate the impact of public policies in the diffusion of EVs in Brazil, based on Beck’s adaptation for the Bass diffusion model. This modification on the Bass model allows the estimation of EV diffusion, taking into account the direct and indirect economic influence of the main EV incentive instruments used worldwide. In addition, this work conducts a forecast of the total passenger cars in Brazil through a regression model, considering macroeconomic and social indicators. The results indicate that EV high prices may still be the major barrier for EV diffusion in Brazil over the studied horizon, keeping them inaccessible to the majority of the population. Therefore, policies aimed at subsidizing EVs may be more effective in stimulating EV sales.

1. Introduction

The global fleet of electric vehicles (EVs) has been rising considerably in recent years, from 400 thousand vehicles in 2013 to 11.6 million vehicles in 2020 [1]. However, the EV still represents a small share of the whole passenger car market in some countries due to different types of barriers, such as cost, autonomy, charging time, charging infrastructure, and misinformation [2]. In Brazil, in 2020, according to the National Traffic Department [3], 2530 EVs were licensed (this study considers plug-in and pure electric vehicles as EVs), which is equivalent to approximately 0.16% of the total licensing of passenger cars and light commercial vehicles in the whole country.
Countries where the EVs have a significant market share—for example, Norway and China—have reached this level through public policy incentives [4,5]. Public policy incentives to promote the use of EVs can be categorized into four groups as follows: economic, fiscal, and financial measures; regulatory measures; urban and transportation planning; and information along with communication [6,7,8].
One way to evaluate the impact of public policies in the insertion of some specific technology is through building long term scenarios for the sector. For the transportation sector specifically, the main modeling techniques in the literature, to project the insertion of EVs, are agent-based models, consumer choice models, and diffusion and time-series models [9,10,11,12,13]. Among them, diffusion models are the most appropriate to include the impact of public policies in their analysis, with emphasis on the Bass model (BM), which predicts the speed with which the potential market for a specific technology is reached based on two parameters: innovation and imitation [14]. One change was proposed recently to the model (named the Bass generalized model—BGM) to make it possible to incorporate other decision variables, such as the technology price as a function of time [15]. Other projection models also stand out in the literature, for example, the respondent-based preference and constraint (REPAC) model, which uses a model of discrete choices previously estimated to project the EV sales [16,17]. It is important to note that the REPAC model uses a series of data (the data of EV users are collected using a questionnaire, which can bring a series of complications such as: difficulty in applying the questionnaire to competent organs; data quality, i.e., if the users answer honestly; the complexity increases according to the size of the area of study (city, state, country, etc.) to build its projections, which could make the analysis complex and inaccurate in cases where markets are in an early stage of technological diffusion. On the other hand, the BGM has been used previously in similar studies, where the technological diffusion is in an early stage, offering a reasonable amount of reliance and reasonableness in the results of the model [18].
It should also be emphasized that the automotive sector is in a period of transition, in a way that the construction of long term scenarios for the demand of passenger cars becomes complex, which makes the entry premises of the projection models subject to several uncertainties. This transition, fundamentally, comprehends a new economic model for the use of vehicles with an increase in shared economy services as an alternative to public transport and private vehicles [19]. Nowadays, it is, indeed, possible to verify a change in the main automotive sector characteristics, which is becoming an industry of services and displacement instead of an industry of products supply. This change is accentuated for the younger population [20,21,22].
Moreover, the new coronavirus affected all sectors of the economy, decreasing the world GDP by 3.6% in 2020 [23,24]. In the automotive sector, it is estimated that global sales decreased by 14% in 2020 [25]. However, electric vehicles had record sales in the same period, driven by incentive policies and a reduction in production costs, reaching 4% of the market share [25,26].
Nevertheless, in the recent literature, Benvenutti et al. investigate the impact of public policies in the alternative fuel vehicles (AFV) diffusion dynamics in the long term in Brazil, using dynamic systems based on BGM [27]. On the other hand, Oliveira et al. incorporate the user’s preferences in the AFV diffusion model and, then, analyze the efficiency of the subsidy policies in Portugal [28]. One important limitation of this type of study is the restricted evaluation of the direct impact on the price of EVs. Additionally, the BGM diffusion is sensible in its choice of parameters, regarding policy effectiveness (in the BGM, policies have different weights corresponding to their effectiveness; one way to calculate these weights is through a questionnaire) [29]. In turn, Beck et al. adapted the BM to consider the economic return expected with the diffusion of any specific technology, through the simple payback calculation, which allows noticing the direct and indirect impacts of public policy incentives [30].
Another important aspect in the analysis of the impact of public policies in the diffusion of any technology is the duration of the policy. Maintaining public policies to stimulate EV sales for a long period can be costly for both the government and the automotive market. However, the early removal of public policies can directly affect sales [31,32]. Kong et al. [32], for example, investigated the effect that multiple public policies could have on EV diffusion in China when purchase subsidies are discontinued. However, these authors worked with scenarios considering constant rates during the analyzed period. Additionally, the scientific literature usually considers the total use of internal combustion engine (ICE) vehicles as the potential market. Indeed, this simplification is reasonable when EV prices are competitive with those of ICE vehicles. However, this analysis in countries where the EV acquisition cost is high may distort the results of the diffusion.
In this way, it is important to evaluate the impact each policy has on EV diffusion, considering the socioeconomic aspects of the area [33,34,35]. Studying this mechanism is essential to comprehend which policies are the most efficient and, thus, direct investments to increase EV sales, especially in countries where EV penetration is low, such as Brazil. In this study, we examine the following research question: How can public policies based on direct and indirect incentives affect the sales of EVs in Brazil until 2050? In this sense, the main objective of this work is to evaluate the impact of public policies on EV diffusion in Brazil until 2050, using a methodology based on Beck’s adaptation of the Bass model. This methodology allows a detailed analysis of the direct and indirect impact of public policies for the stimulus of EVs in the country with time-variant tax rates. Furthermore, this study analyzes the automotive market, segregated by vehicle type and brand to analyze the potential market more accurately. To project the sales of passenger cars in the country on the study horizon, a linear regression model is proposed, considering the shared economy influence on the country’s transportation sector. In addition, the regression model also captures the influence of the COVID-19 pandemic, which has been severely impacting the national economy throughout 2020 and 2021.
The main contributions of this article include: the application of Beck’s adaption of the BM to the transportation sector; the projection of passenger car sales through a linear regression model that considers the effect of the sharing economy in the national transportation sector; and the evaluation of the impact of public policies to stimulate EV diffusion until 2050.
Section 2 brings an overview of the main public policies introduced in several countries to stimulate EV sales, including the Brazil panorama. Section 3 presents the methodology used to consider the economic effect of the policies in EV diffusion. The effects of the incentive policies are presented in Section 4. Finally, the conclusions are presented in Section 5.

2. Literature Review

This section describes the Bass model along with the modifications proposed by Beck. In addition, this section presents a survey of the main public policies adopted in the countries with the largest EV market. This survey allows the identification the group of public policies with the highest potential to be applied in the Brazilian market, considering the particularities of the national context.

2.1. Bass Diffusion Model

Mathematically, the Bass model represents the penetration rate of innovation in the market as a function of time. Let T be the random variable corresponding to the fraction of a given period for individuals in a population to adopt a new product or technology. The probability distribution function F T is given by Equation (1), in which p and q are the innovation coefficient (external influence to the diffusion process) and the imitation coefficient (internal influence to the diffusion process), respectively. The cumulative number of adopters N ( t ) expected in the coming years is estimated by Equation (2), in which F P M is the final potential market, which corresponds to a fixed fraction of the preliminary potential market ( P P M ), given in number of adopters. Regarding EV, P P M corresponds to the set of consumers who would have minimal economic conditions to adopt the technology. On the other hand, F P M corresponds to a subset of P P M in which consumers, in addition to having minimum installation conditions, would also be interested in adopting the technology.
The modification proposed by Beck considers F P M to be a function of simple payback time, and no longer a constant, assuming that economic factors such as public incentives can significantly change the adoption of some technologies, such as EV [30]. Based on empirical analyses, developed Equation (3) to estimate the maximum market share M M S in pu as a function of the average simple payback time P B in years and the simple payback sensitivity S of 0.3. After calculating M M S , the F P M is computed using Equation (4) [30]. Finally, the number of adopters is obtained by Equation (2), assuming that F P M depends on the payback time.
F T ( t ) = { 1 e ( p + q ) t 1 + q p e ( p + q ) t ,     t > 0 0 ,     t < 0  
N ( t ) = F P M × F T ( t )
M M S = e S × P B
F P M = M M S × P P M

2.2. Public Policies to Promote EVs

The main public policies to stimulate the use of EVs can be categorized as following: economic, fiscal, and financial measures; regulatory measures; urban and transportation planning; and information and communication [6,7,36].
Economic, fiscal, and financial measures aim to promote a change in society’s behavior through actions that economically penalize ICE vehicles and/or benefit EVs. From the regulatory perspective, certain specifications, rules, and standards aim to prohibit or restrict potentially polluting activities. This category includes policies such as zero-emission vehicle (ZEV) mandates and tax exemption from gas emission taxes for EVs. On the other hand, the urban and transportation planning objective is to encourage the use of EVs through the provision of traffic benefits, such as EV access to bus and HOV (high occupancy vehicles) lanes. Finally, communication and information measures act on the effectiveness of the other measures. In this way, an increase in visibility and information related to EVs is expected to raise EV sales [37].
Table 1 presents the impact of different policies in the increase in EVs in Norway, the US, Canada, China, Japan, and the Netherlands. The market impacts related to EV sales are defined as high, low, without impact, and non-valuated. In general, the policies of tax reduction, zero-emission vehicle mandates, and carbon tax have the largest impact on EV diffusion [6,31,38,39,40,41,42,43,44,45,46,47,48,49,50]. Note that a non-valuated impact means that the policy may not have been implemented in the corresponding country or has not been evaluated in this study.
The measures that achieved the greatest impact in EV sales in the US market are tax incentives both in the purchase of EVs and the ZEV mandate [31,51]. The incentive values for the purchase of EVs vary from 500 to 6000 USD, according to the type of vehicle. Lastly, the ZEV mandate obliges companies to include an EV share in car sales.
In Norway, the tax exemption policies impelled EV sales at the beginning of the 1990s. Another measure that drove the EV sales was the price increase for the ICE vehicles, proportional to efficiency. In addition, the country also has a strong policy regarding carbon emissions, in which the price of gasoline is one of the most expensive in the world [52]. Regional policies, such as EV access to the bus lane and free toll, also play an important role in EV diffusion [40,42]. In addition to the measures themselves, expanding EV policies to a federal level is one of the key success factors of the elevated EV penetration in Norway, since it reduced risks for market players, such as car importing companies [40].
Despite the growing market in Canada, the participation of EVs in passenger car sales is still reduced. The national policies with the highest effectiveness to stimulate EVs are ZEV mandates, tax incentives, and carbon tax [39].
The subsidies offered by the Chinese government improved the national EV sales at the beginning of the year 2000. However, the recent increase in EV sales is also related to the limited registration for ICE vehicles [53]. In 2011, the government implemented a lottery system for new ICE vehicle licensing. The low license availability increased the ICE vehicle’s hidden monetary value to 130 thousand Chinese Yuan’s (CNY) (around 19 thousand USD), about 19% more than the best-selling EV of the time [38].
Japan stands out for its innovation in the industry and market of EVs with the Toyota Prius. The first incentive policy for the use of EVs was applied in 1998, in which the government offered subsidies of up to 50% of the incremental cost (difference between the price of an EV and an ICE vehicle) [44]. The subsidy, besides being offered for the purchase of a new vehicle, is also offered to consumers that use their old car as part of the EV payment (scrapping program).
The Netherlands has experienced rapid growth in EV registrations in recent years. The numbers can be associated with fiscal policies, mainly by the subsidy offered by the government for both private and business use [41]. In addition, the government offered registration and toll tax exemptions for private and corporate EVs [45,54].

2.3. Brazilian Regulatory Framework

In the Brazilian market, the low EV penetration, if compared to the main global markets, is due to both the high prices of EVs and the reduced number of specific public policies to encourage EV sales in the country [55]. National plans and programs related to the theme have been implemented, but without setting specific goals and objectives for electric mobility [56].
Regarding the country taxes, recently, EVs received a unique category in the incidence table of ”IPI” (tax on an industrialized product—similar to excise tax), with a rate of 7% to 18% (varies according to energy efficiency and vehicle weight), previously categorized as “Others”, with a rate of 25% [57]. The federal import tax (“II”) was also changed in 2015, allowing the reduction of 35 to 0% of the tax on the importation of EVs and hydrogen vehicles in the country. Recently, according to Law 13,755/2018, taxi drivers and disabled people can purchase electrical and hybrid vehicles with exemptions in “IPI” and “IOF” (tax on financial operations) [58]. Another incident tax on EVs is the “ICMS” (tax on the circulation of goods and transportation and communication services—similar to value-added tax). Finally, the “PIS/COFINS” (contribution to the social integration program, social contribution on billing) tax on new vehicles (without distinction by vehicle type) is 9.25% [59].
As for the state tax on property of automotive vehicles (“IPVA”), the owners of EVs are exempt in seven Brazilian states, and in another three states, the rate is differentiated [60,61]. In the state of São Paulo, for example, Law 15,997/2014 establishes a municipal policy to encourage the use of EVs. Besides the devolution of 50% of “IPVA”, the law provides an exemption from the municipal car rotation [56].

2.4. Shared Mobility
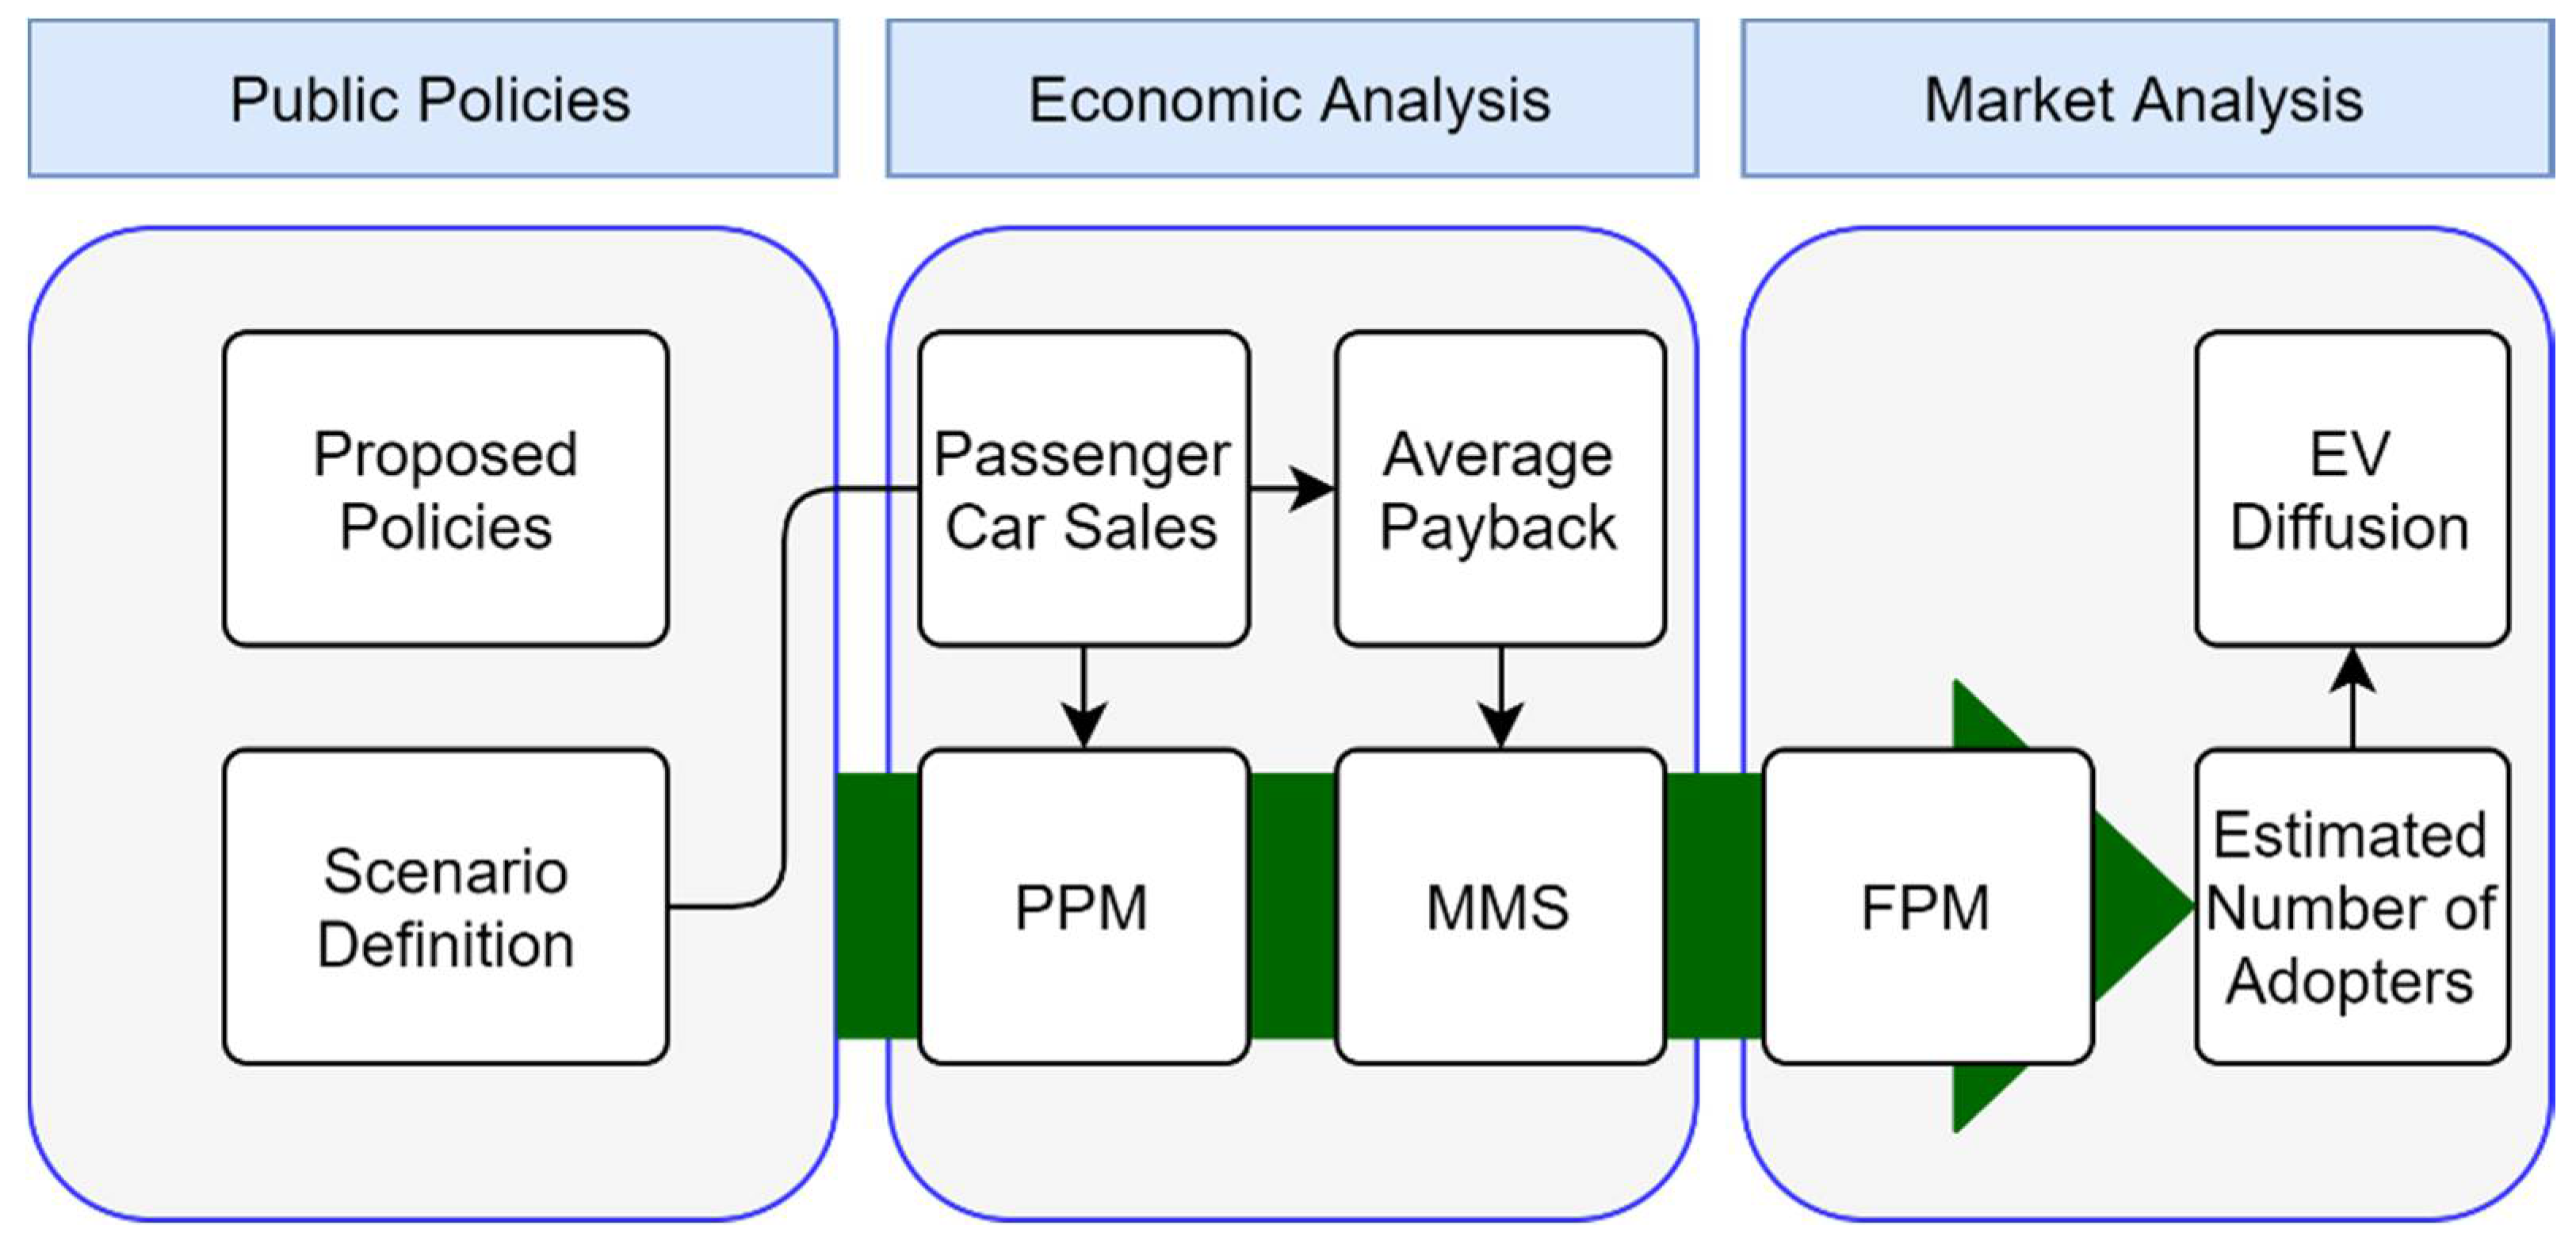
The mobility sector has undergone massive changes in recent years, due to shared economy services provided by companies like Uber, Lyft, Cabify, and Didi [62]. As these services grow, the importance of understanding their impact becomes more critical [63]. However, the lack of open data to the public makes it difficult to address some issues, such as the following: vehicle sales, traffic jams, competition with public transport, and equity issues with taxis [64,65].
Some authors analyze the effects of shared mobility services on vehicle sales, such as Guo et al. [66], who investigate the correlation between the diffusion of the sharing economy and passenger car sales in the transportation sector. The results show that the correlation between the sharing economy and vehicle sales, in the short term, is positive in China, while, in the US, it is negative. Accordingly, Sabouri et al. [67] carried out a similar study and showed a negative correlation in the US. However, the authors clarify that the reduced amount of historical data can compromise the results. In this sense, the correlation between the shared mobility services and vehicles sales is not clear and can vary according to the area. Thus, this area still needs further investigation.

3. Methodology

The proposed methodology allows the analysis of the impact of public policies to accelerate the diffusion of EVs in Brazil in the 2050 horizon, based on international experience and the particularities of the Brazilian automotive market. It is divided into three fundamental stages: a review of the main EV public policies applied in the world, economic analysis, and market analysis. Figure 1 shows the simplified flowchart of the methodology.
The licensing of total passenger cars in Brazil is predicted using a linear regression model that considers macroeconomic and social indicators, including the influence of the sharing economy in the transportation sector. Then, the BM is used to estimate the EV market share. In particular, modifications of this model are considered to allow the estimation of EV diffusion, taking into account the economic influence of the policies of the proposed scenarios. As for the economic and market analyses, this work uses a comprehensive database of the best-selling passenger cars in the country in 2020, according to the National Federation of Automotive Vehicle Distribution (FANABRAVE) [68]. These vehicles represent approximately 94% of the fleet sold in the year. In addition, these analyses also include data such as the price of each vehicle; the energy efficiency of vehicles in gasoline and ethanol modes in urban and highway areas; average annual distance traveled; price of gasoline, ethanol, and electricity; and values of IPVA, IPI, and insurance of each vehicle.

3.1. Scenarios

In this study, two different EV penetration scenarios are proposed. The first scenario, called the reference scenario, has market-based characteristics, not considering significant changes in the behavior of the forecast model’s key variables in the analysis horizon. In other words, it assumes that current sectoral trends will be maintained. The second scenario, named the alternative scenario, includes public policies for the passenger car sector, aiming to promote sustainable mobility.
In the alternative scenario, the impact of public policies is assessed in terms of passenger car sales, with a reduction in the acquisition cost (IPI reduction and subsidies on EV incremental cost) and EV operation (subsidies on IPVA of EVs and increase in gasoline price) in Brazil. Furthermore, this scenario also considers carbon tax and an increase in the cost of ICE vehicles, using taxation proportional to the vehicle efficiency, based on the Norwegian experience. The objective is to achieve fiscal neutrality in terms of public revenues and costs so that the public budget neither loses revenue nor implies additional costs to society, a mechanism known as feebate.
Table 2 presents the public policies chosen by the present work to promote the participation of EVs in the transportation sector. Policy a proposes an initial reduction of 100% in IPVA in 2025, decreasing to 65% by 2050. This instrument aims to expand the IPVA exemption policy for EVs, already applied in some Brazilian states, to the national level. Policy b implies an IPI reduction of 100 and 65% for the years 2025 and 2050, respectively. It is inspired by the Brazilian law 13,755/2018, which is applicable to taxi drivers and disabled people only. Policy c reduces the incremental cost of EV to the ICE vehicle in the short term, based on the Japanese model. The subsidy is 50% in 2025, linearly reducing to 40% in 2050, limited to up to 16,000 Brazilian Real (BRL). Policy d applies carbon tax to fossil fuels, assuming a 1% increase in the price of gasoline in 2025, with a linear growth to 5.57% by 2050. The carbon tax values are based on the Canadian carbon market [69]. Policy e increases the cost of ICE vehicles, using taxation proportional to the vehicle efficiency, in the format of the Norwegian program. This instrument assumes that ICE vehicles with efficiency less than the reference value of 12.4 km/L will face a 1% increase in vehicle price for every 1 km/L less than the reference in 2025. Likewise, in 2050, this increase is considered to be 3% and the reference efficiency is assumed to be 18 km/L. Thus, this analysis allows identifying whether the over-pricing of ICE vehicles can impact EV sales in the country.
This work also considers other assumptions to estimate EV sales, regardless of the scenario, such as:
  • The average annual distance traveled by each vehicle is 14,300 km, according to [70]. This value remains constant over the studied period;
  • An annual increase in the efficiency of ICE vehicles in gasoline mode of 1% per year;
  • The fixed values of 4.27 BRL/L and 0.82 BRL/kWh are adopted for the price of ethanol and electricity, respectively, until 2050. Gasoline has an initial value of 5.74 BRL/L in 2020, plus additional carbon tax over the years in the alternative scenario;
  • Reduction in purchase and maintenance costs of EV over the years, mainly driven by the evolution of battery technology. According to [71], EV prices and maintenance costs in 2030 may be reduced by up to 31% and 27%, respectively, compared to 2020. This work assumes a linear reduction in both EV price and maintenance cost from 2030 to 2050, reaching 33% and 29% of the 2020 values, respectively;
  • The EV used as a reference is the Jac iEV20, with a market price of 161,114 BRL and an operational cost of approximately 14,181 BRL per year.

3.2. Economic Analysis

This section presents the economic analysis to estimate the input parameters of the Bass Model. The impact of the proposed public policies on the mathematical formulation of the model is also considered. The outcomes of the economic analysis are considered later in the market analysis stage. The specific objectives of this section are: to estimate total passenger car sales over the 2050 horizon and to calculate the payback of EV users.

3.2.1. Estimating Total Passenger Car Sales

The number of EVs that are likely to be adopted in the long term corresponds to a market share composed of the total number of passenger cars in the country. Therefore, to project EVs over time, it is necessary to first forecast the total amount of passenger car sales for the horizon. The estimate of the total sales of Brazilian passenger cars on the 2050 horizon is accomplished using a linear regression that considers the influence of the sharing economy in the transportation sector, such as the services offered by Uber, UberPool, BlaBlaCar, and 99. The dependent variable of the linear regression is “passenger car licensing”, and the other explanatory variables are “real GDP”, “interest rate (SELIC)”, and a dummy variable that refers to the impact of COVID-19 on the national economy.
The proposed regression model is arranged in a log-linear format, such that both the regressand and the regressors are expressed in logarithmic form. In this format, each angular coefficient measures the (partial) elasticity of the regressand in relation to the regressor. The determination of the angular and linear coefficients of the proposed regression model is carried out using data from the national quarterly series from 2000 to 2020. Equation (5) represents the mathematical formulation of the proposed regression model:
l n Y ^ t = β 0 + l n β 1 A t + l n β 2 B t + l n β 3 C t + β 4 D t
in which Y ^ 1 is the “passenger car licensing” at year t , in number of cars; A t is the “real GDP” at year t , in millions of BRL; B t is the “interest rate (SELIC)” at year t , in %; C t is the “shared economy in the transportation sector” at year t , in thousands of people; β 0 is the intercept; D t is a dummy variable that represents the influence of COVID-19 on the national economy; and β 1 , β 2 , β 3 , and β 4 are the partial regression coefficients of variables A , B , C, and D , respectively.

3.2.2. Payback Calculation Considering Incentive Policies

The contributions proposed by Beck in the Bass model make it possible to consider the economic factors associated with EV diffusion. These factors are included in the calculation of the simple payback, which corresponds to the return on investment of purchasing an EV compared to an ICE vehicle. The present work assumes that the M M S is variable over time ( M M S ( t ) ), since economic factors may directly affect the EV payback. Therefore, M M S ( t ) is calculated as the weighted average of the M M S of every ICE vehicle model, as indicated in Equation (6), in which M M S i ( t ) is the M M S of model i in year t and n v ( t ) is the number of passenger cars sold in year t .
M M S ( t ) = i n M M S i ( t ) n v ( t )
The simple payback ( P B i ( t ) ) is given by Equation (7), in which: P I C E i ( t ) and P E V ( t ) are the prices of ICE vehicle i and EV over time, respectively; and   C O & M E V ( t ) and C O & M I C E i ( t ) are the maintenance costs of EV and ICE vehicle i over time, respectively. In addition, D C I ( t ) is the calculated incremental cost discount, in BRL, given by Equation (8), in which the subtraction P I C E i ( t ) P E V ( t ) is the incremental cost and T I ( t ) is the discount percentage of the incremental cost. If D C I ( t ) is greater than the maximum discount value L , in BRL, then the incremental cost discount D I ( t ) receives the value L . Otherwise, D I ( t ) receives the value D C I ( t ) , as indicated in Equation (9).
P B i ( t ) = P E V ( t ) P I C E i ( t ) D I ( t ) C O & M I C E i ( t ) C O & M E V ( t )
D C I ( t ) = ( P I C E i ( t ) P E V ( t ) ) T I ( t )
D I ( t ) = { D C I ( t ) ,   D C I ( t ) L L ,   D C I ( t ) > L
EV purchase and maintenance costs are assumed to decrease over time, with a higher decline until 2030 [71]. This reduction in costs is mainly associated with the evolution of battery technology and, consequently, its price. Equation (10) represents the natural reduction in the EV price P E V ( t ) over time along with the fiscal incentive policy for reducing the IPI of the EV, in which: T I P I is the percentage value of IPI in relation to the corresponding EV value; D I P I ( t ) is the percentage discount of the IPI reduction policy; and R p E V ( t ) is the percentage reduction in the EV purchase price.
P E V ( t + 1 ) = P E V ( t ) ( 1 T I P I D I P I ( t ) ) ( 1 + R p E V ( t ) )
Equation (11) presents the calculation of the operation and maintenance cost of the passenger car ( C O & M v ( t ) ), in which: v is an index that indicates the type of vehicle, which can be ICE or electric type; C I P V A is the annual IPVA cost; C S is the annual insurance cost; C R A is the annual revision cost; and C c v ( t ) is the annual fuel cost, which varies over time. Note that the proposed policy implies a percentage reduction in the IPVA of the EVs, given by the T I P V A ( t ) tax. In addition, there is also a natural reduction ( R M E V ( t ) ) in EV maintenance costs [71].
Equation (12) details the fuel cost C c v ( t ) , in which E f f g , E f f e , and E f f e l e are engine efficiency in gasoline, ethanol, and electricity mode, respectively. The efficiency of ICE vehicles varies over time, based on an improvement of 1% per year predicted by [72]. On the other hand, this premise is not adopted for EVs, as electric engines already have high efficiency. α , β and γ are the portions of the operation in gasoline, ethanol, and electricity modes, respectively. Note that α ( t ) + β ( t ) = 1 for ICE vehicles, while α ( t ) + β ( t ) + γ ( t ) = 1 for EVs. The values of the portions of operation follow the government’s forecast [72]. P g , P e , and P k W h are the prices of gasoline, ethanol, and electricity, respectively. Variations in ethanol and electricity prices are not considered.
C O & M v ( t ) = { C I P V A + C S + C R A + C c v ( t ) ,   v = I C E C I P V A ( 1 + T I P V A ( t ) ) ( 1 + R p E V ( t ) ) + C S + C R A ( 1 + R M E V ( t ) ) + C c v ( t ) ,   v = E V
C c v ( t ) = { ( E f f g ( t ) α ( t ) P g ( t ) + E f f e ( t ) β ( t ) P e ) D i ,   v = I C E ( E f f g α ( t ) P g + E f f e β ( t ) P e + E f f e l e γ ( t ) P k W h ) D i ,   v = E V
The variation in the gasoline price when considering carbon tax T c a r ( t ) is given by Equation (13). It is worth mentioning that, if the carbon tax policy is not applied, P g ( t ) remains constant until 2050.
P g ( t + 1 ) = P g ( t ) + T c a r ( t )
Finally, Equation (14) shows the variation in P I C E i ( t ) , considering an increase in the price of ICE vehicles according to the energy efficiency of vehicle i . If the efficiency in gasoline mode of vehicle i in year t ( E f f g i ( t ) ) is lower than the energy efficiency target in year t in gasoline mode ( E f f t ( t ) ), the price of the vehicle i in year t + 1 ( P I C E i ( t + 1 ) ) is assumed to increase according to the difference between efficiencies. Otherwise, the price of the vehicle remains the same as in the previous year. Note that, if the price increasing policy is not implemented, the P I C E i ( t ) remains constant over the studied horizon.
P I C E i ( t + 1 ) = { P I C E i ( t ) ( 1 + T I C E ( E f f t ( t ) E f f g i ) ) ,   E f f g i < E f f t ( t ) P I C E i ( t ) ,   E f f g i E f f t ( t )

3.3. Market Analysis

In this section, the EV share of the total passenger car market in Brazil is estimated using the diffusion model formulated by Bass [14] and adapted by Beck [30]. The values adopted for the innovation ( p ) and imitation ( q ) coefficients are 0.0000365 and 0.447, respectively, based on a statistic model of EV in the US from 1999 to 2008 [73]. These coefficient values are in line with the Brazilian government’s forecast [72], which expects the EV diffusion to have no statistical significance until 2030. In addition, the values are also within the same order of magnitude as the values estimated in [27], which is a study that uses the Bass model to analyze EV diffusion in Brazil. Based on the premise adopted in Section 3.2.1 that assumes that M M S ( t ) varies over time, F P M can also be calculated as a function of time, as shown in Equation (15), in which M M S ( t ) is the weighted average of the M M S of each vehicle model.
F P M ( t ) = M M S ( t ) × P P M

4. Results

This section presents the results of the projection of passenger car licensing in Brazil, the forecast of EV sales for both reference and alternative scenarios, the economic impacts in the alternative scenario, and a sensitivity analysis of the proposed public policies.

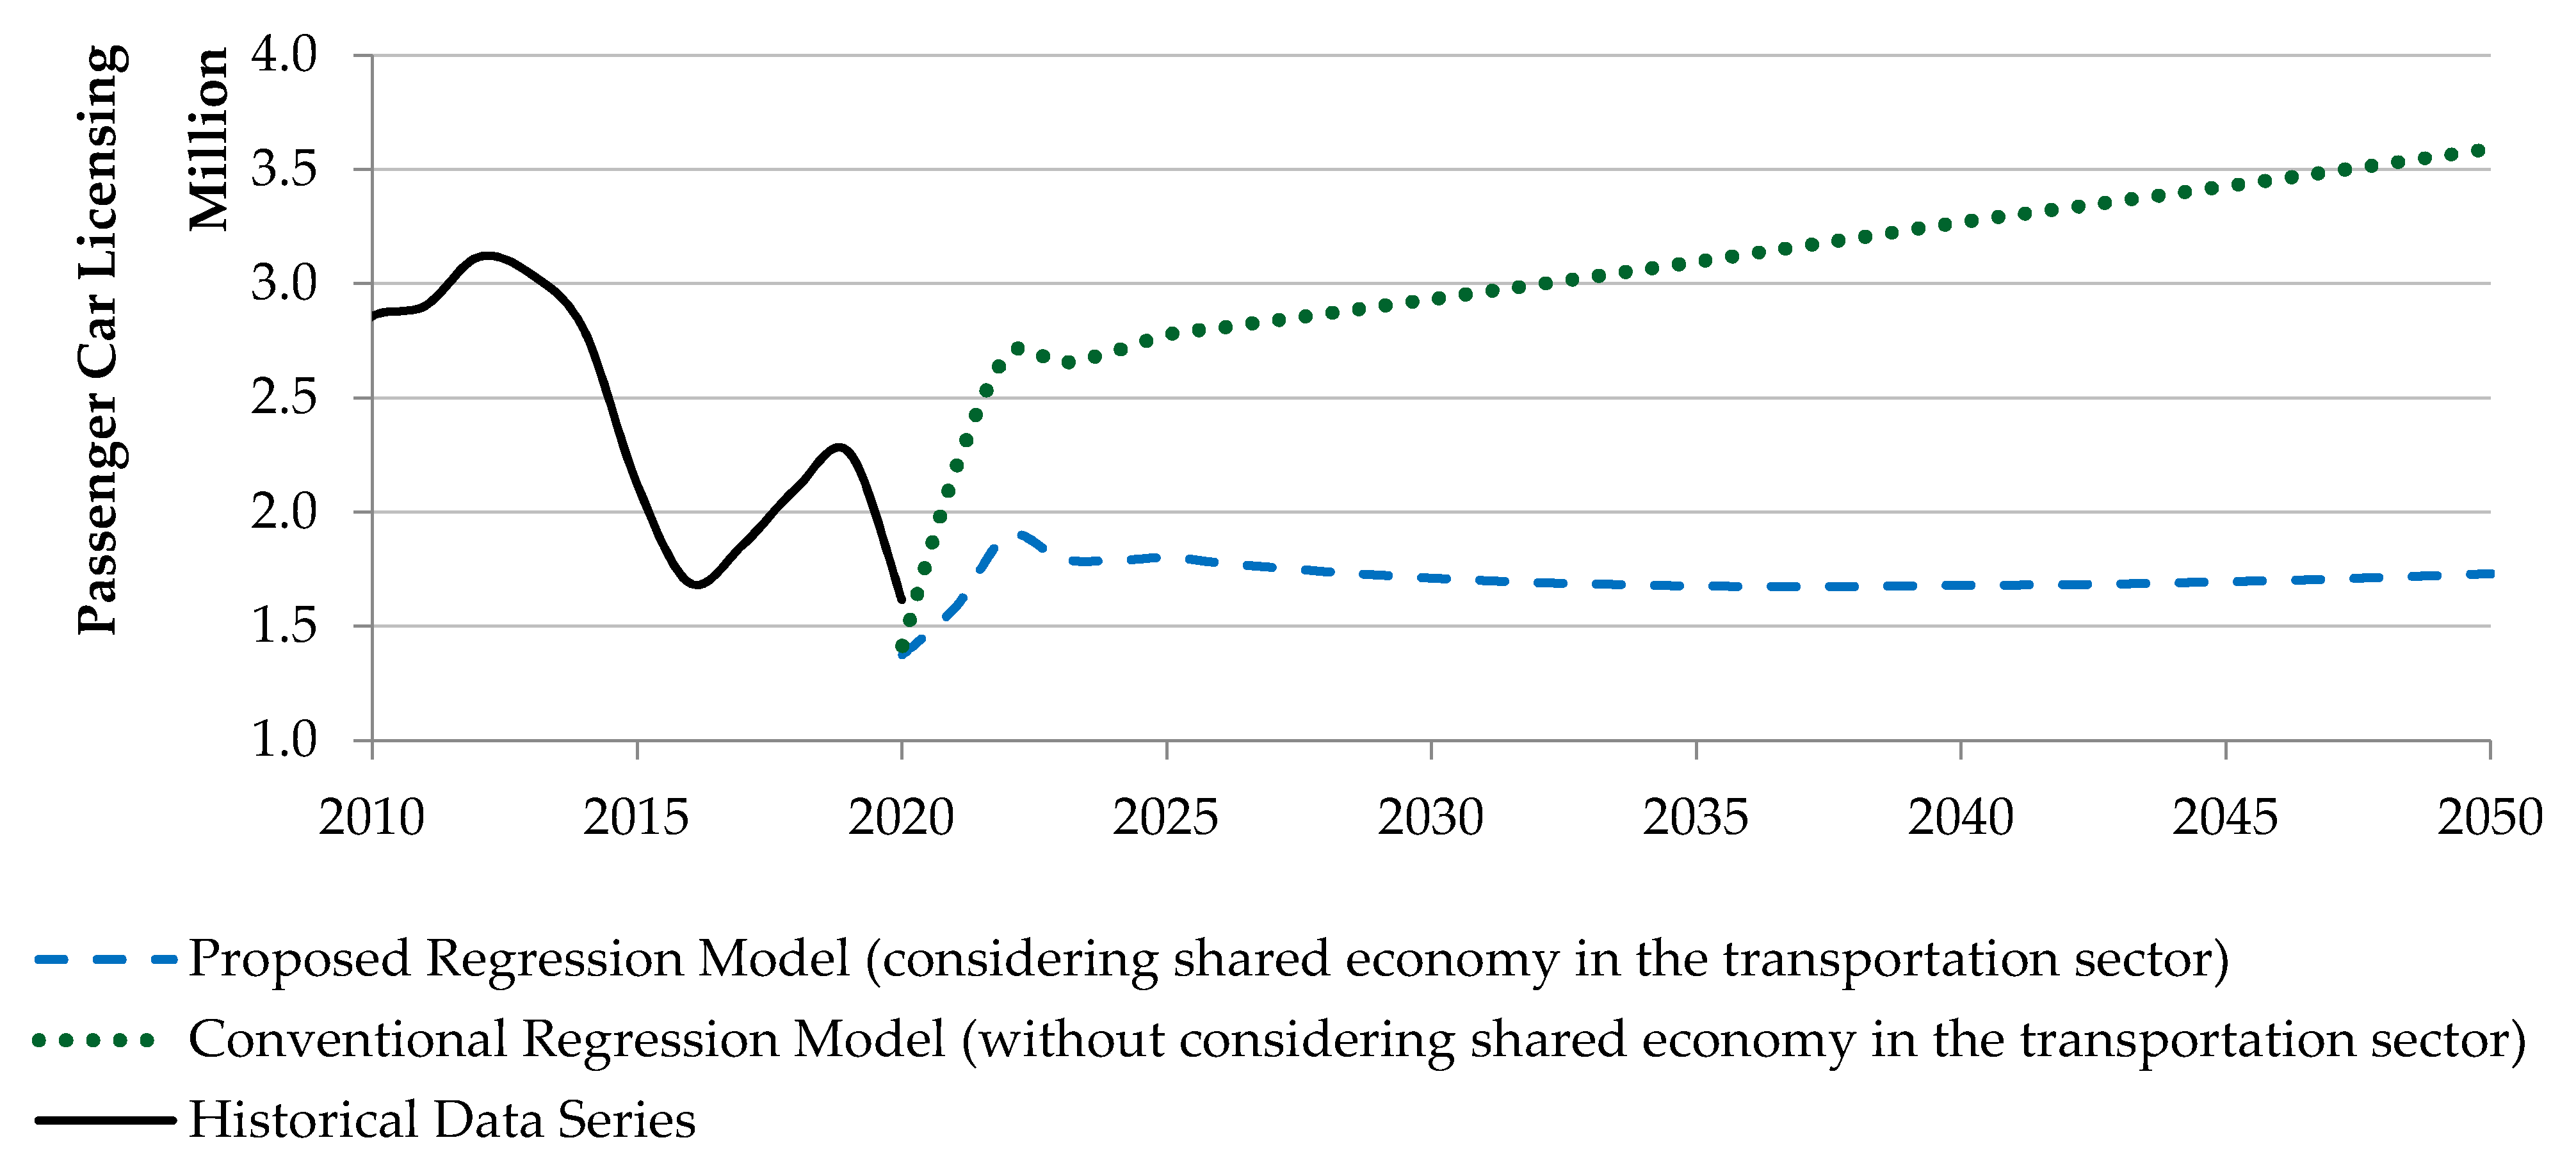
4.1. Projection of Annual Licensing of Passenger Car

Table A1 in Appendix A reveals the values of the coefficients and statistics of the proposed regression model. It shows that the R square is above 0.82, indicating that the variations in the explanatory variables explain more than 82% of the variation of the dependent variable. Additionally, for a 95% confidence interval, the significance F is significantly lower than 0.05, indicating that the explanatory variables jointly influence the dependent variable (the null hypothesis of joint non-significance of the independent variables is rejected). The p-value for each coefficient is also considerably less than 0.05, indicating that each explanatory variable influences the dependent variable individually (the null hypothesis of individual non-significance of the independent variables is rejected). Finally, the value of β 1 indicates a positive correlation between “real GDP” and “passenger car licensing”, while the other regression coefficients expose a negative correlation between the respective regressors and the “passenger car licensing”. Together, these results demonstrate the statistical robustness of the regression model.
Figure 2 shows the projection of passenger car licensing over the analyzed period, based on the linear regression model. For comparison purposes, in addition to the projection from the proposed regression model, the projection of the conventional model is also illustrated in Figure 2. This conventional regression model is similar to the proposed one, but does not consider the effect of shared economy services in the transportation sector (that is, it does not consider the “ l n β 3 C t ” portion of Equation (5)). The values of the coefficients and statistics of the conventional regression model are presented in Table A2, in Appendix A. Note that this conventional model is also statistically robust, but considering one less regressor than the proposed model affects the R square, providing a projection that is not as accurate as of that of the proposed model. Even so, the comparison between the projection behaviors of both models provides relevant results, revealing that the non-consideration of shared economy services in the transportation sector may indicate an unrealistic linear increase in passenger car licensing after 2023.
The strong negative correlation of passenger car licensing with the growth in the shared economy indicates a more constant forecast in licensing projection below 2 million units in the coming years. Nevertheless, these results should be interpreted carefully, as the projection presented in Figure 2 refers to a sector in transition. Furthermore, this projection is also influenced by uncertainties in GDP forecast in the coming years due to the impact of the COVID-19 pandemic on the national economy.

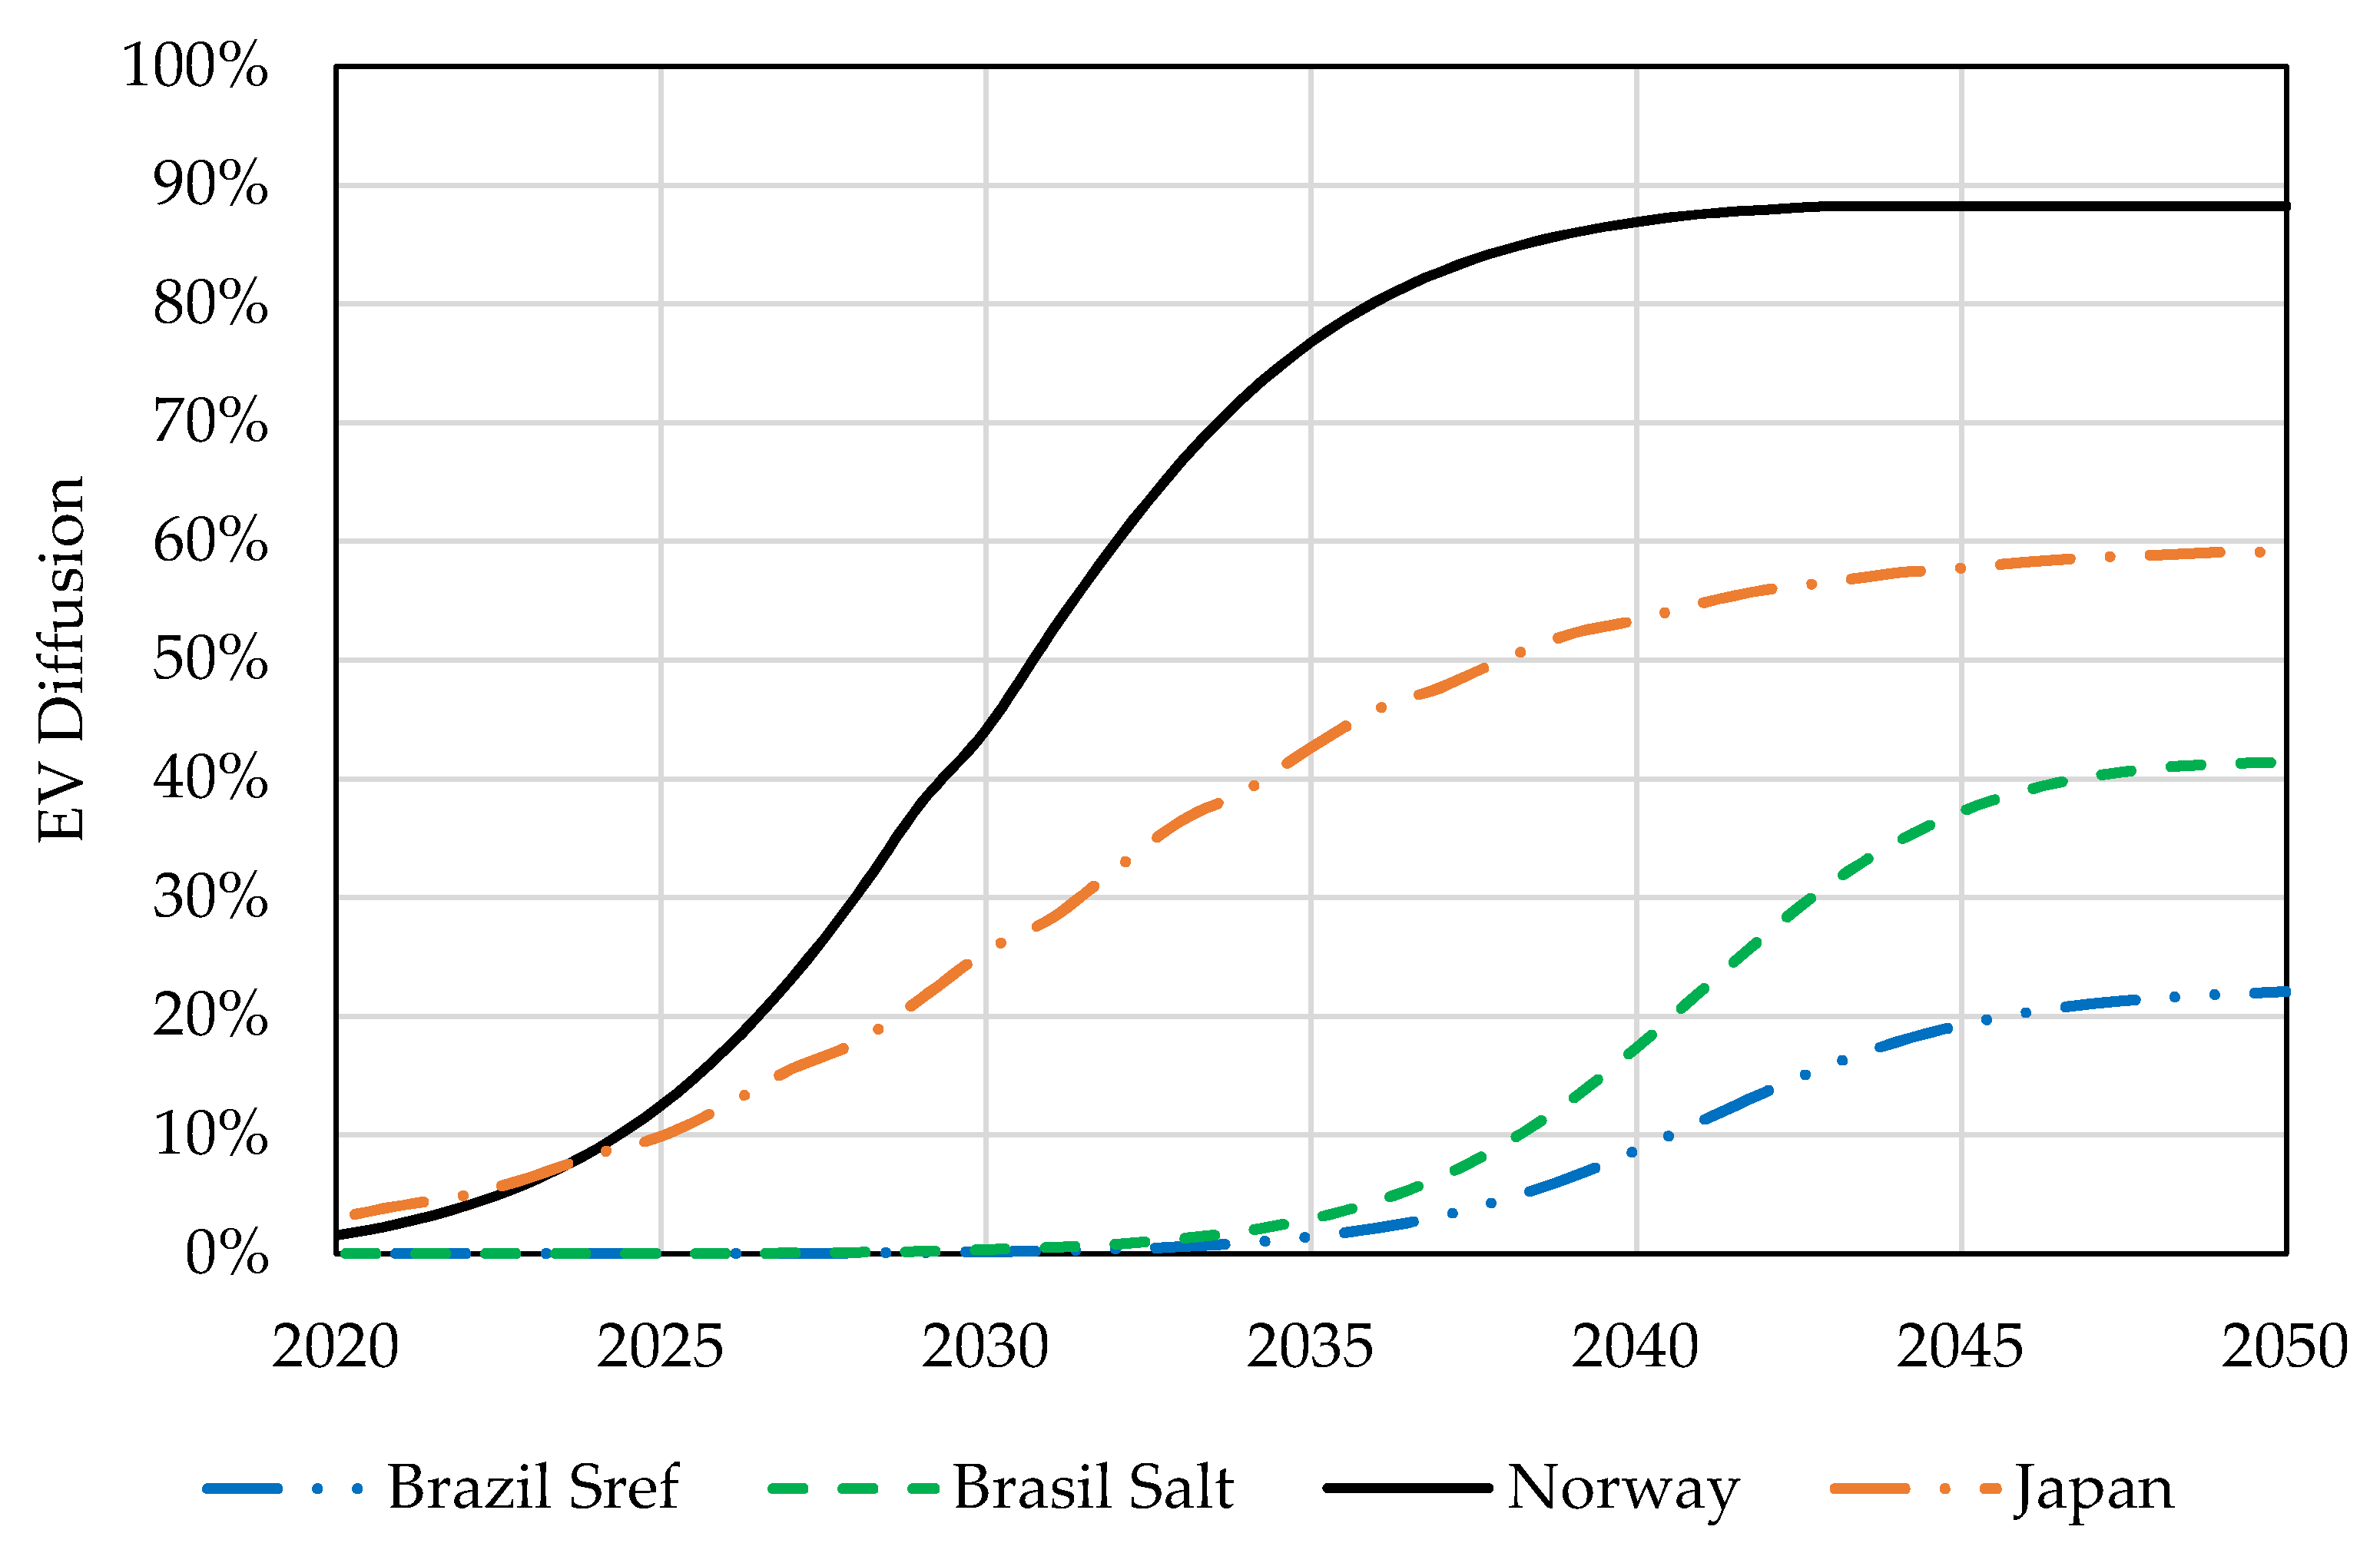
4.2. Diffusion Curve

Figure 3 shows the EV diffusion curves in the reference scenario (Brazil S r e f ) and in the alternative scenario (Brazil S a l t ). For comparison purposes, Figure 3 also presents the expected diffusions for Norway and Japan by 2050, according to a report by the New Climate Institute (As in the present work, the Japan and Norway curves have been estimated using an S-curve model and considering insertion policies, such as purchase subsidies and tax benefits.) [74]. In the absence of policies to accelerate EV adoption in Brazil, the reference scenario points to an EV share of 22% in passenger car sales in the country by 2050. In the alternative scenario, EV share reaches approximately 41% of the sales in 2050. The major barrier for EV diffusion in Brazil may continue to be the high EV prices. Even considering a gradual price reduction of up to 32% in 2050, the high EV prices in 2050 (approximately 108,000 BRL, or the equivalent of 98 minimum wages) may still keep EVs inaccessible to the majority of the population throughout the studied horizon. This price reduction can make EVs competitive among luxury cars only, but not among popular ones.
Figure 4 shows the isolated effect of each policy on EV diffusion in the alternative scenario. Note that the policies are correlated with one another. Therefore, the graphic representation in Figure 4 is an approximation of the individual effect of each policy. Instruments aimed at reducing the EV acquisition cost, notably the subsidies on incremental costs, have a more significant impact on diffusion than the policies aimed at operational costs, such as the reduction in IPVA and carbon tax. This is because the EV acquisition cost in Brazil is high, but the operational cost is relatively low. The policy of increasing the price of ICE vehicles has a lesser impact on diffusion, but it is important to recognize that the effectiveness of this instrument is highly dependent on the tax rate and vehicle base efficiency. Finally, carbon tax has the lowest contribution concerning EV adoption. However, as this instrument encompasses the entire vehicle fleet, it could serve as a government’s fiscal adjustment tool.

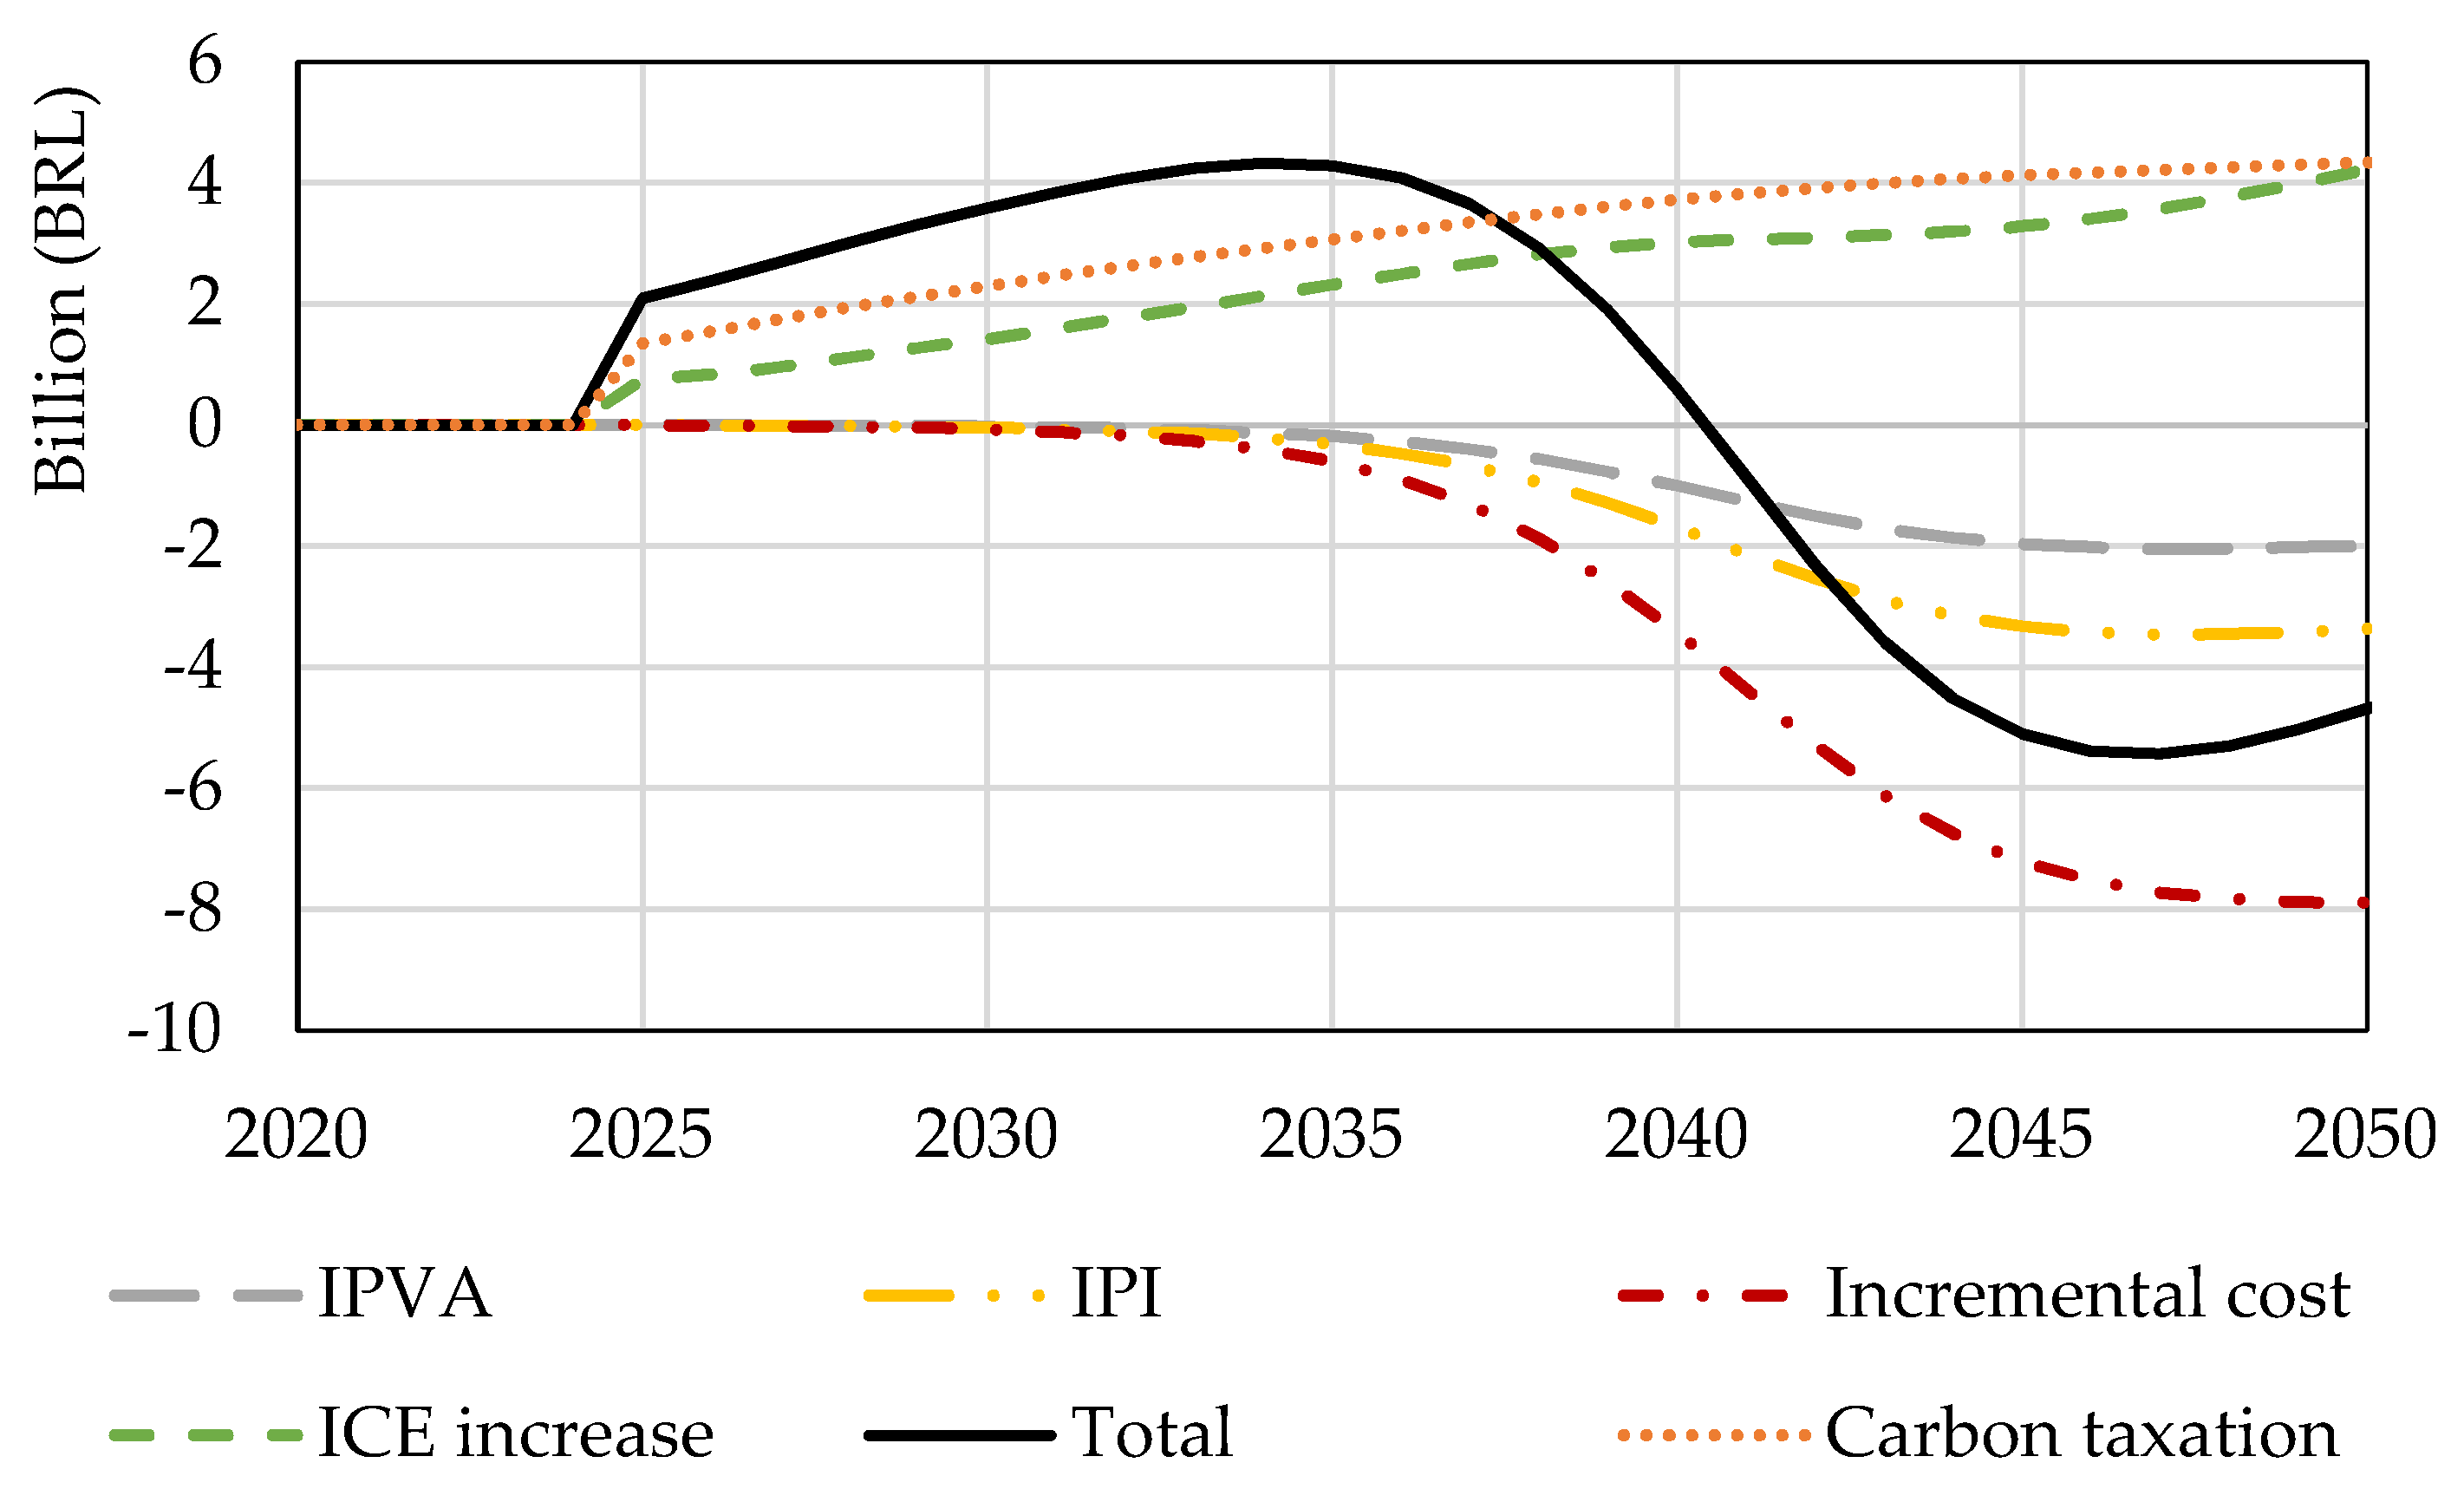
4.3. Economic Impacts

Figure 5 shows the individual contribution of each policy regarding the government’s revenue, in the alternative scenario. This set of policies provides a financial surplus for the government until 2040, due to the policy of increasing the price of ICE vehicles and carbon tax in the early years. After that year, there is a budget deficit until 2050 due to the increase in subsidies offered by the government. However, the deficit is offset by the surplus in the initial years, due to the assumption of fiscal neutrality over the analyzed period, regardless of the discount rate or inflation.
The carbon tax rate starts at 4 dollars per ton of CO2 (USD/tCO2) in 2025 and reaches 22.28 USD/tCO2 in 2050. The taxation causes a 1% increase in the price of gasoline in 2025, which grows linearly up to 5.57% in 2050. These rates are in line with carbon pricing mechanisms applied worldwide, which establish an average rate of 2 USD/tCO2 [75]. In comparison with the carbon tax rates, within the scope of the Paris Agreement, of around 75 USD/tCO2 [76], the rates proposed by the present work are considerably lower. It is worth mentioning that this work should apply significantly superior rates so that carbon tax could promote a relevant contribution in EV sales. For example, considering a rate of 15% and 50% in 2025 and 2050, respectively, might increase EV diffusion by 4.69% in 2050, adding approximately 48 thousand EVs to the vehicle fleet concerning the rates proposed for the alternative scenario.

4.4. Sensitivity Analysis

This section addresses EV diffusion considering different scenarios with distinct rates for the proposed policies. Table 3 presents a sensitivity analysis of these scenarios. The rates in 2025 are based on existing policies mentioned previously and are the same for all scenarios. In addition, the maximum subsidy for incremental cost is the same as that provided in the 2050 scenario. As the impact of policies in 2025 is negligible, the EV penetration is not considered in this period. Conversely, the rates in 2050 are chosen to accomplish fiscal neutrality. The diffusion varies with the intensity of the policies; therefore, higher EV penetrations could be achieved with more aggressive policies. However, despite fiscal neutrality, more aggressive scenarios may be less likely to happen, as they burden the government’s budget and pressure the population (by increasing the price of ICE vehicles) to buy EVs.
Note that decisions related to the increase in the price of ICE vehicles should be taken carefully, as this policy affects the entire passenger car sector. The increase in the vehicle price for every 1 km/L less than the efficiency reference is 1 and 3% for 2025 and 2050, respectively, in all scenarios. The average efficiency in gasoline mode for the vehicles from the database increases from 12.4 km/L in 2025 to 19 km/L in 2050, considering a 1% efficiency increase per year. Note that the base efficiency in the scenarios is greater than the average vehicle efficiency. However, most passenger car sales in the country come from popular vehicles, which already have high efficiency. Conversely, the so-called “luxury” vehicles, which account for a smaller share of sales, have reduced efficiency. Therefore, the values adopted for base efficiency have a greater impact on the wealthiest people. Base efficiency could be increased indefinitely to make EV attractive to consumers of popular cars. However, although the model indicates a possible increase in EV sales, in practice, they are likely to decrease, as consumers may still be unable to purchase EVs. Thus, this policy should be implemented in conjunction with subsidy policies, aiming to provide means for people with less purchasing power to buy EVs.

5. Discussion

The automotive sector is in a transition period, which makes the formulation of long term scenarios for the passenger car fleet a highly complex task. For this reason, the premises of the forecast model are subject to several uncertainties, which can imply several changes in the assumptions of this work over the years.
This transition essentially consists of a new economic model for vehicle use, with the increase in shared economy services as an alternative to public transportation and own vehicle. There is, currently, a change in the central character of the automotive sector, which is shifting from a product supply industry to a service and displacement industry. In particular, this trend has been even more intensified in the younger profile of the population.
In addition, the database used to represent the influence of the sharing economy in the Brazilian automotive sector is quite recent. Therefore, although there are already indications that the sharing economy might impact the automotive sector in the coming years in Brazil, it is not yet possible to quantitatively state how this trend will be due to the low volume of data.
On the other hand, in case of a sharp reduction in car licensing, the government could implement emergency policies to keep the automotive sector heated, since this segment has a significant share of 22% of the national industrial GDP [77]. These measures may include tax reductions, vehicle scrapping programs, etc. However, these dynamics are not considered in this work.
In addition, these changes in the vehicle use bring new challenges for long term studies of the sector, since this new dynamic can not only affect the sale of new vehicles but also other parameters of the sector, such as the fleet scrapping profile and the average distance traveled by vehicles, due to the greater circulation of vehicles used for shared economy purposes. However, these impacts are not considered in this study due to the complexity of predicting them.
The development of the charging infrastructure over the years is also disregarded in this work. Incentive policies for charging infrastructure have already been proposed in some countries [50,78,79], but their real impact on EV sales is still unclear [80]. In this sense, the authors assume that, as EV sales increase, the market players will intuitively understand the existence of a new business and will naturally develop the charging infrastructure. Accordingly, the charging infrastructure has been considered as a reactive factor to EV sales and, therefore, has not been included in the forecast calculation. However, future works could consider modeling public policies aimed at the development of charging infrastructure.
The adoption of incentive policies generates revenue gains for the government at the beginning of the analysis horizon, but they are balanced with the revenue losses at the end of this period. Policies of reduction in IPVA, reduction in IPI, and subsidies on EV incremental cost are financed through public resources. Nevertheless, a carbon tax could serve as a government’s fiscal adjustment tool, offsetting the expense from other incentive policies. In addition, the increase in the price of ICE vehicles also generates revenue gains for the government.
This work indicates that EV incentive policies may not have a significant impact on EV diffusion in the long term and may also be restrictive in terms of benefiting the population with larger purchasing power. If the government intends to promote EVs, it should implement policies that are more appropriate to the Brazilian context, such as taxation proportional to the emission of ICE vehicles, since the expenses arising from this policy are financed by consumers with greater purchasing power, without spending public resources. Finally, in terms of sustainable development, urban mobility should consider, in addition to more efficient technologies, the integration of different modes of transport, focusing on public transport. Hence, it is important to prioritize public policies aligned with democratic principles to improve the mobility of the majority of the population.

6. Conclusions

This work investigates the main public policies applied worldwide to boost EV diffusion and analyzes their influence within the scope of Brazilian long term planning. Accordingly, long term scenarios are developed to address the impact of different public policies to stimulate EV share in total passenger car sales in the country. Note that the electrification of passenger cars might provide other benefits that are not analyzed in this work, such as the impact on greenhouse gas emissions and air quality in cities.
Based on a comprehensive survey of EV incentive mechanisms, the so-called alternative scenario is elaborated to assess the impact of EV penetration policies on the 2050 horizon. The alternative scenario includes subsidies provided by the government, which consist of: reduction in IPVA and IPI of EVs; subsidies on EV incremental cost; and carbon tax on fossil fuels. In addition to these policies, taxation proportional to the emission of ICE vehicles aims to discourage the purchase of new ICE vehicles.
It should be noted that the automotive sector is undergoing meaningful changes and the coming years are expected to see a radical transformation in the way vehicles are used. These events considerably elevate the difficulty and complexity in building long term scenarios for the sector. Furthermore, the model does not consider any public policy to keep the automotive sector stimulated in case of a significant reduction in passenger car licensing. Thus, the results of the present work simply indicate possible paths for sector planning and should not be interpreted as an exact forecast.
The proposed linear regression model to forecast passenger car sales in the country points to a fairly constant car licensing below 2 million units over the next years. However, this estimate must be interpreted carefully, as it relates to the long term planning of a sector in transition.
The results of the alternative scenario indicate an EV share of approximately 41% in passenger car sales in 2050, a far lower share than expected for Japan (59%) and Norway (88%), even with the expressive provision of resources for promoting EV diffusion. The contribution of subsidy policies on EV acquisition cost (67% of total EV sales) stands out to the policy of reducing EV operational cost (33% of total EV sales). This is due to the high EV price, which is the major barrier for EV diffusion. On the other hand, the carbon tax policy has a marginal effect in Brazil, achieving a 0.56% share. This is justified, in part, by the large consumption of ethanol in the country. Finally, the increase in the price of ICE vehicles promotes a 3.11% share. However, this policy affects vehicles with low efficiency only. Therefore, it tends to lose effectiveness over the years, as less efficient vehicles are no longer sold.
Finally, a sensitivity analysis of public policies is carried out to estimate the EV diffusion in more aggressive and less aggressive scenarios, with various tax rates. The results show that, despite fiscal neutrality, more aggressive scenarios may be less likely to happen, as they burden the government’s budget and pressure the population (by increasing the price of ICE vehicles) to buy EVs.
Future work could consider modeling the influence of charging infrastructure on EV diffusion, as well as analyzing public policies that might encourage the development of such infrastructure. In addition, the proposed methodology could be reformulated with other techniques, such as dynamic systems and agent-based models.

Author Contributions

Conceptualization, L.B. and T.A.; methodology, L.B. and T.A.; software, L.B. and T.A.; validation, L.B., T.A. and B.B.; formal analysis, B.B.; investigation, L.B. and R.S.; resources, R.S.; data curation, L.B. and T.A.; writing—original draft preparation, L.B.; writing—review and editing, T.A. and B.B.; visualization, L.B.; supervision, B.B.; project administration, B.B.; funding acquisition, B.B. All authors have read and agreed to the published version of the manuscript.

Funding

This research was funded by Coordenação de Aperfeiçoamento de Pessoal de Nível Superior-Brasil (CAPES), grant number 001.

Institutional Review Board Statement

Not applicable.

Informed Consent Statement

Not applicable.

Data Availability Statement

Not applicable.

Conflicts of Interest

The authors declare no conflict of interest.

Appendix A

Table A1. Regression statistics, ANOVA table, and coefficient statistics for the proposed model considering shared economy in the transportation sector.
Regression Statistics
Multiple R0.91 Standard Error0.15
R Square0.82 Observations84
Adjusted R Square0.82
ANOVA
dfSSMSFSignificance F
Regression48.412.1092.834.66 × 10−29
Residual791.792.26 × 10−2
Total8310.20
CoefficientsStandard
Error
t Statp-valueLower
95%
Upper
95%
Intercept32.022.8111.392.38 × 10−1826.4337.61
Real GDP0.424.13 × 10−210.263.54 × 10−160.340.51
Interest rate (SELIC)−0.400.07−5.603.01 × 10−7−0.55−0.26
Shared economy in the transportation sector−2.930.35−8.411.38 × 10−12−3.63−2.24
Dummy (COVID-19 pandemic)−0.940.12−7.871.60 × 10−11−1.17−0.70
Table A2. Regression statistics, ANOVA table, and coefficient statistics for the conventional model, without considering shared economy in the transportation sector.
Regression Statistics
Multiple R0.82 Standard Error0.21
R Square0.67 Observations84
Adjusted R Square0.66
ANOVA
dfSSMSFSignificance F
Regression36.812.2753.534.41 × 10−19
Residual803.394.24 × 10−2
Total8310.20
CoefficientsStandard Errort Statp-valueLower
95%
Upper
95%
Intercept8.940.8310.743.54 × 10−177.2910.60
Real GDP0.325.37 × 10−25.898.71 × 10−80.210.42
Interest rate (SELIC)−0.270.10−2.835.93 × 10−3−0.46−0.08
Dummy (COVID-19 pandemic)−0.840.16−5.161.77 × 10−6−1.16−0.51

References

  1. IEA Global EV Outlook 2021-Accelerating Ambitions despite the Pandemic; International Energy Agency: Paris, France, 2021.
  2. Singh, V.; Singh, V.; Vaibhav, S. A Review and Simple Meta-Analysis of Factors Influencing Adoption of Electric Vehicles. Transp. Res. Part D Transp. Environ. 2020, 86, 102436. [Google Scholar] [CrossRef]
  3. DENATRAN Frota de Veículos-2020. Available online: https://www.gov.br/infraestrutura/pt-br/assuntos/transito/conteudo-denatran/frota-de-veiculos-2020 (accessed on 15 July 2021).
  4. IEA. Global EV Outlook 2019: Scaling-up the Transition to Electric Mobility; OECD: Paris, France, 2019; ISBN 978-92-64-47013-2.
  5. Mersky, A.C.; Sprei, F.; Samaras, C.; Qian, Z. (Sean) Effectiveness of Incentives on Electric Vehicle Adoption in Norway. Transp. Res. Part D Transp. Environ. 2016, 46, 56–68. [Google Scholar] [CrossRef] [Green Version]
  6. Wang, N.; Tang, L.; Pan, H. A Global Comparison and Assessment of Incentive Policy on Electric Vehicle Promotion. Sustain. Cities Soc. 2019, 44, 597–603. [Google Scholar] [CrossRef]
  7. Bose Styczynski, A.; Hughes, L. Public Policy Strategies for Next-Generation Vehicle Technologies: An Overview of Leading Markets. Environ. Innov. Soc. Transit. 2019, 31, 262–272. [Google Scholar] [CrossRef]
  8. Li, L.; Wang, Z.; Wang, Q. Do Policy Mix Characteristics Matter for Electric Vehicle Adoption? A Survey-Based Exploration. Transp. Res. Part D Transp. Environ. 2020, 87, 102488. [Google Scholar] [CrossRef]
  9. Al-Alawi, B.M.; Bradley, T.H. Review of Hybrid, Plug-in Hybrid, and Electric Vehicle Market Modeling Studies. Renew. Sustain. Energy Rev. 2013, 21, 190–203. [Google Scholar] [CrossRef]
  10. Jochem, P.; Gómez Vilchez, J.J.; Ensslen, A.; Schäuble, J.; Fichtner, W. Methods for Forecasting the Market Penetration of Electric Drivetrains in the Passenger Car Market. Transp. Rev. 2018, 38, 322–348. [Google Scholar] [CrossRef] [Green Version]
  11. Brdulak, A.; Chaberek, G.; Jagodziński, J. BASS Model Analysis in “Crossing the Chasm” in E-Cars Innovation Diffusion Scenarios. Energies 2021, 14, 3216. [Google Scholar] [CrossRef]
  12. Buchmann, T.; Wolf, P.; Fidaschek, S. Stimulating E-Mobility Diffusion in Germany (EMOSIM): An Agent-Based Simulation Approach. Energies 2021, 14, 656. [Google Scholar] [CrossRef]
  13. Ahkamiraad, A.; Wang, Y. An Agent-Based Model for Zip-Code Level Diffusion of Electric Vehicles and Electricity Consumption in New York City. Energies 2018, 11, 640. [Google Scholar] [CrossRef] [Green Version]
  14. Bass, F.M. A New Product Growth for Model Consumer Durables. Manag. Sci. 1969, 15, 215–227. [Google Scholar] [CrossRef]
  15. Bass, F.M.; Krishnan, T.V.; Jain, D.C. Why the Bass Model Fits without Decision Variables. Mark. Sci. 1994, 13, 203–223. [Google Scholar] [CrossRef]
  16. Melton, N.; Axsen, J.; Moawad, B. Which Plug-in Electric Vehicle Policies Are Best? A Multi-Criteria Evaluation Framework Applied to Canada. Energy Res. Soc. Sci. 2020, 64, 101411. [Google Scholar] [CrossRef]
  17. Wolinetz, M.; Axsen, J. How Policy Can Build the Plug-in Electric Vehicle Market: Insights from the REspondent-Based Preference And Constraints (REPAC) Model. Technol. Forecast. Soc. Chang. 2017, 117, 238–250. [Google Scholar] [CrossRef]
  18. Lavasani, M.; Jin, X.; Du, Y. Market Penetration Model for Autonomous Vehicles on the Basis of Earlier Technology Adoption Experience. Transp. Res. Rec. 2016, 2597, 67–74. [Google Scholar] [CrossRef]
  19. Guo, Y.; Xin, F.; Barnes, S.J.; Li, X. Opportunities or Threats: The Rise of Online Collaborative Consumption (OCC) and Its Impact on New Car Sales. Electron. Commer. Res. Appl. 2018, 29, 133–141. [Google Scholar] [CrossRef] [Green Version]
  20. Clewlow, R.R.; Mishra, G.S. Disruptive Transportation: The Adoption, Utilization, and Impacts of Ride-Hailing in the United States; Institute of Transportation Studies: Davis, CA, USA, 2017; p. 38. [Google Scholar]
  21. Mohamed, M.J.; Rye, T.; Fonzone, A. Operational and Policy Implications of Ridesourcing Services: A Case of Uber in London, UK. Case Stud. Transp. Policy 2019, 7, 823–836. [Google Scholar] [CrossRef]
  22. Young, M.; Farber, S. The Who, Why, and When of Uber and Other Ride-Hailing Trips: An Examination of a Large Sample Household Travel Survey. Transp. Res. Part A Policy Pract. 2019, 119, 383–392. [Google Scholar] [CrossRef] [Green Version]
  23. The World Bank GDP Growth (Annual %). Available online: https://data.worldbank.org/indicator/NY.GDP.MKTP.KD.ZG?end=2020&start=2011 (accessed on 22 July 2021).
  24. Internationaler Währungsfonds (Ed.) A Long and Difficult Ascent; World Economic Outlook; Internationaler Währungsfonds: Washington, DC, USA, 2020; ISBN 978-1-5135-5605-5. [Google Scholar]
  25. Gorner, M.; Paoli, L. How Global Electric Car Sales Defied Covid-19 in 2020. Available online: https://www.iea.org/commentaries/how-global-electric-car-sales-defied-covid-19-in-2020 (accessed on 22 July 2021).
  26. Irle, R. Global Plug-in Vehicle Sales Reached over 3,2 Million in 2020. Available online: https://www.ev-volumes.com/ (accessed on 22 July 2021).
  27. Benvenutti, L.M.M.; Ribeiro, A.B.; Uriona, M. Long Term Diffusion Dynamics of Alternative Fuel Vehicles in Brazil. J. Clean. Prod. 2017, 164, 1571–1585. [Google Scholar] [CrossRef]
  28. Oliveira, G.D.; Roth, R.; Dias, L.C. Diffusion of Alternative Fuel Vehicles Considering Dynamic Preferences. Technol. Forecast. Soc. Chang. 2019, 147, 83–99. [Google Scholar] [CrossRef]
  29. Yu, J.; Yang, P.; Zhang, K.; Wang, F.; Miao, L. Evaluating the Effect of Policies and the Development of Charging Infrastructure on Electric Vehicle Diffusion in China. Sustainability 2018, 10, 3394. [Google Scholar] [CrossRef] [Green Version]
  30. Beck, R.W. Distributed Renewable Energy Operating Impacts and Valuation Study. Prepared for Arizona Public Service. Available online: https://appsrv.pace.edu/VOSCOE/?do=DownloadFile&res=J8PAM033116121012 (accessed on 1 January 2019).
  31. Cattaneo, L. Plug-In Electric Vehicles-Evaluating the Effectiveness of State Policies for Increasing Deployment; Center for American Progress: Washington, DC, USA, 2018; p. 49. [Google Scholar]
  32. Kong, D.; Xia, Q.; Xue, Y.; Zhao, X. Effects of Multi Policies on Electric Vehicle Diffusion under Subsidy Policy Abolishment in China: A Multi-Actor Perspective. Appl. Energy 2020, 266, 114887. [Google Scholar] [CrossRef]
  33. Kumar, R.R.; Alok, K. Adoption of Electric Vehicle: A Literature Review and Prospects for Sustainability. J. Clean. Prod. 2020, 253, 119911. [Google Scholar] [CrossRef]
  34. Chu, W.; Im, M.; Song, M.R.; Park, J. Psychological and Behavioral Factors Affecting Electric Vehicle Adoption and Satisfaction: A Comparative Study of Early Adopters in China and Korea. Transp. Res. Part D Transp. Environ. 2019, 76, 1–18. [Google Scholar] [CrossRef]
  35. Broadbent, G.H.; Metternicht, G.I.; Wiedmann, T.O. Increasing Electric Vehicle Uptake by Updating Public Policies to Shift Attitudes and Perceptions: Case Study of New Zealand. Energies 2021, 14, 2920. [Google Scholar] [CrossRef]
  36. Barczak, R.; Duarte, F. Impactos Ambientais Da Mobilidade Urbana: Cinco Categorias de Medidas Mitigadoras. Urbe Rev. Bras. Gest. Urbana 2012, 4, 13–32. [Google Scholar] [CrossRef] [Green Version]
  37. Egnér, F.; Trosvik, L. Electric Vehicle Adoption in Sweden and the Impact of Local Policy Instruments. Energy Policy 2018, 121, 584–596. [Google Scholar] [CrossRef] [Green Version]
  38. He, H.; Jin, L.; Cui, H.; Zhou, H. Assessment of Electric Car Promotion Policies in Chinese Cities; International Council on Clean Transportation: Washington, DC, USA, 2018. [Google Scholar]
  39. Axsen, J.; Goldberg, S.; Melton, N. Canada’s Electric Vehicle Policy Report Card; Simon Fraser University: Burnaby, BC, Canada, 2016. [Google Scholar]
  40. Fearnley, N.; Pfaffenbichler, P.; Figenbaum, E.; Jellinek, R. E-Vehicle Policies and Incentives-Assessment and Elbilinsentiver–Evaluering Og Anbefalinger Recommendations; Institute of Transport Economics: Oslo, Norway, 2015; ISBN 0808-1190. [Google Scholar]
  41. NEA Electric Transport in the Netherlands; Netherlands Enterprise Agency: The Hague, The Netherlands, 2016.
  42. Steinbacher, K.; Goes, M.; Jörling, K. Incentives for Electric Vehicles in Norway; Federal Ministry for the Environment, Nature Conservation and Nuclear Safety (BMU): Bonn, Germany; Berlin, Germany, 2018.
  43. JAMA Fact Sheet-Japanese Government Incentives for the Purchase Pf Environmentally Friendly Vehicles; Japan Automobile Manufacturers Association: Tokyo, Japan, 2010.
  44. EVAAP Incentives for EV & HEV; Electric Vehicle Association of Asia Pacific: Beijing, China, 2003.
  45. ACEA Overview of Purchase and Tax Incentives for Electric Vehicles in the EU; European Automobile Manufacturers Association: Brussels, Belgium, 2011.
  46. Yang, J.; Liu, Y.; Qin, P.; Liu, A.A. A Review of Beijing’s Vehicle Registration Lottery: Short-Term Effects on Vehicle Growth and Fuel Consumption. Energy Policy 2014, 75, 157–166. [Google Scholar] [CrossRef]
  47. Figenbaum, E.; Kolbenstvedt, M.; Transportøkonomisk Institutt (Norway); Akershus Fylke (Norway). Electromobility in Norway: Experiences and Opportunities with Electric Vehicles; Transportøkonomisk Institutt: Oslo, Norway, 2013; ISBN 978-82-480-1466-9. [Google Scholar]
  48. McDermott, E.G. Examining the Effects of Policy Interventions on Increasing Electric Vehicle Adoption in California. Mestrado; University of San Francisco: San Francisco, CA, USA, 2017. [Google Scholar]
  49. Carley, S.; Zirogiannis, N.; Siddiki, S.; Duncan, D.; Graham, J.D. Overcoming the Shortcomings of U.S. Plug-in Electric Vehicle Policies. Renew. Sustain. Energy Rev. 2019, 113, 109291. [Google Scholar] [CrossRef]
  50. Qian, L.; Grisolía, J.M.; Soopramanien, D. The Impact of Service and Government-Policy Attributes on Consumer Preferences for Electric Vehicles in China. Transp. Res. Part A Policy Pract. 2019, 122, 70–84. [Google Scholar] [CrossRef] [Green Version]
  51. Greene, D.L.; Park, S.; Liu, C. Public Policy and the Transition to Electric Drive Vehicles in the U.S.: The Role of the Zero Emission Vehicles Mandates. Energy Strategy Rev. 2014, 5, 66–77. [Google Scholar] [CrossRef]
  52. Bloomberg Gasoline Prices around the World: The Real Cost of Filling Up. Available online: https://www.bloomberg.com/graphics/gas-prices/#20192:United-States:USD:g (accessed on 23 August 2019).
  53. Hu, Y.; Wang, Z.; Li, X. Impact of Policies on Electric Vehicle Diffusion: An Evolutionary Game of Small World Network Analysis. J. Clean. Prod. 2020, 265, 121703. [Google Scholar] [CrossRef]
  54. Deuten, S.; Gómez Vilchez, J.J.; Thiel, C. Analysis and Testing of Electric Car Incentive Scenarios in the Netherlands and Norway. Technol. Forecast. Soc. Chang. 2020, 151, 119847. [Google Scholar] [CrossRef]
  55. Bitencourt, L.d.A.; Borba, B.S.M.C.; Dias, B.H.; Maciel, R.S.; Dias, D.H.N.; Oliveira, L.W. Electric Vehicles Charging Optimization to Improve the Insertion Considering the Brazilian Regulatory Framework. Energy Storage 2019, 1, e76. [Google Scholar] [CrossRef] [Green Version]
  56. Consoni, F.L.; de Oliveira, A.; Barassa, E.; Martínez, J.; Marques, M.d.C.; Bermúdez, T. Estudo de Governança e Políticas Públicas Para Veículos Elétricos; PROMOB-e: Brasília, Brazil, 2018; ISBN 978-85-60206-08-7. [Google Scholar]
  57. Brazilian Government. Alíquotas Do Imposto Sobre Produtos Industrializados-IPI Incidente Sobre Veículos Equipados Com Motores Híbridos e Elétricos; Brazilian Government: Brasilia, Brazil, 2018; p. 4.
  58. Brazilian Government. Requisitos Obrigatórios Para a Comercialização de Veículos No Brasil; Brazilian Government: Brasilia, Brazil, 2018.
  59. Brazilian Government. Incidência Das Contribuições Para Os Programas de Integração Social e de Formação Do Patrimônio Do Servidor Público e Da Contribuição Para o Financiamento Da Seguridade Social; Brazilian Government: Brasilia, Brazil, 2002.
  60. ABVE IPVA-Imposto Sobre a Propriedade de Veículos Automotores Para Veículos Elétricos. Available online: http://www.abve.org.br/diversos/15/legislacao (accessed on 28 December 2017).
  61. Consoni, F.L.; Barassa, E.; Martínez, J.; Moraes, H.B. Roadmap Tecnológico Para Veículos Elétricos Leves No Brasil; PROMOB-e: Brasília, Brazil, 2019. [Google Scholar]
  62. Meisel, S.; Merfeld, T. Economic Incentives for the Adoption of Electric Vehicles: A Classification and Review of e-Vehicle Services. Transp. Res. Part D Transp. Environ. 2018, 65, 264–287. [Google Scholar] [CrossRef]
  63. Luna, T.F.; Uriona-Maldonado, M.; Silva, M.E.; Vaz, C.R. The Influence of E-Carsharing Schemes on Electric Vehicle Adoption and Carbon Emissions: An Emerging Economy Study. Transp. Res. Part D Transp. Environ. 2020, 79, 102226. [Google Scholar] [CrossRef]
  64. Henao, A.; Marshall, W.E. The Impact of Ride-Hailing on Vehicle Miles Traveled. Transportation 2018, 46, 2173–2194. [Google Scholar] [CrossRef]
  65. Ward, J.W.; Michalek, J.J.; Azevedo, I.L.; Samaras, C.; Ferreira, P. Effects of On-Demand Ridesourcing on Vehicle Ownership, Fuel Consumption, Vehicle Miles Traveled, and Emissions per Capita in U.S. States. Transp. Res. Part C Emerg. Technol. 2019, 108, 289–301. [Google Scholar] [CrossRef]
  66. Guo, Y.; Xin, F.; Li, X. The Market Impacts of Sharing Economy Entrants: Evidence from USA and China. Electron. Commer. Res. 2019, 20, 629–649. [Google Scholar] [CrossRef] [Green Version]
  67. Sabouri, S.; Brewer, S.; Ewing, R. Exploring the Relationship between Ride-Sourcing Services and Vehicle Ownership, Using Both Inferential and Machine Learning Approaches. Landsc. Urban Plan. 2020, 198, 103797. [Google Scholar] [CrossRef]
  68. FENABRAVE. Federação Nacional da Distribuição de Veículos Automotores. Available online: http://www.fenabrave.org.br/Portal/conteudo/conteudo/anuarios (accessed on 15 July 2021).
  69. Holmes, C. Here’s What the Carbon Tax Means for You. Available online: https://theconversation.com/heres-what-the-carbon-tax-means-for-you-114671 (accessed on 2 April 2019).
  70. CETESB Emissões Veiculares No Estado de São Paulo; CETESB: São Paulo, Brazil, 2019.
  71. Lutsey, N.; Nicholas, N. Update on Electric Vehicle Costs in the United States through 2030. Int. Counc. Clean Transp. 2019, 12. [Google Scholar] [CrossRef]
  72. EPE Demanda de Energia Dos Veículos Leves: 2018–2030; Empresa de Pesquisa Energética: Rio de Janeiro, Brazil, 2018.
  73. Massiani, J.; Gohs, A. The Choice of Bass Model Coefficients to Forecast Diffusion for Innovative Products: An Empirical Investigation for New Automotive Technologies. Res. Transp. Econ. 2015, 50, 17–28. [Google Scholar] [CrossRef] [Green Version]
  74. Casas, M.J.; Kuramochi, T.; Hagemann, M.; Sterl, S.; Fekete, H.; Höhne, N.; van Breevoort, P. Electric Vehicles Policy Impact Quantification Tool; New Climate Institute: Berlin, Germany, 2018. [Google Scholar]
  75. Ramstein, C.; Dominioni, G.; Ettehad, S.; Lam, L.; Quant, M.; Zhang, J.; Mark, L.; Nierop, S.; Berg, T.; Leuschner, P.; et al. State and Trends of Carbon Pricing 2019; The World Bank: Washington, DC, USA, 2019; ISBN 978-1-4648-1435-8. [Google Scholar]
  76. IFM. Fiscal Monitor: How to Mitigate Climate Change; International Monetary Fund: Washington, DC, USA, 2019; ISBN 978-1-4983-2122-8. [Google Scholar]
  77. ME Setor Automotivo, Brazil. Available online: http://www.mdic.gov.br/index.php/competitividade-industrial/setor-automotivo (accessed on 28 November 2019).
  78. U.S DOE Workplace Charging for Plug-In Electric Vehicles. Alternative Fuels Data Center. Available online: https://afdc.energy.gov/fuels/electricity_charging_workplace.html (accessed on 3 December 2019).
  79. MEA Vision on the Charging Infrastructure for Electric Transport; Ministry of Economic Affairs: The Hague, The Netherlands, 2017; Available online: https://www.rvo.nl/sites/default/files/2017/05/Vision%20on%20the%20charging%20infrastructure%20for%20electric%20transport.pdf (accessed on 23 August 2019).
  80. Hall, D.; Lutsey, N. Emerging Best Practices for Electric Vehicle Charging Infrastructure; The International Council on Clean Transportation: Washington, DC, USA, 2017; 54p. [Google Scholar]
Figure 1. Flowchart of the proposed methodology.
Energies 14 05435 g001
Figure 2. Projection of passenger car licensing in Brazil, 2021 to 2050.
Energies 14 05435 g002
Figure 3. EV share in passenger car sales in Brazil ( S r e f and S a l t ), Japan, and Norway, 2020 to 2050.
Energies 14 05435 g003
Figure 4. Effect of each policy instrument on the EV share in passenger car sales in Brazil ( S a l t ), 2030 to 2050.
Energies 14 05435 g004
Figure 5. Individual policy revenue in Brazil ( S a l t ), 2020 to 2050.
Energies 14 05435 g005
Table 1. EV policies in selected countries.
CategoryPolicyNorwayUSACanadaChinaJapanNetherlands
Economic, fiscal, and financialReduction in registration tax🗸🗶🗶🗸🗸🗸
Reduction in acquisition tax🗸🗸🗸🗸🗸🗸🗸🗸🗸🗸🗸🗸
Annual licensing reduction🗸🗸🗶-🗶🗸🗸
Reduction tax for business car-🗶🗶🗶🗶🗸🗸
Carbon tax🗸🗸🗶🗸🗸🗶🗶🗸
Increase ICE circulation tax🗶--🗶🗶🗶
Insurance reduction🗶🗶🗶-🗶🗶
RegulatoryZEV mandate🗶🗸🗸🗸🗸🗶🗸🗶
Exemption from gas emission fees🗶🗸-🗶🗶🗶
Government fleet🗶🗸🗶🗶🗶🗶
Urban and transport planningAccess in the bus and HOV lanes🗸🗸🗸-🗸🗶🗸
Parking reduction🗸-🗶🗸🗸🗸
Toll reduction🗸🗸-🗶-🗸🗸
🗸🗸—High impact. 🗸—Low impact. -—Without impact. 🗶—Non-valuated.
Table 2. Proposed public policies to promote EV participation in the transportation sector.
InstrumentDefinitionDirect Impact on the CalculationReference
Expected Impact20252050
aReduction in IPVAReduction in the acquisition and operational cost of EVs100%65%100% reduction in IPVA (Brazil)
bReduction in IPI100%65%100% reduction in IPI
(Brazil)
cSubsidies on EV incremental cost50%40%Subsidies of up to 50% of the incremental cost (Japan)
dCarbon tax on fossil fuelsIncrease in fuel cost1%5.57%3% to 11% increase in the price of gasoline (Canada)
eTaxation proportional to the emission of ICE vehiclesIncrease in the price of ICE vehicles1%/12.4 km/L3%/18 km/L11% increase in the price of ICE vehicles (Norway)
Table 3. Sensitivity analysis of the impact of different rates of EV diffusion.
Period20252050
Maximum subsidy (BRL)-850010,00012,00014,00016,00018,000
Reduction in IPVA100%10%30%45%55%65%75%
Reduction in IPI100%10%30%45%55%65%75%
Subsidies on EV incremental cost50%0%10%20%30%40%50%
Carbon tax on fossil fuels1%1.64%3.11%4.05%5.06%5.57%6.91%
Base efficiency [km/L]12.4131415.516.51819
EV diffusion [%]-232731364147
Publisher’s Note: MDPI stays neutral with regard to jurisdictional claims in published maps and institutional affiliations.

