Article

Temperature Control to Improve Performance of Hempcrete-Phase Change Material Wall Assemblies in a Cold Climate

by
Miroslava Kavgic
1,* and
Yaser Abdellatef
1,2
1
Civil Engineering Department, University of Ottawa, 161 Louis Pasteur, Ottawa, ON K1N 6N5, Canada
2
Mechanical Power Department, Faculty of Engineering, Cairo University, Giza 12613, Egypt
*
Author to whom correspondence should be addressed.
Energies 2021, 14(17), 5343; https://doi.org/10.3390/en14175343
Submission received: 13 July 2021 / Revised: 20 August 2021 / Accepted: 25 August 2021 / Published: 27 August 2021
(This article belongs to the Special Issue Advanced Control Strategies for Buildings and HVAC Systems)

Abstract

:
Phase change material (PCM)-enhanced building envelopes can control indoor temperatures and save energy. However, PCM needs to undergo a phase change transition from solid to liquid and back to be fully effective. Furthermore, most previous research integrated PCM with high embodied energy materials. This study aims to advance the existing research on integrating PCM into carbon-negative wall assemblies composed of hempcrete and applying temperature control strategies to improve wall systems’ performance while considering the hysteresis phenomenon. Four hempcrete and hempcrete-PCM (HPCM) wall design configurations were simulated and compared under different control strategies designed to reduce energy demand while enhancing the phase change transition of the microencapsulated PCM. The HPCM wall types outperformed the hempcrete wall assembly through heating (~3–7%) and cooling (~7.8–20.7%) energy savings. HPCM walls also maintained higher wall surface temperatures during the coldest days, lower during the warmest days, and within a tighter range than hempcrete assembly, thus improving the thermal comfort. However, the results also show that the optimal performance of thermal energy storage materials requires temperature controls that facilitate their charge and discharge. Hence, applied control strategies reduced heating and cooling energy demand in the range of ~4.4–21.5% and ~14.5–55%, respectively.

Graphical Abstract

1. Introduction

Latent heat storage systems with phase change materials (PCMs) are promising technology capable of storing and releasing significant quantities of heat per unit of mass through a phase change from liquid to solid and back near room temperature [1,2]. As a result, the PCM can better control indoor temperatures and save energy by absorbing part of a building’s heat load during the daytime as it melts and releasing this heat during the cooler nighttime as it returns to its solid phase. In passive applications, PCMs are typically embedded into the building fabrics of walls, floors, roofs, fenestration, façade, shutter, and shading systems without relying on auxiliary equipment, which increases the envelope’s thermal storage capacity [1,2]. PCM is integrated into the building fabrics through different approaches such as PCM-enhanced covering materials, including plasterboards, wallboards or gypsum boards [3,4,5], concrete [6,7], ceramics [8,9], microencapsulated PCM panels [10,11,12], multi PCM structure [13,14,15,16], and PCM-impregnated insulations [17,18,19]. The initial capital cost of PCM is still high [2,20]. Furthermore, PCM needs to undergo a phase change transition from solid to liquid and back to be fully effective. Hence, applying an appropriate control strategy is required to maximize the energy savings during its operation.
Different control strategies have been used in buildings with PCM-enhanced envelopes to control the operation of the mechanical systems and hence ensure indoor comfort while minimizing energy consumption, cost, and CO2 emissions [2]. Some studies investigated natural ventilation techniques alone or combined with HVAC setpoint control strategies to lower the cooling demand and discomfort time. Thus, Solgi et al. [21] implemented a night ventilation strategy that solidifies the PCM when the outdoor temperature dropped below 30 °C to reduce the cooling energy demand of an office building exposed to a hot-arid climate. Barzin et al. [22] constructed two identical lightweight experimental huts, a reference with impregnated gypsum boards and one finished with PCM-enhanced gypsum boards, equipped with air conditioning units. While using an air conditioning unit without night ventilation achieved very little savings in electricity, using night ventilation to charge the PCM instead resulted in 73% weekly electricity savings. Other studies applied more advanced control strategies than classical controls to handle disturbances, time-dependent parameters, and nonlinear systems. For example, Zhu et al. [23] performed a numerical study to evaluate the impact of optimal control methods in commercial buildings enhanced with shape stabilized PCM and equipped with air conditioning units. The results showed that the use of PCM in the building envelope reduced electricity and peak load by 11% and 20%, respectively. Konstantinidou et al. [24] carried out a simulation-based study using an EN adaptive comfort model combined with multi-objective optimization to implement a control strategy for air conditioning and ventilation patterns to minimize the cooling demand and discomfort time in undivided and subdivided office buildings enhanced with PCM. The findings showed that PCM could reduce demand and discomfort hours of the undivided office building but not of the entire subdivided space where the reduction occurred only in the south and east orientations of the buildings, probably due to their exposure to solar radiation.
A fewer number of studies applied temperature control strategies to reduce heating energy requirements while maintaining thermal comfort. For example, Bastani et al. [25] investigated the impact of an on/off control, using five different room setpoint temperature ranges (20–25, 19–24, 18–23, 20–24, and 20–23 °C) on shifting heating peak demand of a bungalow with PCM wallboards in Canada. The findings suggest that a broader range of room operational temperatures results in higher energy consumption during the charging period and the entire day. At the same time, a wider operating temperature range avoided the heater’s operation for space conditioning for a more extended period after the charging hours. Another study conducted in cold climates evaluated seventeen PCMs and their performance in a standard Danish office with a cooling setpoint of 25 °C and a heating setpoint of 22 °C [26]. During off-peak hours the setpoint indoor air temperatures were 21–23 °C, and during peak hours, 17–19 °C. Over the six days, the PCM-enhanced hut achieved 21.5% and 26.7% power and cost savings, respectively, compared to the structure without PCM. The results suggest building insulation level, room cooling, heating setpoints, and ambient weather conditions are critical parameters in identifying the best performing PCM. The optimal control method can also be applied to buildings integrated with PCM passively. Barzin et al. [27] evaluated two experimental huts in New Zealand equipped with identical electric heaters, one having gypsum boards and the other DuPont PCM wallboards with a melting temperature of 21.7 °C. Most previous studies examined embedding PCMs into conventional envelope systems [1,2] and building materials with high embodied energy, such as gypsum [28], concrete [29], and cement mortars [30]. However, the energy intensity of construction materials is becoming more critical with decreasing the operational loads through tightening the building energy codes. Hempcrete, made of the hemp plant’s inner woody core combined with a lime-based binder, is a lightweight, carbon-negative biocomposite material that can considerably enhance energy performance, indoor environmental quality, and sustainability of buildings [31,32]. In this regard, hempcrete is a non-structural material used with a load-bearing frame that offers a beneficial compromise between thermal conductivity and thermal inertia, thus enabling a passive control of the indoor building environment [33]. For example, low thermal diffusivity of hempcrete, ranging from 1.48 × 10⁻⁷ m2/s in the dry state to 0.98 × 10⁻⁷ m2/s in the fully saturated condition, and its high specific heat capacity from 1000 to 1590 J/(kg K) [34,35,36,37] can provide better thermal performance than suggested by its thermal transmittance in the range of 0.06–0.14 W/(m K) [35,36,38]. Moreover, hempcrete envelopes can also meet building code requirements and simplify envelope construction [39]. A limited number of research studies investigated the integration of microencapsulated PCMs into hemp–lime composites [40,41]. Furthermore, although experimental results showed a pronounced hysteresis effect of hempcrete-PCM composites, the previous numerical analysis did not investigate this phenomenon [40].
This study aims to advance the existing research on integrating hempcrete and hempcrete-PCM composites into wall assembly systems and applying the temperature control strategies to improve their performance in cold climates while considering the hysteresis phenomenon. First, we developed four hempcrete and hempcrete-PCM (HPCM) wall designs using thermophysical properties experimentally derived in our previous study [40]. Second, their performance was analyzed and compared under the base case control strategy. Then, best-performing wall configurations were further investigated under four different control strategies designed to reduce heating and cooling energy demand while improving the phase change transition of the microencapsulated PCM. Hence, this work provides valuable guidance and recommendations for the integrated building design that considers the interaction between the building thermal mass and HVAC systems.
Furthermore, most existing studies have researched PCM applications for cooling savings in temperate and hot weather conditions [1,21,22,23,24]. In contrast, this study seeks to expand our knowledge of PCM use under various temperature control strategies in buildings exposed to cold climates and heating energy savings. Moreover, unlike previous research conducted in cold environments [25,26], we implemented setback temperature profiles during dormant hours and within the comfort range during the daytime. This control strategy aimed to decrease discomfort during active periods and heating energy demand through lower indoor–outdoor temperature differences during the coldest part of the day. This study also moves the field forward and fills the gap regarding implementing user-defined functions for modeling hysteresis phenomena and temperature controls in ANSYS Fluent (ANSYS Inc., Canonsburg, PA, USA). In this respect, the Supplementary Materials of this paper details the developed user-defined functions.

2. Materials and Methods

2.1. Geometry and Materials

Numerical simulations allowed the extension of the experimental results [31] by comparing the performance of hempcrete and three design options of hempcrete-phase change material (HPCM) wall assemblies under different control strategies. Figure 1 illustrates the wall model developed in ANSYS Design Modeler (ANSYS Inc., Canonsburg, PA, USA) and simulated design options, including (1) a wall with 30 cm of hempcrete infill, (2) a wall with 10 cm of HPCM and 20 cm of hempcrete infill (HPCM10), (3) a wall with 20 cm of HPCM and 10 cm hempcrete infill (HPCM20), and (4) a wall with 30 cm of HPCM infill (HPCM30). Furthermore, measurement points at (X = 0, 0.5 L, L), where L is 10 cm for HPCM10, 20 cm for HPCM20, and 30 cm for HPCM30 (see Figure 1), allowed insight into the wall temperatures and the effectiveness of integrated phase change materials at different wall thicknesses.
The hempcrete infill consists of hemp hurd, binder (50% hydrated lime and 50% metakaolin by weight), and water at the ratio of 1:1:3 by weight, respectively. Because of the microencapsulated phase change material’s (MPCM) high price, negative impact on the mechanical properties [42], and hindering effect on energy savings when used in higher percentages [40], HPCM infill consists of approximately 9% MPCM (Nextek 18D) and 91% hempcrete. The Nextek 18D product has an 18 ± 1 °C phase change temperature, 15–30 µm particle size, ~300–400 kg/m3 bulk density, and ≥190 J/g heat of fusion [43]. This MPCM product was selected due to its high shell integrity and volumetric heat capacity, on the one hand, and low agglomeration rate and high encapsulation efficiency on the other hand [40,43]. Table 1 summarizes the materials’ thermophysical properties used to simulate the four wall design types. The experimental results show that the HPCM has lower thermal conductivity than hempcrete despite approximately 3% higher dry density due to about 30–40% lower thermal conductivity of the MPCM than hempcrete [40]. For example, the thermal conductivity of MPCM ranges from 0.061 to 0.071 W/(m K) over the temperature range of 16–25 °C and the thermal conductivity of hempcrete ranges from 0.1023 to 0.1048 W/(m K) over the temperature range of 14–24 °C. Consequently, all HPCM wall types (i.e., 10, 20, and 30 cm thick HPCM layers) have between 3.7% (HPCM10) and 8.8% (HPCM30) lower overall thermal transmittance than the base hempcrete case with 0.344 W/(m2 K). Values for hempcrete and HPCM infills are taken from the experimental study [40] and common building materials such as gypsum and cement lime plaster from the WUFI software library [44]. Thermal diffusivities are calculated according to [45].

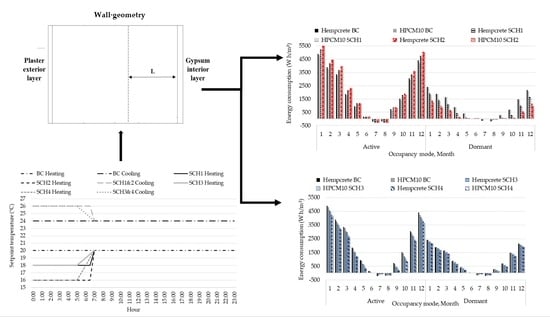
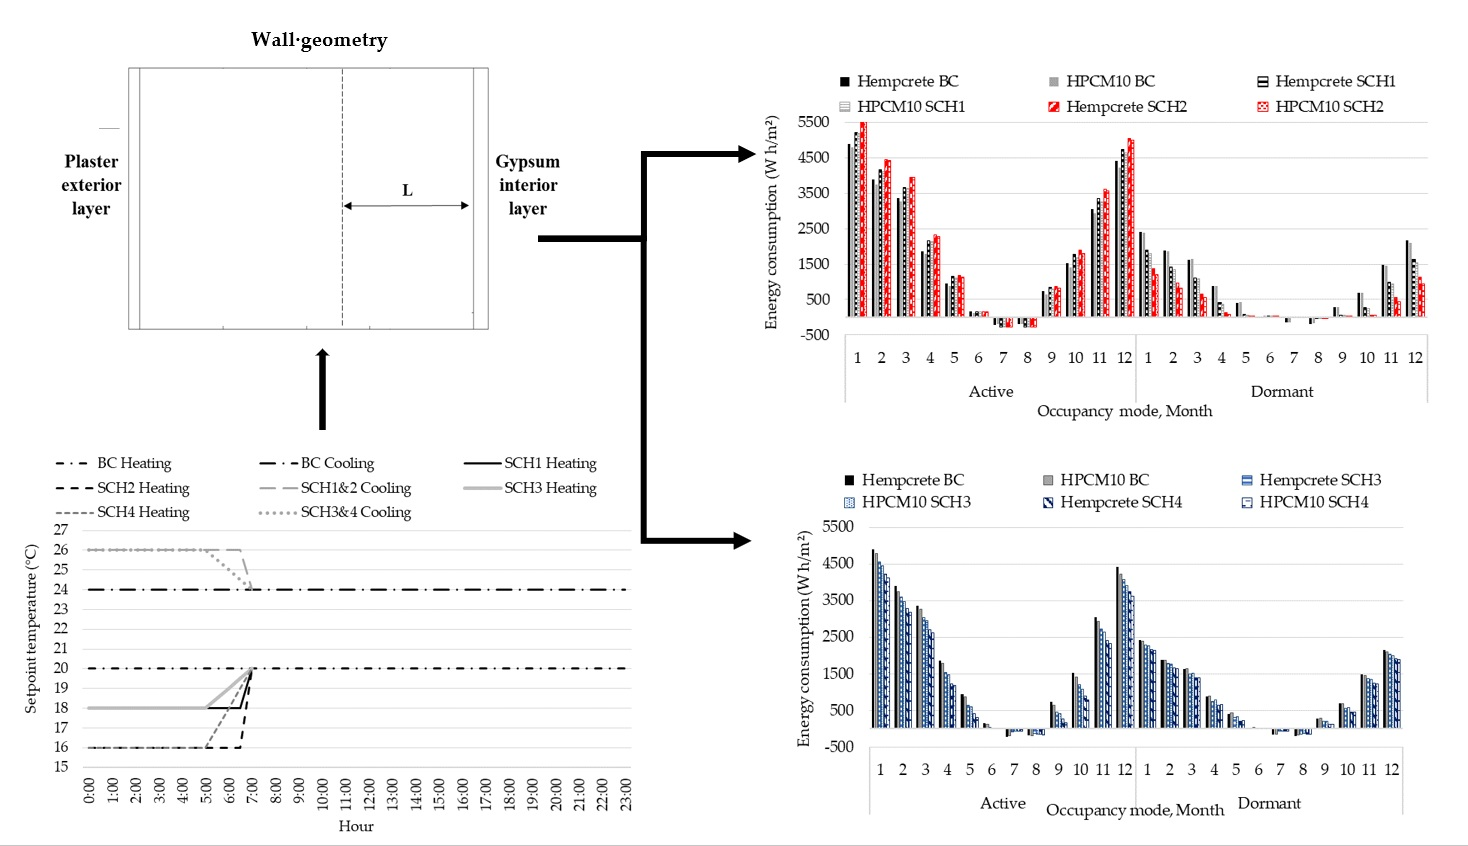
2.2. Climate and Controls

The wall design types, hempcrete, HPCM10, HPCM20, and HPCM30, were simulated for weather conditions in Winnipeg, Canada. The Canadian Weather for Energy Calculations file (DOE, Washington, DC, USA), composed of hourly weather data records selected from a 30-year database for Winnipeg [46], and the building modeling tool EnergyPlus (DOE, Washington, DC, USA)were used to generate solar flux data, outside temperature, and wind speed for south wall orientation with the external heat transfer coefficient calculated by the Liu and Harris model [47], and the internal heat transfer coefficient calculated by the Awbi and Hatton model [48]. Winnipeg experiences temperature differences between summer and winter of more than 60 °C. Winters are long and extremely cold, with average outdoor air temperatures ranging from −5 to −20 °C, and summers are short and warm, with average outdoor air temperatures ranging from 5 to 25 °C. The city also has relatively low evening and night temperatures, with an average of approximately 15 °C during the three warmest summer months. As a result, the predominant energy use in buildings is heating. Therefore, this study investigated phase change material with the temperature range suitable for the winter setpoint and setback temperatures to reduce the space heating energy consumption.
Figure 2 shows the flow chart of the implemented control logic. Furthermore, Figure 3 presents the simulated control strategies. The base case (BC) schedule applied setpoint temperatures within the thermal comfort range of 20–24 °C at all times. Hence, heating started when the temperature fell below 20 °C, whereas cooling began when the temperature raised above 24 °C. Schedule 1 (SCH1) introduced heating and cooling setback temperatures of 18 and 26 °C during the dormant hours in winter and summer, respectively. The goal of this control strategy was to, on the one hand, increase heating and cooling energy savings, and on the other hand, facilitate the phase change transition of the modeled microencapsulated PCM (see Section 2.1). However, our previous research showed the pronounced hysteresis effect of hempcrete-PCM composites. As a result, the solidification of the modeled MPCM starts at lower temperatures of around 16 °C [40]. Therefore, Schedule 2 (SCH2) further reduced the heating setback temperature to 16 °C and kept the cooling setback temperature to 26 °C. Schedule 3 (SCH3) applied heating setback temperature ramp-up and cooling setback temperature ramp-down of 0.5 °C every 30 min from 05:00 to 07:00 to avoid the heating and cooling energy peaks in the morning hours. Finally, Schedule 4 (SCH4) implemented a heating setback temperature ramp-up of 1 °C every 30 min from 05:00 to 07:00 while maintaining the cooling controls from SCH3.

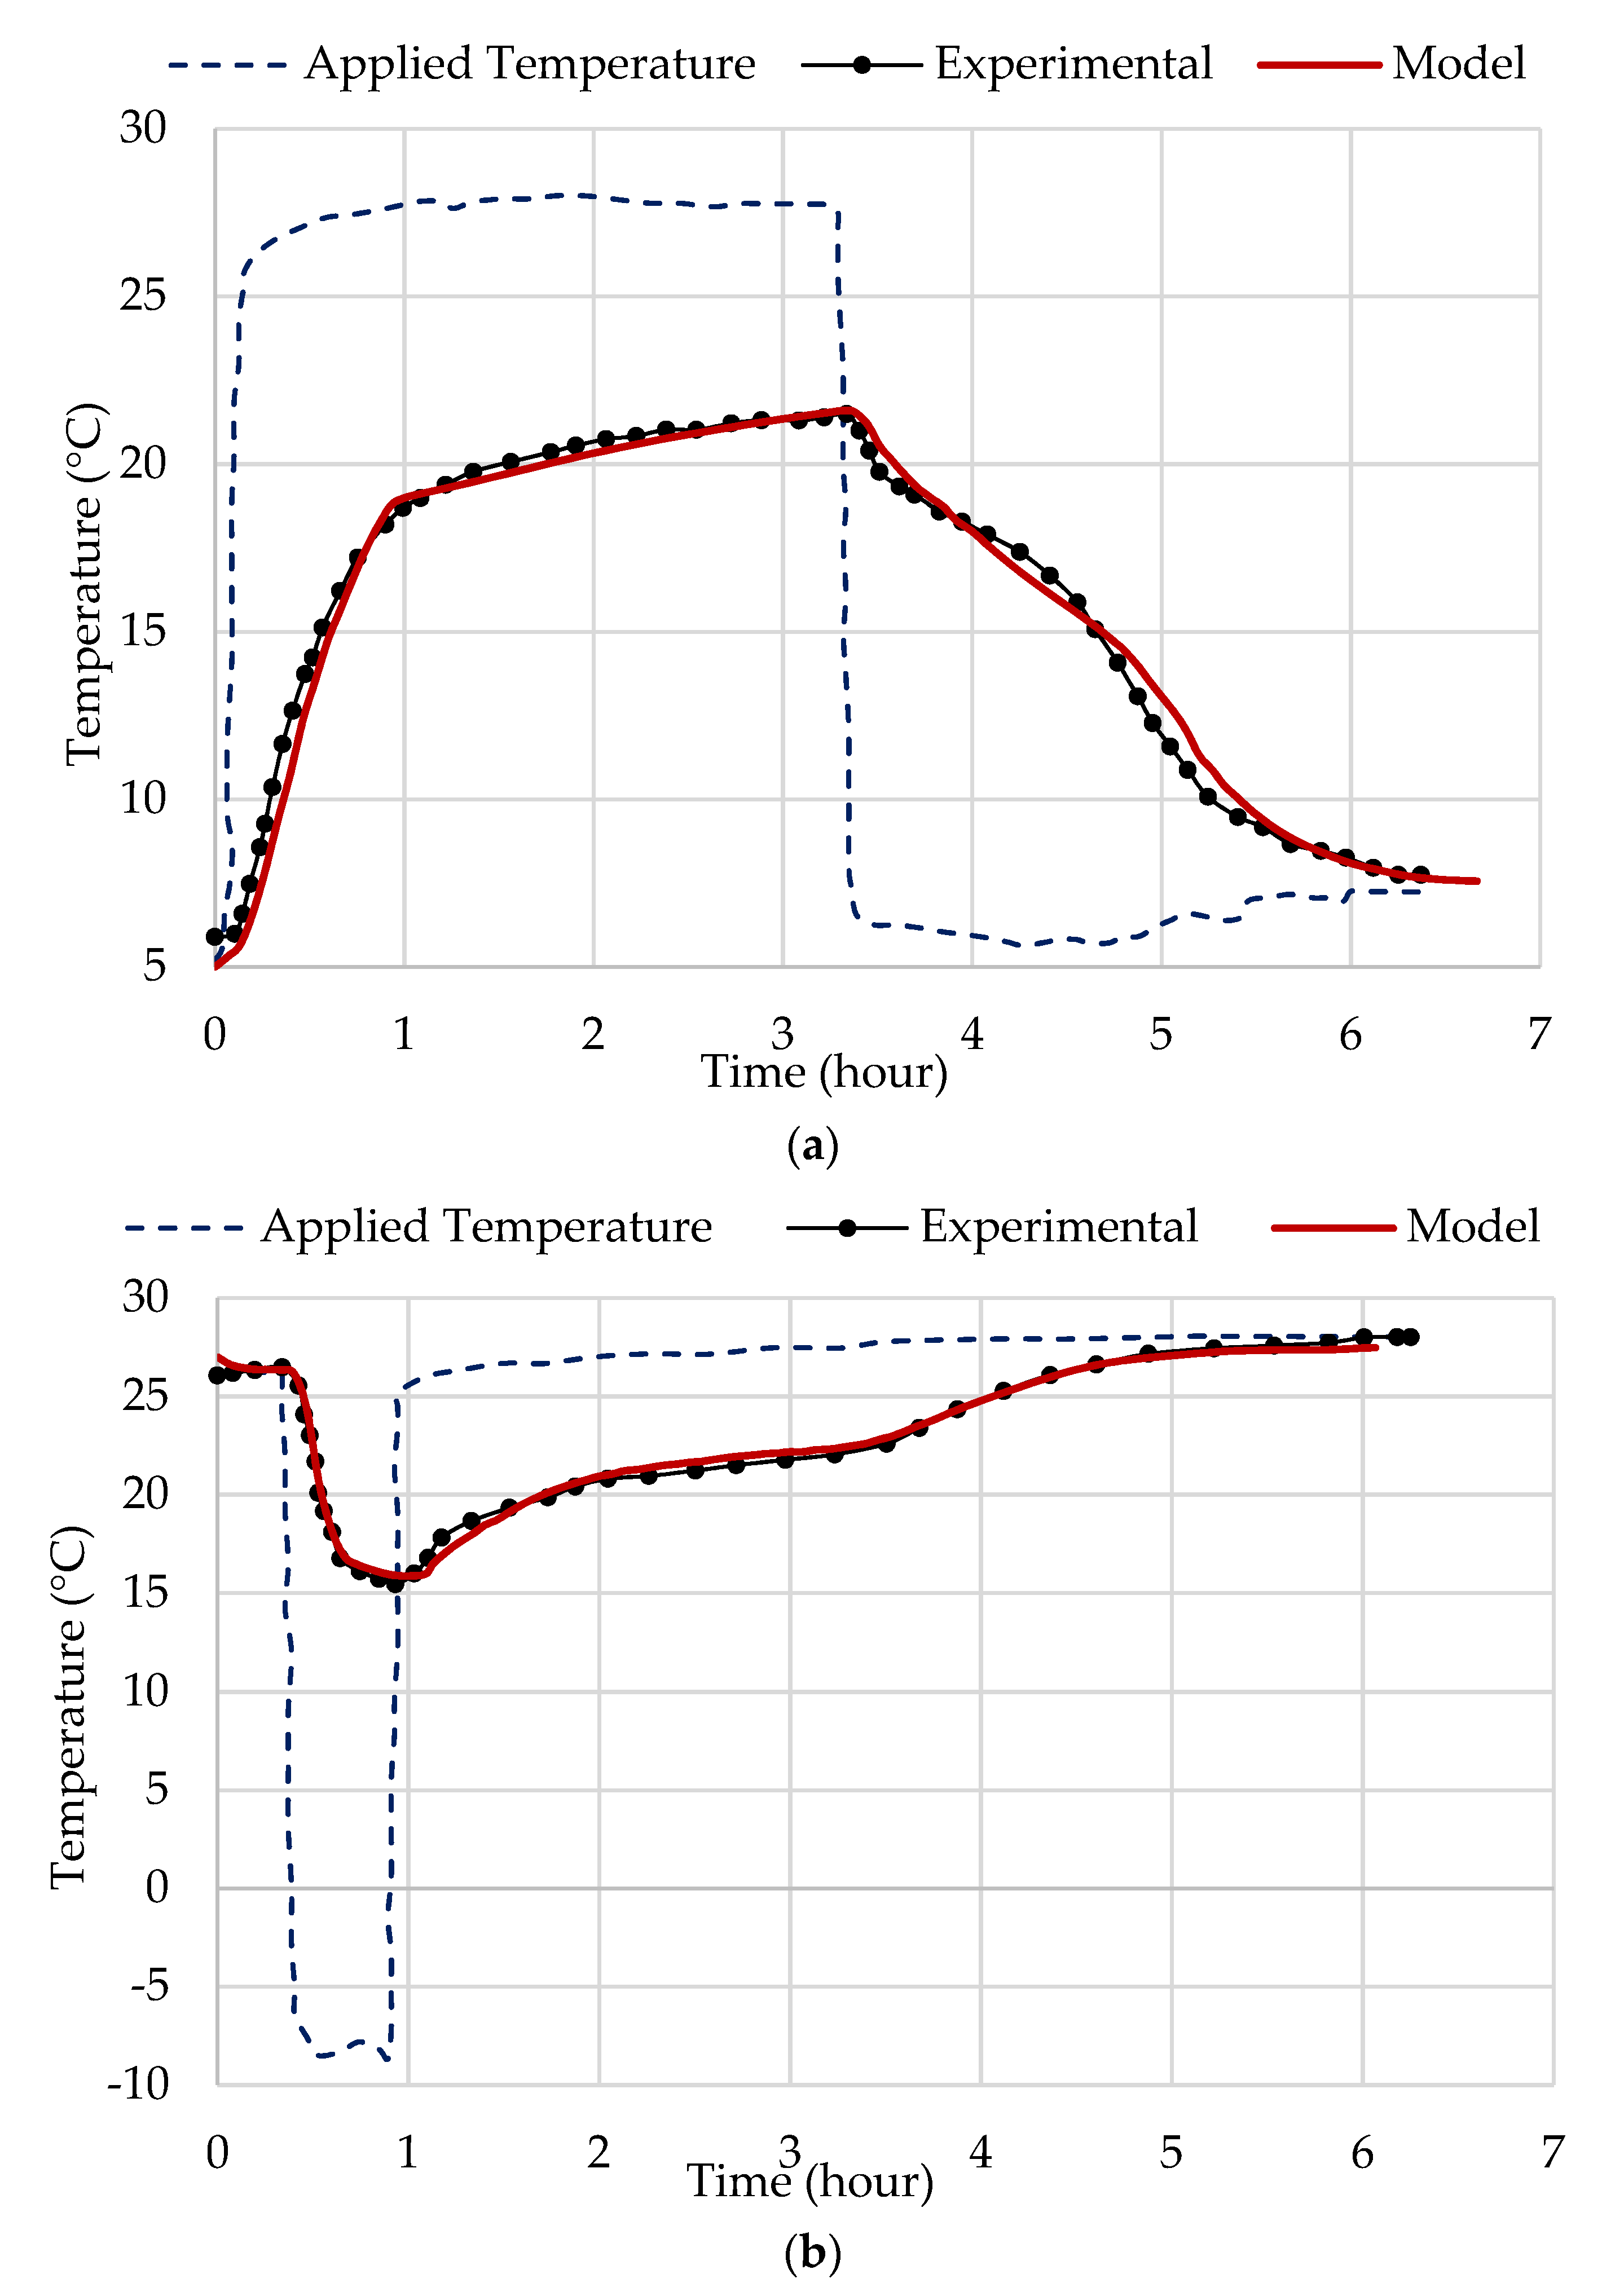
2.3. Governing Equations and Hysteresis

Numerical analysis is carried out with the software ANSYS Fluent using a finite volume method. The model solves the following time-dependent governing energy equation.
ρ h t = · ( k T ) + S E ,
where ρ is the density, t is time, h is the specific sensible enthalpy (   C p , s e n s i b l e   d T ), k is thermal conductivity, T is temperature, and SE is the source term to simulate the effect of latent energy and hysteresis, defined by the following Equations (2) and (3).
S E = ρ Δ H t
Δ H = β ( T ) L ,
where ΔH is the latent energy at a certain liquid fraction β, L is the total latent energy of the HPCM, and β(T) is the liquid fraction of HPCM as a function of temperature.
For the hysteresis effect with complete cycles of melting–freezing phase change, temperature change with time determines the liquid fraction equation used in the source term, as shown in Equations (4) and (5).
β ( T ) = β m ( T ) ,   if   d T d t 0
β ( T ) = β f ( T ) ,   if     d T d t < 0
where βm (T) is the liquid fraction of the melting curve, and βf (T) is the liquid fraction of the freezing curve, as shown in Figure 4.
However, in real-world applications and integration of the PCMs into the envelope systems, they often experience incomplete melting and freezing conditions [49]. Hence, a hysteresis model is used to simulate the hysteresis effect and the transition between melting and freezing curves in cases of incomplete phase change, as shown in Figure 4. The hysteresis model and the liquid fraction transition curves are developed using the mathematical scaling technique provided by [40], as shown in Equations (6) and (7) and Figure 4.
β m f ( T ) = β m ( T o ) β h y s t ( T o ) β h y s t ( T ) ,  
1 β f m ( T ) = 1 β f ( T o ) 1 β h y s t ( T o ) ( 1 β h y s t ( T ) ) ,
where βm (To) is the liquid fraction at To on the melting curve, βf (To) is the liquid fraction at To on the freezing curve, βm−f (T) is the liquid fraction for the transition from melting to the freezing process, βf−m (T) is the liquid fraction for the change from freezing to melting process, and βhyst (To) is the liquid fraction at To on the middle transition curve, as shown in Figure 4.
Confidence in the numerical modeling of the hysteresis effect required validation against the experimental results. In this regard, the developed hysteresis model is validated against the experimental results presented in [50]. In this study, researchers applied a temperature step change for heating and cooling modes on a bio-based PCM product to measure its temperature change and observe the interrupted phase change process. Thus, the same temperature step profile (see Figure 5), geometry, and PCM properties, presented in Figure S3 and Table S2 of the Supplementary Materials, were simulated. The numerical predictions were then compared against experimental measurements provided in [50]. The hysteresis modeling section in the Supplementary Materials presents additional information about the developed model and validation approach. Figure 5 shows a good agreement between the numerical and measured temperatures (with RMSE of 0.65 and 0.35 °C for heating and cooling, respectively, and a maximum temperature difference of 1.1 °C in both cases) and nearly the same profile behavior for temperature change. Consequently, the developed hysteresis model can accurately simulate the interrupted freezing and melting of the PCM.
It is also important to note that the developed finite volume model of the wall applies symmetry boundary conditions at the stud and cavity centerlines. At the same time, it does not consider the interfaces and corners between walls, solar gains through windows, internal loads, and radiation exchange between interior surfaces.

3. Results and Discussion

3.1. Wall Type Comparison for Base Case Schedule

Table 2 summarizes the annual heating, cooling, and total energy consumption with the corresponding percentage savings of the four wall types, hempcrete, HPCM10, HPCM20, and HPCM30, under the BC schedule (see Figure 3). Overall, all HPCM wall types reduced energy consumption compared to the hempcrete wall. For example, HPCM30 achieved the highest total energy savings of approximately 7.8%, followed by HPCM20 with around 6%, and HPCM10 with 3.2%. The improved storage capacity of HPCM walls coupled with their 10% lower thermal conductivity than the hempcrete wall (see Table 1) is the likely reason for the overall better thermal performance of HPCM walls than the hempcrete wall. Therefore, HPCM30 composed entirely of hempcrete-phase change material composite outperformed HPCM20 and HPCM10 with 20 cm and 10 cm thick HPCM layers. The findings also show that HPCMs achieved higher cooling than heating energy savings, ranging from 7.77% to 20.75%. However, due to the cold and long winters in Winnipeg, heating energy reductions range from 1125 to 2735 W h/m2, whereas cooling savings are between 79 and 211 W h/m2. Considering that these savings are per square meter, the energy reductions for the entire envelope are likely to be significantly higher, especially for buildings with a high exposed surface area to volume ratio. Furthermore, compared to the photovoltaic panel’s (P.V.) power output of around 1000 W/m2 under the standard testing conditions [51], the heating energy savings of HPCM walls are significantly higher.
Table 3 summarizes the interior (i.e., wall surface in contact with the air) temperatures’ descriptive statistics for the wall cases. Additionally, Figure 6 compares assemblies’ hourly wall surface temperatures during the coldest and warmest weeks. The findings suggest that HPCM walls maintained higher wall surface temperatures during the coldest days, lower during the warmest days, and within a tighter range than hempcrete. For example, as presented in Figure 6a, HPCM wall types provided 0.1 to 0.6 °C higher temperatures than the hempcrete wall assembly during a week with the lowest outdoor air temperatures in January. Similarly, HPCM wall types kept approximately 0.2 to 0.4 °C lower temperatures during the warmest summer days than the hempcrete wall. These findings support the results of previous studies about the ability of PCM-enhanced envelope components to maintain more comfortable indoor conditions compared to the conventional building envelope systems in the cold region [52].
A thorough comprehension of the impact of MPCMs’ integration into hempcrete requires detailed knowledge of their phase change behavior throughout the year. In this respect, Figure 7 compares the number of phase change hours between the HPCM wall types at three points—the internal, the middle, and the external. As presented, the HPCM walls had a similar number of phase change hours (~5050) in the inner layer (i.e., at X = 0). In contrast, the HPCM10 wall had approximately 42% and 38% more phase change hours in the middle (i.e., at X = 0.5 L) than HPCM20 and HPCM30 walls, respectively. Similarly, the HPCM10 case exhibited around 29% and 49% more phase change hours than HPCM20 and HPCM30 walls, respectively, at the exterior (i.e., at X = L). Additional analysis of monthly phase change hours revealed two main reasons for these findings. First, because microencapsulated phase change material was selected to perform during the heating season and thus has a low operating phase change temperature of 18 ± 1 °C (see Section 2.1), it stayed melted most of the summer in all walls. As a result, HPCM walls effectively behaved as sensible heat storage during the summer months. Yet, their higher heat storage capacity than hempcrete (see Table 1) led to lower interior surface temperatures during warm days. Second, low winter temperatures prevented the phase change cycle in the assemblies with HPCM closer to the external environment. Consequently, a significant amount of HPCM30 and HPCM20 stayed frequently solid during the winter months. Considering these results and the current high price of the microencapsulated phase change materials, we selected HPCM10 to explore control strategies and different schedules further.

3.2. The Performance of HPCM10 under Schedules 1 and 2

Table 4 summarizes and compares the energy consumption of hempcrete and HPCM10 wall types under three control strategies—BC, SCH1, and SCH2 (see Figure 3). As anticipated, the introduction of setback temperatures during the night under SCH1 and SCH2 reduced heating and cooling energy consumption of both wall assemblies compared to the BC schedule. Thus, heating setpoint reduction of 2 °C during the dormant hours in SCH1 achieved 4.41% and 4.15% heating energy savings for hempcrete and HPCM10 walls, respectively, compared to the BC schedule. Additional reduction of setback temperature to 16 °C under SCH2 further increased heating energy savings to 7.46% for the hempcrete wall and 7.82% for HPCM10 assembly. The cooling setpoint increase to 26 °C under both scenarios resulted in more significant cooling energy savings. Hence, hempcrete and HPCM10 walls achieved energy savings of 16.1% and 14.5%, respectively, under SCH1. Likewise, hempcrete and HPCM10 assemblies reduced cooling energy consumption by 15.7% and 14.4%, respectively, under SCH2. Furthermore, similar to previous findings, HPCM10 wall assembly achieved higher energy savings than the hempcrete wall under SHC1 and SCH2.
Further understanding of the hempcrete and HPCM10 wall type performances requires analyzing monthly and hourly energy consumption and interior surface temperatures. In this respect, Figure 8 presents the average monthly heating and cooling energy consumption during active and dormant periods for hempcrete and HPCM10 walls under BC, SCH1, and SCH2 control strategies. As presented, both walls exhibited higher energy consumption under SCH1 and SCH2 than BC during active hours. Thus, the energy consumption of the hempcrete wall was 123–303 and 137–600 W h/m2 higher under SCH1 and SCH2, respectively, than BC.
On the other hand, both schedules with setback temperatures reduced energy consumption during the night compared to the BC controls throughout the year. For instance, hempcrete and HPCM10 walls reduced energy consumption from 18% in January to 84% in July under the SCH1. Furthermore, the application of SCH2 further decreased energy use by 22–31% for hempcrete and 44–60% for HPCM10 from November to January under SCH2. Hence, SCH1 and SCH2 almost eliminated heating energy needs during the nights from May to September and significantly reduced them during the rest of the dormant periods compared to the BC schedule.
Figure 9 shows the average hourly walls’ energy consumption under three schedules during active and dormant hours from November to March. The most significant increase in the walls’ heating energy consumption under SCH1 and SCH2 compared to the BC schedule occurred in the early morning hours when the outdoor air temperatures were at their lows and heating setback temperature changes to the setpoint (see Figure 3). Furthermore, because of the higher difference between setback and setpoints of 4 °C, SCH2 had a more pronounced energy peak at 08:00 than SCH1. In contrast, at night, both walls had a significantly lower energy consumption under SCH1 and SCH2 than their counterparts under the BC scenario. Furthermore, the HPCM10 wall type outperformed the hempcrete case during dormant hours. In this respect, the HPCM10 case had 5–7% and 16–20% lower average hourly energy consumption than the hempcrete wall type at night under SCH1 and SCH2, respectively.
Figure 10 illustrates the average interior surface temperatures of hempcrete and HPCM10 walls under SCH1 and SCH2 from November to March to provide additional insight into the performance of the latent heat storage. We can observe that the HPCM10 wall type maintained higher interior surface temperatures than hempcrete assembly, particularly under SCH2 during dormant hours. For example, HPCM10 achieved between 0.01 and 0.18 °C higher inside wall surface temperatures than hempcrete under SCH1. This temperature difference between HPCM10 and hempcrete walls was higher under SCH2, ranging from 0.08 to 0.34 °C.
A possible explanation for better performance of the HPCM10 wall than the hempcrete case during the night may lie in significantly lower thermal diffusivity (i.e., the lower rate at which heat disperses throughout the material) of the HPCM10 assembly than the hempcrete wall. In this respect, due to around 8.7% lower thermal conductivity and 17–73% higher specific heat capacity of HPCM than hempcrete, HPCM has 26–76% lower thermal diffusivity than hempcrete (see Table 1). Consequently, the HPCM10 wall had a lower heat transfer from the inside (hot) to the outside (cold) than hempcrete assembly, thus maintaining higher indoor surface temperatures and reducing the heating energy consumption during the night.
However, the comparison of the HPCM10, hempcrete, and HPCM10 theoretical wall with the same overall heat transfer coefficient as hempcrete wall hourly energy consumption under SCH2 from January 12th to 15th, presented in Figure 11a, indicates another cause for the differences in their performance. Thus, on the one hand, the HPCM10 wall had higher energy consumption than the hempcrete wall during the active hours of the 12th and 13th. On the other hand, the HPCM10 wall had lower energy consumption than the hempcrete wall during the daytime hours of the 14th and 15th. The lower thermal diffusivity of the HPCM10 compared to the hempcrete wall does not entirely explain these findings. In this regard, the HPCM10 wall should consistently achieve higher heating energy savings than the hempcrete wall due to the lower heat transfer rate throughout the HPCM layer.
Furthermore, Figure 11b illustrates that outdoor air temperatures significantly declined over the presented period from the average of −3 °C on the 12th to −22 °C on the 15th. Contrastingly, all four days had high solar radiation (~23–31% lower than the annual maximum 1128 W/m2), especially the 12th with the maximum of 870 W/m2. Hence, the phase change material in the HPCM10 melted and absorbed solar energy during the less cold and sunny winter days of the 12th and 13th, at the expense of higher energy input of the heating system compared to the hempcrete case. Previous studies support the explanation that phase change materials sometimes can increase energy consumption due to the absorption of the thermal energy (e.g., solar radiation) that otherwise would heat the space and reduce heating requirements [53]. Then, when outdoor air temperature declined on the 14th and 15th, the HPCM10 wall released the stored heat back to the interior space, reducing energy consumption compared to the hempcrete wall.
Analysis of the hypothetical HPCM10 wall type additionally contributes to these findings. In this respect, Figure 11a indicates that an increase in the overall thermal heat transfer coefficient of the HPCM10 wall had a dual effect on its performance. On the one hand, the theoretical case had higher energy consumption than the original HPCM10 and hempcrete assemblies during the daytime. On the other hand, the hypothetical case achieved almost identical heating energy savings as the original HPCM10 during the night.
Previous studies showed that increasing the conductivity of PCMs could improve the efficiency of the latent thermal energy storage because it reduces the material’s charging and discharging time [54]. Nevertheless, an excessive increase in thermal conductivity can negatively affect the system’s storage capacity. Hence, there should be a trade-off between thermal conductivity and thermal storage capacity. Therefore, an increase in the heat transfer coefficient of the HPCM10 increased energy consumption compared to the original case while melting and absorbing the heat during the daytime. At the same time, an increase in heat transfer coefficient improved the heat discharge at night, thus achieving similar energy savings to the original case and outperforming the hempcrete wall.
Although overall SCH1 and SCH2 achieved energy savings compared to the base case controls, energy increase in the daytime and peaks in the mornings may cause higher energy prices due to the high energy demand during the on-peak hours. Therefore, our further investigation included applying the modified control strategies that use temperature ramping to reduce the energy peaks during the morning and active hours.

3.3. The Performance of HPCM10 under Schedules 3 and 4

Table 5 summarizes and compares the energy consumption of hempcrete and HPCM10 wall assemblies using the control strategies BC, SCH3, and SCH4 (see Figure 3). Overall, applying the temperature ramping under SCH3 and SCH4 resulted in significant heating and cooling energy savings in investigated wall assemblies compared to BC and their counterparts without ramping, SCH1 and SCH2, respectively. For example, the heating energy savings of SCH3 and SCH4 schedules for both wall types were approximately 11% and 21% higher, respectively, compared to the BC controls. The cooling energy savings for the walls were around 54% higher than the BC schedule. Furthermore, both wall assemblies’ heating energy savings were approximately 7% higher for the SCH3 than SCH1, whereas the cooling savings were around 45%. The temperature ramping in SCH4 achieved heating energy savings of about 15% compared to the SCH2 and the cooling energy savings of approximately 46% in both wall types. Similar to previously, HPCM10 performed somewhat better than the hempcrete wall. These results show that despite 0.2 and 0.4 °C higher average heating setback temperatures of SCH3 and SCH4 than their counterparts without ramping, a gradual increase in the setback temperatures over two hours improved the overall walls’ energy performance. The likely reason is the high thermal storage capacity of both hempcrete and HPCM10 walls due to their high specific heat capacity combined with moderately high density (see Table 1).
In addition to the overall energy savings, the temperature ramping in SCH3 and SCH4 drastically improved hempcrete and HPCM10 wall types’ heating and cooling energy demand profiles. Figure 12 and Figure 13 compare average monthly and hourly heating and cooling energy consumption of hempcrete and HPCM10 walls under SCH3 and SCH4 against the BC control. As presented in Figure 12, the monthly heating and cooling energy demands of SCH3 and SCH4 are lower than the BC schedule during active and dormant periods throughout the year. For instance, both wall types achieved 7% to 32% and 14% to 64% higher energy savings under SCH3 and SCH4, respectively, than BC controls during the active heating periods. These percent savings translate to absolute heating energy reductions in the range of 300–690 W h/m2. The percent cooling energy savings were significantly higher, ranging from 16% to 70%. Yet, in the absolute numbers, cooling energy savings were in the range of 32–140 W h/m2. The results also show lower energy savings of SCH3 and SCH4 compared to the BC schedule than those achieved by their counterparts without ramping during the dormant hours. Hence, both wall types had approximately 5% to 22% and 10% to 48% higher energy savings under SCH3 and SCH4, respectively, than BC controls during the active heating periods. The cooling energy savings range from around 21% to 60%. Figure 13 illustrates that SCH3 and SCH4 led to heating energy reductions compared to the BC during most day hours. Moreover, unlike SCH1 and SCH2 (see Figure 7), the lowest hourly heating energy demand was during the morning (i.e., 07:00 and 08:00) and early afternoon hours, when the outdoor temperatures were at their minimum. As a result, implementing the gradual increase in the heating setback temperatures may decrease energy prices due to the lower energy demand during the on-peak hours.
Figure 14 provides further insight into the performance of the HPCM10 wall under control strategies with (SCH3 and 4) and without (SCH1 and 2) ramping of the heating setpoint temperatures during the winter months of November to March. Comparing the average hourly heating energy consumption of HPCM10 assembly shows very different performances between the four control strategies. For example, the SCH1 and SCH2 had 13% to 51%, respectively, higher heating energy demand during active hours than SCH3 and SCH4. Morning hours between 08:00 and 09:00 had a particularly pronounced energy demand difference ranging between 25% and 51%. In contrast, the SCH1 and SCH2 exhibited between 46% and 81% lower heating energy demand during the dormant hours than the SCH3 and SCH4. These findings provide additional evidence about the ability of HPCM10 walls to behave as thermal batteries. Thus, sudden setpoint temperature change under SCH1 and SCH2 caused the wall assemblies to charge during the morning and early afternoon hours, increasing energy consumption. The walls released this heat back to space during the night, thus reducing energy consumption. On the other hand, the gradual heating setback temperature increase under SCH3 and SCH4 reduced energy demand during the daytime. However, SCH3 and SCH4 also reduced the charge and discharge of the walls during the active and dormant hours, respectively.
Figure 14 also shows that SCH2 with the heating setback point of 16 °C achieved 32% to 67% higher heating energy savings during the nighttime than SCH1 with the heating setback point of 18 °C. Furthermore, the most significant difference in the heating energy consumption of the two control strategies was at midnight when the setpoint changed to the setback temperature. However, during the daytime, SCH1 outperformed SCH2 by reducing energy consumption between 4% in the afternoon and 18% in the morning hours. In contrast, their counterparts with ramping, SCH3 and SCH4, exhibited more consistent heating energy profiles. Thus, SCH4 achieved around 8% higher heating energy savings than SCH3 during the dormant hours and 8% to 16% during the active hours. The only time SCH3 outperformed SCH4 was at 06:00, an hour after the ramping period start. These results support our previous findings regarding the impact of the setpoint and setback temperature difference and the implementation time frame. In this respect, in a high thermal mass material, the sudden temperature rise over a short time requires more energy than a gradual temperature increase over an extended period.
Figure 15 provides additional insights into the performance of the HPCM10 wall type through the investigation of the phase change hours in the three layers—internal, mid, and external—under all five investigated control strategies. As presented, the phase change hours of the inner layer increased as the control strategies changed from the BC schedule to SCH4, and the opposite applied to the middle and exterior layers of the HPCM10 wall assembly. Hence, the interior layer exhibited 24% (SCH2 and 3) to 27% (SCH4) more phase change hours than the BC controls. The middle section performed the best under BC, SCH1, and SCH2 with approximately 6000 phase change hours, and the worst under SCH4 and SCH3 with 9% and 29% fewer hours, respectively. The external layer performed the best under the BC scenario owing to its distance from heating controls, followed by SCH3 and SCH2 with approximately 17% and SCH4 with 25% fewer phase change hours. Considering that the layers closer to the indoor space have the most considerable impact on the interior temperatures and thermal comfort, these results suggest that the HPCM10 wall performed better under SCH2, SCH3, and SCH4 controls compared to the BC and SCH1 strategies.
Finally, Figure 16 graphically depicts and compares the interior surface temperature distributions of hempcrete and HPCM10 wall types through their quartiles, averages, and variability outside the upper and lower quartiles. As presented, both wall types had the least variable interior surface temperatures under the BC schedule, whereas the temperatures of SCH4 exhibited the most significant degree of dispersion. These results are due to tighter setpoint and setback temperature ranges implemented in the BC schedule than other control strategies. Furthermore, while hempcrete and HPCM10 walls show similar behavior for the same control strategy, the HPCM10 wall type consistently maintained higher temperatures and a tighter temperature range than the hempcrete assembly. Moreover, Figure 16 provides additional explanations for the differences in the phase change hours between the schedules (see Figure 15). In this respect, the hempcrete and HPCM10 wall types had the lowest average interior surface temperatures under SCH4 and the highest under the BC schedule. As a result, the middle and external layers of the HPCM10 wall had a lower number of phase change hours under SCH4 compared to other controls.

4. Conclusions and Observations

This research provides new knowledge about the performance of hempcrete and HPCM composites by investigating different temperature control strategies to improve the performance of high thermal mass and latent heat storage wall systems in cold climates while considering the hysteresis phenomenon. The findings from this study provide beneficial recommendations for integrated building design that includes the interaction between the building envelope and HVAC systems and could interest an audience focused on high-performance envelope design. Furthermore, this study contributes to the field by providing user-defined functions for modeling hysteresis phenomena and temperature controls in ANSYS Fluent. The main conclusions of this study that point to the need for future work and investigation are as follows:
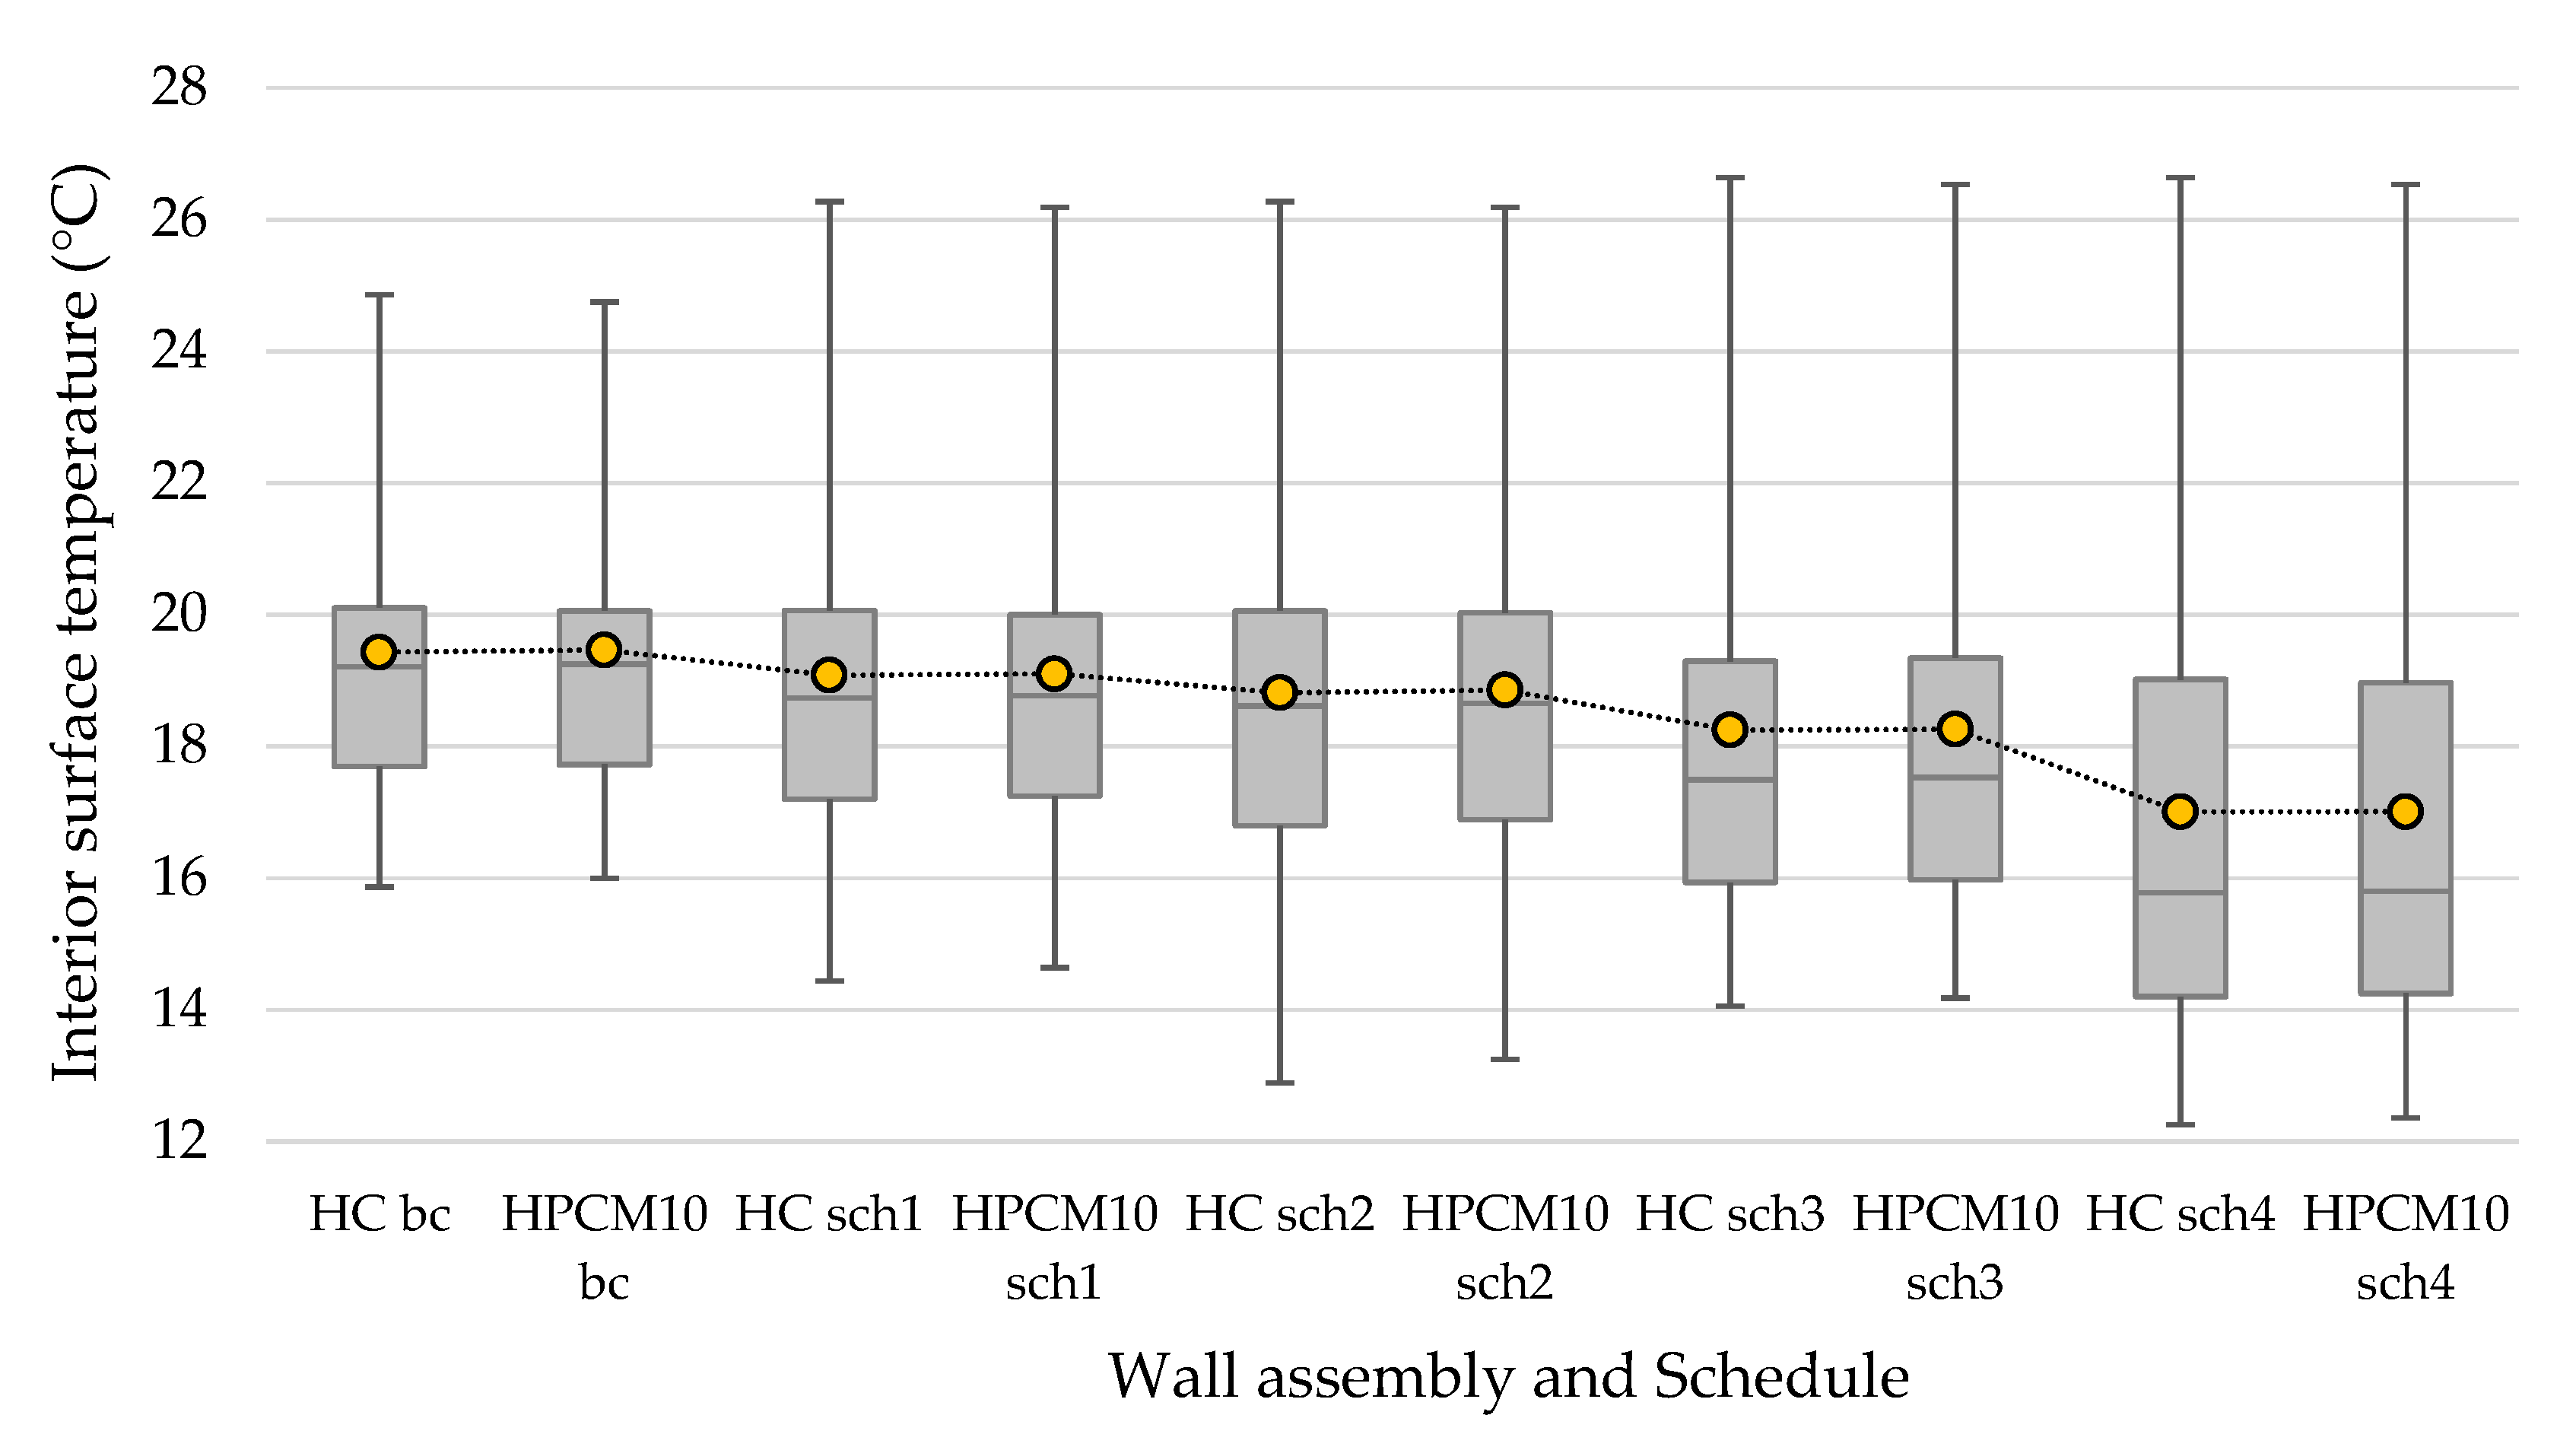
  • Overall, the HPCM wall types outperformed the hempcrete wall assembly under Winnipeg climate conditions and investigated control strategies. In this respect, under the base case (BC: 20–24 °C) schedule, HPCM wall types had between 3% and 7.5% higher heating energy savings and from 7.8% to 20.8% higher cooling energy savings compared to the hempcrete wall assembly. However, due to the cold and long winters in Winnipeg, heating energy reductions range from 1125 to 2735 W h/m2, whereas cooling savings are between 79 and 211 W h/m2. Considering that these savings are per square meter, the energy reductions for the entire envelope are likely to be significantly higher, especially for buildings with a high exposed surface area to volume ratio. Furthermore, HPCM walls maintained higher wall surface temperatures during the coldest days, lower during the warmest days, and within a tighter range than hempcrete, thus improving the thermal comfort. A possible explanation for the better performance of the HPCM wall types than the hempcrete wall may lie in its significantly lower thermal diffusivity (i.e., the lower rate at which heat disperses throughout the material). For example, the HPCM has 26–76% lower thermal diffusivity than the hempcrete due to its 8.7% lower thermal conductivity and 17–73% higher specific heat capacity. As a result, the HPCM walls had a lower heat transfer from the inside (hot) to the outside (cold) than hempcrete assembly, thus maintaining higher indoor surface temperatures and reducing the heating energy consumption. The subsequent study should verify the numerical analysis experimentally by conducting on-site testing of the hempcrete and HPCM wall assemblies.
  • The results also show that phase change hours of HPCM layers reduce significantly (~30–50%) beyond 10 cm (i.e., HPCM10), and the reasons are twofold. First, because microencapsulated phase change material was selected to perform during the heating season and thus has a low operating phase change temperature of 18 ± 1 °C, it stayed melted most of the summer in all wall types. Second, due to the low average winter temperatures of −15 °C or colder, MPCM stayed solid most of the winter in the wall sections of HPCM20 and HPCM30 close to the exterior environment. Therefore, future work should explore adding insulation on the exterior of the wall to improve the performance of the HPCM. Additionally, the follow-up study should investigate the application of MPCMs with higher melting temperatures that will perform well during the warmer months.
  • The implementation of heating (SCH1: 18 °C, SCH2: 16 °C) and cooling (SCH1 and 2: 26 °C) setback temperatures during the dormant hours (00:00–06:30) had a dual effect on the energy performance of the hempcrete and HPCM10 wall types. On the one hand, the SCH1 and SCH2 reduced heating (~4–8%) and cooling energy consumption (~14–17%) of hempcrete and HPCM10 wall assemblies compared to the BC controls. On the other hand, SCH1 and SCH2 increased heating and cooling energy consumption during the active hours, particularly in the early morning hours when the outdoor air temperatures were low and heating setback temperature changed to the setpoint. Energy increase in the daytime and peaks in the mornings may cause higher energy prices due to the high energy demand during the on-peak hours.
  • Therefore, modified control strategies, SCH3 and SCH4, with setback temperature ramping between 05:00 and 07:00, were introduced to reduce the energy peaks during the morning and active hours. Additionally, to the overall heating (~7–21%) and cooling (~45%) energy savings compared to the previous control strategies, the temperature ramping in SCH3 and SCH4 drastically improved hempcrete and HPCM10 assemblies’ heating and cooling energy demand profiles. In this respect, unlike SCH1 and SCH2, the lowest hourly heating energy demand was during the morning (i.e., 07:00 and 08:00) and early afternoon hours, when the outdoor temperatures were at their minimum. As a result, implementing the gradual increase in the heating setback temperatures may decrease energy prices due to the lower energy demand during the on-peak hours. Therefore, subsequent research should include experimental and numerical studies to test further, refine, and advance the developed control strategies. Furthermore, the follow-up numerical research should simulate the entire building to explore further the impact of the HPCM envelope on occupants’ thermal comfort and energy consumption.
  • This study shows that in high thermal mass materials such as hempcrete and HPCM, the sudden temperature rise over a short time requires more energy than a gradual temperature increase over an extended period. Thus, sudden setpoint temperature change under SCH1 and SCH2 caused the wall assemblies to charge during the morning and early afternoon hours, increasing energy consumption. The walls released this heat back to space during the night, thus reducing energy consumption. On the other hand, the gradual heating setback temperature increase under SCH3 and SCH4 reduced energy demand during the daytime. However, SCH3 and SCH4 also reduced the heating energy savings during the dormant periods compared to SCH1 and SCH2. Consequently, the optimal applications of thermal energy storage materials into building envelopes require their integration with HVAC systems and temperature controls that facilitate the charging and discharging of these thermal batteries.
  • Furthermore, the results show that despite lower thermal diffusivity than the hempcrete wall, the HPCM10 case had periods during the daytime with higher energy consumption. Therefore, another possible rationale for the difference in thermal and energy performance of the two assemblies may be the latent nature of HPCM wall types. Hence, when outdoor air temperatures and solar radiation allowed phase change material to melt and absorb heat, the HPCM case increased energy use compared to the hempcrete wall during daytime hours. Nevertheless, the HPCM10 wall released stored heat back to the space during subsequent cold days and nights, thus using less energy than the hempcrete wall. In particular, introducing a setback temperature of 16 °C that is close to the MPCM’s freezing point facilitated the release of heat stored in the HPCM layer during the night, thus having lower energy consumption than the hempcrete wall type. The follow-up numerical study should conduct sensitivity analysis and investigate different case studies (e.g., MPCMs with other properties and maintaining specific parameters consistent between the cases) to further understand the impact of the MPCM incorporation into hempcrete and optimize the design.

Supplementary Materials

The following are available online at https://www.mdpi.com/article/10.3390/en14175343/s1, Temperature controls described by Equations (S1)–(S3), and Figure S1: Heating and cooling schedules; Hysteresis modeling described by Equations (S4)–(S6), Table S1: Temperatures (Tsol, Tliq) and enthalpy equations (h(T)) for HPCM, and Figure S2: Temperatures (Tsol, Tliq) for melting and freezing curves, The example of the user-defined function in ANSYS Fluent for temperature control under SCH4, Figure S3: PCM-equipped wall model (Modified from [50]).

Author Contributions

Conceptualization, M.K., Y.A.; methodology, M.K., Y.A.; software, Y.A.; validation, Y.A.; formal analysis, M.K., Y.A.; investigation, M.K., Y.A.; resources, M.K.; data curation, Y.A., M.K.; writing—original draft preparation, M.K.; writing—review and editing, M.K., Y.A.; visualization, M.K., Y.A.; supervision, M.K.; project administration, M.K.; funding acquisition, M.K. All authors have read and agreed to the published version of the manuscript.

Funding

This research was funded by the Natural Sciences and Engineering Research Council (NSERC) Discovery Grant, grant number RGPIN-05481.

Institutional Review Board Statement

Not applicable.

Informed Consent Statement

Not applicable.

Conflicts of Interest

The authors declare no conflict of interest.

References

  1. Zhou, D.; Zhao, C.Y.; Tian, Y. Review on thermal energy storage with phase change materials (PCMs) in building applications. Appl. Energy 2012, 92, 593–605. [Google Scholar] [CrossRef] [Green Version]
  2. Gholamibozanjani, G.; Farid, M. A Critical Review on the Control Strategies Applied to PCM-Enhanced Buildings. Energies 2021, 14, 1929. [Google Scholar] [CrossRef]
  3. Wijesuriya, S.; Brandt, M.; Tabares-Velasco, P.C. Parametric analysis of a residential building with phase change material (PCM)—Enhanced drywall, precooling, and variable electric rates in a hot and dry climate. Appl. Energy 2018, 222, 497–514. [Google Scholar] [CrossRef]
  4. Su, W.; Darkwa, J.; Kokogiannakis, G.; Li, Y. Thermal Performance of Various Microencapsulated Phase Change Material Drywalls Integrated into Buildings: A Numerical Investigation by ESP-r. In The International Sympsium on Heating Ventilation and Air Conditionig; Springer: Singapore, 2019; pp. 847–855. [Google Scholar]
  5. Su, W.; Darkwa, J.; Kokogiannakis, G. Numerical thermal evaluation of laminated binary microencapsulated phase change material drywall systems. Build. Simul. 2020, 13, 89–98. [Google Scholar] [CrossRef]
  6. Ren, M.; Wen, X.; Gao, X.; Liu, Y. Thermal and mechanical properties of ultra-high performance concrete incorporated with microencapsulated phase change material. Constr. Build. Mater. 2021, 273, 121714. [Google Scholar] [CrossRef]
  7. Drissi, S.; Ling, T.-C.; Mo, K.H. Thermal performance of a solar energy storage concrete panel incorporating phase change material aggregates developed for thermal regulation in buildings. Renew. Energy 2020, 160, 817–829. [Google Scholar] [CrossRef]
  8. Krasoń, J.; Mikasik, P.; Lichołai, L.; Dkebska, B.; Starakiewicz, A. Analysis of the thermal characteristics of a composite ceramic product filled with phase change material. Buildings 2019, 9, 217. [Google Scholar] [CrossRef] [Green Version]
  9. Iribarren, V.E.; Palermo, J.L.S.; Castelló, F.J.A.; Maestre, C.R. Energy rehabilitation of buildings through phase change materials and ceramic ventilated façades. Int. J. Energy Prod. Manag. 2019, 4, 332–342. [Google Scholar] [CrossRef] [Green Version]
  10. Al-Yasiri, Q.; Szabó, M. Experimental evaluation of the optimal position of a macroencapsulated phase change material incorporated composite roof under hot climate conditions. Sustain. Energy Technol. Assess. 2021, 45, 101121. [Google Scholar]
  11. Rathore, P.K.S.; Shukla, S.K. An experimental evaluation of thermal behavior of the building envelope using macroencapsulated PCM for energy savings. Renew. Energy 2020, 149, 1300–1313. [Google Scholar] [CrossRef]
  12. Rathore, P.K.S.; Shukla, S.K. Potential of macroencapsulated PCM for thermal energy storage in buildings: A comprehensive review. Constr. Build. Mater. 2019, 225, 723–744. [Google Scholar] [CrossRef]
  13. Zhou, Q.; Liu, P.-F.; Tzeng, C.-T.; Lai, C.-M. Thermal performance of microencapsulated phase change material (mPCM) in roof modules during daily operation. Energies 2018, 11, 679. [Google Scholar] [CrossRef] [Green Version]
  14. Wang, S.M.; Matiašovský, P.; Mihálka, P.; Lai, C.M. Experimental investigation of the daily thermal performance of a mPCM honeycomb wallboard. Energy Build. 2018, 159, 419–425. [Google Scholar] [CrossRef]
  15. Zhao, Y.; Min, X.; Huang, Z.; Liu, Y.; Wu, X.; Fang, M. Honeycomb-like structured biological porous carbon encapsulating PEG: A shape-stable phase change material with enhanced thermal conductivity for thermal energy storage. Energy Build. 2018, 158, 1049–1062. [Google Scholar] [CrossRef]
  16. Lai, C.M.; Hokoi, S. Thermal performance of an aluminum honeycomb wallboard incorporating microencapsulated PCM. Energy Build. 2014, 73, 37–47. [Google Scholar] [CrossRef]
  17. Kosny, J. PCM-Enhanced Building Components An Application of Phase Change Materials in Building Envelopes and Internal Structures, 1st ed.; Springer International Publishing: Geneva, Switzerland, 2015; Volume XV, p. 271. [Google Scholar]
  18. Ikutegbe, C.A.; Farid, M.M. Application of phase change material foam composites in the built environment: A critical review. Renew. Sustain. Energy Rev. 2020, 131, 110008. [Google Scholar] [CrossRef]
  19. Torres-Rodriguez, A.; Morillón-Gálvez, D.; Aldama-Ávalos, D.; Hernández-Gómez, V.H.; Kerdan, I.G. Thermal performance evaluation of a passive building wall with CO2-filled transparent thermal insulation and paraffin-based PCM. Sol. Energy 2020, 205, 1–11. [Google Scholar] [CrossRef]
  20. Mohammadzadeh, A.; Kavgic, M. Multivariable optimization of PCM-enhanced radiant floor of a highly glazed study room in cold climates. Building Simul. 2019, 13, 559–574. [Google Scholar] [CrossRef]
  21. Solgi, E.; Kari, B.M.; Fayaz, R.; Taheri, H. The impact of phase change materials assisted night purge ventilation on the indoor thermal conditions of office buildings in hot-arid climates. Energy Build. 2017, 150, 488–497. [Google Scholar] [CrossRef] [Green Version]
  22. Barzin, R.; Chen, J.J.J.; Young, B.R.; Farid, M.M. Application of PCM energy storage in combination with night ventilation for space cooling. Appl. Energy 2015, 158, 412–421. [Google Scholar] [CrossRef]
  23. Zhu, N.; Wang, S.; Ma, Z.; Sun, Y. Energy Performance and Optimal Control of Air-Conditioned Buildings with Envelopes Enhanced by Phase Change Materials. Energy Convers. Manag. 2011, 52, 3197–3205. [Google Scholar] [CrossRef]
  24. Konstantinidou, C.A.; Lang, W.; Papadopoulos, A.M. Multiobjective Optimization of a Building Envelope with the Use of Phase Change Materials (PCMs) in Mediterranean Climates. Int. J. Energy Res. 2018, 42, 3030–3047. [Google Scholar] [CrossRef]
  25. Bastani, A.; Haghighat, F.; Manzano, C.J. Investigating the effect of control strategy on the shift of energy consumption in a building integrated with PCM wallboard. Energy Procedia 2015, 78, 2280–2285. [Google Scholar] [CrossRef] [Green Version]
  26. Hagenau, M.; Jradi, M. Dynamic modeling and performance evaluation of building envelope enhanced with phase change material under Danish conditions. J. Energy Storage 2020, 30, 101536. [Google Scholar] [CrossRef]
  27. Barzin, R.; Chen, J.J.; Young, B.R.; Farid, M.M. Peak load shifting with energy storage and price-based control system. Energy 2015, 92, 505–514. [Google Scholar] [CrossRef]
  28. Toppi, T.; Mazzarella, L. Gypsum based composite materials with micro-encapsulated PCM: Experimental correlations for thermal properties estimation on the basis of the composition. Energy Build. 2013, 57, 227–236. [Google Scholar] [CrossRef]
  29. Lecompte, T.; Le Bideau, P.; Glouannec, P.; Nortershauser, D.; Le Masson, S. Mechanical and thermo-physical behaviour of concretes and mortars containing phase change material. Energy Build. 2015, 94, 52–60. [Google Scholar] [CrossRef]
  30. Franquet, E.; Gibout, S.; Tittelein, P.; Zalewski, L.; Dumas, J.-P. Experimental and theoretical analysis of a cement mortar containing microencapsulated PCM. Appl. Therm. Eng. 2014, 73, 32–40. [Google Scholar] [CrossRef]
  31. Stanwix, W.; Sparrow, A. The Hempcrete Book: Designing and building with hemp-lime. In Green Books; UK Hempcrete: Matlock, UK, 2014. [Google Scholar]
  32. Pochwala, S.; Makiola, D.; Anweiler, S.; Bohm, M. The Heat Conductivity Properties of Hemp-Lime Composite Material Used in Single-Family Buildings. Materials 2020, 13, 1011. [Google Scholar] [CrossRef] [Green Version]
  33. Collet, F.; Pretot, S. Thermal conductivity of hemp concretes: Variation with formulation, density and water content. Constr. Build. Mater. 2014, 65, 612–619. [Google Scholar] [CrossRef] [Green Version]
  34. Walker, R.; Pavía, S. Moisture transfer and thermal properties of hemp–lime concretes. Constr. Build. Mater. 2014, 64, 270–276. [Google Scholar] [CrossRef]
  35. Evrard, A.; Herde, A.D. Bioclimatic envelopes made of lime and hemp concrete. In Proceedings of the CISBAT2005 Conference—Renewables in a Changing Climate—Innovation in Building Envelopes and Environmental Systems, Lausanne, Switzerland, 28–29 September 2005. [Google Scholar]
  36. Evrard, A. Transient hygrothermal behavior of Lime-Hemp Materials. Ph.D. Thesis, Universite Catholique De Louvain, Ottignies-Louvain-la-Neuve, Belgium, 2008. [Google Scholar]
  37. Abdellatef, Y.; Khan, M.A.; Khan, A.; Alam, M.I.; Kavgic, M. Mechanical, Thermal, and Moisture Buffering Properties of Novel Insulating Hemp-Lime Composite Building Materials. Materials 2020, 13, 5000. [Google Scholar] [CrossRef]
  38. Yates, T. Final Report on the Construction of the Hemp House at Haverhill, Suffolk; Building Research Establishment: Watford, UK, 2002. [Google Scholar]
  39. Magwood, C. Essential Hempcrete Construction: The Complete Step-by-Step Guide; New Society Publishers: Gabriola Island, BC, Canada, 2016. [Google Scholar]
  40. Abdellatef, Y.; Kavgic, M. Thermal, microstructural and numerical analysis of hempcrete-microencapsulated phase change material composites. Appl. Therm. Eng. 2020, 178, 115520. [Google Scholar] [CrossRef]
  41. Abdellatef, Y.; Kavgic, M.; Foruzanmehr, R. Thermal and moisture buffering properties of novel hemp-lime composites integrated with microencapsulated phase change materials. In Proceedings of the 4th International Conference on Bio-based Building Materials, Barcelona, Spain, 16–18 June 2021. [Google Scholar]
  42. Navarro, L.; de Gracia, A.; Niall, D.; Castell, A.; Browne, M.; McCormack, S.J.; Griffiths, P.; Cabeza, L.F. Thermal energy storage in building integrated thermal systems: A review. Part 2. Integration as passive system. Renew. Energy 2016, 85, 1334–1356. [Google Scholar] [CrossRef] [Green Version]
  43. Microtek Laboratories Inc. MPCM Technical Information. Available online: https://www.microteklabs.com/ (accessed on 26 August 2021).
  44. WUFI® Software, 2019. Available online: www.wufi.com (accessed on 26 August 2021).
  45. Bird, R.B.; Stewart, W.E.; Lightfoot, E.N. Transport Phenomena; John Wiley and Sons: Hoboken, NJ, USA, 1960; ISBN 978-0-471-07392-5. [Google Scholar]
  46. U.S. Department of Energy. Weather Data Sources 2019. Available online: https://energyplus.net/weather (accessed on 26 August 2021).
  47. Liu, Y.; Harris, D.J. Measurements of wind speed and convective coefficient on the external surface of a low-rise building. Int. J. Ambient. Energy 2015, 36, 225–234. [Google Scholar] [CrossRef]
  48. Awbi, H.B.; Hatton, A. Natural convection from heated room surfaces. Energy Build. 1999, 30, 233–244. [Google Scholar] [CrossRef]
  49. Klimeš, L.; Charvát, P.; Mastani Joybari, M.; Zálešák, M.; Haghighat, F.; Panchabikesan, K.; El Mankibi, M.; Yuan, Y. Computer modelling and experimental investigation of phase change hysteresis of PCMs: The state-of-the-art review. Appl. Energy 2020, 263, 114572. [Google Scholar] [CrossRef]
  50. Delcroix, B.; Kummert, M.; Daoud, A. Thermal Behavior Mapping of a Phase Change Material Between the Heating and Cooling Enthalpy-temperature Curves. Energy Procedia 2015, 78, 225–230. [Google Scholar] [CrossRef] [Green Version]
  51. Pelland, S.; McKenney, D.W.; Poissant, Y.; Morris, R.; Lawrence, K.; Campbell, K.; Papadopol, P. The development of photovoltaic resource maps for Canada. In Proceedings of the 31st Annual Conference of the Solar Energy Society of Canada (SESCI), Montréal, QC, Canada, 20–24 August 2006. [Google Scholar]
  52. Meng, E.; Cai, R.; Sun, Z.; Yang, J.; Wang, J. Experimental study of the passive and active performance of real-scale composite PCM room in winter. Appl. Therm. Eng. 2021, 185, 116418. [Google Scholar] [CrossRef]
  53. Al-janabi, A.; Kavgic, M. Application and sensitivity analysis of the phase change material hysteresis method in EnergyPlus: A case study. Appl. Therm. Eng. 2019, 162, 114222. [Google Scholar] [CrossRef]
  54. Singh, R.; Sadeghi, S.; Shabani, B. Thermal Conductivity Enhancement of Phase Change Materials for Low-Temperature Thermal Energy Storage Applications. Energies 2019, 12, 75. [Google Scholar] [CrossRef] [Green Version]
Figure 1. Wall geometry and design configurations, where HPCM is the layer with thickness L.
Energies 14 05343 g001
Figure 2. Heating and cooling control strategy (Thsb and Tcsb are heating and cooling setpoint temperatures that depend on the schedule).
Energies 14 05343 g002
Figure 3. Heating and cooling schedules.
Energies 14 05343 g003
Figure 4. Illustration for hysteresis model in incomplete phase change process: (a) transition from melting to freezing, (b) transition from freezing to melting.
Energies 14 05343 g004
Figure 5. Validation of hysteresis model with [50]: (a) interrupted melting, (b) interrupted freezing.
Energies 14 05343 g005
Figure 6. Interior surface temperatures of wall types during (a) coldest and (b) warmest weeks.
Energies 14 05343 g006
Figure 7. The number of phase change hours of HPCM10, 20, and 30.
Energies 14 05343 g007
Figure 8. Average monthly heating and cooling energy consumption under BC, SCH1, and SCH2.
Energies 14 05343 g008
Figure 9. Average hourly heating energy consumption under BC, SCH1, and SCH2.
Energies 14 05343 g009
Figure 10. Average hourly interior surface temperatures under BC, SCH1, and SCH2.
Energies 14 05343 g010
Figure 11. (a) Hourly heating energy consumption under SCH2 along with (b) solar radiation and outdoor air temperatures from January 12th to 15th.
Energies 14 05343 g011
Figure 12. Average monthly heating and cooling energy consumption under BC, SCH3, and SCH4.
Energies 14 05343 g012
Figure 13. Average monthly heating and cooling energy consumption under BC, SCH3, and SCH4.
Energies 14 05343 g013
Figure 14. Average hourly heating energy consumption of HPCM10 wall under four schedules.
Energies 14 05343 g014
Figure 15. The number of phase change hours of the HPVM10 wall under different temperature control strategies.
Energies 14 05343 g015
Figure 16. Distribution of interior surface temperatures of hempcrete (HC) and HPCM10 under five schedules.
Energies 14 05343 g016
Table 1. Thickness and thermophysical properties of the simulated materials [40,44].
Common Building MaterialsInfill Design Types
MaterialGypsumCement lime plasterHempcreteHPCM
Thickness (cm)21.53010, 20, 30 cm
Density (kg/m3)6751900318327
Conductivity [W/(m K)]0.2020.8030.1030.094
Specific heat [J/(kg K)]8508501500Sensible = 1800
Maximum * = 5500
Thermal diffusivity (m2/s)3.521 × 10−74.972 × 10−72.159 × 10⁻⁷Sensible =
1.594 × 10⁻⁷
Maximum * = 5.215 × 10⁻⁸
Note: * the highest specific heat capacity in the melted state.
Table 2. Annual energy consumption and percentage savings under BC schedule.
Wall TypeConsumption (W h/m2)Percentage Savings (%)
HeatingCoolingHeating Cooling
Hempcrete36,9751017--
HPCM1035,85093838
HPCM2034,901827619
HPCM3034,240806721
Table 3. Descriptive statistics of assemblies’ interior surface temperatures.
Wall Type Mean (°C)Standard
Deviation
Minimum (°C)Maximum (°C)
Hempcrete19.432.1615.8724.86
HPCM1019.462.1216.0024.75
HPCM2019.492.0916.1024.65
HPCM3019.512.0716.1924.55
Table 4. Annual energy consumption under BC, SCH1, and SCH2.
ConsumptionBase CaseSchedule 1Schedule 2
(W h/m2)HempcreteHPCM10HempcreteHPCM10HempcreteHPCM10
Heating36,97535,85035,34434,36234,21633,045
Cooling 1017938853802857803
Table 5. Annual energy consumption under BC, SCH3, and SCH4.
ConsumptionBase CaseSchedule 3Schedule 4
(W h/m2)HempcreteHPCM10HempcreteHPCM10HempcreteHPCM10
Heating36,97535,85032,75331,83529,02428,123
Cooling 1017938464422458433
Publisher’s Note: MDPI stays neutral with regard to jurisdictional claims in published maps and institutional affiliations.

