1. Introduction
Research on the use of solar radiation energy for heating buildings has been conducted with varying intensity for several dozen years in many countries around the world. They have gone through various stages of development related to the search for optimal design and material solutions. One of the analyzed passive solutions using solar radiation energy are collector–storage walls, also called Trombe walls [
1,
2,
3]. The two basic structural elements of this barrier (understood as the entire composite wall), the collector and the thermal storage layer, are subject to continuous evaluation and research in search of more effective solutions [
2,
4]. In the configuration structures of Trombe walls, there are ventilated and non-ventilated solutions. The ventilated wall allows air circulation between the space between the glazing and the absorber and the air in the adjacent room. In unventilated walls, heat transfer occurs mainly through conduction. Trombe walls can be tested using various methods: using experimental and simulation methods. In experimental studies, the value of solar radiation can be determined on the basis of measurements of real climatic conditions, or laboratory tests can be made using solar simulators [
5].
Along with the modification of the Trombe wall, the phenomena of heat exchange occurring between the individual layers are also analyzed. The article [
6] focuses on the analysis of air velocity through the Trombe wall. Also in article [
7], in addition to the air flow rate and air temperatures, the heat flux, the conductive heat transfer, and the exergy gain through the massive wall were numerically determined. Numerical simulation for the above tests was carried out for three configurations of a modified Trombe–Michel wall. In the article [
8], a simplified analytical model of a Trombe wall was prepared. The heat transfer and airflow process in the modified Trombe wall was determined with a mathematical and numerical model and combined with experimental validation.
The collector–storage barriers equipped with external shutters are also analyzed. The aim of the research in the article [
9] was to analyze the heat flow through the Trombe wall with shutters inclined at different angles. At the same time, the Trombe wall, equipped with an external shutter, was placed in a skeleton steel structure [
10]. Tests of its energy efficiency were carried out in real climatic conditions.
Apart from the analysis of the Trombe wall and its components, environmental effects of the life cycle of the solar barrier at the stage of its construction and operation are also taken into account [
11].
The conducted research relates to various climatic zones that have a significant impact on the operation of collector–storage walls. In the article [
12], research was carried out in Tunisia under real climatic conditions. The aim of the research was to determine the influence of various heat transfer coefficients on the operation of the ventilated Trombe wall. The results showed that the radiation exchange is higher than the convection exchange in the air-gap. The paper [
13] presents the economic, thermal, and environmental impacts of the Trombe wall in buildings located in the Mediterranean region. In the same region, a non-ventilated collector–storage wall with internal thermal fins has been proposed in order to increase the rate of heat transfer through this wall [
14]. While in the article [
3], the Trombe wall was used as one of the three passive solutions used to reduce the demand for heating and cooling energy in Sweden.
A significant problem in the functioning of the Trombe walls is their overheating in the period of high temperatures. The authors of the article [
15] proposed the use of additional shading and cross-ventilation, which had a positive effect on lowering the temperature on the inner surface of the wall and improving the thermal comfort in the inner room. While in the article [
16], a system using a water tank for use in both winter and summer was proposed.
The components of collector-storage walls should be closely linked to each other through mutual interaction. In the case of the masonry layer, materials are sought that should be characterized by high accumulation so that they can store as much heat energy as possible from solar radiation [
17,
18]. Traditional masonry materials have specific heat, which cannot store the excess heat energy from solar radiation. The introduction of a phase change material as an additional thermal storage layer is one of the solutions that will increase the possibility of obtaining thermal energy from solar radiation. In the research conducted with regard to the use of phase change material, solutions are sought that enable the most effective use of this material in modified Trombe walls [
19,
20]. In these tests, the influence of a PCM layer is analyzed, depending on its location in the barrier [
21].
In articles [
22,
23], the PCM layer was placed between the glazing and the masonry layer. Thanks to this solution, there was an improvement in thermal comfort in the room adjacent to the barrier. In articles [
24,
25], the layer of phase change material was placed on the inside of the barrier, behind the masonry wall. Additionally, in article [
24], an insulation layer was placed between two PCM layers. A PCM layer with a higher melting point, placed between the masonry layer and the insulation, limited the heat transfer to the room in the summer. On the other hand, a layer of PCM with a lower melting point, located on the inside, improved the thermal comfort in the room in winter.
At the same time, tests of collector-storage walls have been carried out, where the phase change material is integrated into the structure of the masonry layer. In article [
26], the masonry layer, usually made of solid elements, was replaced with ceramic blocks partially filled with phase change material. These studies were carried out in natural climatic conditions during a transitional period. The introduction of phase change material into the masonry elements significantly reduced temperature fluctuations on the inner surface of the tested barrier. In articles [
27,
28], phase change material in the form of microcapsules was incorporated into the structure of the cement mortar layer. Additionally, behind the accumulation layer and the air gap layer, an insulating layer with ventilation openings was placed. The Trombe composite wall was compared to a Trombe solar wall, in which the storage layer was made of a concrete layer, and a reference barrier.
The analysis showed that regardless of the type of solar barrier, the demand for heating energy decreased by about 20–30%, depending on the climatic zone. On the other hand, the incorporation of PCM into the mortar has a rather weak impact on the demand for heating energy; however, the demand for thermal energy is closely reflected in the construction of a concrete storage wall [
27]. In the case of a phase change material, its parameters play an important role. The higher the latent heat of the PCM, the lower the demand for thermal energy and, at the same time, the better the thermal comfort in the room [
28].
In article [
29], the masonry layer was completely replaced with a PCM layer. The research was carried out in laboratory conditions. The properties of the phase change material were analyzed for the occurrence of temperatures at different heights in the PCM layer. The authors found that during the heating of the PCM layer, significant temperature differences occur at different heights of the barrier. In articles [
30,
31,
32], the masonry wall was also replaced with a PCM layer and, additionally, an additional insulating panel was placed on the inside. In article [
33], a phase change material was placed in glass bricks. The space between the external glazing and the wall was filled with a layer of granular silica aerogel. Experimental studies were conducted for the winter and summer seasons. In winter, the modified barrier met the expected requirements; however, during the summer, there was a problem of the room overheating. The use of “Prisma solar glass” instead of the usual glazing solved the problem of overheating in summer.
The glazing layer plays an important role in the transfer of thermal energy from solar radiation in Trombe walls. The parameters of this layer also affect the efficiency of the PCM layer located in the barrier [
34]. In article [
35], the authors presented experimental studies of three models of a Trombe wall with the use of two types of glazing and a PV panel, determining their effectiveness during the research.
In temperate climate conditions, the collector (glazing) should be characterized by a high value of total solar energy transmittance factor (g) and low value of heat transfer coefficient (Ug). On the other hand, the accumulation layer should have a high heat capacity in order to be able to store as much heat energy as possible. At the same time, in the cooling phase of the barrier, low heat losses and good heat conduction are expected, i.e., transfer of as much heat energy to the interior of the room as possible. Obtaining the best solution with the use of the above parameters requires the selection of appropriate types of materials, which is not easy to achieve. Some physical parameters of the glazing and the storage material are in mutual opposition. In attempting to achieve high transmittance of the total solar energy, the thermal insulation of the glazing layer is reduced. If the glazing layer is highly insulated, the total solar energy transmittance decreases.
Comparative studies of the impact of various glass systems in reducing solar gains in summer and heat losses in winter were carried out in test chambers in Košice. Spectrally selective films were used in shaft systems. The obtained value of the heat transfer coefficient (Ug) is close to the value of the external wall, but the possibility of obtaining thermal energy from solar radiation during winter days has been limited [
36].
In most articles, the glazing that appears in the collector-storage barrier is not the basis for analysis aimed at combining the two parameters: of insulation and total solar energy transmittance.
In this article, tests of a collector-storage barrier modified with a phase change material were carried out in order to determine the appropriate glazing, which will enable the development of the best solution ensuring effective cooperation of the glazing with the thermal storage layer.
2. Materials and Methods
2.1. Research Method
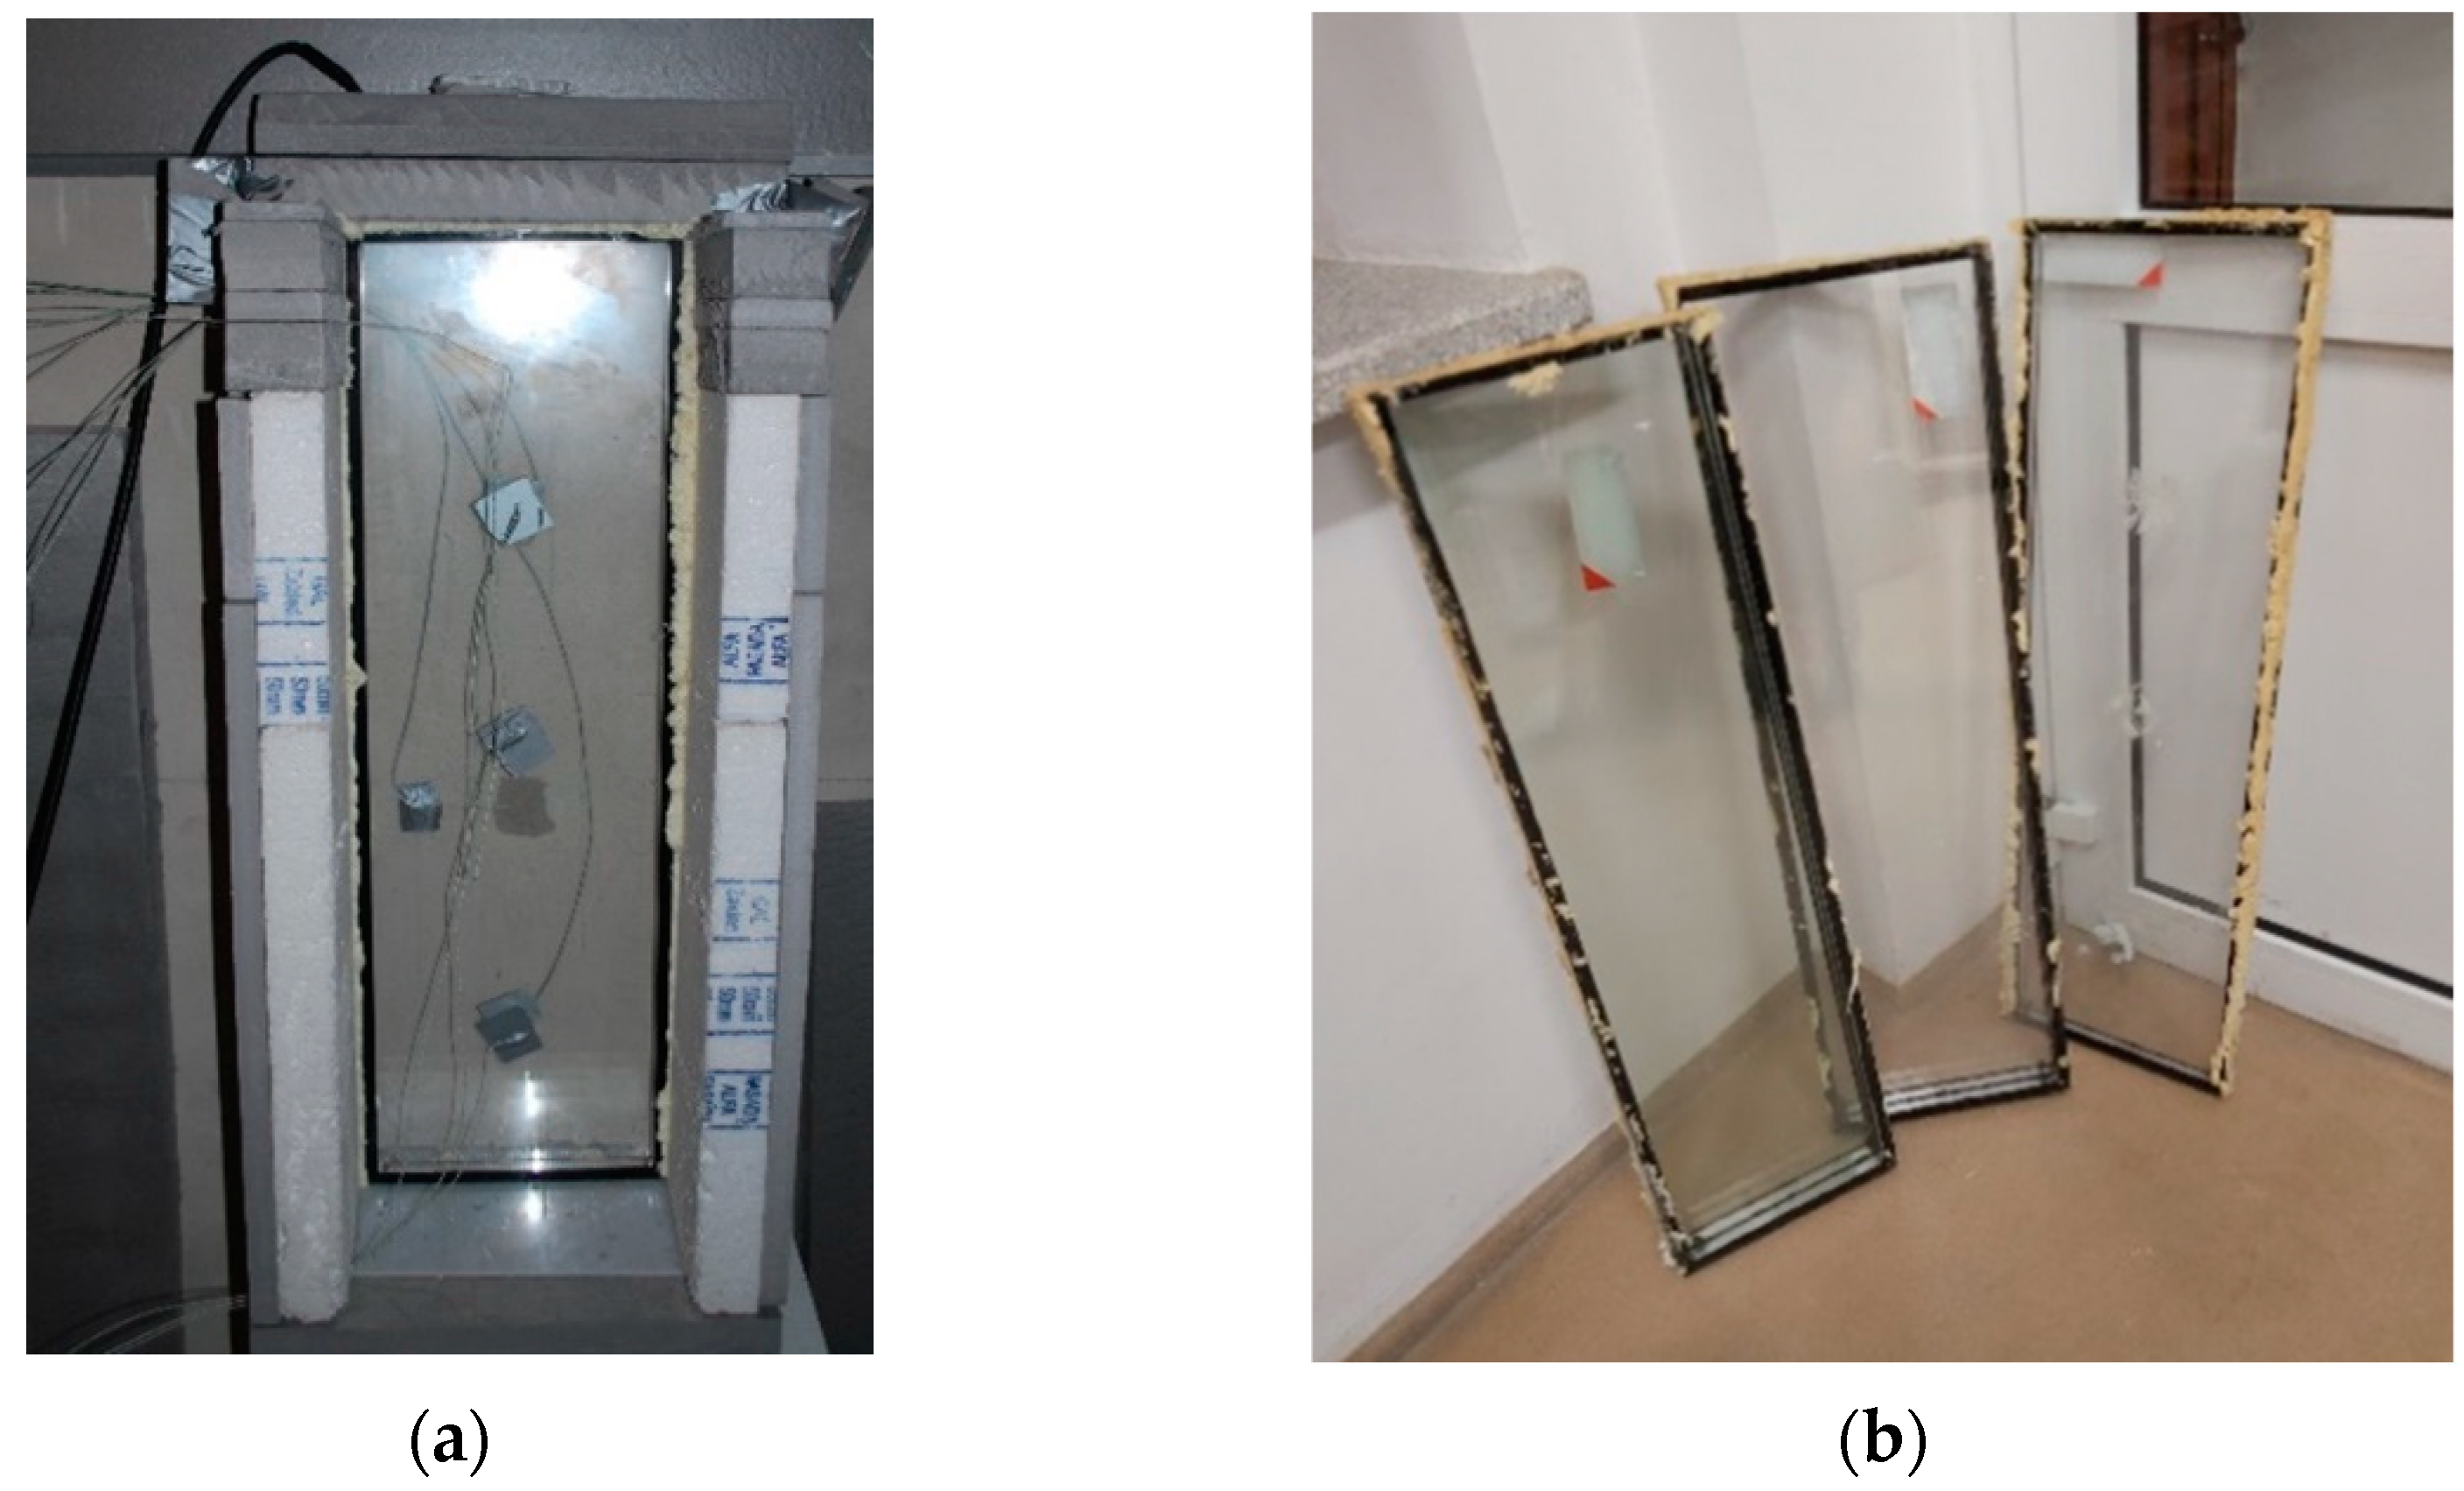
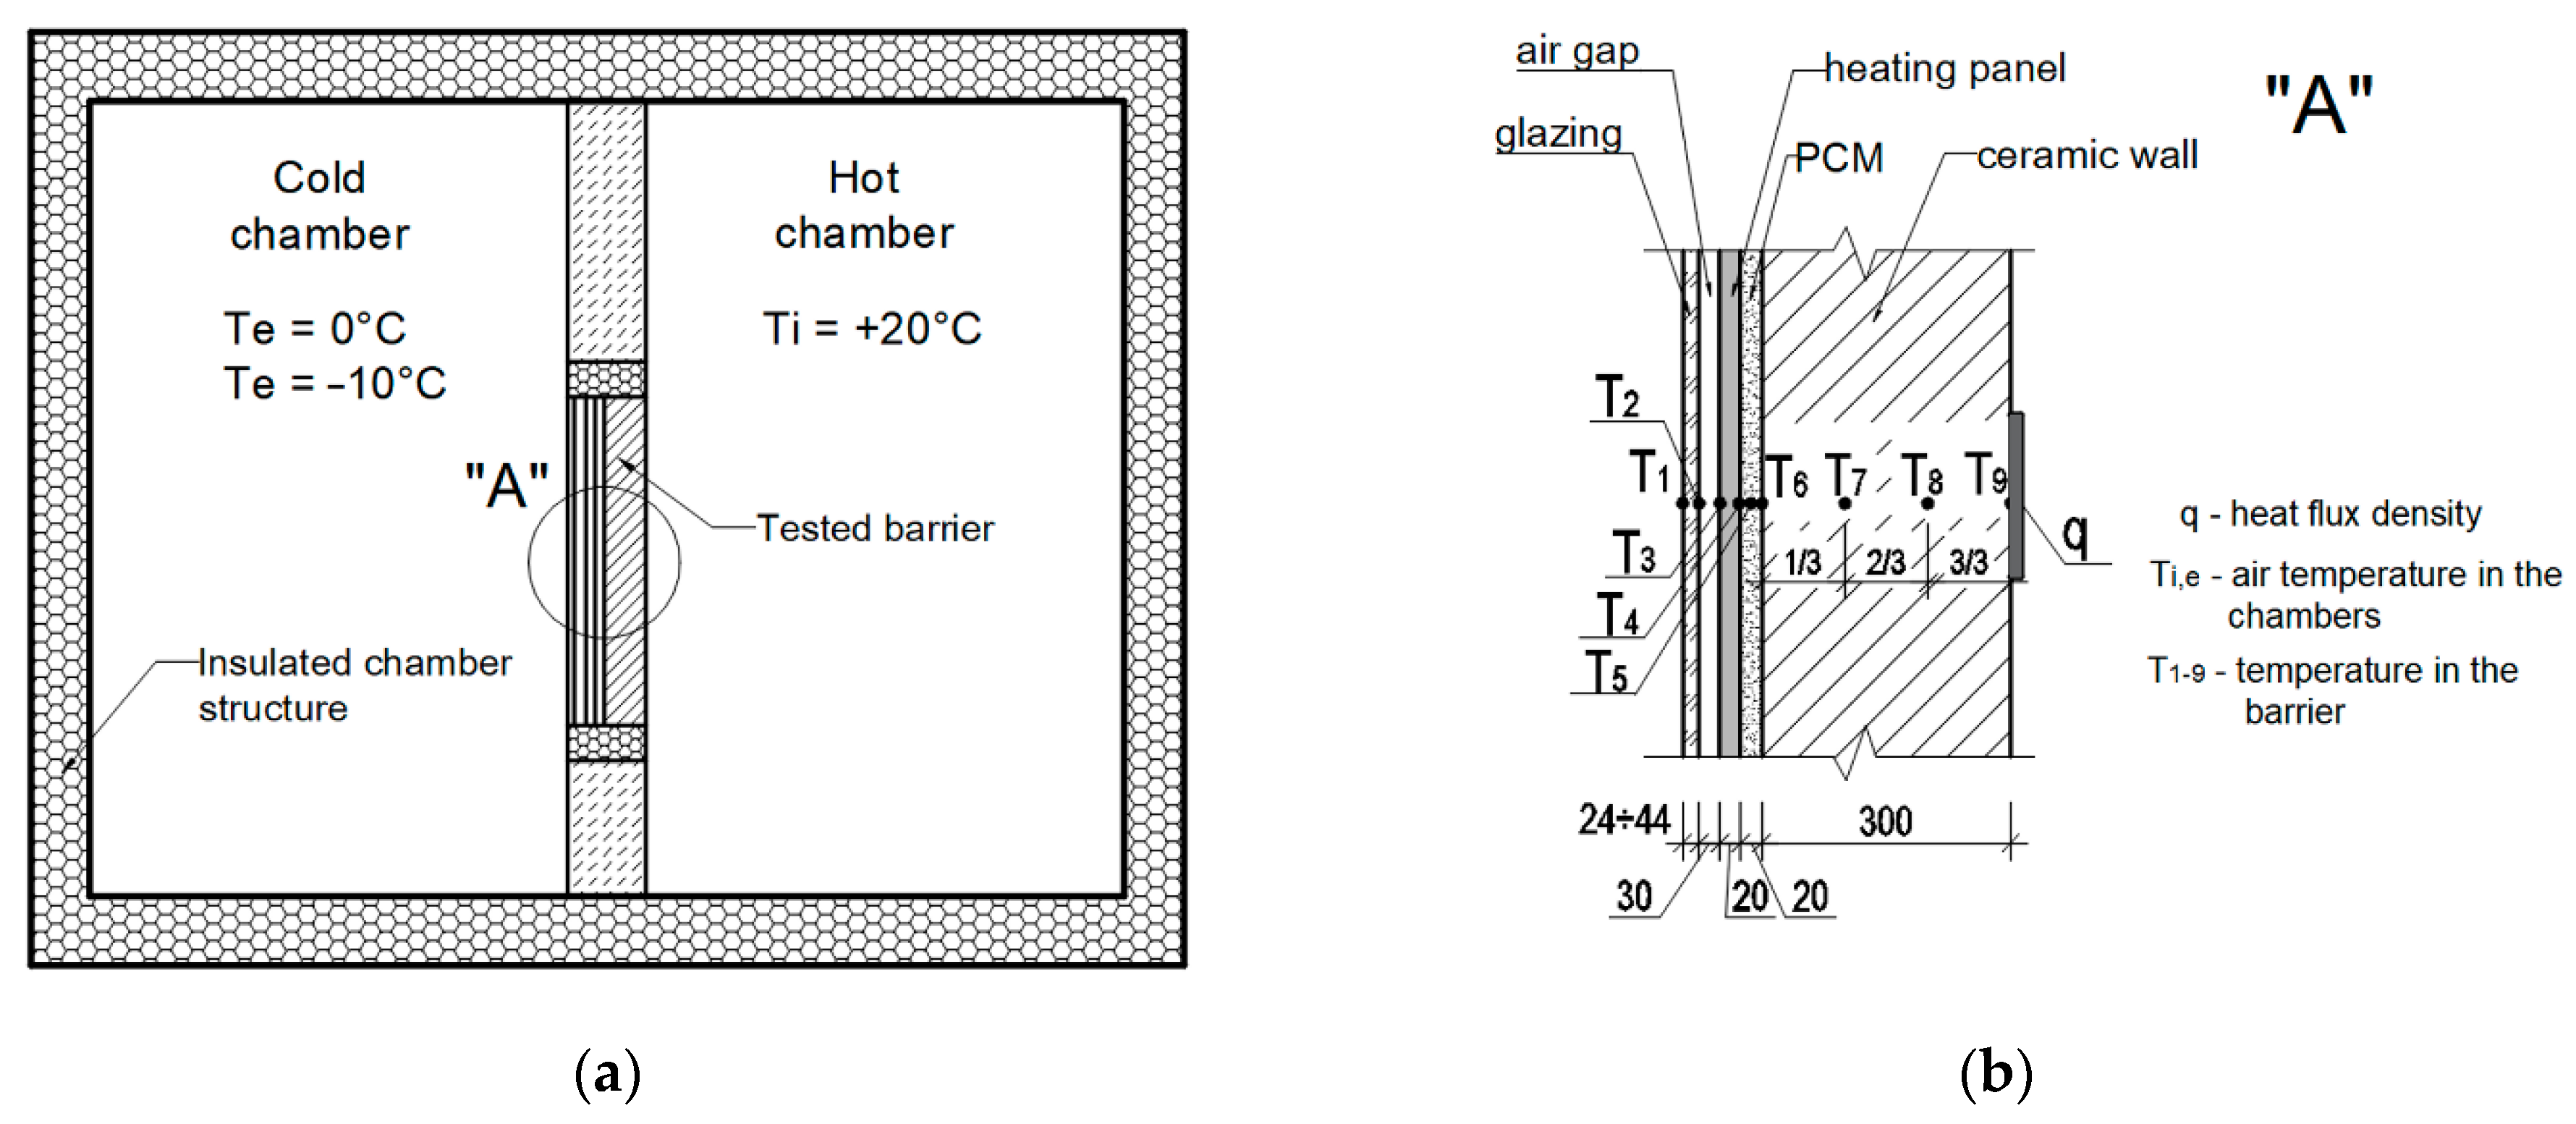
The studies were carried out on a small scale under laboratory conditions. The analyzed barriers were placed in a simulation chamber located in the laboratory. The chamber is divided into two test parts, one of which simulates the outside air temperature: 0 °C and −10 °C (cold chamber), and the other part stabilizes the temperature of the internal air set for a utility room in a building: 20 °C (warm chamber). The analyzed collector-storage barriers modified with a phase change material were introduced between the two test chambers. From the side of the cold chamber, during the tests, apart from the imposed outside air temperature, the thermal energy of absorbed solar radiation was simulated with the use of a heating panel. A general view of the tested barrier together with the set of glazing used for the tests is shown in
Figure 1.
The research was carried out for three variants of barriers. The variable element in the barrier was glazing (G1, G2, G3), which differed in two thermophysical parameters: heat transfer coefficient (Ug) and total solar energy transmittance factor (g). In the tests, glazing with high transmissivity values was used, where the value of the absorption and reflection coefficient is small. The analyzed barriers were marked with the relevant glazing symbol:
- -
B1-barrier with G1 glazing,
- -
B2-barrier with G2 glazing,
- -
B3-barrier with G3 glazing.
The aim of the study was to determine the effect of particular glazing on the thermal functioning of a Trombe wall, modified with a phase change material, after a period of heating with a heating panel simulating the thermal energy of solar radiation.
The intensity of total solar radiation on the vertical surface was assumed to be about 590 W/m2. This value was adopted as the maximum daily average for the entire heating season (October to April), based on data obtained from a typical meteorological year for the Rzeszów-Jasionka meteorological station in Poland (latitude: 50°2′ N, longitude: 22°1′ E). This value was adopted in order to determine the maximum effect of thermal energy obtained from solar radiation.
In experimental studies, the value of the energy delivered on the absorber surface results from the type of glazing used. For a given type of glazing, the value of the absorber surface load results from the value of solar radiation (590 W/m2), multiplied by the value of total solar energy transmittance factor g for a given glazing and the absorber absorption coefficient equal to 0.95. By multiplying the value of the assumed load by the time of 6 h, we obtain the energy supplied to the tested system. The reduced value above was simulated by a heating panel placed between the glazing and the layer of phase change material.
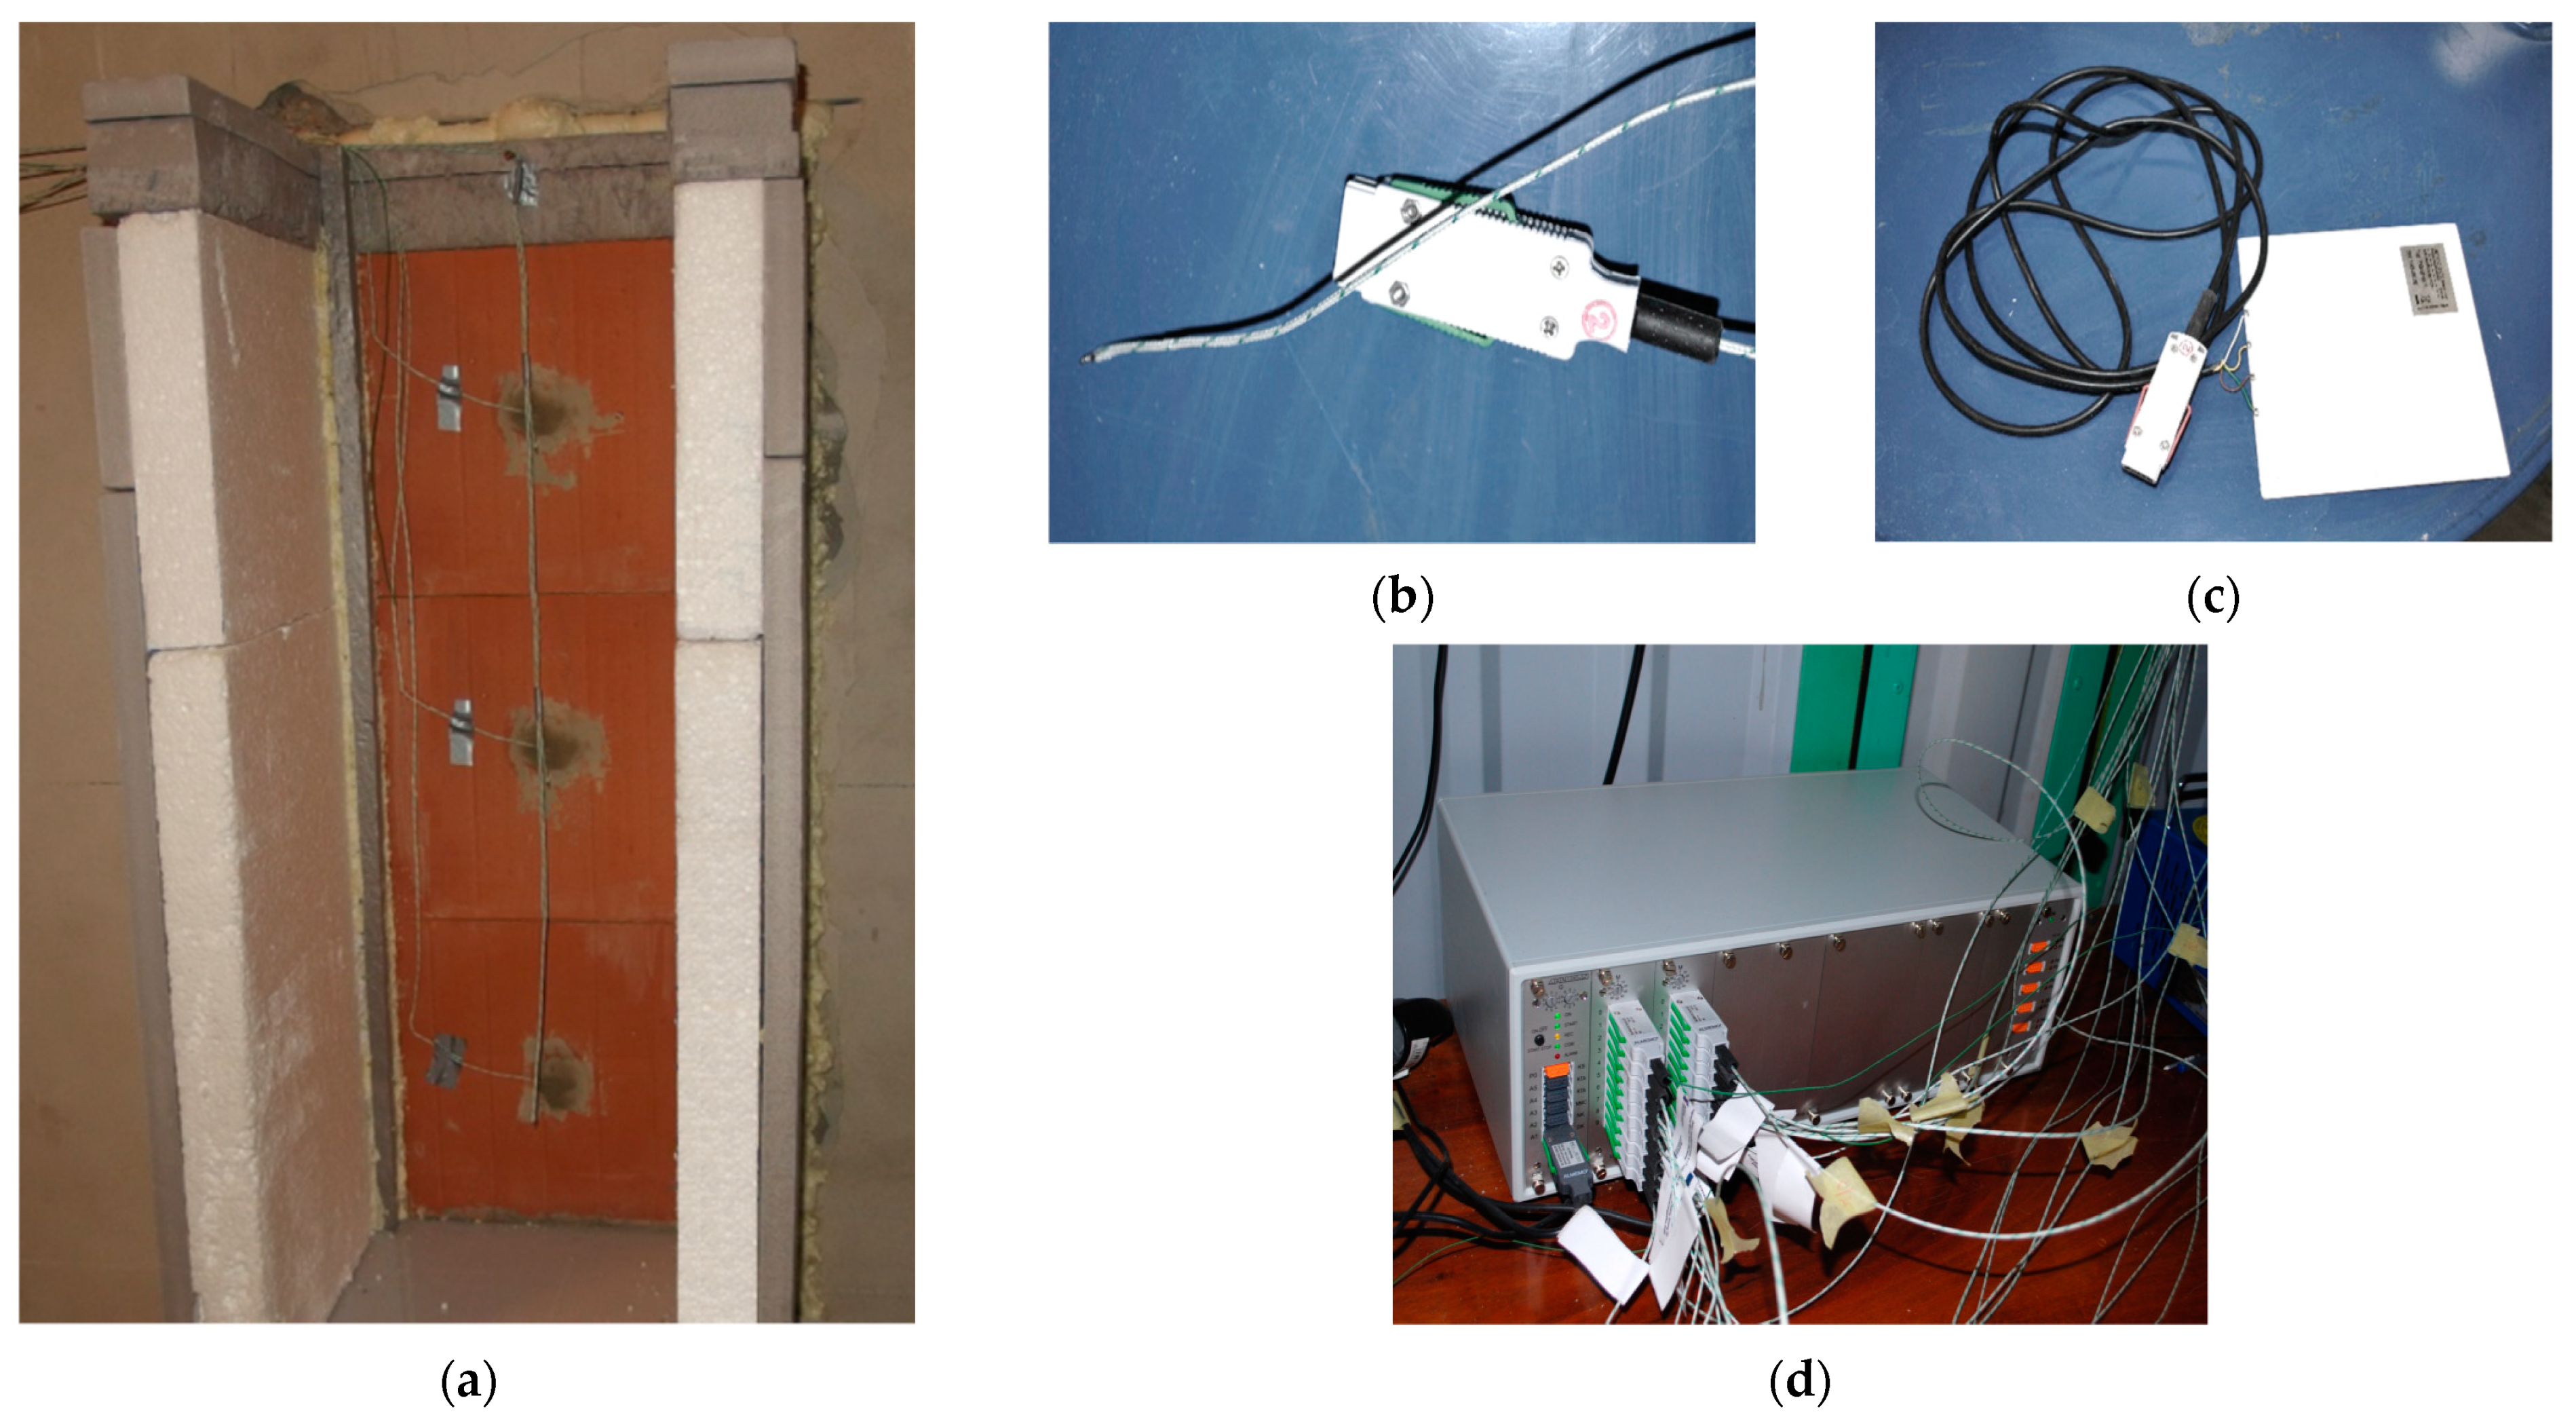
The temperature distribution in the barrier was determined with the use of temperature sensors located in the collector-storage wall (
Figure 2a,b). On the side of the warm chamber, heat flux sensors were installed on the surface of the ceramic wall (
Figure 2c). The sensors were connected to a recorder (
Figure 2d), which was in turn connected to a computer. The accuracy of the temperature sensors was ±0.2° K, and the accuracy of the heat flux sensors was ±5%.
Each barrier was stabilized before the heating process was started (constant temperature distribution in the barrier). Then, for six hours, each variant of the barrier was subjected to heating with the value of thermal energy resulting from the average daily sum of solar radiation (taking into account the glazing parameters). After the heating process was completed, the temperature values in each barrier were recorded until the values recorded before the heating process were obtained. The tests were performed for one heating cycle (one sunny day), followed by a few days of cooling the barrier (cloudy days).
2.2. Characteristics of the Tested Barriers
Fixed elements for three variants were installed in the collector-storage barrier: a wall consisting of porous hollow ceramic blocks with dimensions: (length × width × height) 248 mm × 300 mm × 249 mm and a layer of RT25HC phase change material with high heat capacity, placed in an aluminum container of thickness 20 mm (
Figure 3). The PCM layer was located behind the masonry layer on the side of the cold chamber. In order to limit the influence of boundary conditions on the thermal dynamics of the wall, during the experimental tests, the circumferential insulation of the tested wall was made of extruded polystyrene.
The physical properties of the above materials are presented in
Table 1. The parameters of the analyzed materials were obtained on the basis of the manufacturers’ technical data [
37,
38].
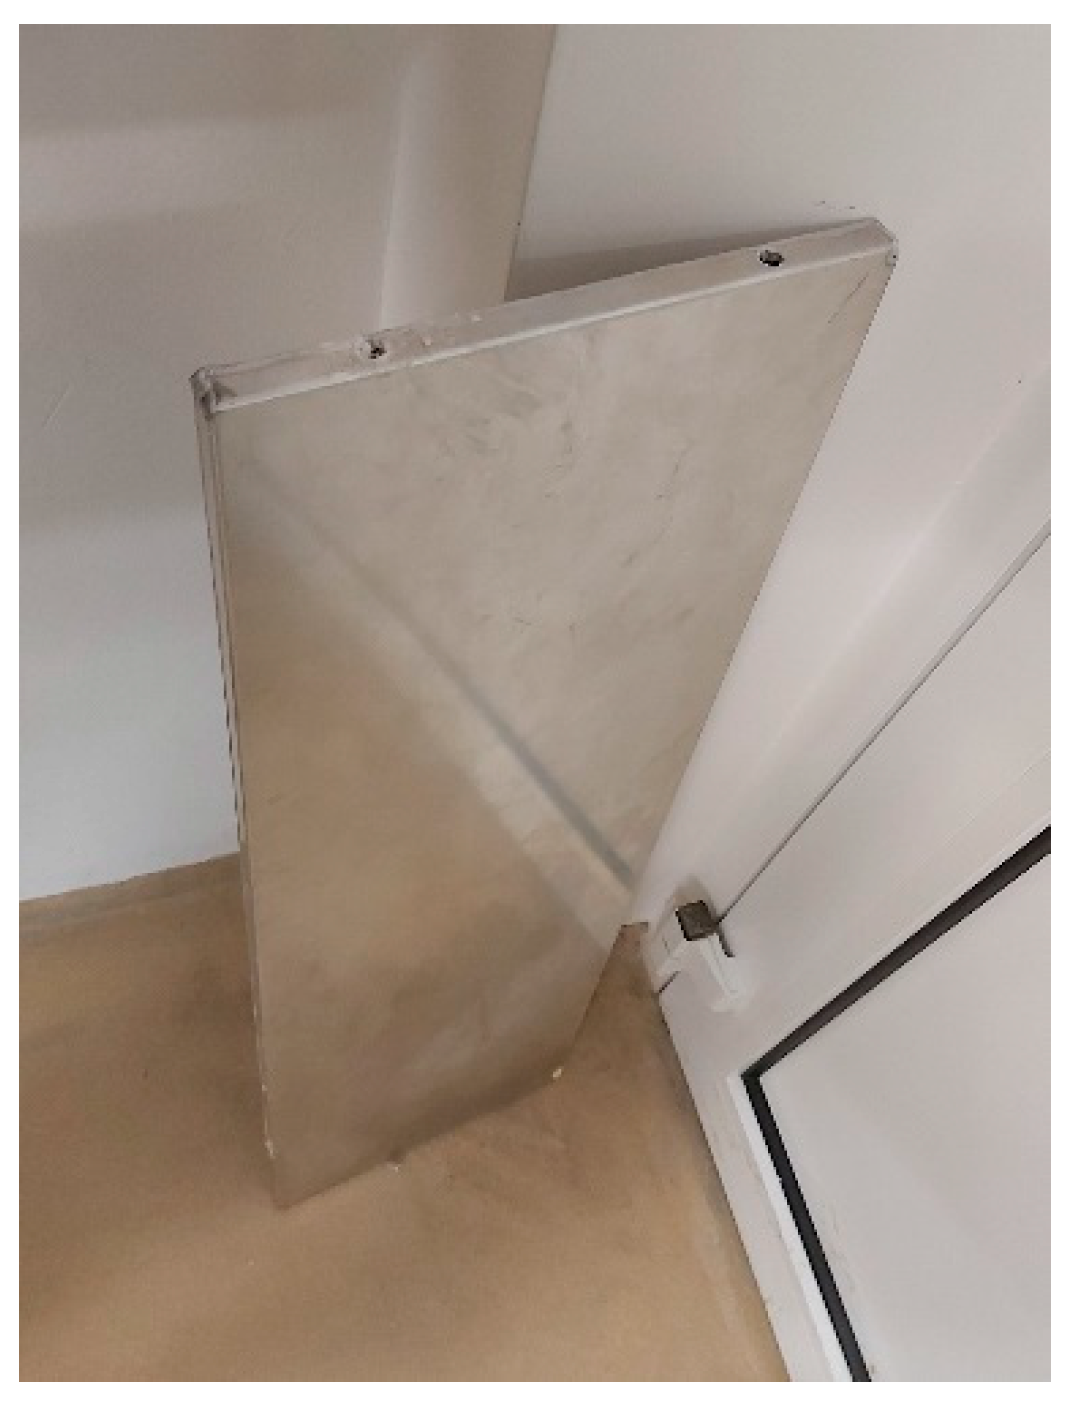
The glazing layer was a variable in the barriers tested. It was placed in front of the layer of the phase change material on the side of the cold chamber (
Figure 4). The thickness of the whole barrier under analysis, depending on the glazing variant adopted, was 384, 420, or 424 mm. A diagram of the chamber and the barrier along with the location of the temperature sensors (Tj) and heat flux sensors (q) is shown in
Figure 4. The presented set of sensors was placed at three height levels of the barrier being tested.
The parameters of the glazing used in the tests are presented in
Table 2. The glazing parameters were obtained from the manufacturer [
39] upon delivery of the glazing.
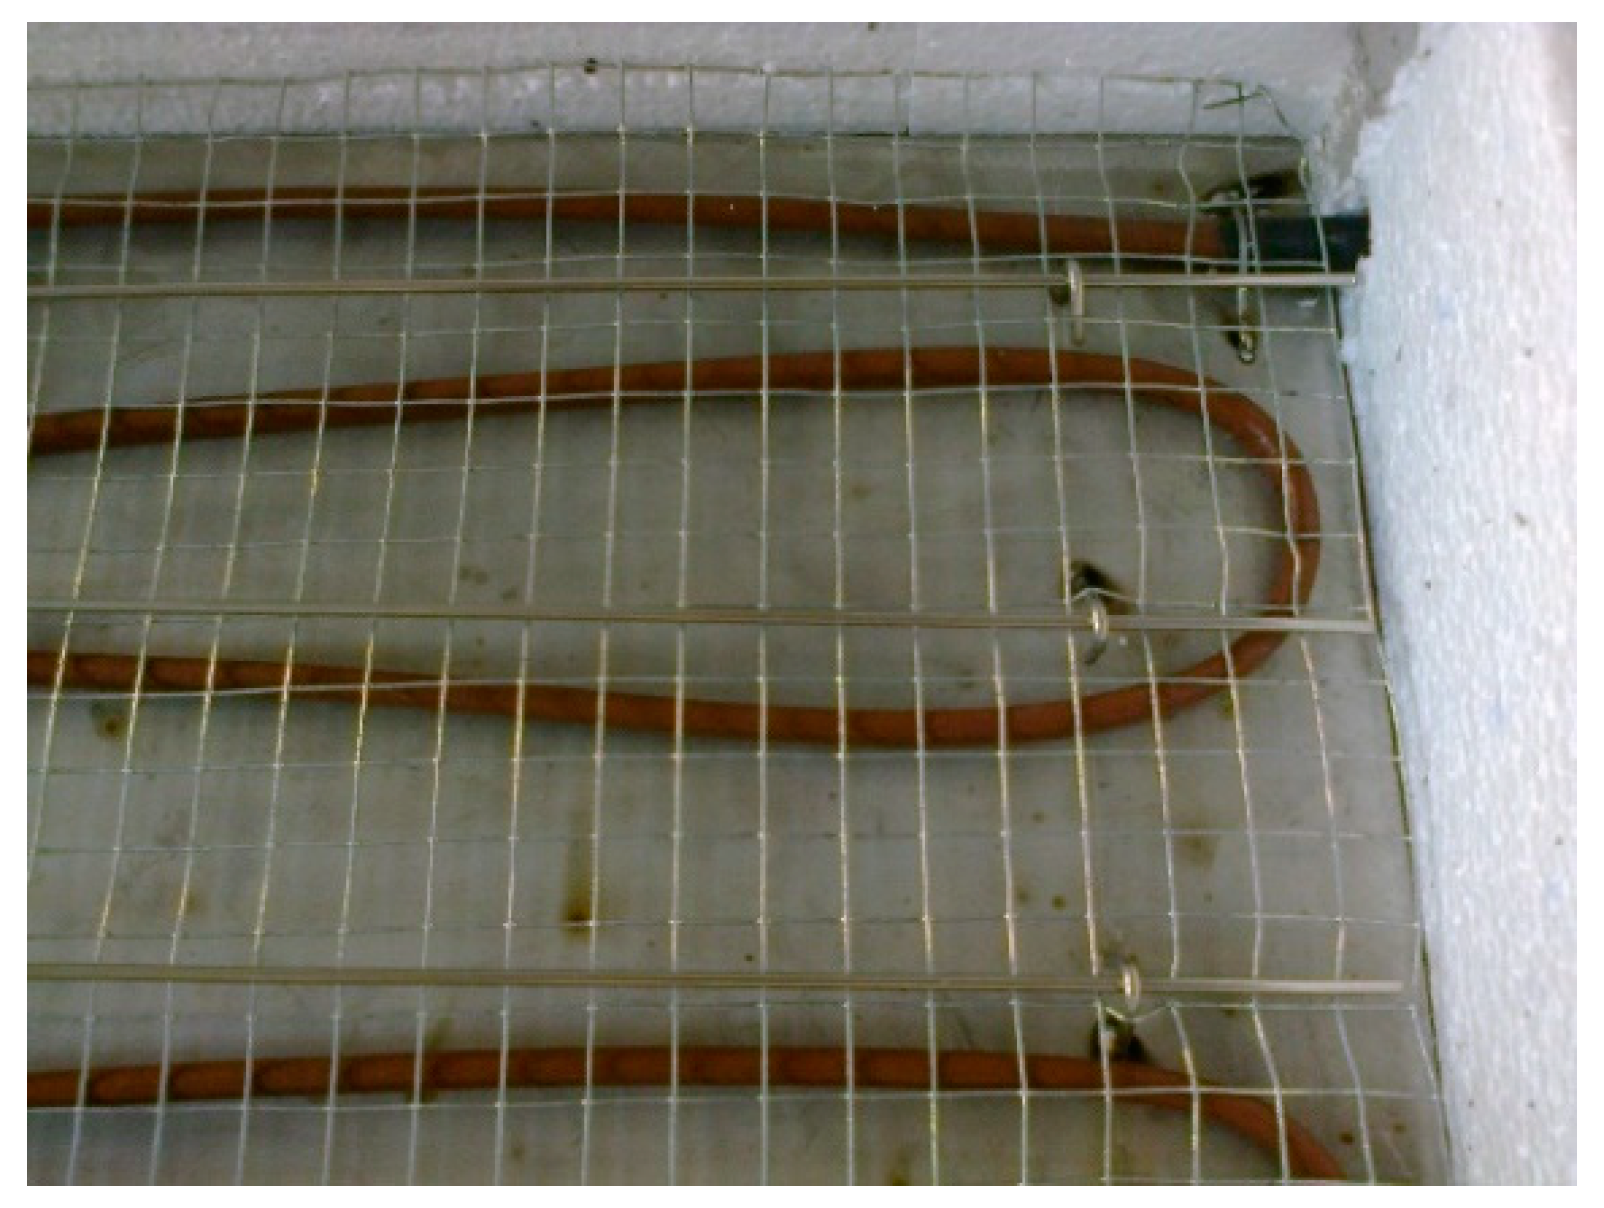
A heating panel was placed between the PCM layer and the glazing to simulate the total solar radiation. The panel consists of a heating cable placed in a layer of cement mortar. To evenly distribute the heat energy from the heating cable, a steel sheet was attached to the panel surface (
Figure 5). The thickness of the heating panel is 20 mm and is similar to the classic cement—lime plaster. As for the thickness and inertia of the heating panel—the impact of the panel was comparable for all analyzed variants and did not significantly affect the comparative assessment of individual variants. In the barrier, the panel was placed directly in front of the PCM layer. In order to eliminate a small air gap between both layers, a thin layer of cement mortar was introduced.
2.3. The Performance Indicators
The change in the value of the heat flux after 24 h (∆q
(n)) is expressed by the difference between its values at the end and the beginning of the
nth day according to the formula:
The thermal efficiency of the barrier can be expressed by the increase in the average daily value of the heat flux on the nth day (∆q
average(n)) in relation to its initial value on the nth day (q
start(n)), as the difference of heat flux according to the formula:
The amplitude of the heat flux is calculated from the formula:
By expressing the average daily value of the heat flux in the following days as a percentage of the initial value (Formula (4)), we obtain a picture of the impact of the glazing on the dynamics of changing the average daily values (DCV) of the heat flux in the following days.
2.4. Computer Simulation
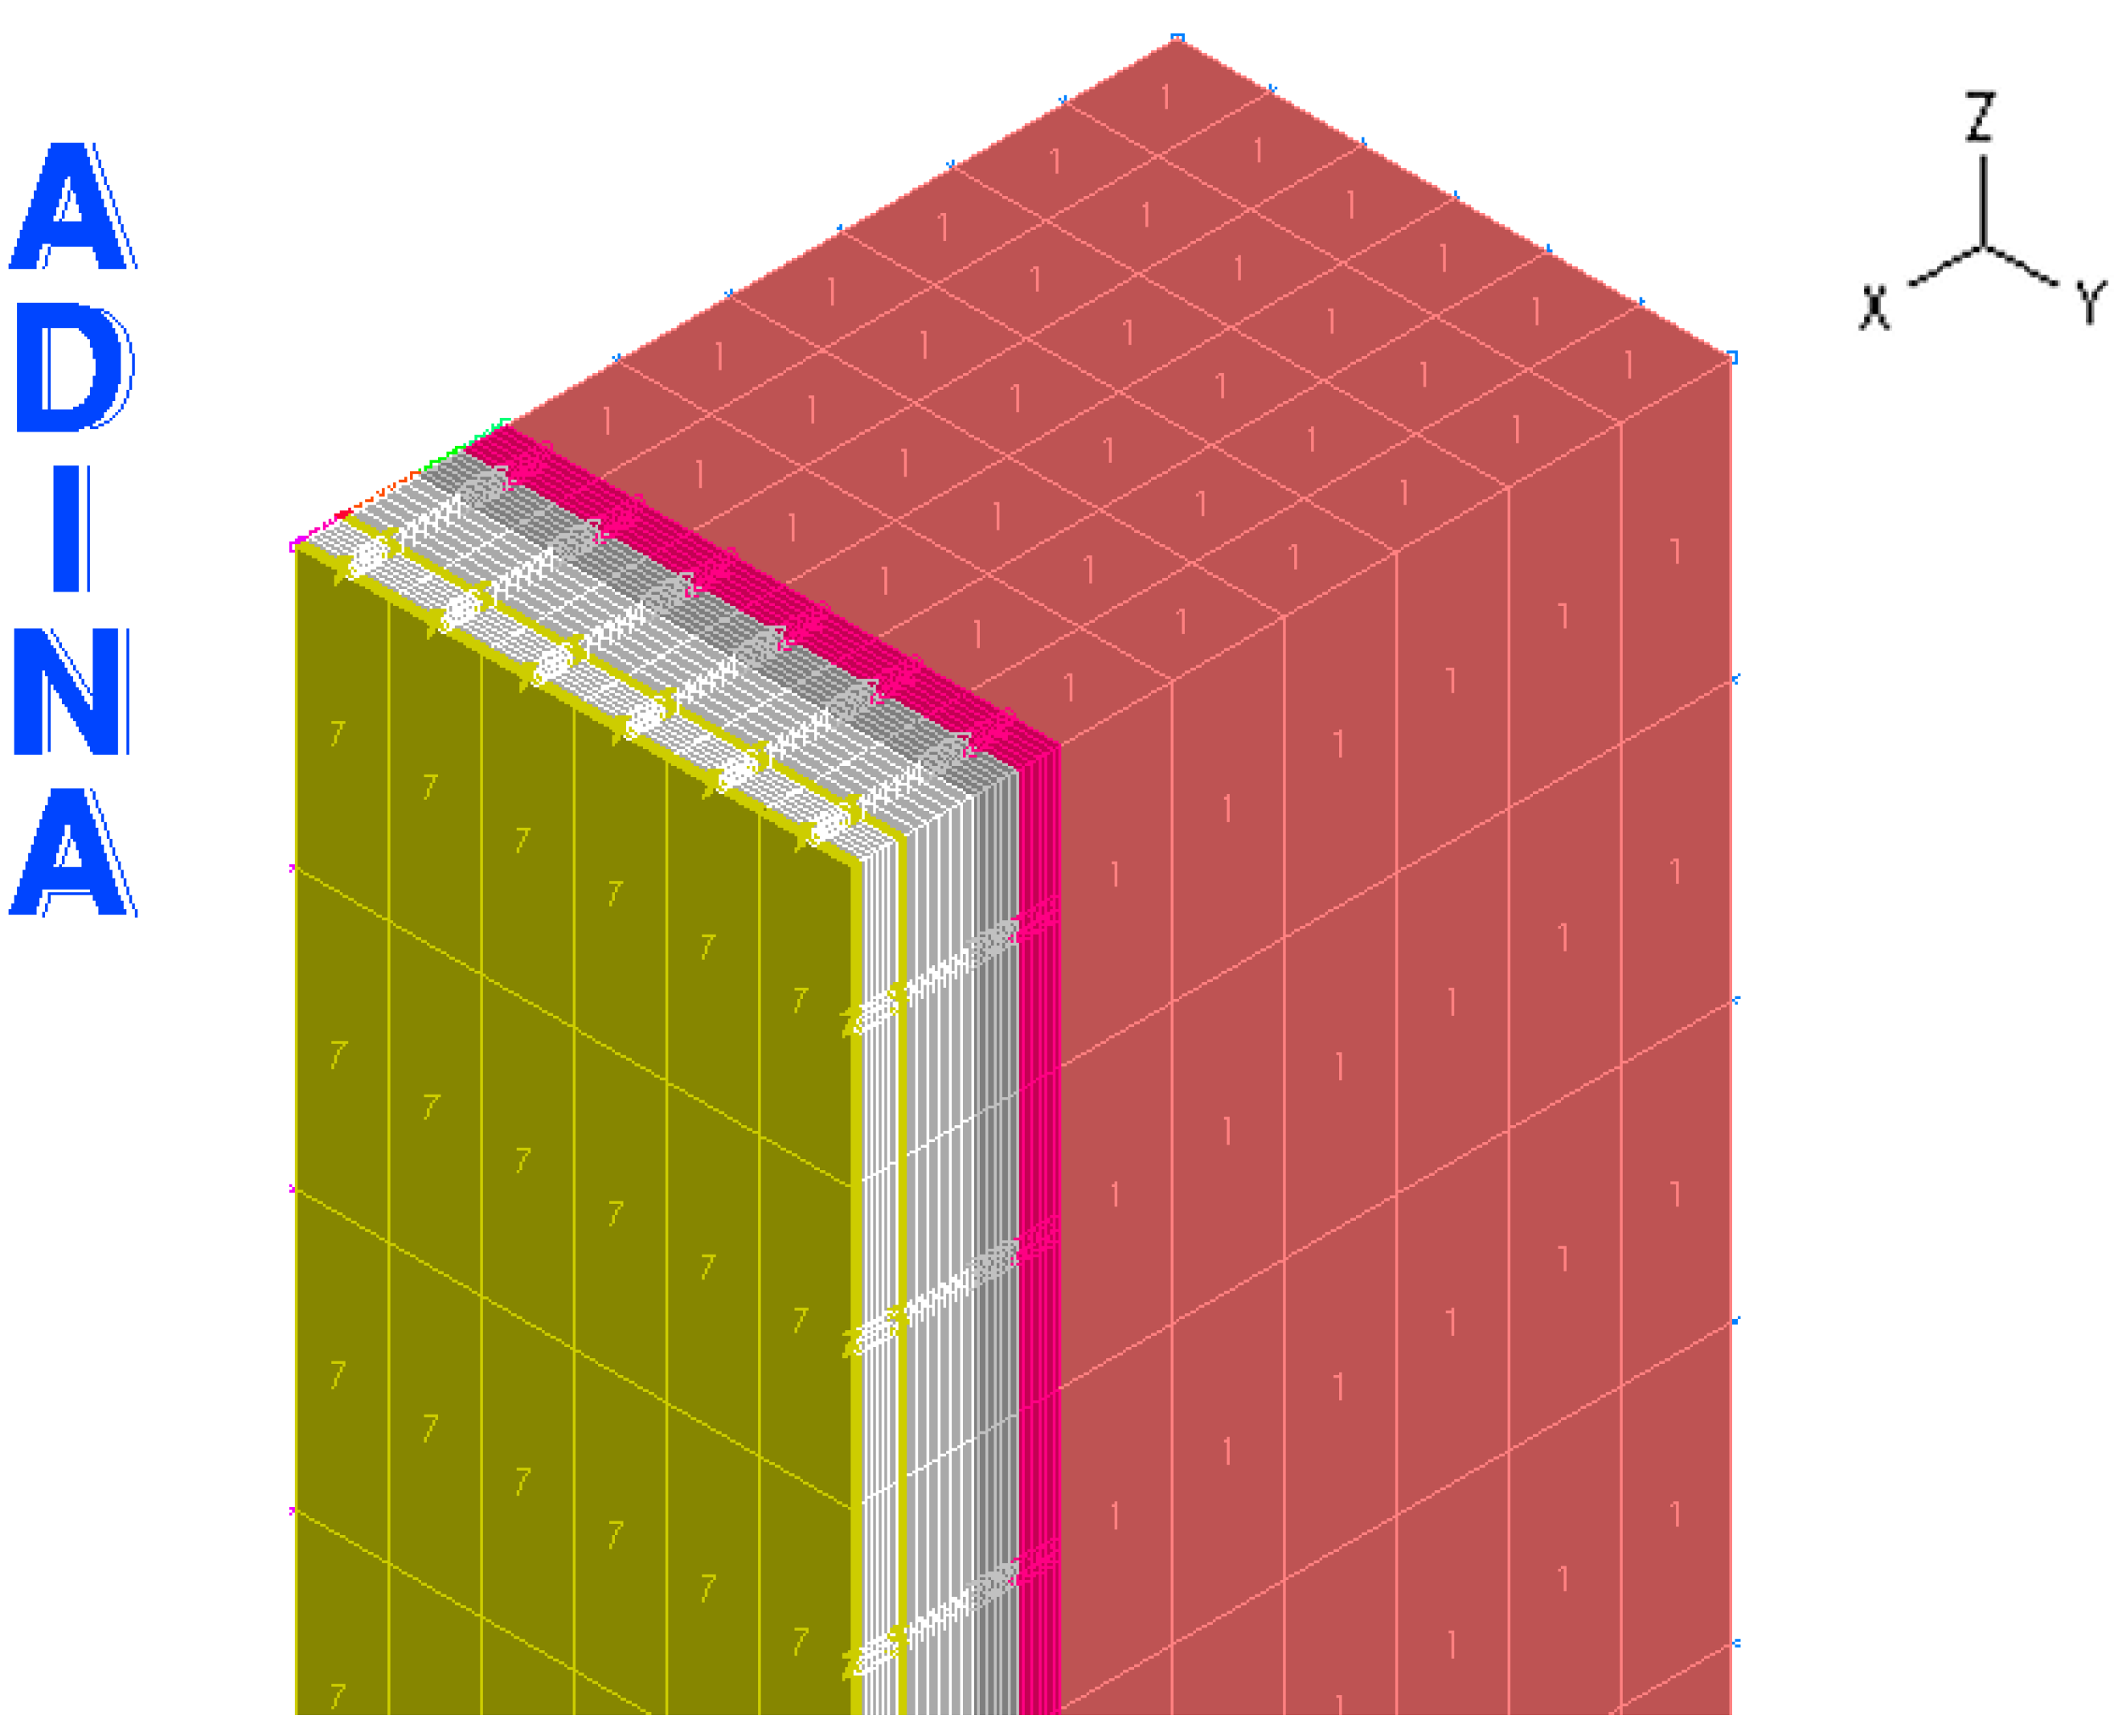
The numerical model was made using the finite element method (FEM) in the ADINA Version 9.6.3 computer program. The CFD module was used, which allows the analysis of thermodynamic phenomena in solids and liquids. The model was designed assuming geometric dimensions identical to the actual barrier subjected to empirical tests. A three-dimensional numerical model was made for the selected variant of the tested barrier. As the greatest amplitudes of temperature and heat flux were obtained for the variant of the barrier with G1 glazing, this variant was selected for numerical analysis. Conditions for convection and radiation were defined on all glass surfaces, the absorber surface and the internal surface of the wall. Calculations were made for the assumed boundary conditions: T
e = −10.0 °C and T
i = +20 °C. The structure of the model is shown in
Figure 6. The parameters of the glazing and the remaining layers of the barrier were established on the basis of the data provided by the manufacturers. The mesh dimensions in the model depend on the layer dimension. Each layer was divided into 6 fields in each of the three directions. Time steps equal to 5 min were assumed, corresponding to those assumed in the experimental studies. The model was created in a 3D structure, but the arrangement of layers and the assumed boundary conditions mean that there is practically no heat flow in the horizontal direction, parallel to the width of the model (along the Y axis in
Figure 6). During the construction of the numerical model, the technical parameters of the PCM presented in
Table 1 (melting temperature, solidification temperature, latent heat) were entered into the CFD module in the ADINA program. The tab in ADINA was used: Define Phase Change Control Parameters.
Two numerical simulations were carried out. Model no. 1 reflected the heating process of the tested barrier with the heating plate method, so it was the equivalent of the experimental tests carried out. Model no. 2 simulated the actual heating process of the thermal storage wall structure resulting from the influence of solar radiation.
In the first simulation, the model was loaded with the heat flux only on the surface of the heating plate. The load time corresponded to the value assumed during the experimental tests and was 6 h. The load value resulted from the multiplication of the value of total solar radiation on the vertical surface, amounting to 590 W/m2, by the value of the total solar energy transmittance coefficient at the level of 83.5% and was equal to that assumed during the experimental tests.
In simulation 2, a different form of loading was assumed. The absorber load resulted from the value of total solar radiation and the value of the direct solar radiation transmittance coefficient, determined by the glazing manufacturer at 82.7%. Additionally, the surfaces of both glass barriers were loaded on the basis of the direct absorption coefficient provided by the manufacturer, equal to 1.29% for a single glass surfaces. In model no. 2, the material of the absorber layer was changed from a concrete heating plate to a cement-lime plaster as a standard form of finishing the wall surface.
The following time intervals were assumed in both simulations: the first step is the stabilization of the model for a period of 72 h, which is equal 259,200 s. The second step is heating for 6 h, that is 21,600 s. In the third step, the model returns to its initial state and takes 76 h, i.e., 273,600 s. The total time of each numerical simulation is 154 h, that is 554,400 s.
4. Discussion
The barrier heating process shapes the dynamics of the passage of the thermal wave, which can be characterized by many parameters: temperature at the characteristic point of the cross-section (T
j), time to reach the maximum temperature at a characteristic point of the cross-section (∆t), amplitude of the heat flux (q
amp), time to reach the minimum value of the heat flux (t(q
min)), change in the value of the heat flux during the day (∆q
(n)), change in the average value of the heat flux during the day (∆q
average(n)) in relation to the initial state, percentage value of the average daily heat flux relative to the initial state (
Table 9). Negative values of the heat flux change (∆q
(n)) relate to the barrier heating process, while positive values to the cooling process.
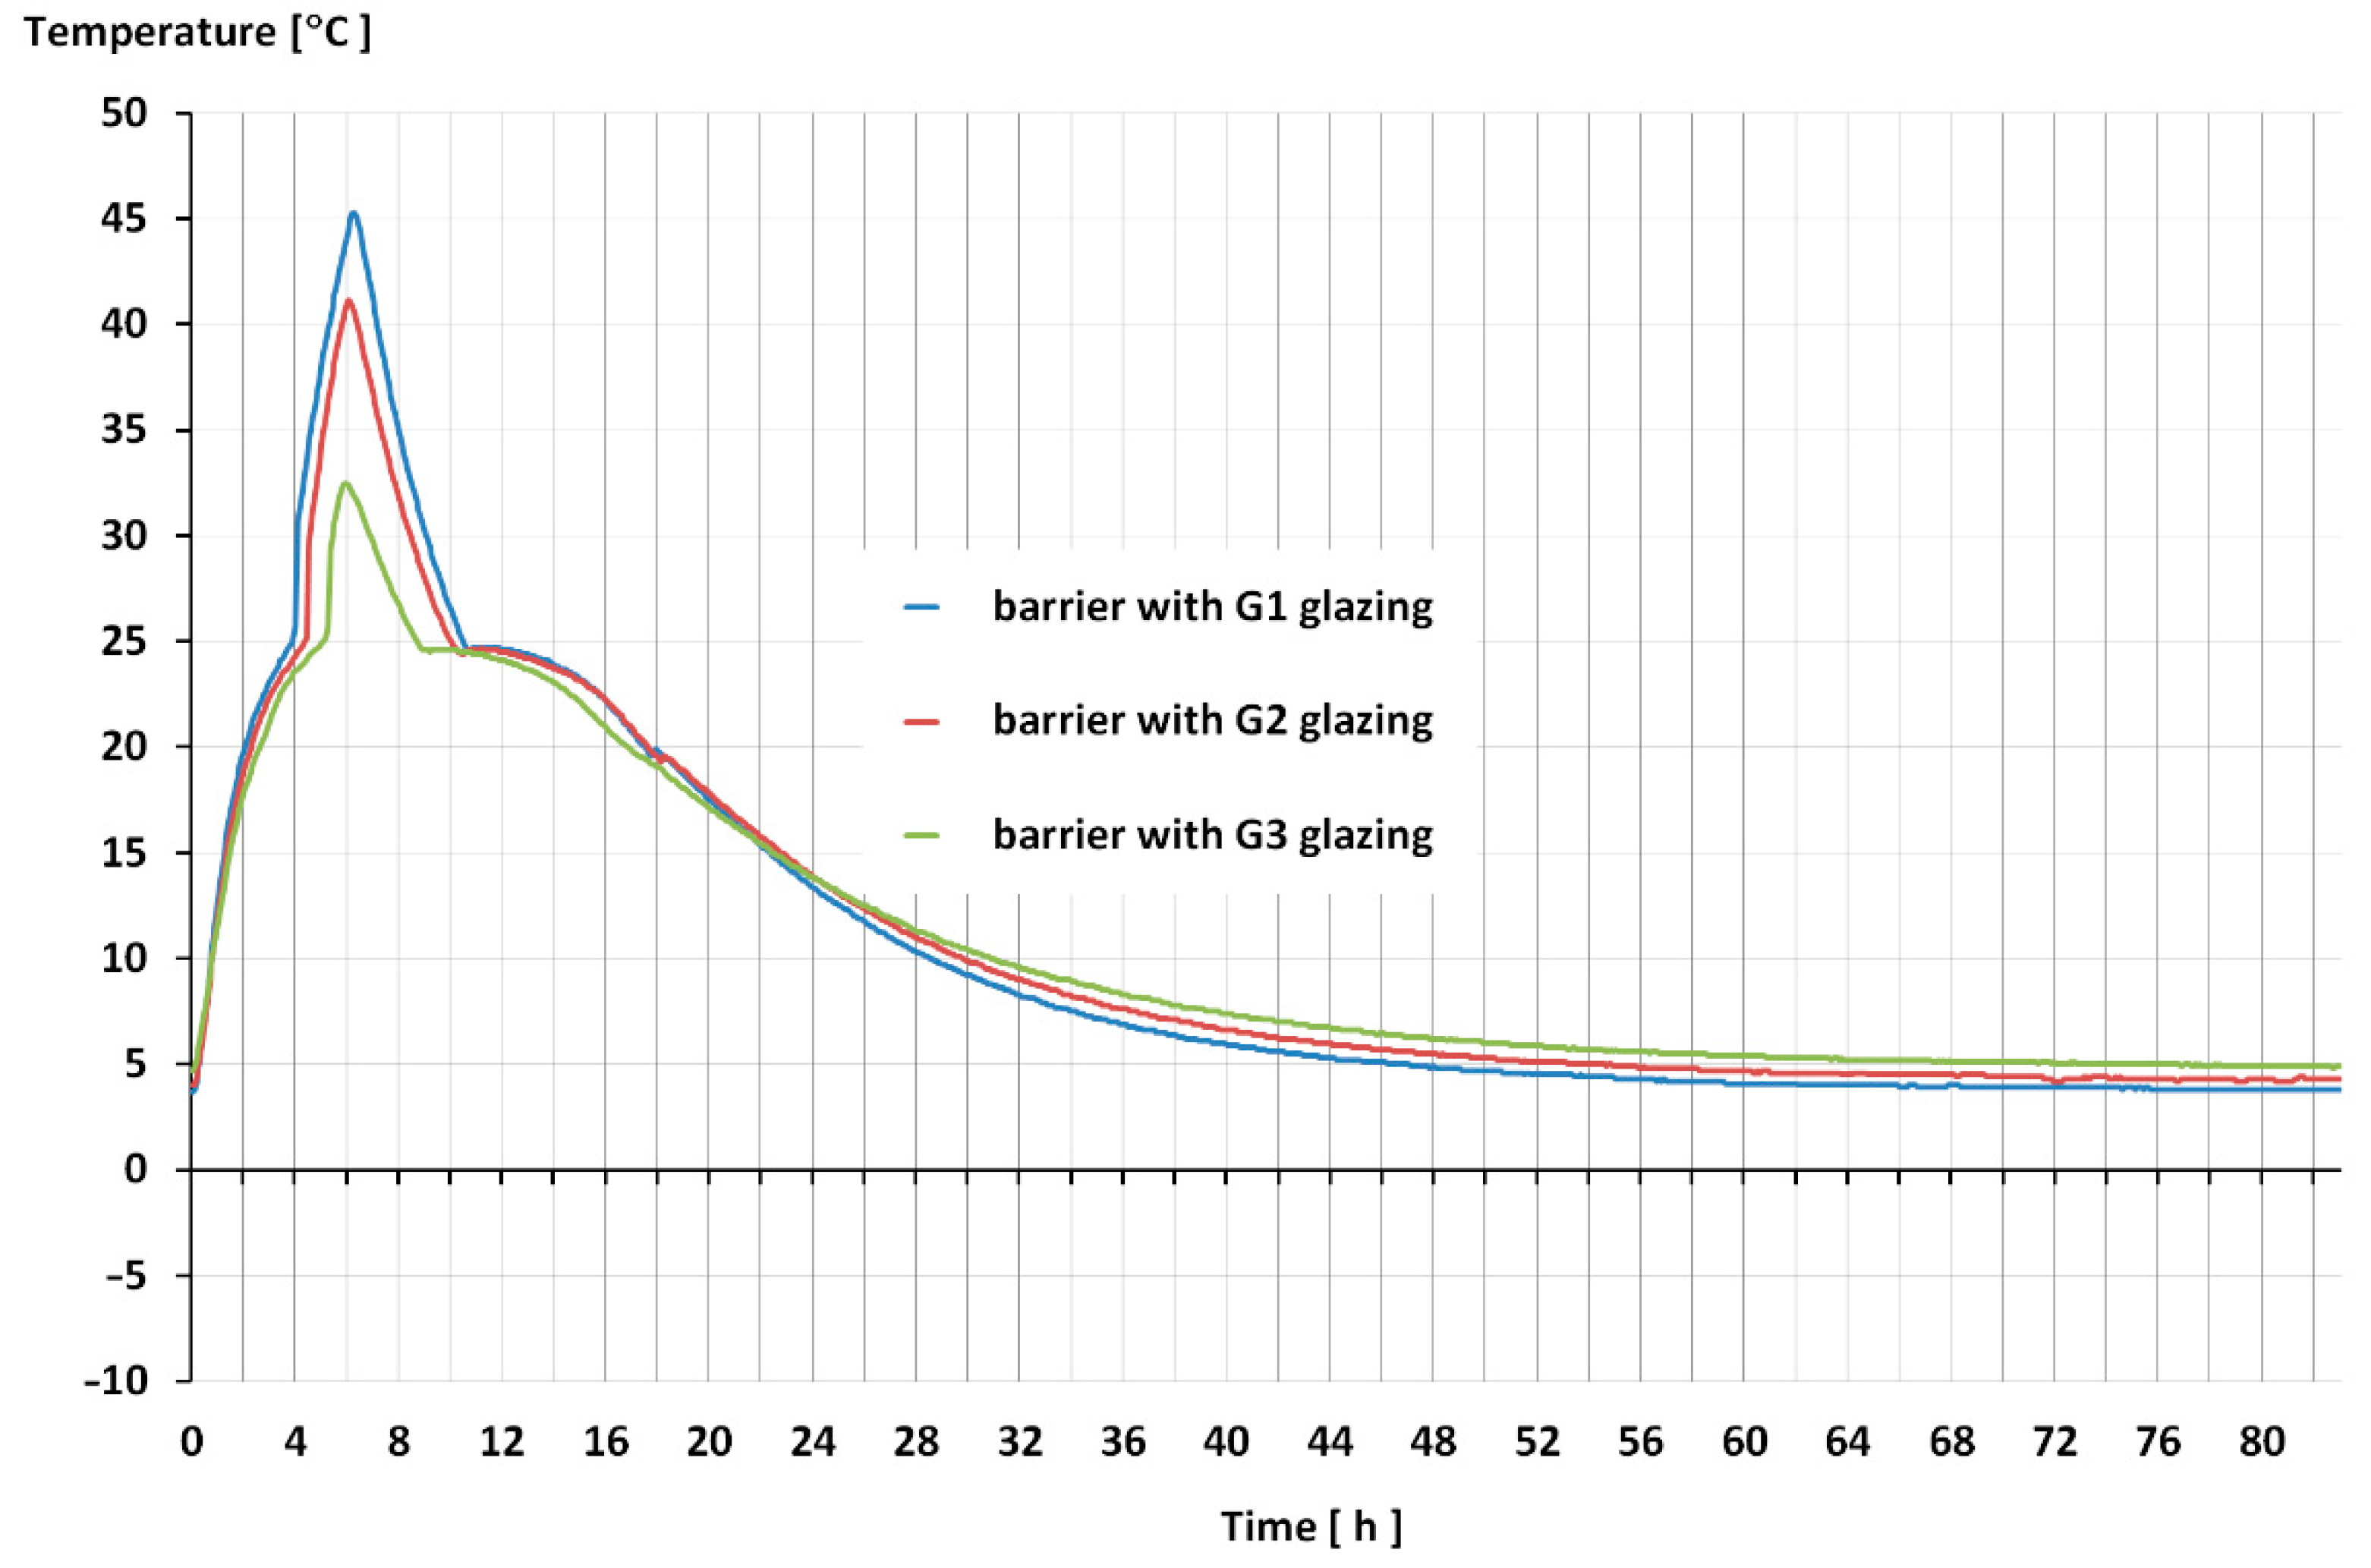
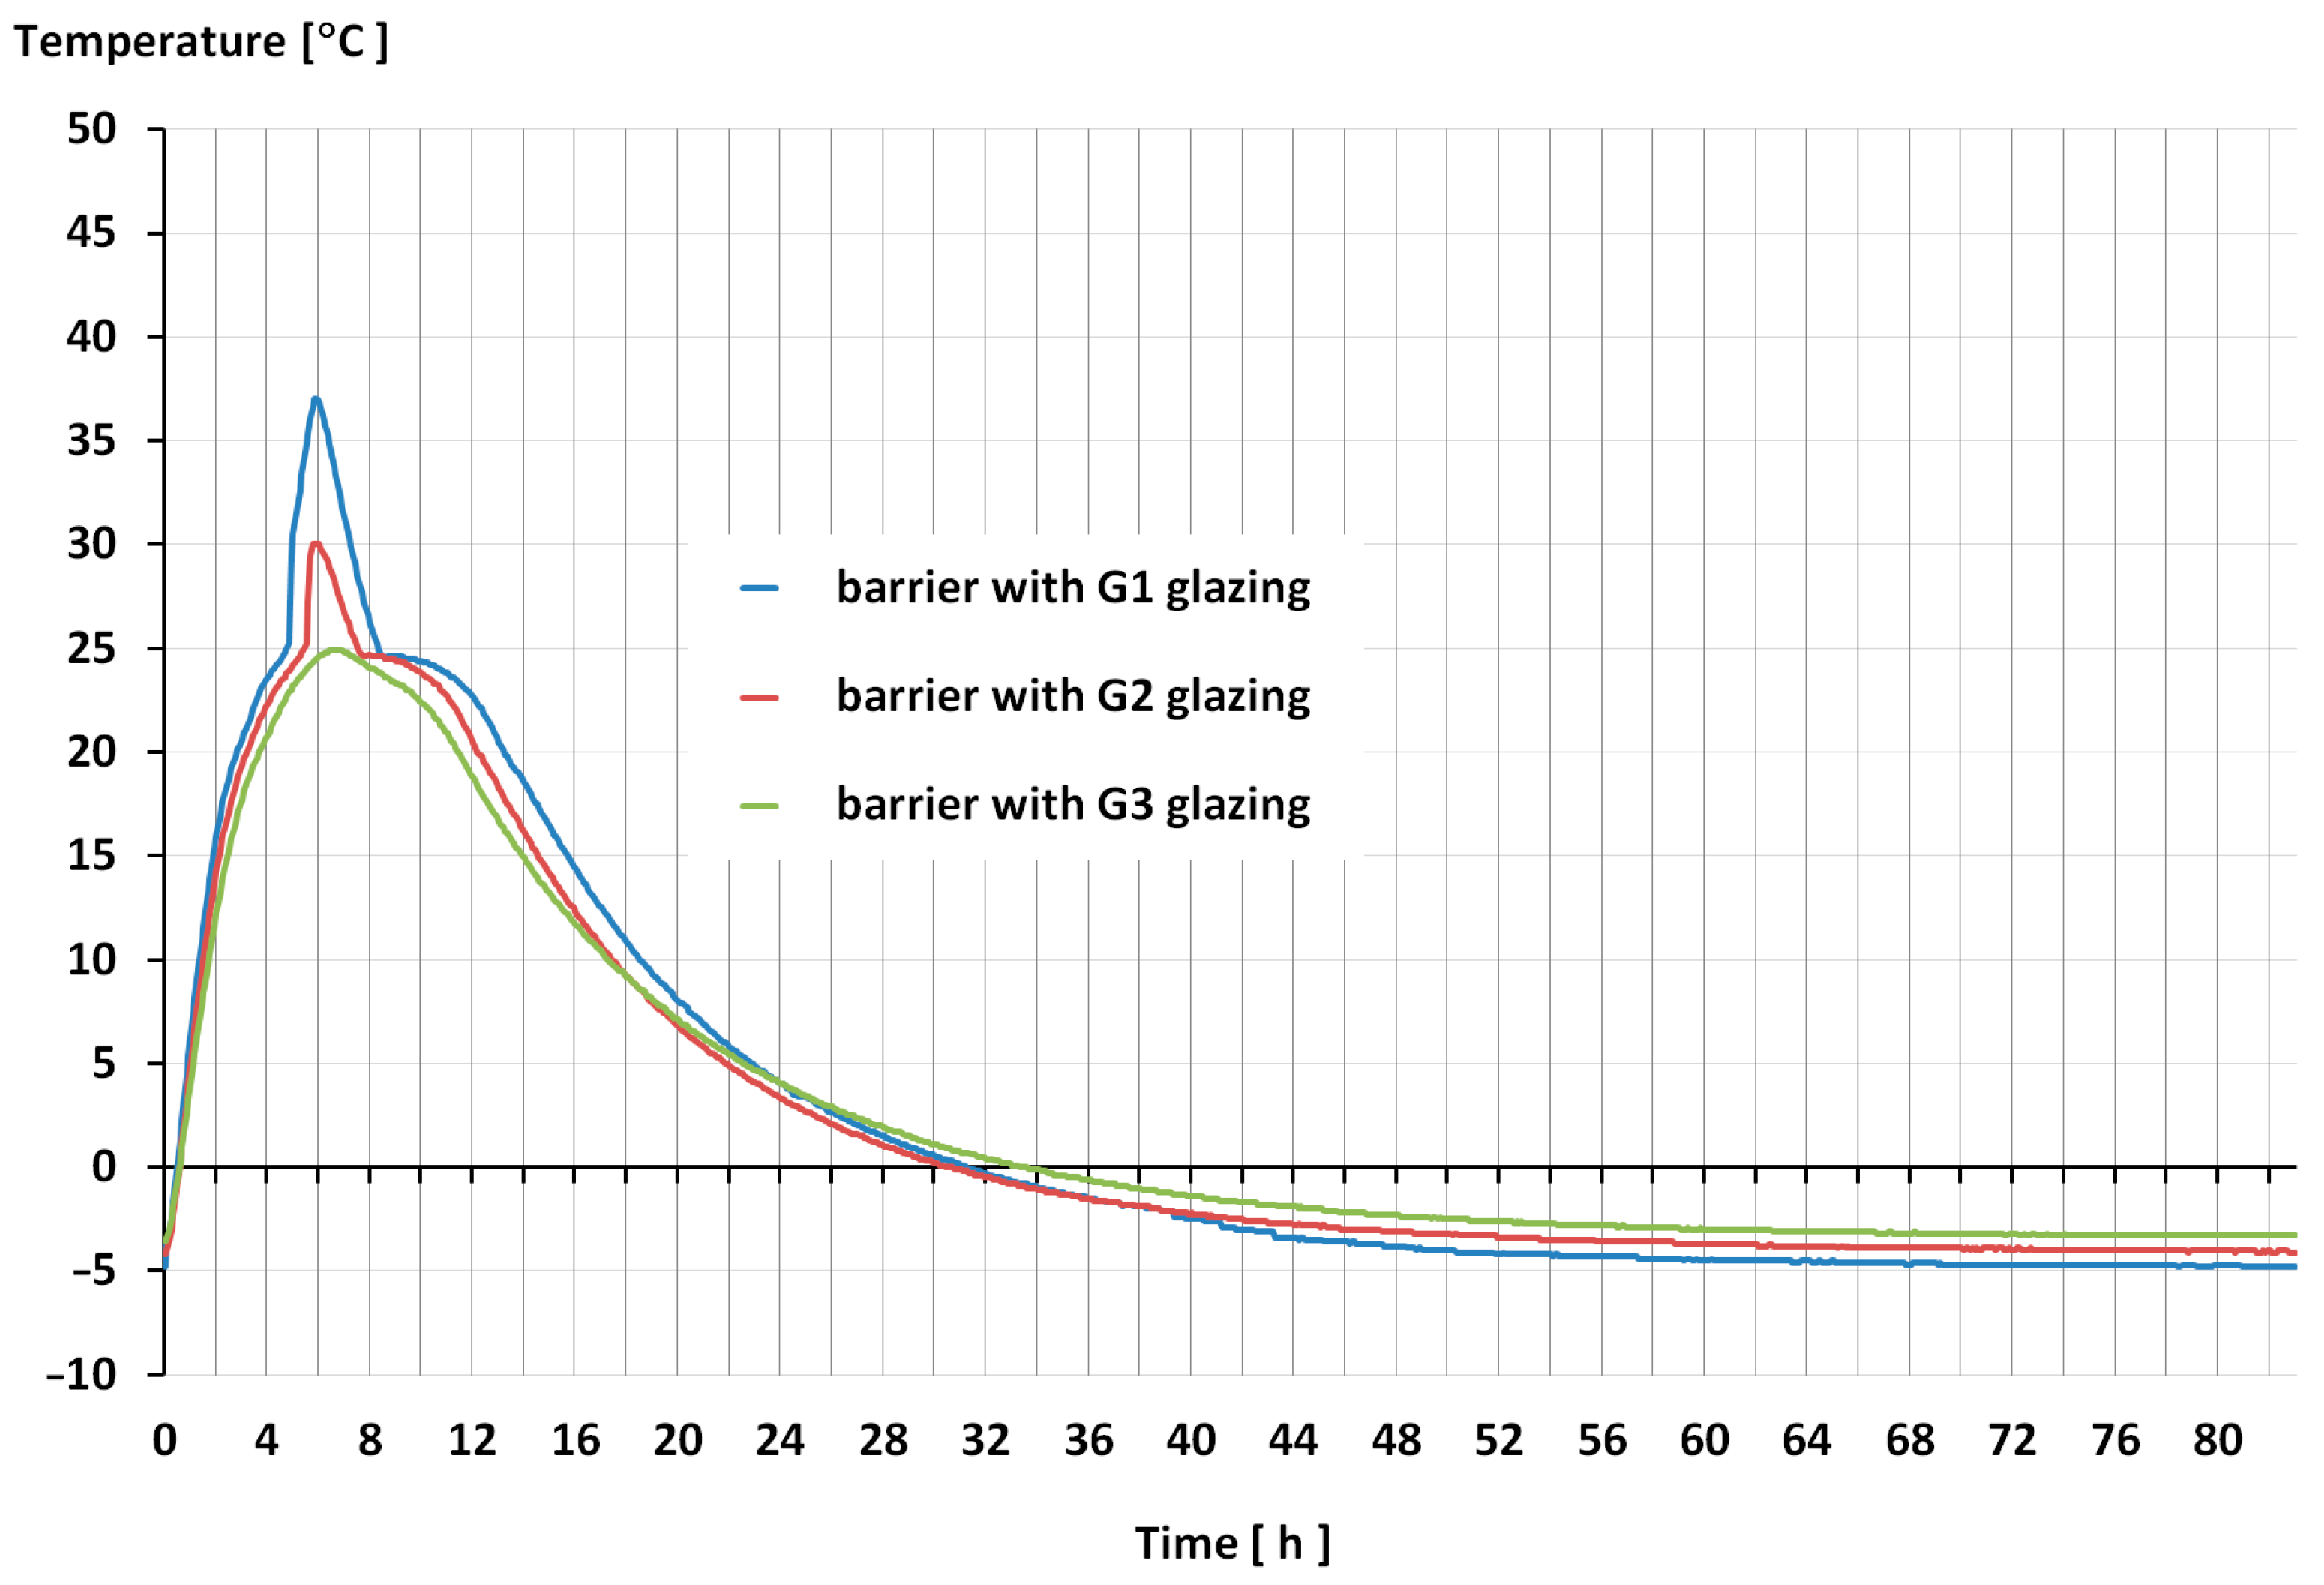
The B1 barrier achieves the highest temperature of the absorber, thanks to the highest transmittance of the glazing (gG1 = 83%), which is also related to the highest value of energy that is supplied to the absorber. This barrier heats up the fastest, reaches the highest temperatures in the shortest time, obtains the highest value of the heat flux amplitude and its minimum value is close to the lowest, which proves its high dynamics of operation.
The passage of the thermal wave through the barriers within 24 h is characterized by high dynamics of temperature changes in each of the characteristic cross-sections for all of the barriers. The highest dynamics of temperature changes in characteristic cross-sections is observed in the B1 barrier, the lowest dynamics is in the B3 barrier with glazing of the highest insulation and the lowest transmittance.
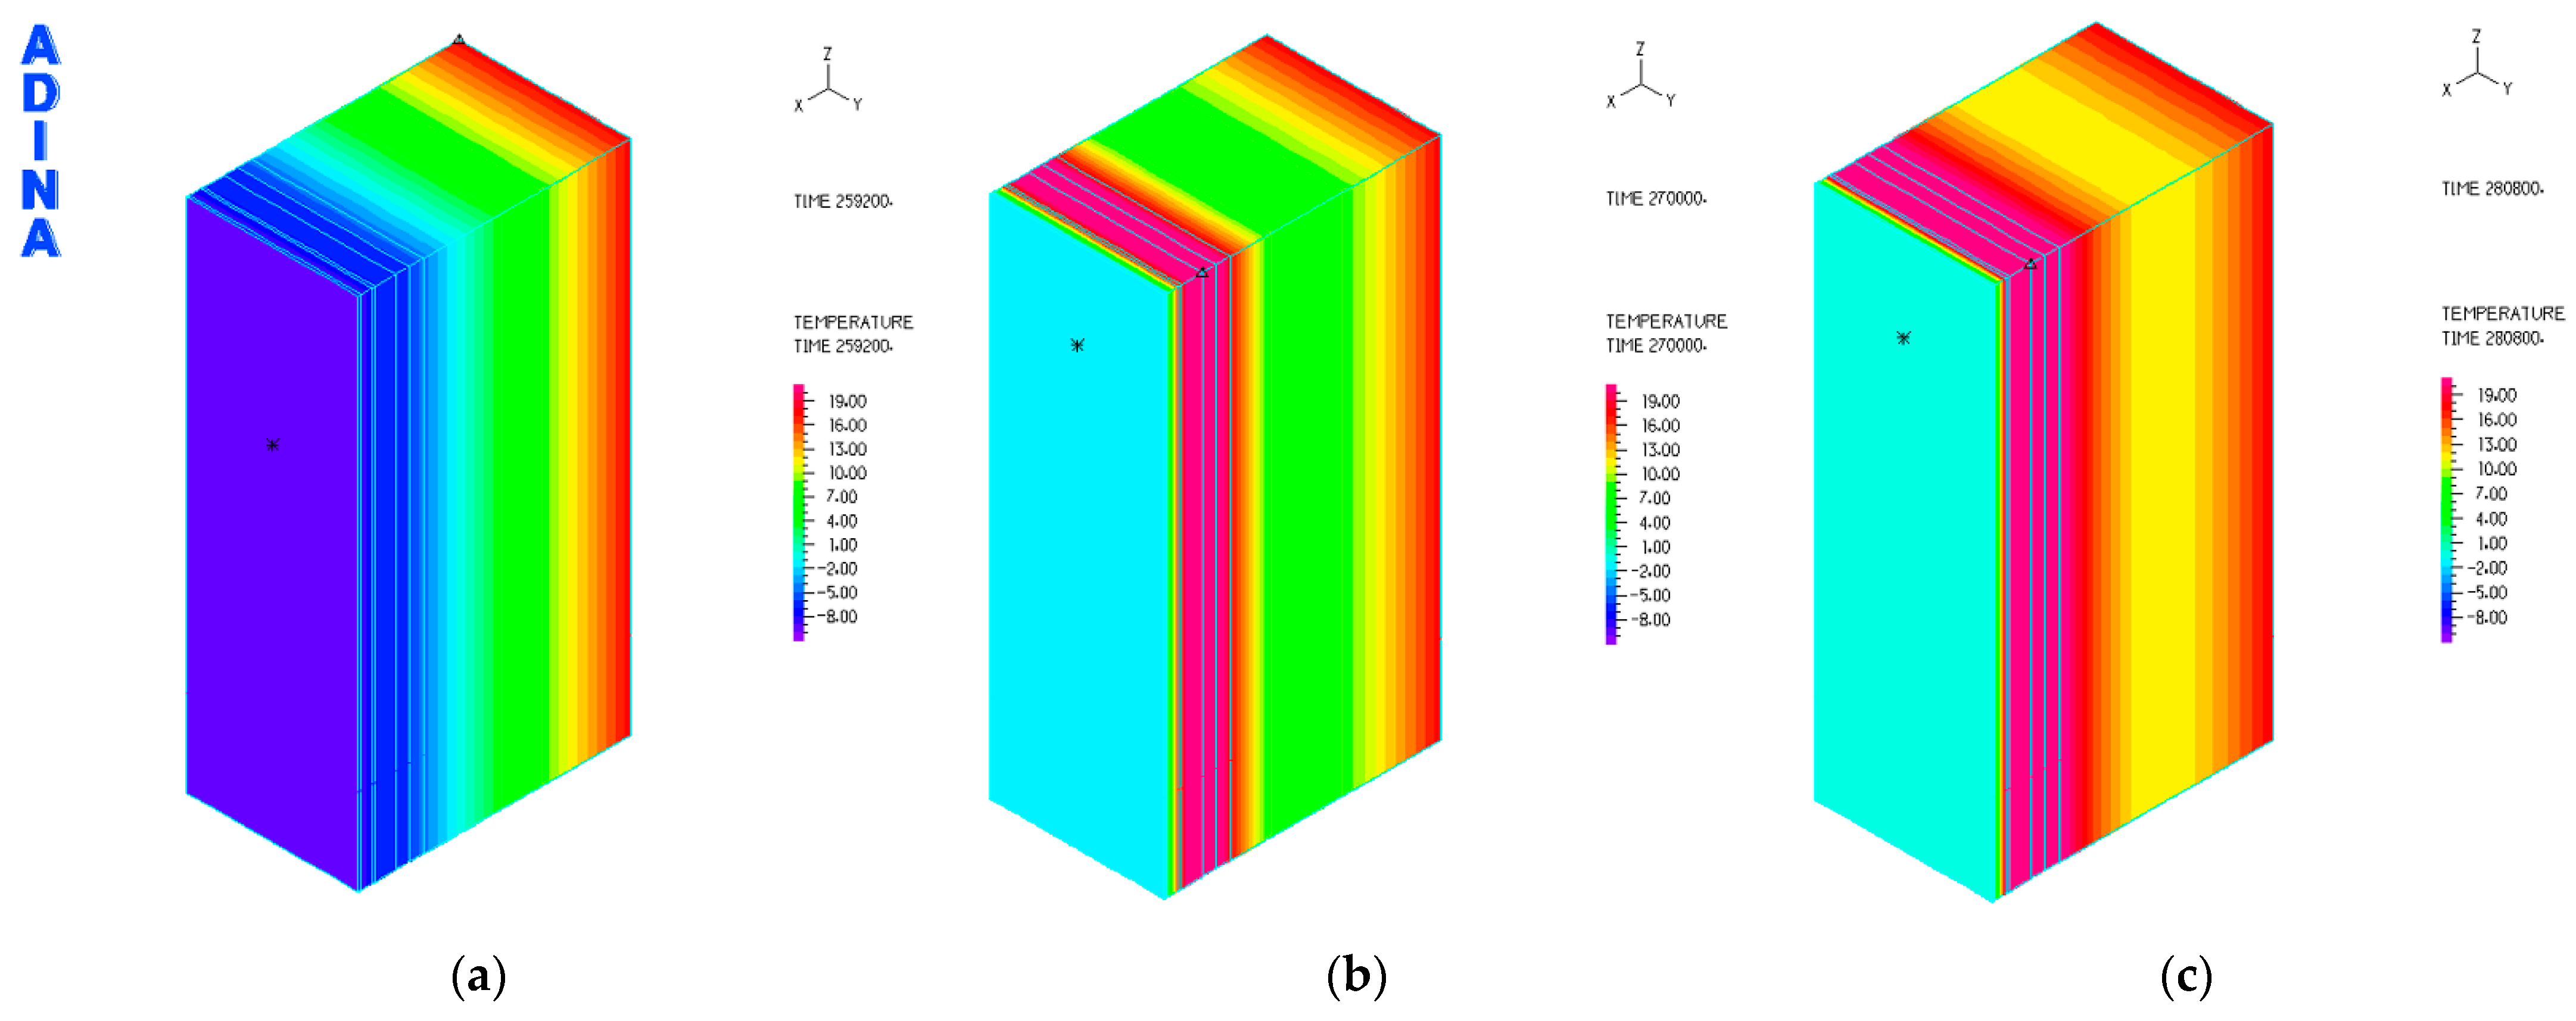
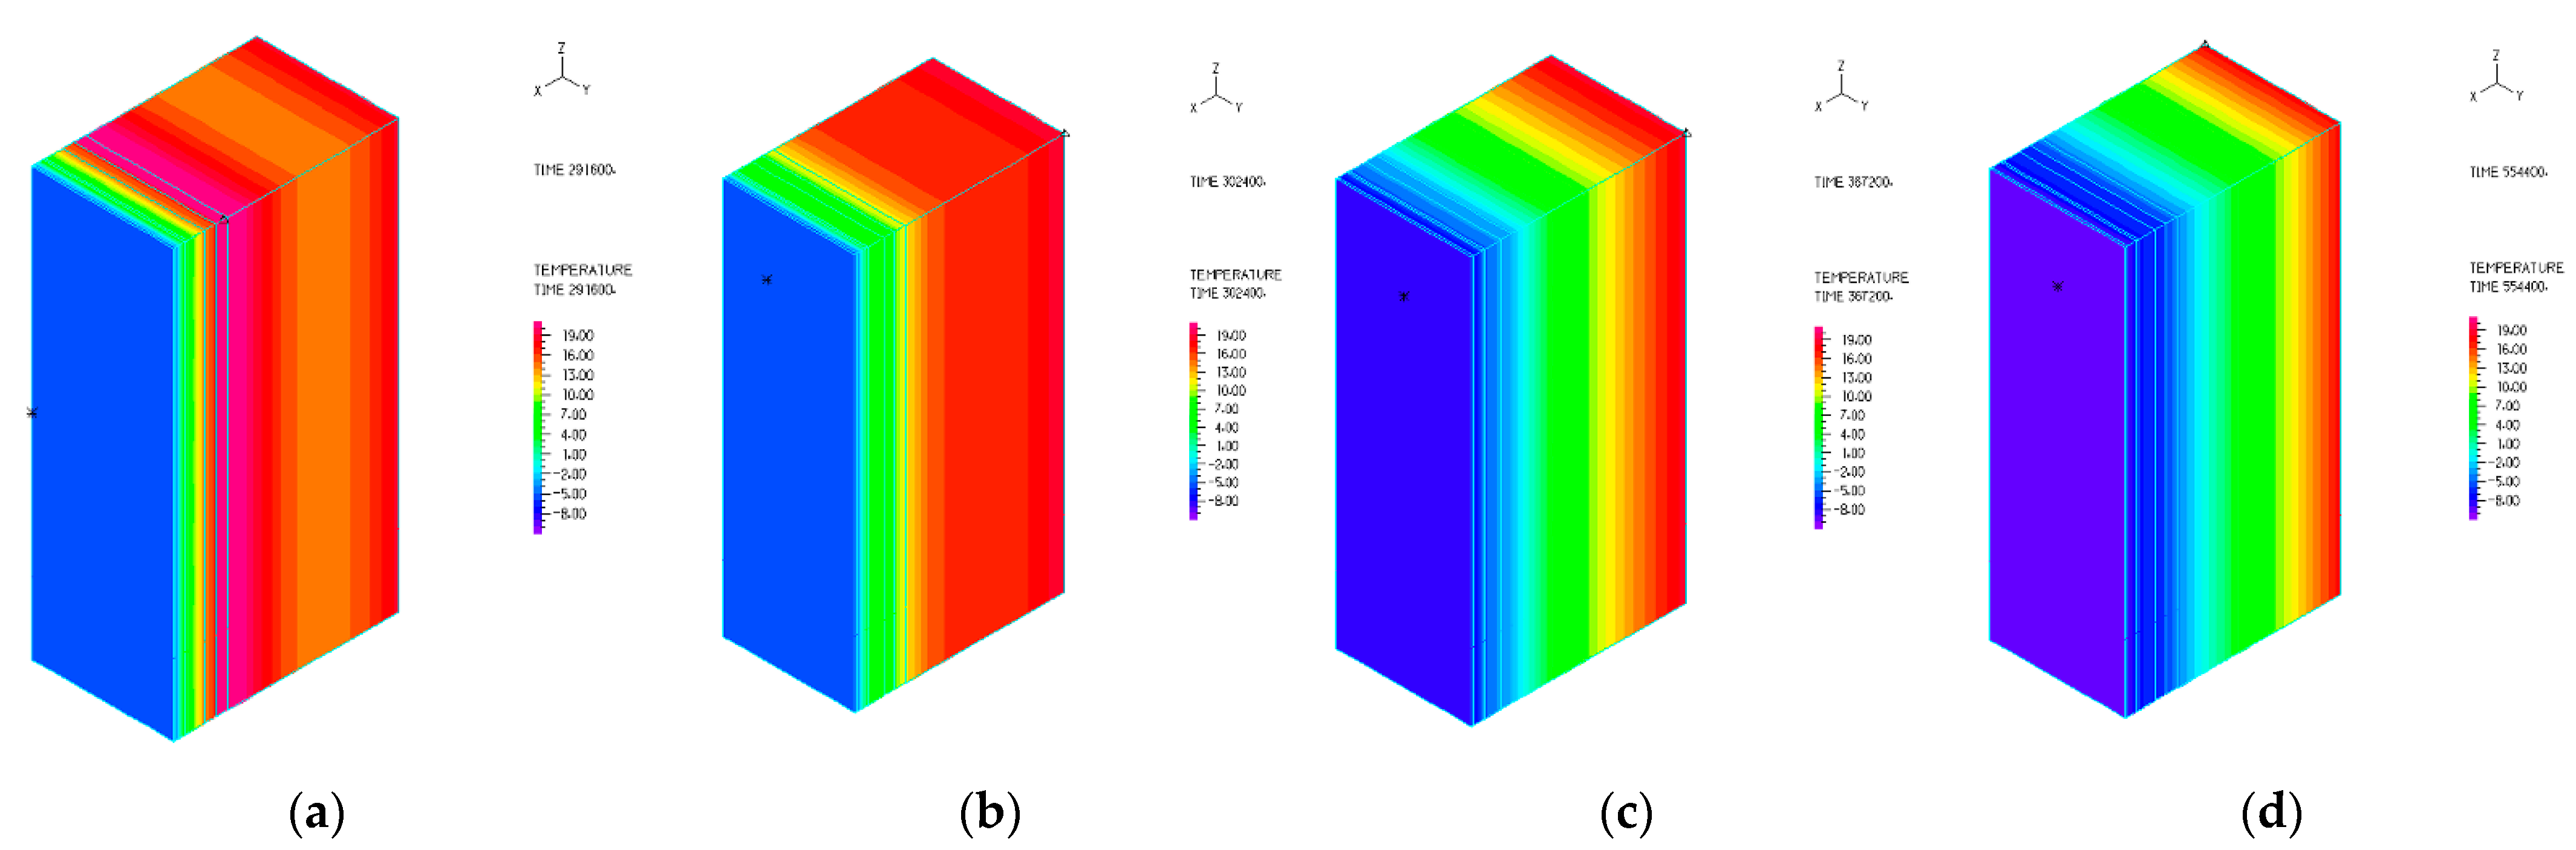
The phase change material reached the maximum temperature the fastest in the B3 barrier. It was influenced by the highest insulation of glazing (low heat loss to the external environment), as evidenced by the curve of the temperature graph towards the outside, as shown in
Figure 6.
On the outer side of the ceramic surface, all of the barriers reached their maximum temperatures in very similar time. Inside the ceramic element, at a distance of 1/3 of the wall thickness from the absorber, the B3 barrier takes more than 3 h longer than the others to reach its highest temperature. On the other hand, in the cross-section located 2/3 of the wall thickness from the absorber, the highest temperature is reached in over 2 h longer. This results from the barrier generating the smallest thermal force. The B3 barrier with glazing of the highest insulation, heats up the slowest and has the longest time for the passage of the thermal wave.
The measurable energy effect of the operation of the barrier is the value of the average daily heat flux. This is this parameter that allows estimation of the amount of heat losses or gains in the barrier. The dynamics of the barrier’s operation is important, as it proves its thermal capabilities, but it is the heat flux that determines the final energy effect (amount of heat losses or gains).
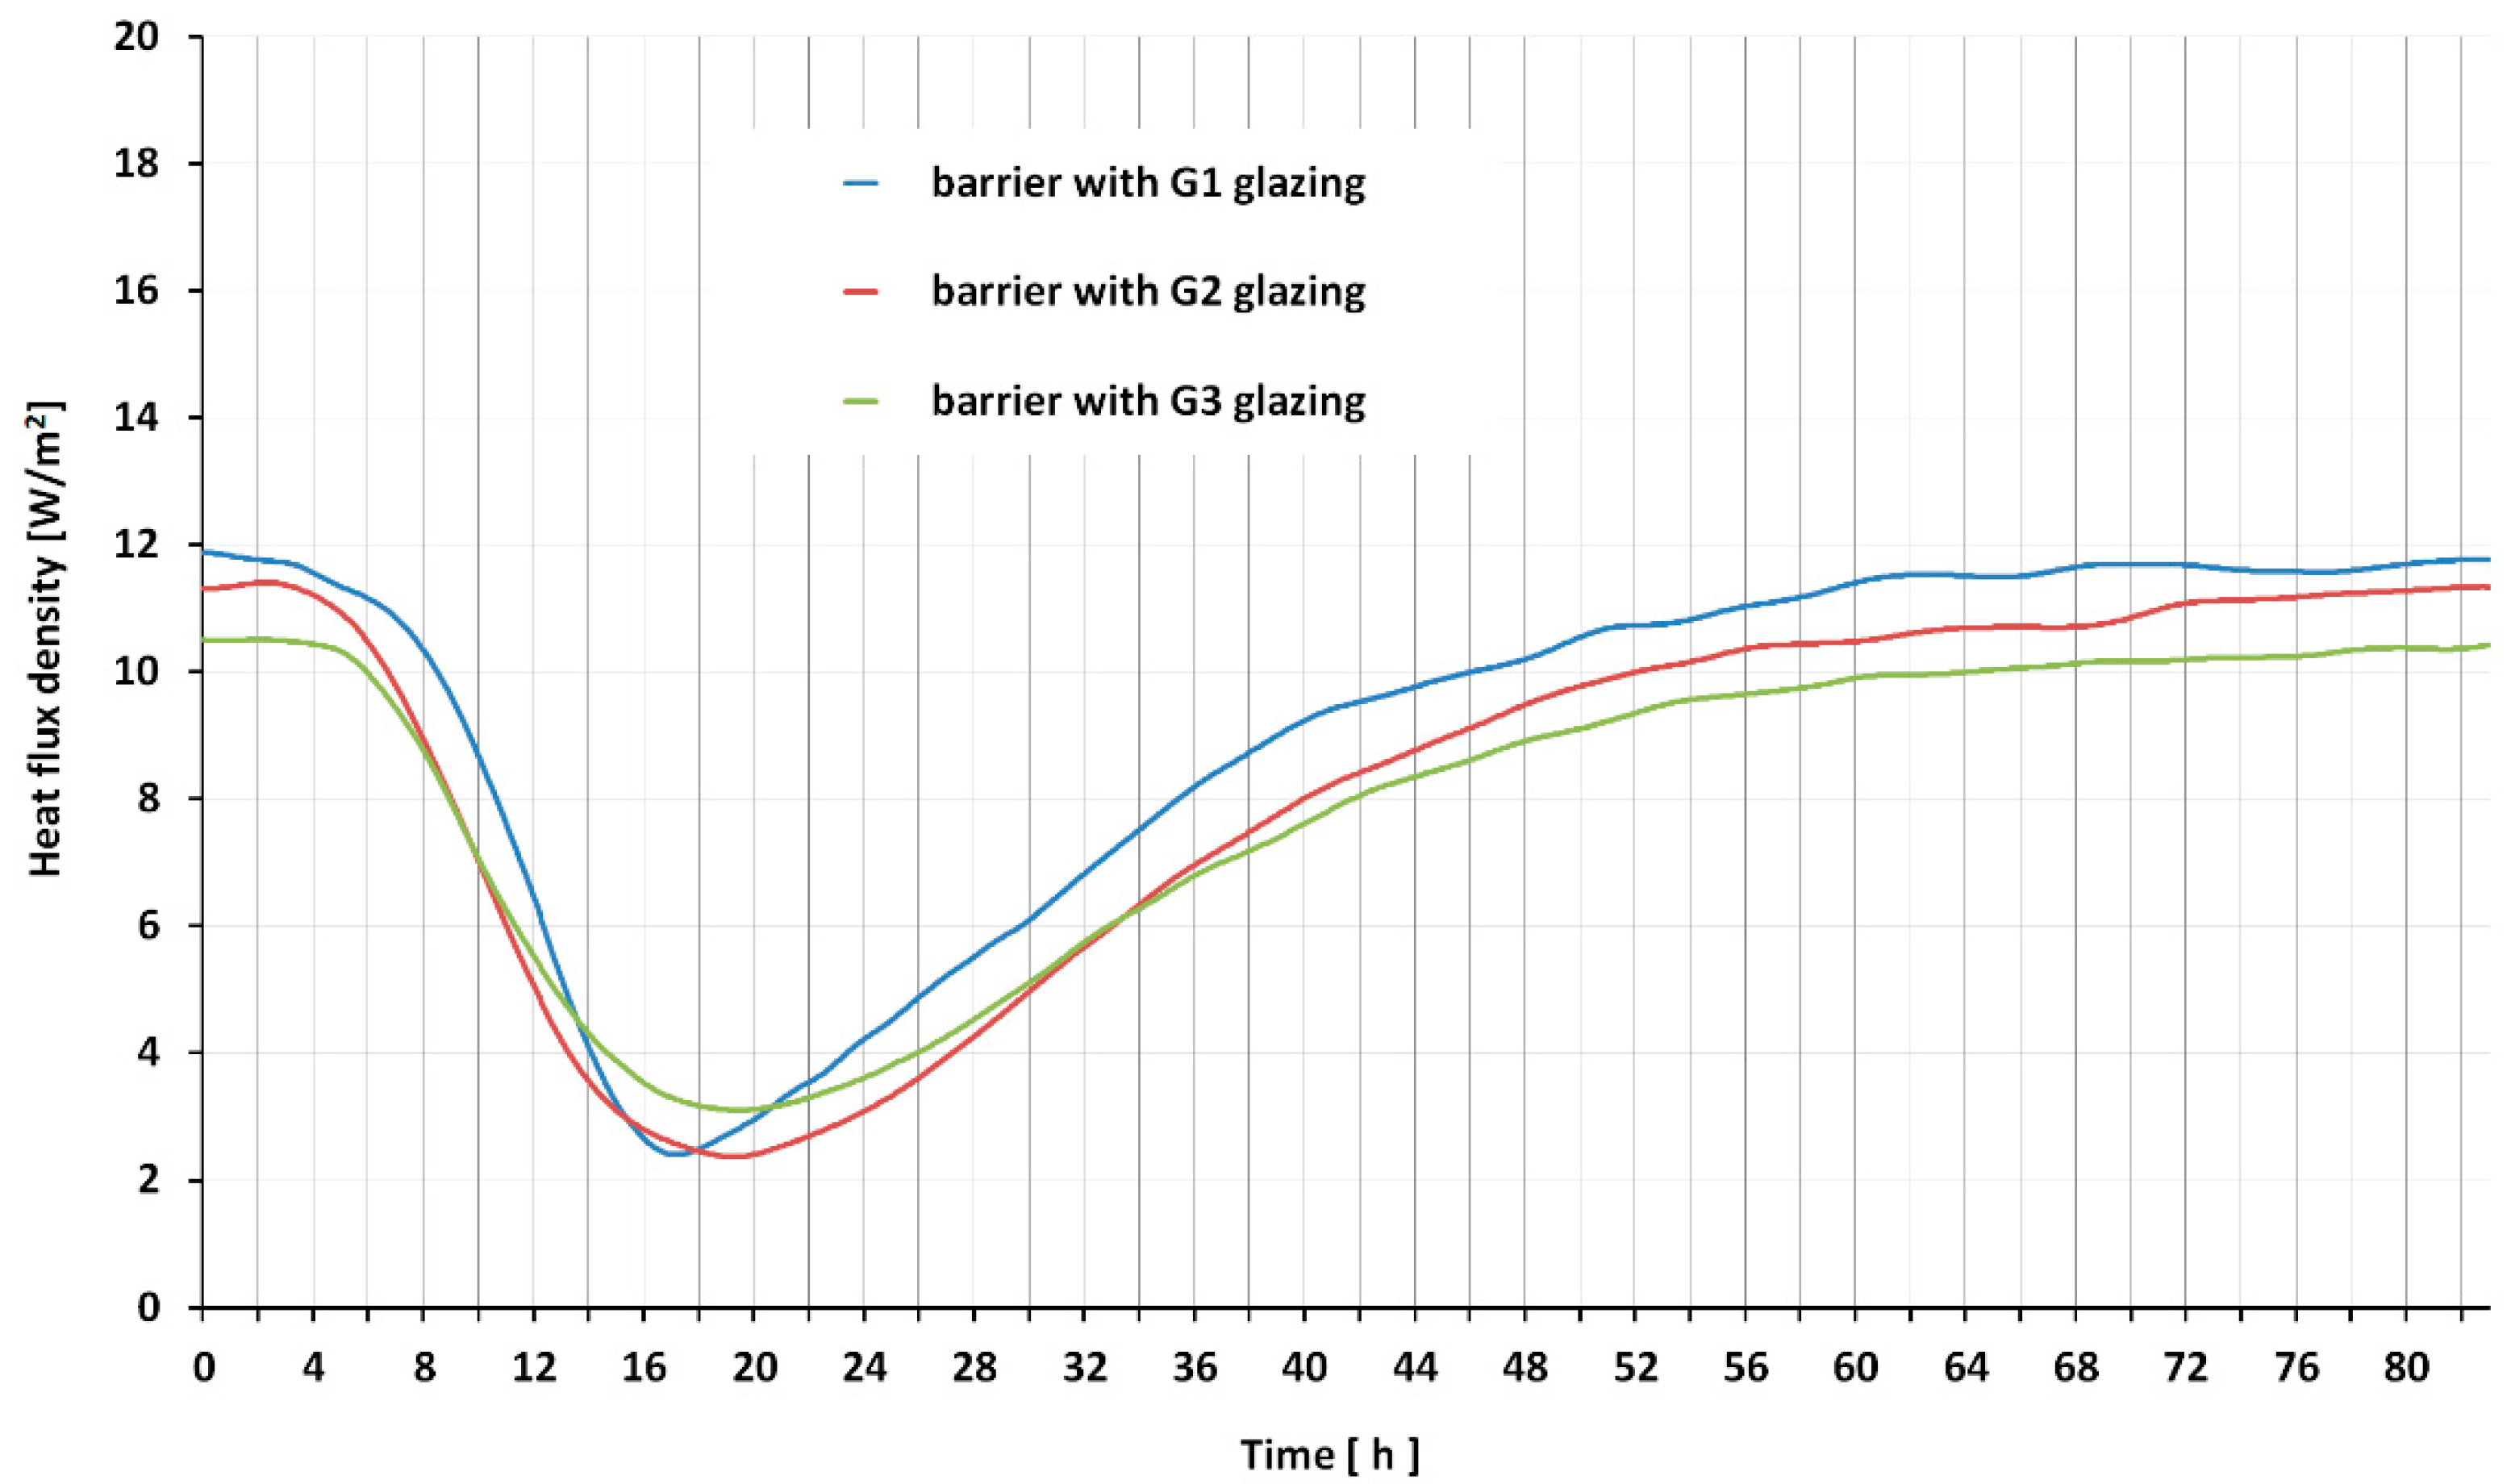
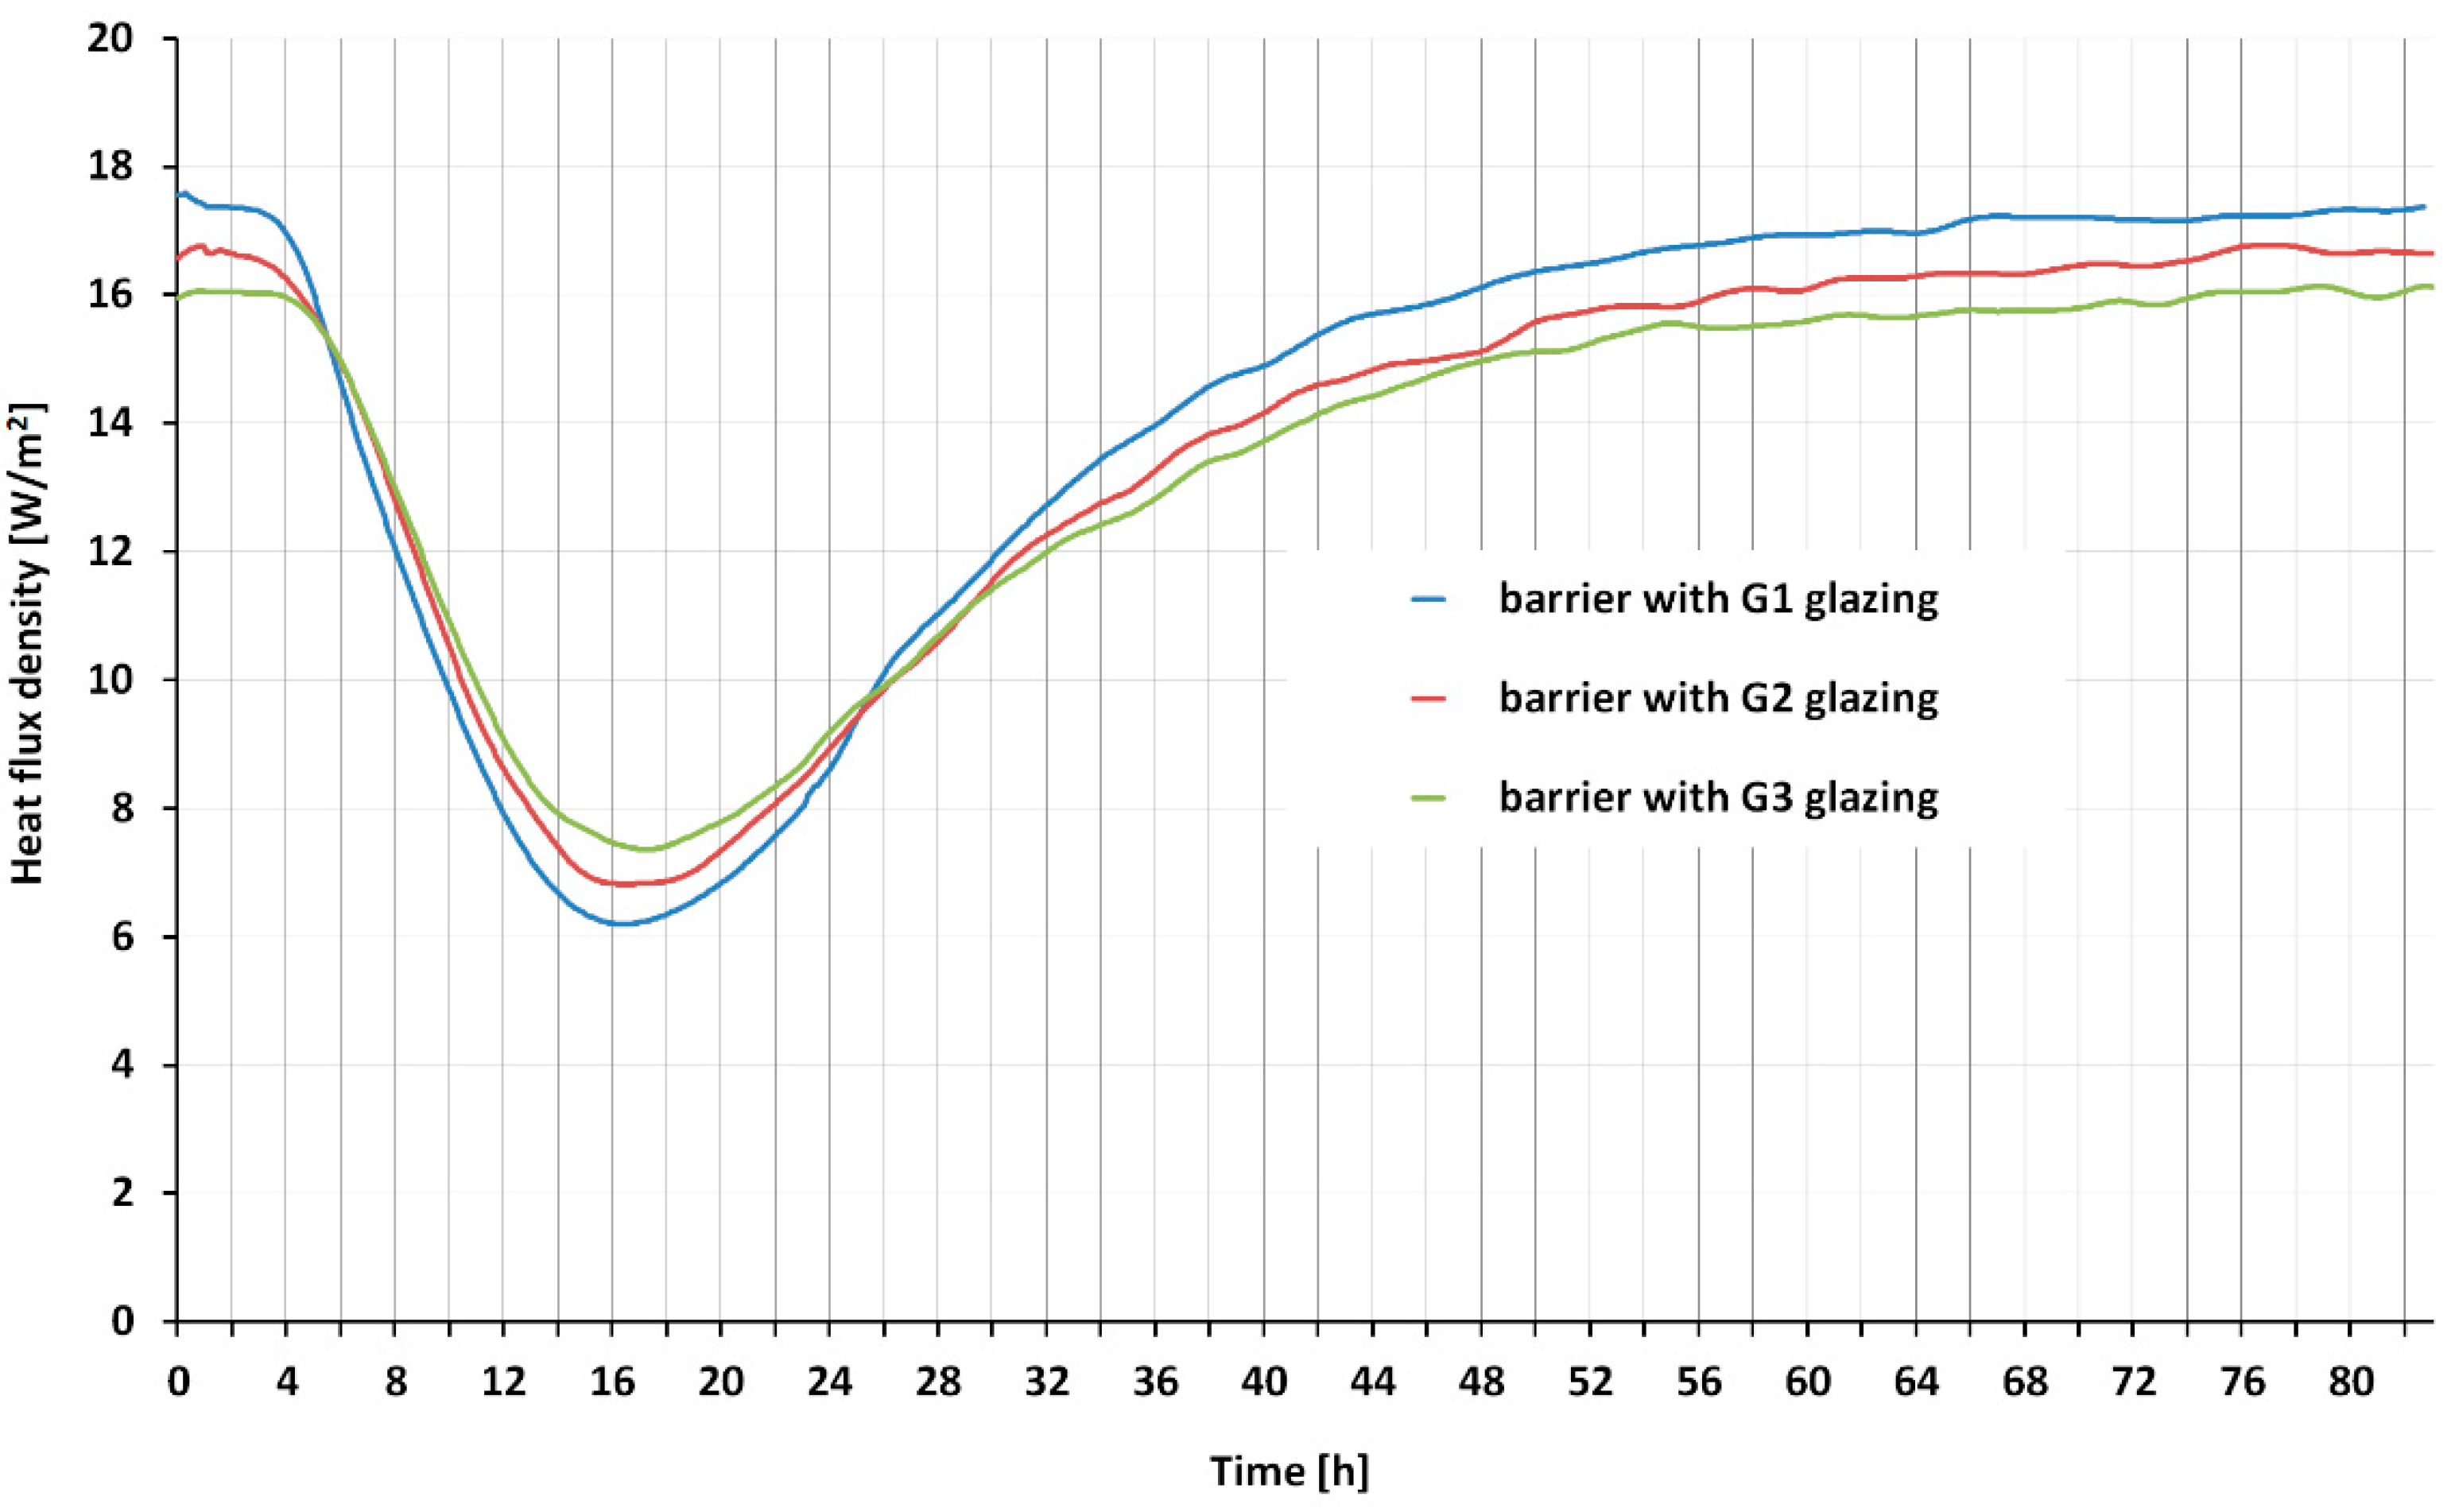
Among the considered barriers, the B2 barrier with G2 glazing, for the outside temperature Te = 0.0 °C, reaches the lowest value of the average heat flux on the first day and after two days, while the B3 barrier on the second and third day and after three days. For the outside temperature Te = −10.0 °C, the B1 barrier reaches the lowest value of the average heat flux on the first day, while the B3 barrier on the second and third day and after two and three days.
Table 9 presents the index of DCV calculated for individual barriers. We see that the B2 barrier reaches the highest percentage values in each day for the outside temperature T
e = 0.0 °C. However, at a lower outside temperature T
e = −10.0 °C, the B1 barrier is more dynamic.
Based on the research conducted and analysis of the results, it can be concluded that two basic glazing parameters: heat transfer coefficient (Ug) and solar radiation transmittance (g) are very important in the functioning of a collector–storage wall modified with a phase change material. It is possible to significantly reduce heat loss through the barrier, if both these parameters (Ug and g) are properly selected.
The conducted research shows that after two consecutive cloudy days, the barrier would start operating practically from the beginning (they would return to their original state). It should be noted that the tests used glazing with the highest solar energy transmittance for a given thermal insulation.
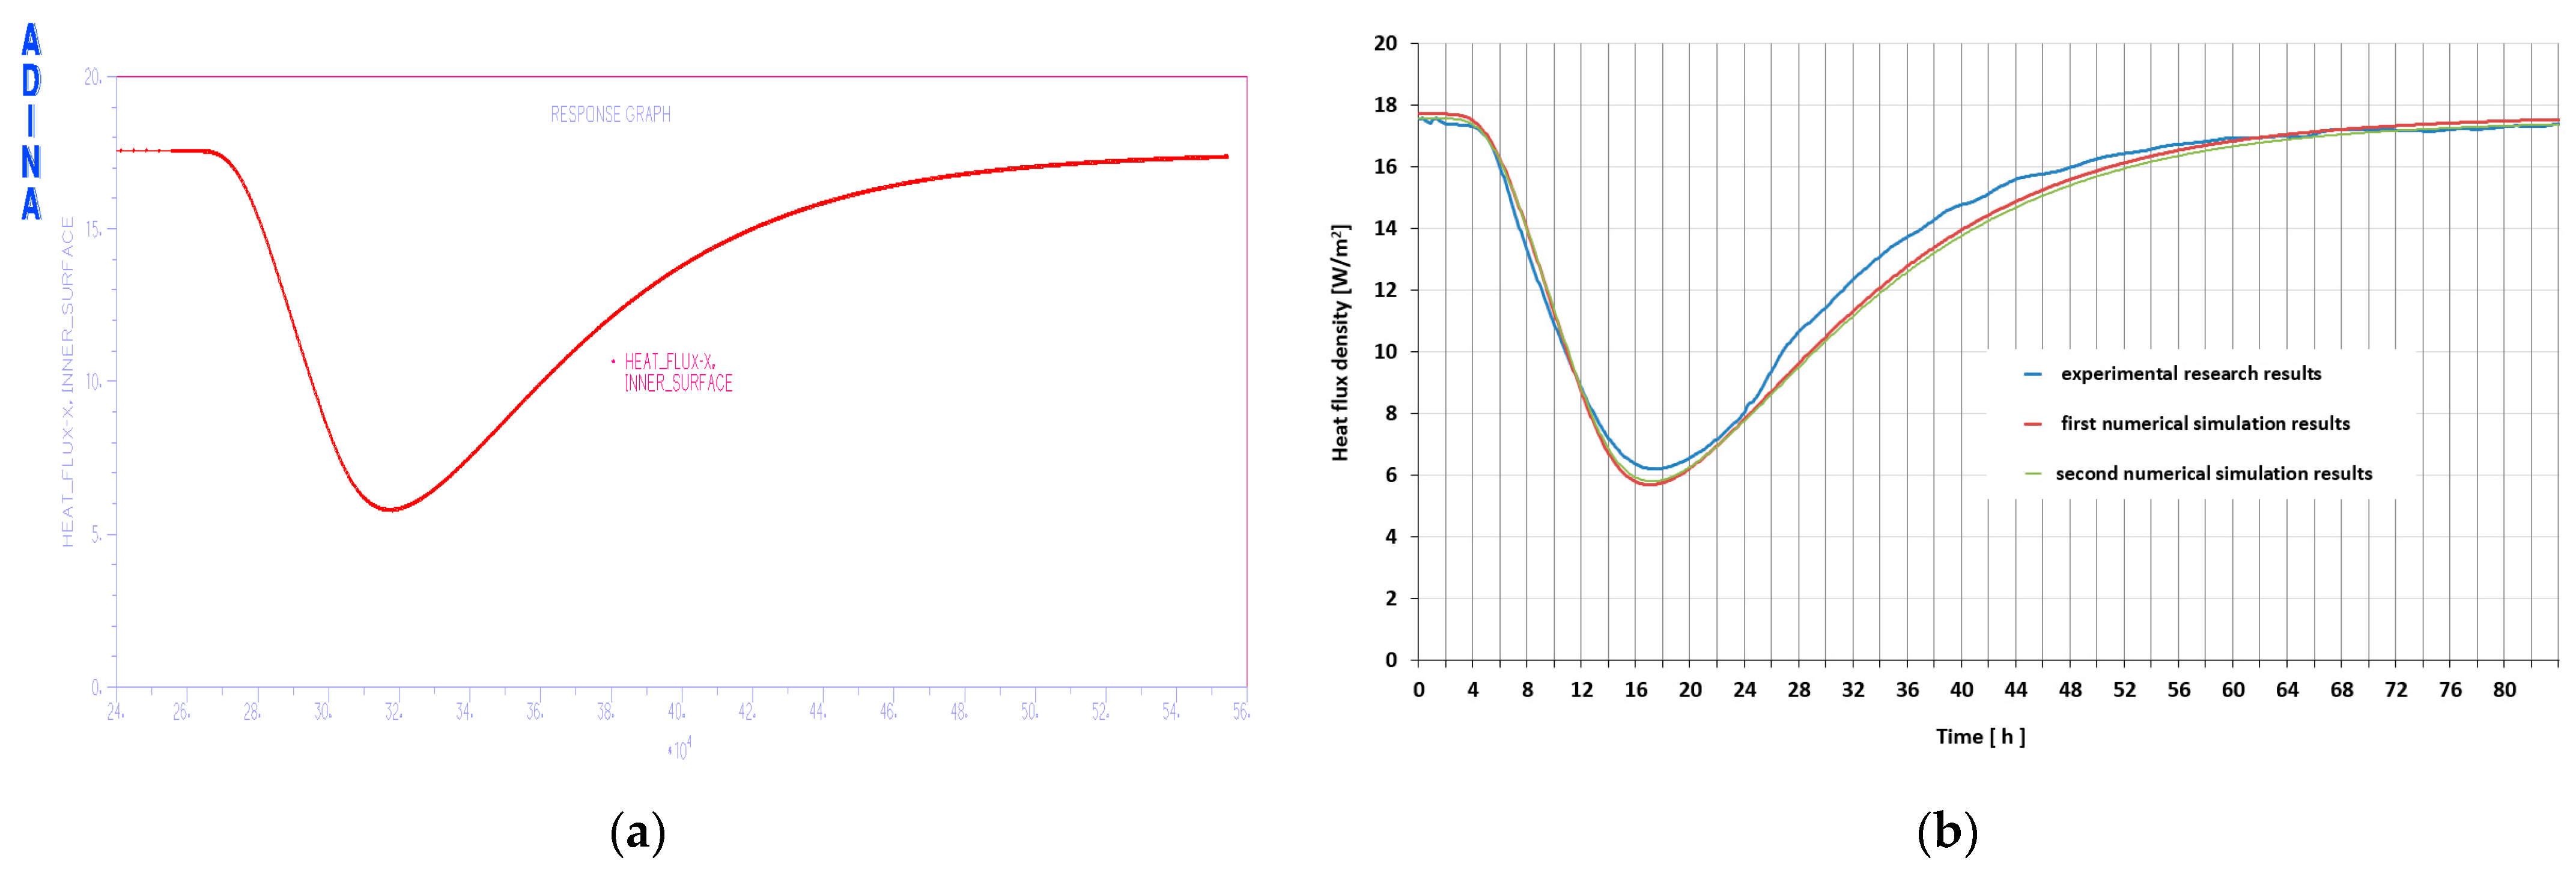
During the conducted numerical simulations, good compatibility of the simulation results with the results of direct tests was obtained. After analyzing the obtained heat flux values over the entire time interval, it turns out that the average difference between the heat flux value calculated in the simulation and the flux value from the experimental tests is 0.399 W/m2 for the first simulation and 0.441 W/m2 for the second simulation. This gives an error value in reference to the measured flux value of 2.82% for the first simulation and 3.12% for the second simulation. It should be noted that these values are important, but do not exceed the accuracy of the sensors used in the experimental measurements.
Also visible is a very high convergence of the results obtained between the numerical simulations. The maximum difference in the value of the calculated heat flux on the inner surface between the results obtained during the first and second simulations for the entire simulation period is 0.190 W/m2, which gives an error value in relation to the measured flux value of 1.35%.
The performed numerical simulation confirmed the correctness of using the heating plate as a source of absorbed solar radiation.
5. Conclusions
The conducted research shows that in the B1 and B2 barriers, there was a phase change in the PCM layer. In order to obtain a phase change in barrier, glazing with a high value of the g transmittance coefficient should be used. The use of glazing with a lower value of the transmittance coefficient g and a lower value of the coefficient U (B3 barrier) requires the supply of more energy in order to occur a phase change in the PCM.
The presented research in relation to the research conducted in real test chambers enables the simulation of any assumed external conditions and allows to eliminate the overlapping of thermal waves that occur in the following days during tests in real climatic conditions. In laboratory tests, we can simulate any external thermal load system in any time intervals.
The obtained results suggest that the most effective barrier for “sunny days” is the B1 barrier at the outside temperature Te = 0.0 °C and Te = −10.0 °C. The B2 barrier is suitable for alternating days in the cycle: “sunny day”, “cloudy day”, etc. However, the B3 barrier is the most advantageous in periods with a predominance of “cloudy days”.
In order to obtain broader, documented knowledge on the functioning of a collector-storage wall modified with a phase change material in various heating and cooling cycles, there is a need for further long-term studies. The conducted research indicated the need to be continued in order to answer a number of questions that arose during the preparation of the results and their analysis:
How will the dynamics of the barrier develop after the next several heating cycles (2, 3, 4, ...), treating them as sunny days?
How will the barrier behave after the next few cycles of alternating heating (sunny day) and cooling down (cloudy day), e.g., “two sunny days” plus “two cloudy days”; “two sunny days” plus “one cloudy day”; “one sunny day” plus “two cloudy days”; etc.?
The carried out numerical simulations showed a high compatibility of the obtained results in relation to the results of the experimental tests. This provides the basis for using numerical simulations to analyze the behavior of thermal processes taking place in the barrier also for other load conditions or other boundary conditions.
The consistency of the results obtained in the first and second numerical simulations confirmed the correctness of using the heating plate as a heat source in the thermal storage wall resulting from the absorption of solar radiation.
Research on the variants mentioned will be continued in laboratory conditions. Variable parameters of PCM-modified masonry material and glazing will also be taken into account. At the same time, the values of temperatures in the cold chamber and the values of thermal energy should be differentiated during the study of their influence on the thermal efficiency of the barrier. It will also be necessary to conduct research in real climatic conditions, because in such conditions, there are more variables influencing the effect of the barrier’s operation (wind, precipitation, etc.).


