Article

Power Enhancement of a PV Module Using Different Types of Phase Change Materials

1
SDM Research Group, The International University of Beirut BIU, Beirut 146404, Lebanon
2
Mechanical Department, Lebanese International University LIU, Bekaa 1803, Lebanon
3
Faculty of Engineering, Section III, Lebanese University, Beirut 6573/14, Lebanon
*
Author to whom correspondence should be addressed.
Energies 2021, 14(16), 5195; https://doi.org/10.3390/en14165195
Submission received: 13 July 2021 / Revised: 13 August 2021 / Accepted: 15 August 2021 / Published: 23 August 2021

Abstract

:
Photovoltaic (PV) systems are well-known systems that convert solar energy into electrical energy. Increases in operating temperature induce a drop in conversion efficiency and, thus, in the output power produced by the panel. This paper investigates the effectiveness of using Phase Change Materials (PCMs) in cooling PV modules. Due to its high storage density with limited temperature fluctuations, the latent heat storage in a PCM is an important factor. This depends on the thermophysical properties of PCMs such as the melting point, specific heat capacity, latent heat, density, etc. This paper aims to make a comparison between four types of PCM with different melting points and physical properties. Indoor experimental studies were performed using five prototypes. A halogen lamp was used as a solar simulator to ensure that experiments were carried out under the same irradiance. The first prototype was the reference, which consisted of a PV panel, a stand, and an electric circuit without PCMs. Four other prototypes were investigated, consisting of a PV panel with a container added at the rear face, with each having different types of PCM: sodium sulfate decahydrate, sodium phosphate dibasic dodecahydrate, decanoic acid, and calcium chloride hexahydrate, respectively. The results clearly show the effect of PCMs’ properties on PV temperature profile and power generation.

1. Introduction

Solar energy is one of the most attractive sources of green energy production nowadays. Photovoltaic cells—a type of solar energy production mainly used to convert sunlight energy into electricity—suffer from a drop in efficiency at peak temperatures. Thus, a cooling technique should be used in order to deal with this issue. Several passive and active cooling techniques are found in the literature. A passive technique such as buoyancy-driven air flow in a duct was used by Brinkworth [1]. PCM cooling techniques were also used by other researchers [2,3,4,5,6]. Active techniques are mainly water and air flow-based techniques [7]. Due to the weight of water required, water cooling may be unsuitable [7]. Water is scarce in some places, such as deserts, where the sun’s irradiation is high. In addition, using air or water in active cooling systems adds to maintenance and running costs. At the current time, PCM is the most reliable technique for cooling and regulating the temperature of PV panels, as well as increasing their electrical efficiency.
PCMs classified as latent heat storage materials are increasingly being used in solar systems [8,9,10,11], buildings [12], waste heat recovery [13,14], and load leveling for power generation [15]. The electric power generated by a PV module is affected by its temperature.
Skoplaki and Palyvos [16] performed a study on commercial silicon-based cells where they found that only 10 to 20% of radiation is transformed into electric power and the remaining 80 to 90% into heat. This high percentage of heat will definitely increase the temperature of the panel, and then, affect its performance. Mahamudul et al. [17] found in their study that it is important to maintain a temperature of around 25 °C for 1000 W/m2 irradiation in order to ensure a high efficiency of energy generation by the panel.
PCM cooling is considered a recent and promising technique. Due to their high heat of fusion, PCMs are able to absorb a high amount of energy before melting, ensuring a stable temperature during the transition phase. In a recent review, Browne et al. [18] studied the efficiency of the PV cooling technique using PCMs. They concluded that this technique needs to be improved more. In this context, the present work exhibits an experimental study on the effects of using different types of PCMs with different thermophysical properties on the thermal behavior and electrical performance of a PV panel.
PCMs are characterized by thermophysical properties such as specific heat capacity (Cp), thermal conductivity (k), latent heat of fusion (H), melting point (Tm), and density (ρ). For example, choosing a PCM in cooling an electronic device [19,20,21,22] based on its melting point—that should be close to the efficient temperature—might be inadequate if the latent heat of fusion is small.
Hence, the following overview describes the novel contributions of this paper. A wide range of PCMs with different thermophysical properties are considered to analyze the effect of each property (k, Cp, and Tm) on the performance of cooling a PV module by PCM. The thermal diffusivity is then calculated in order to back up the conclusions.

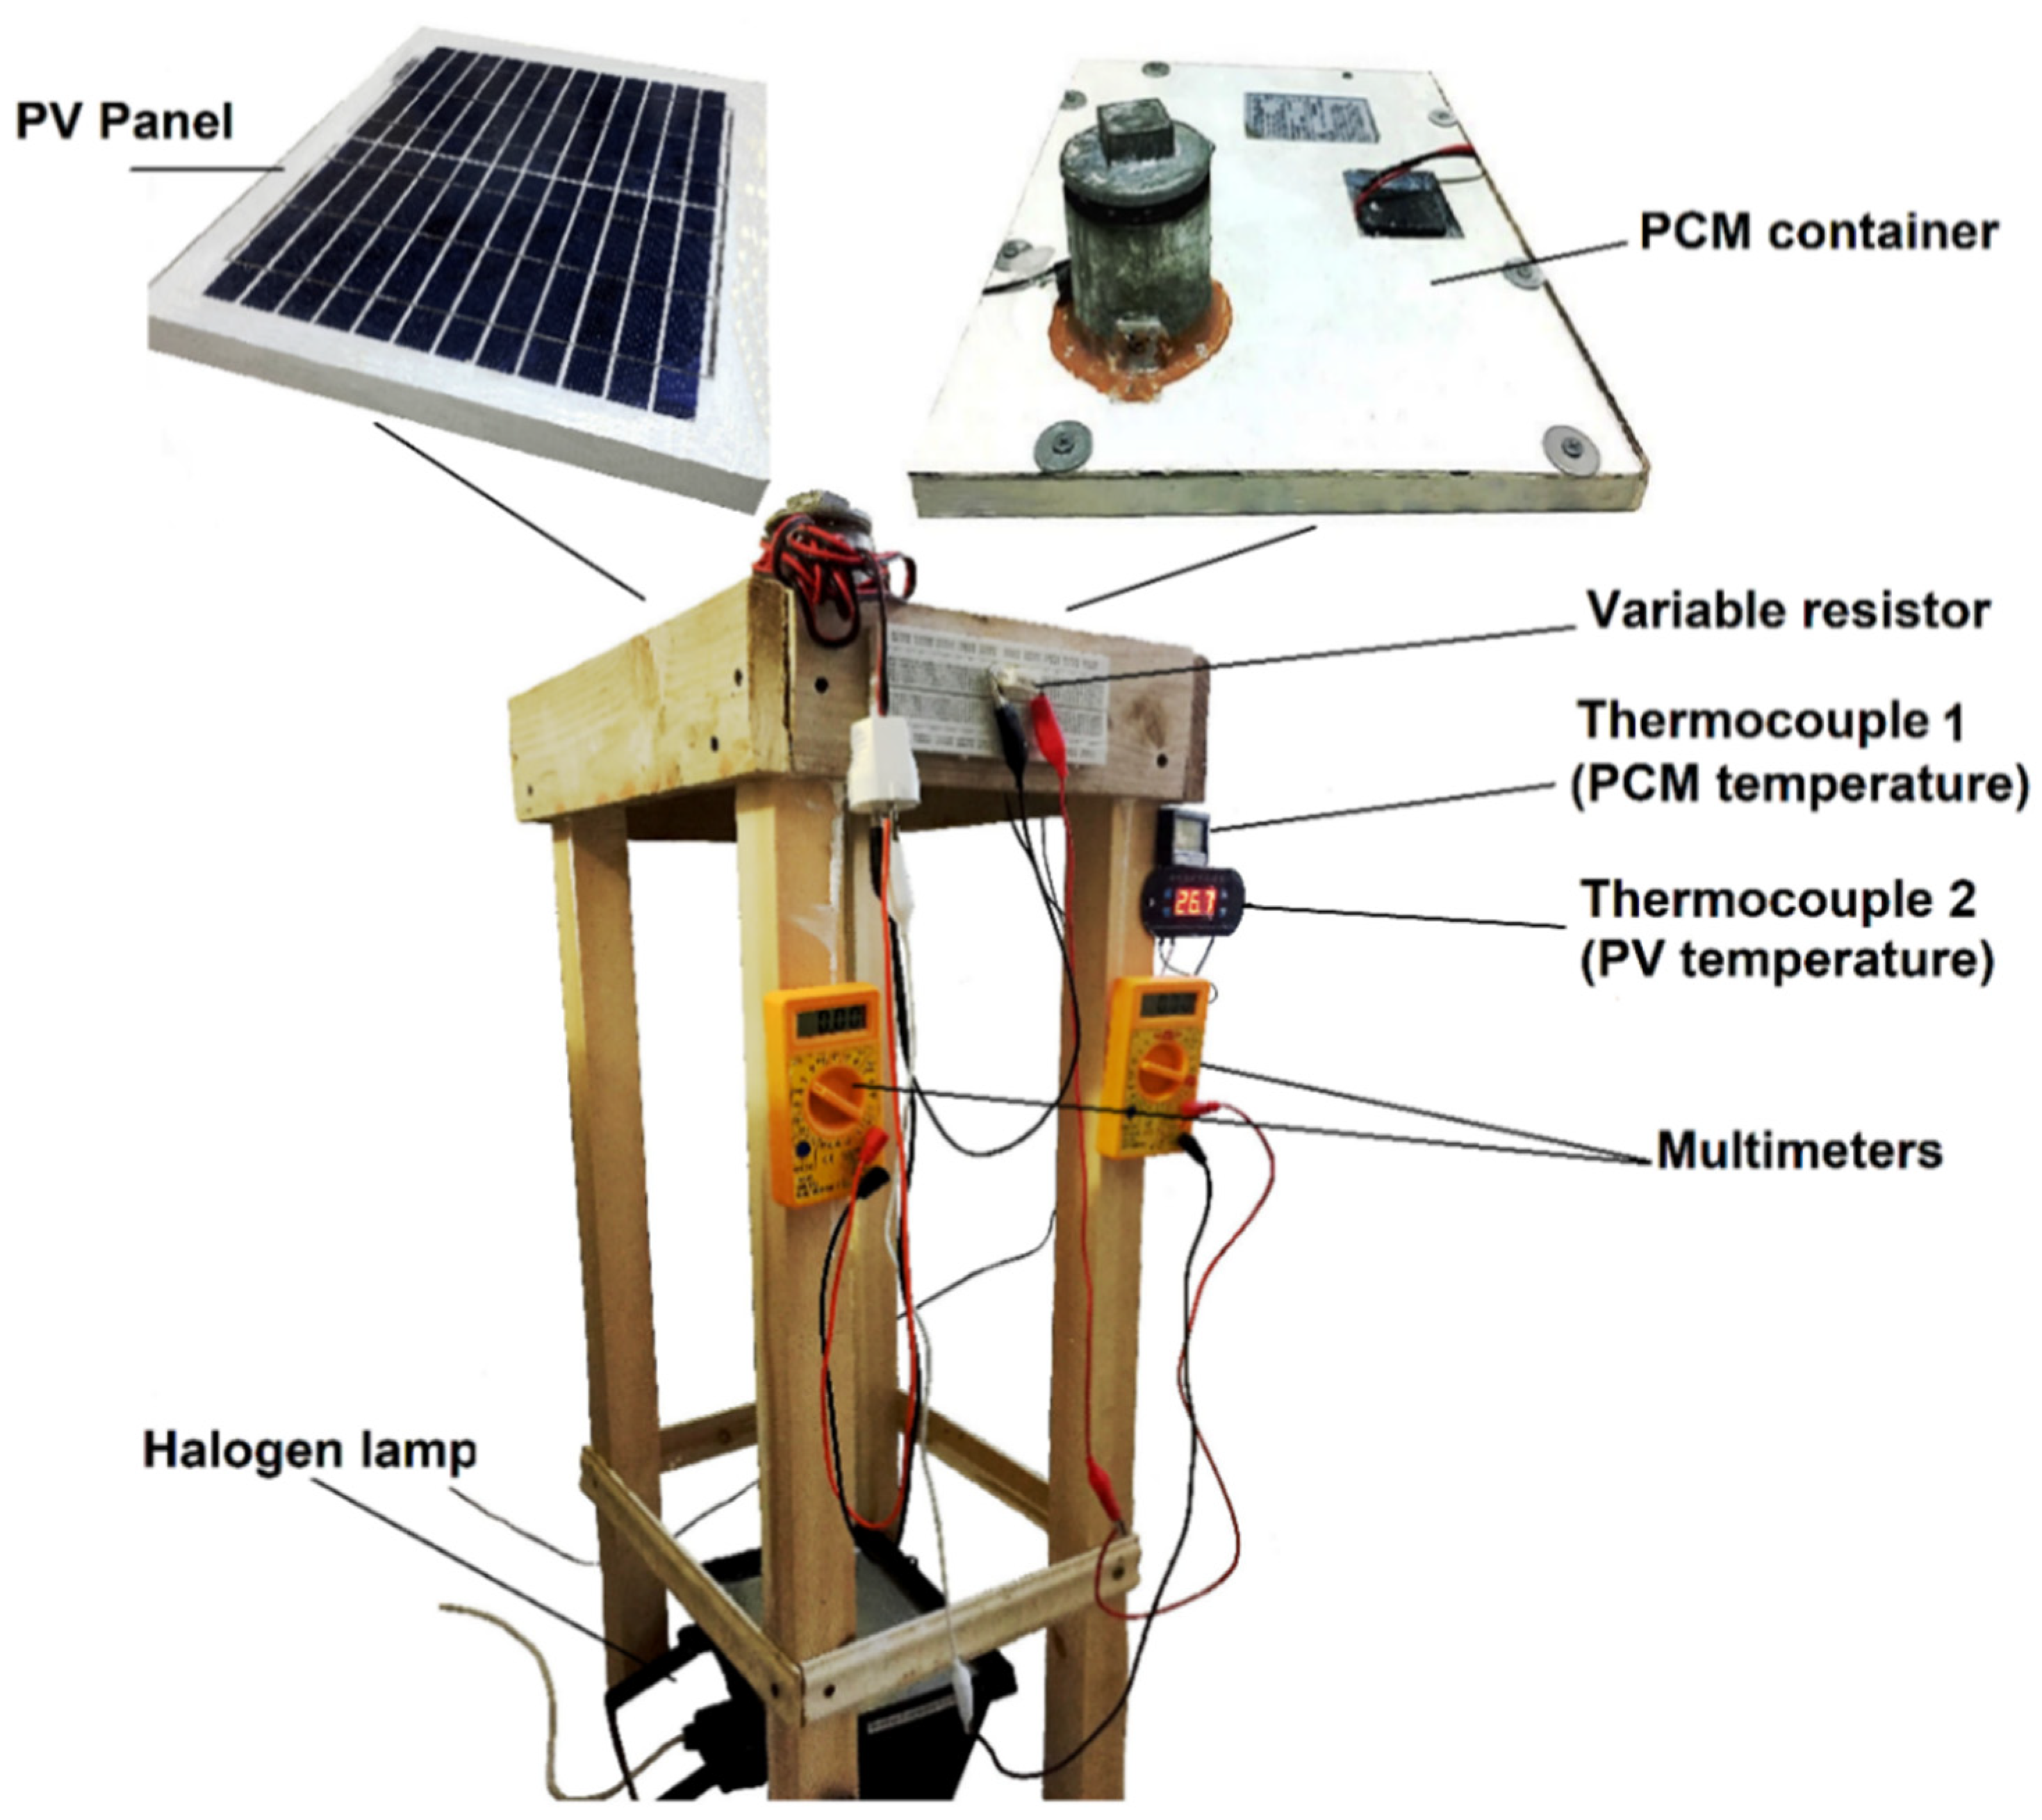
2. Experimental Setup
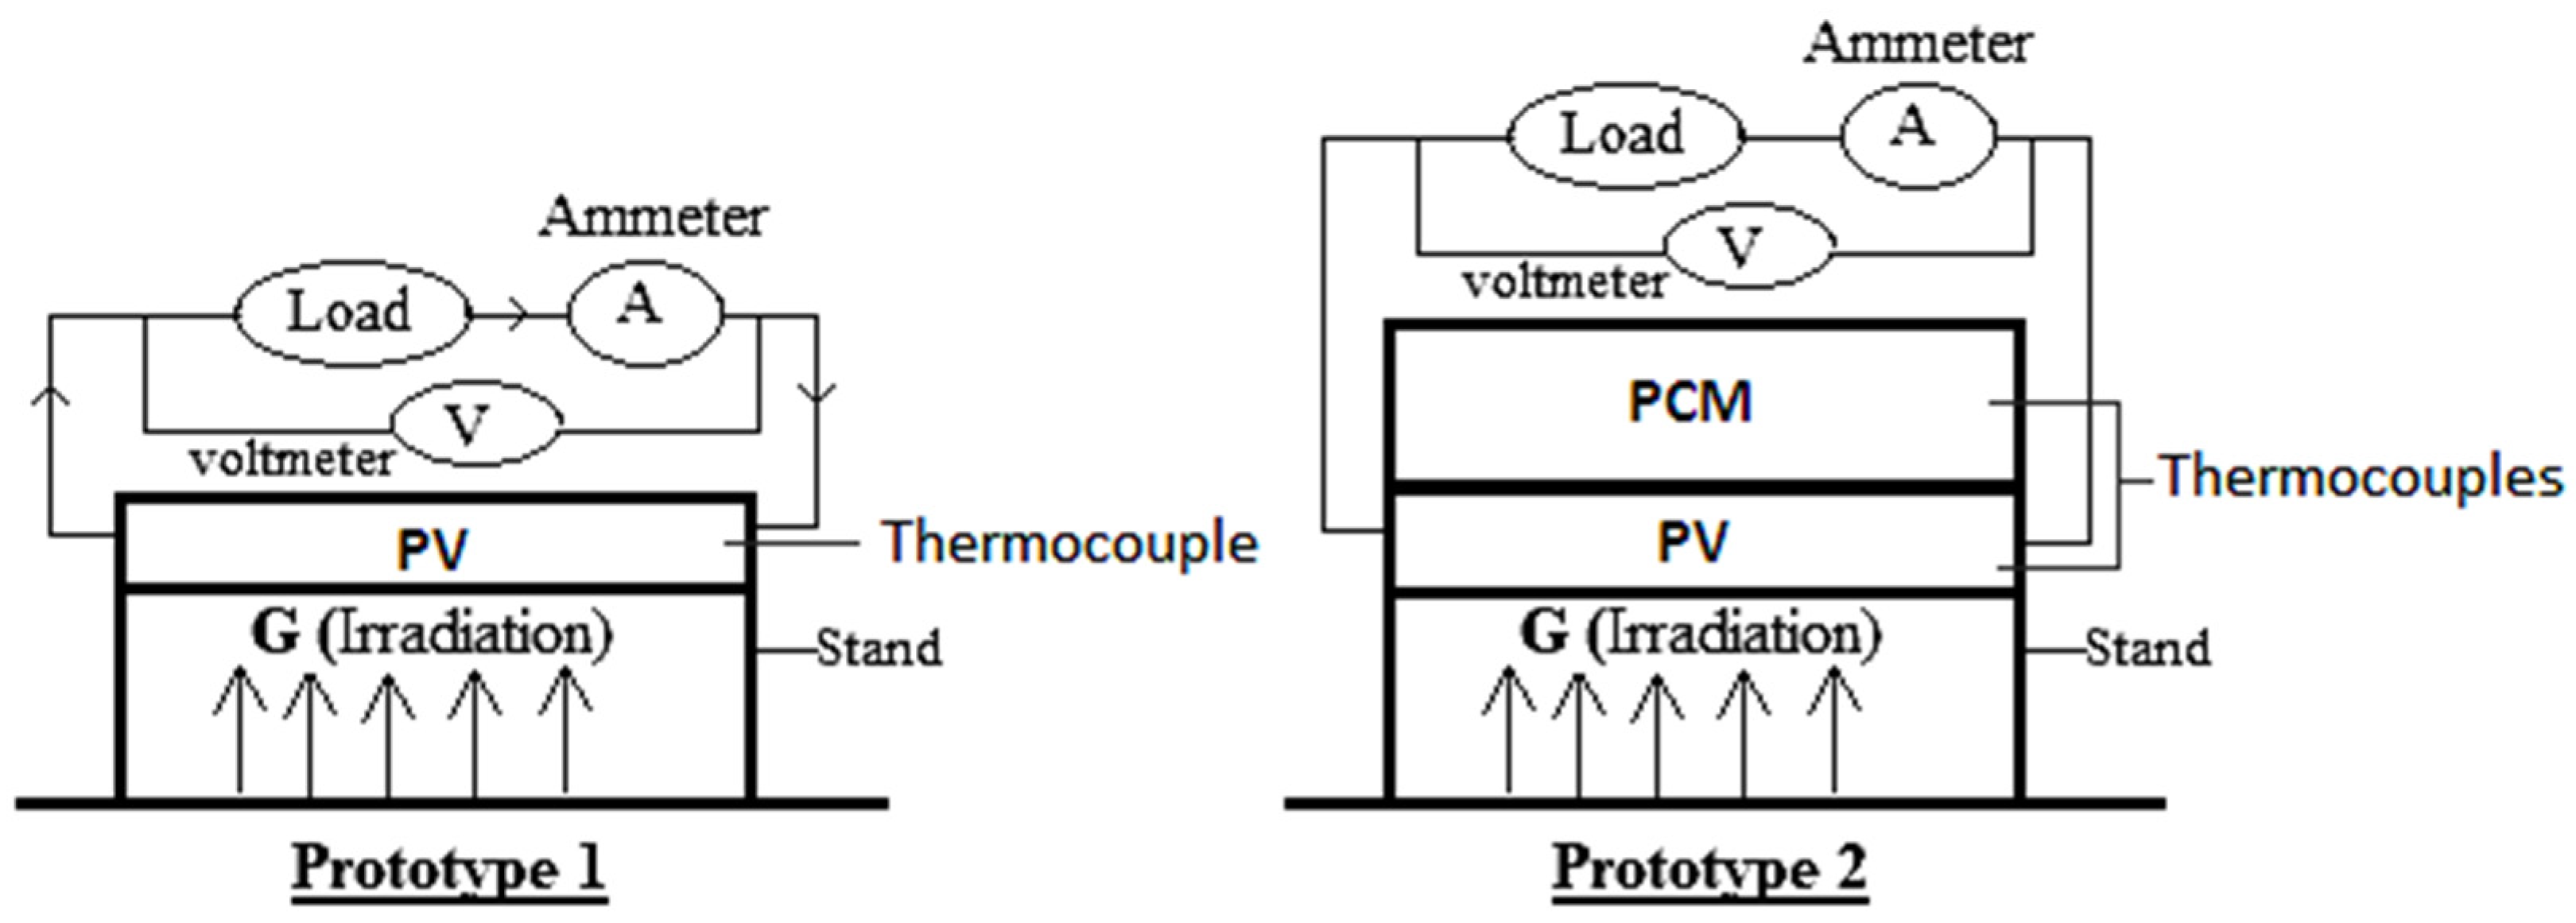
2.1. Setup

Two prototypes were designed wherein four different PCMs were tested in order to assess the influence of thermophysical properties on the PV’s performance. Figure 1 shows a draft of these prototypes.
Prototype 1 was the reference, which consisted of a 10 watts polycrystalline PV panel without PCM. Prototype 2 consisted of the PV panel with a container added at the rear face, with each having different types of PCM: sodium sulfate decahydrate (PCM 1), sodium phosphate dibasic dodecahydrate (PCM 2), decanoic acid (PCM 3), and calcium chloride hexahydrate (PCM 4), respectively.
The experimental setup is presented in Figure 2. The panel was fixed upside down at the point where the PCM container was built at the back and closed with a fiberboard to prevent corrosion. The temperature of the PV panel was measured using a thermocouple located on the outer surface of the panel as shown in Figure 2. Another thermocouple placed inside the PCM container was used to measure PCM temperature.

2.2. PCMs Used

The melting point is basically the first parameter to check when selecting a PCM for a defined application. For example, in air conditioning applications, the melting point of a PCM should be below 15 °C, while in refrigeration applications, the melting point should be above 90 °C [23,24]. PCMs with a melting point between the above values can be used in solar heating applications [25].
In this paper, four types of PCM were bought from Sigma Aldrich Company [26]: sodium sulfate decahydrate, sodium phosphate dibasic dodecahydrate, decanoic acid, and calcium chloride hexahydrate. The choice of these PCMs was based on several parameters: melting point, latent heat of fusion, cost, and availability on the market.
The thermophysical properties of these PCMs were measured using a device manufactured by [27], since the values provided by the company may change due to storage, transportation, etc. Indeed, the measured values of K, Cp, and the melting point were in the same range as those provided by the company. In addition, the melting temperature of the 4 PCMs ranged between 29 °C and 40 °C, which is suitable for solar applications. Table 1 summarizes the measured thermophysical properties of these PCMs. The measurement of thermophysical properties was repeated four times to ensure the accuracy of the measured values.

2.3. Experimental Procedure

Indoor experiments were carried out in a room with ambient temperature around 20 °C. For the sake of simplicity, the thermal flux can be assumed to be mono-dimensional and orthogonal to the surface of the panel. In addition, the PV-PCM panel was set upside down to achieve total direct contact of the PCM with the backside of the panel. The steps involved in the experimental procedure are summarized as follows:
  • The five prototypes were fixed perpendicular to the light direction in an ambient temperature of 20 °C.
  • Using the Lux meter, the solar simulator (halogen lamp) was placed at a defined distance away from the prototype in order to ensure an irradiance of 1000 W/m2.
  • The measuring tools were connected to the PV system.
  • The experiment was conducted at maximum power transmission for an appropriate amount of time.
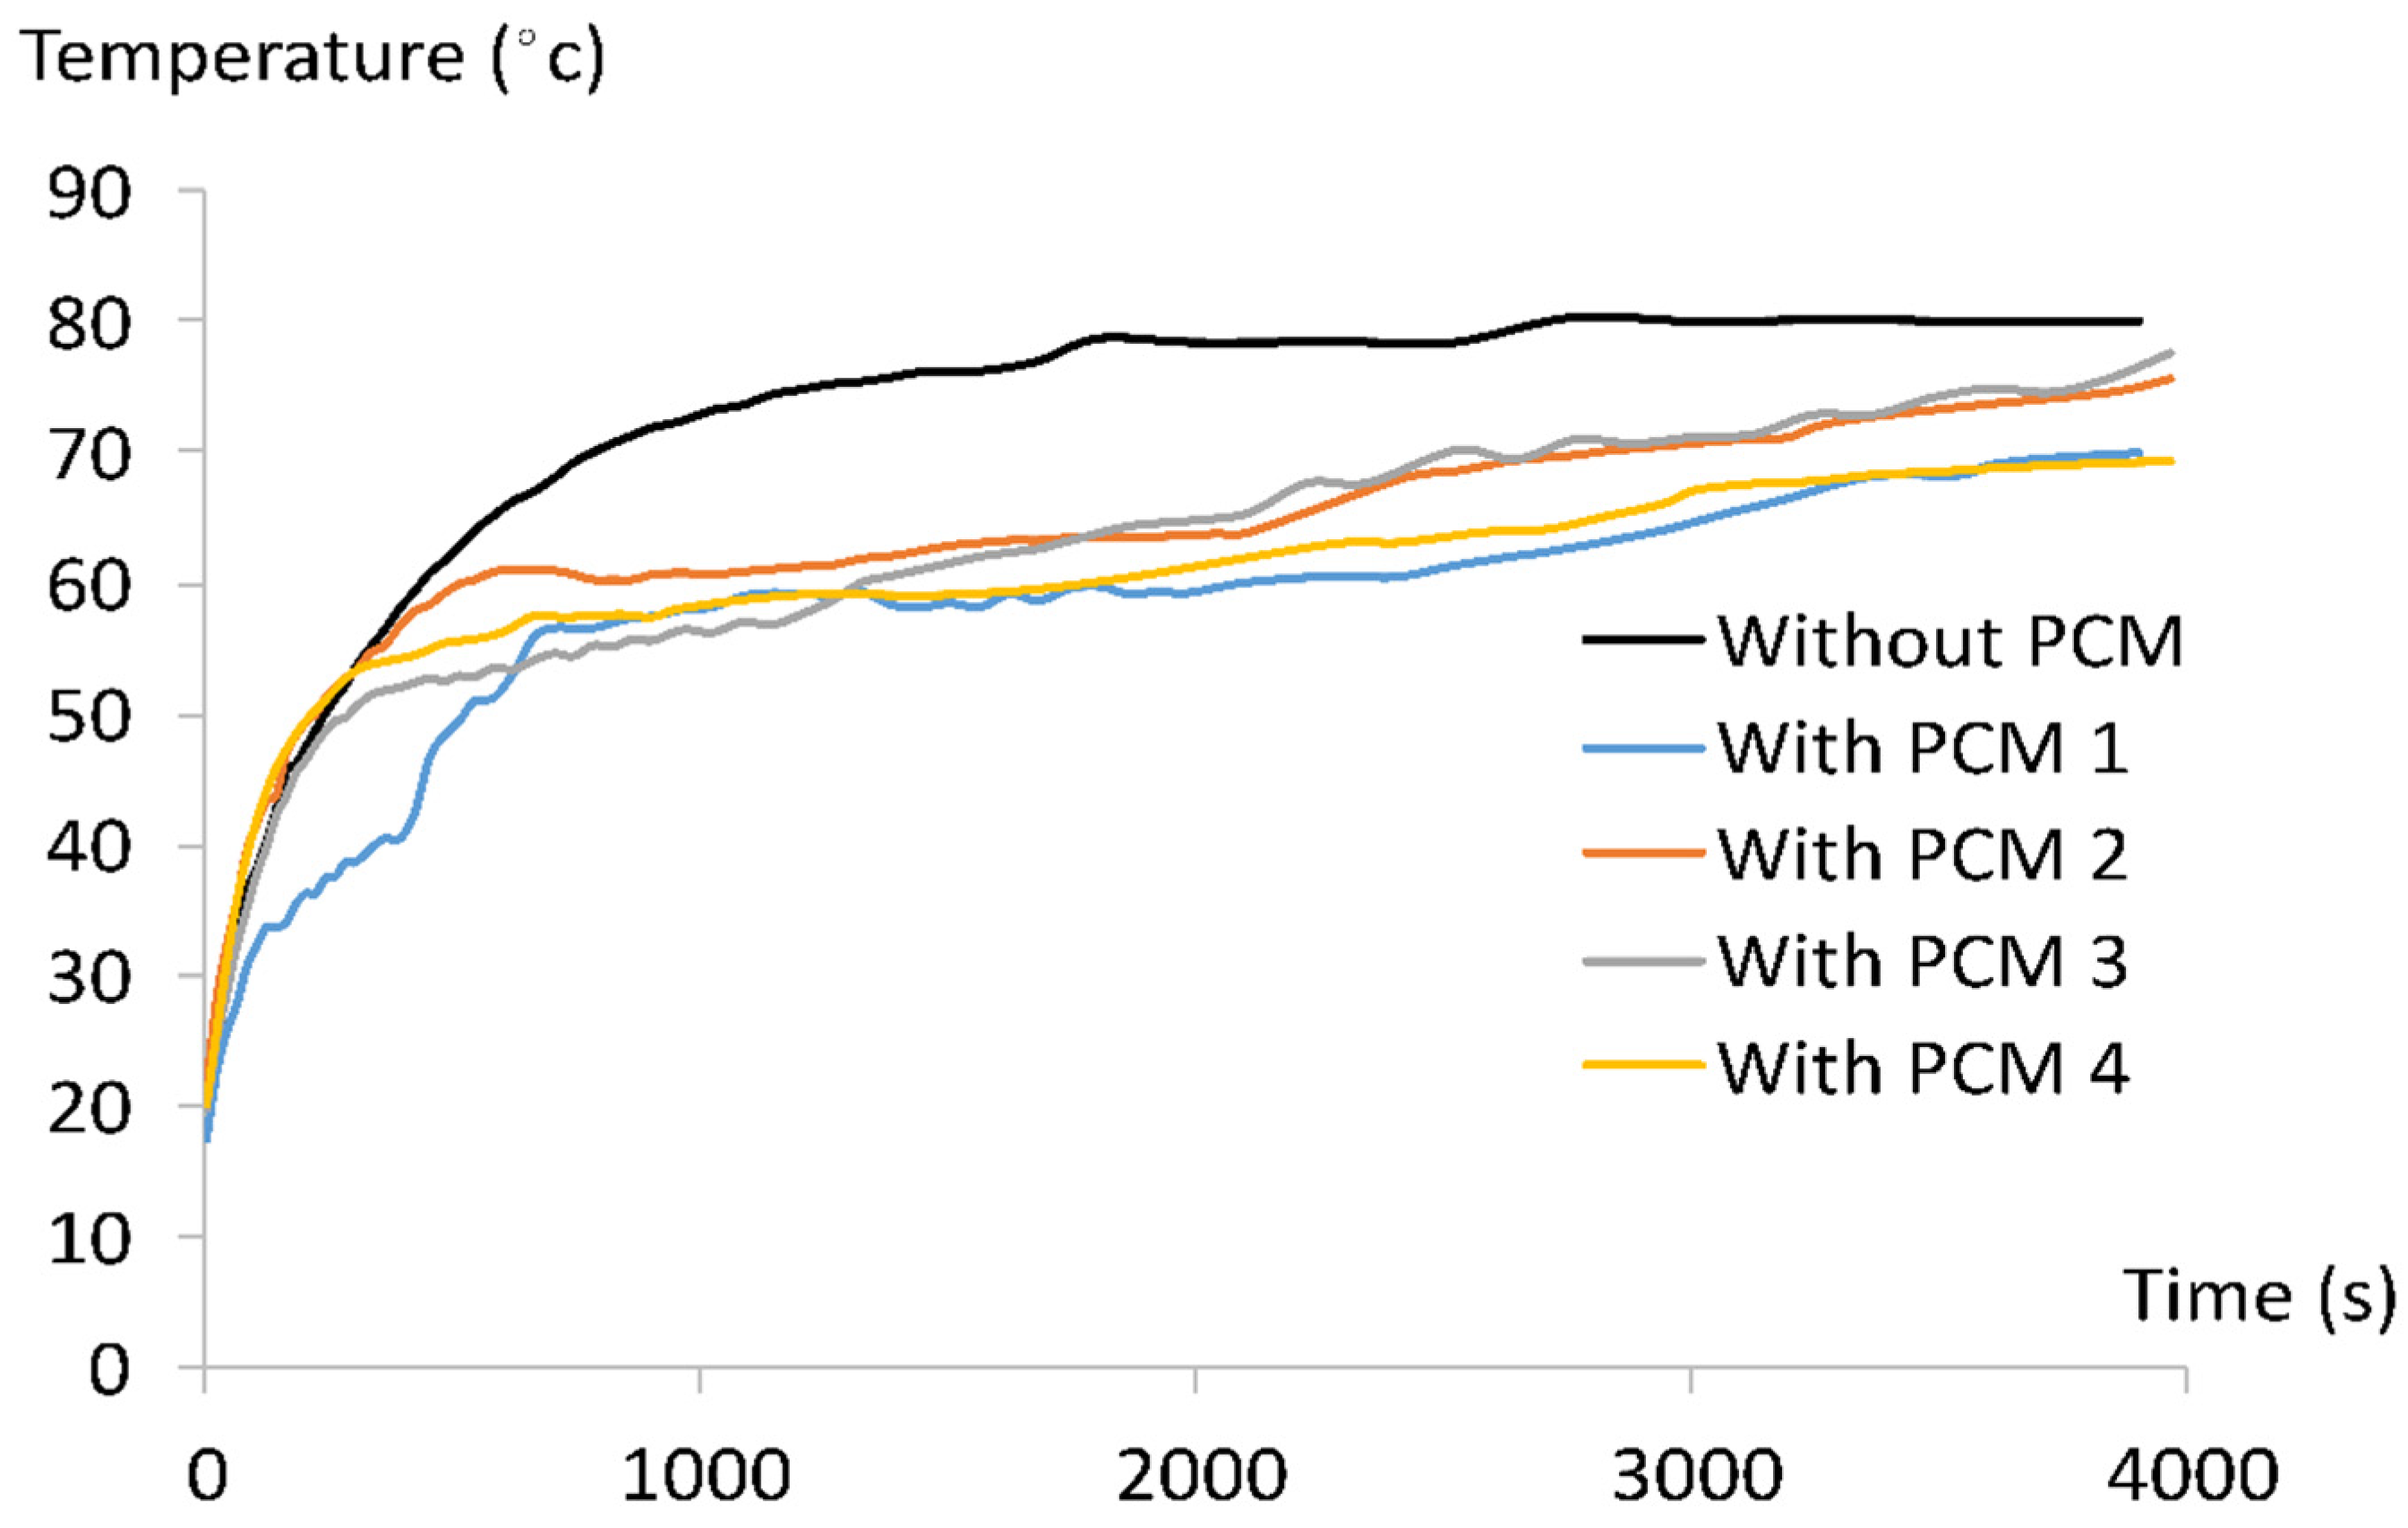
  • The output voltages and currents were recorded for different resistors. In addition, the temperatures of the PV panel during the experiment were recorded as a function of time. The sampling frequency was one reading every 20 s.
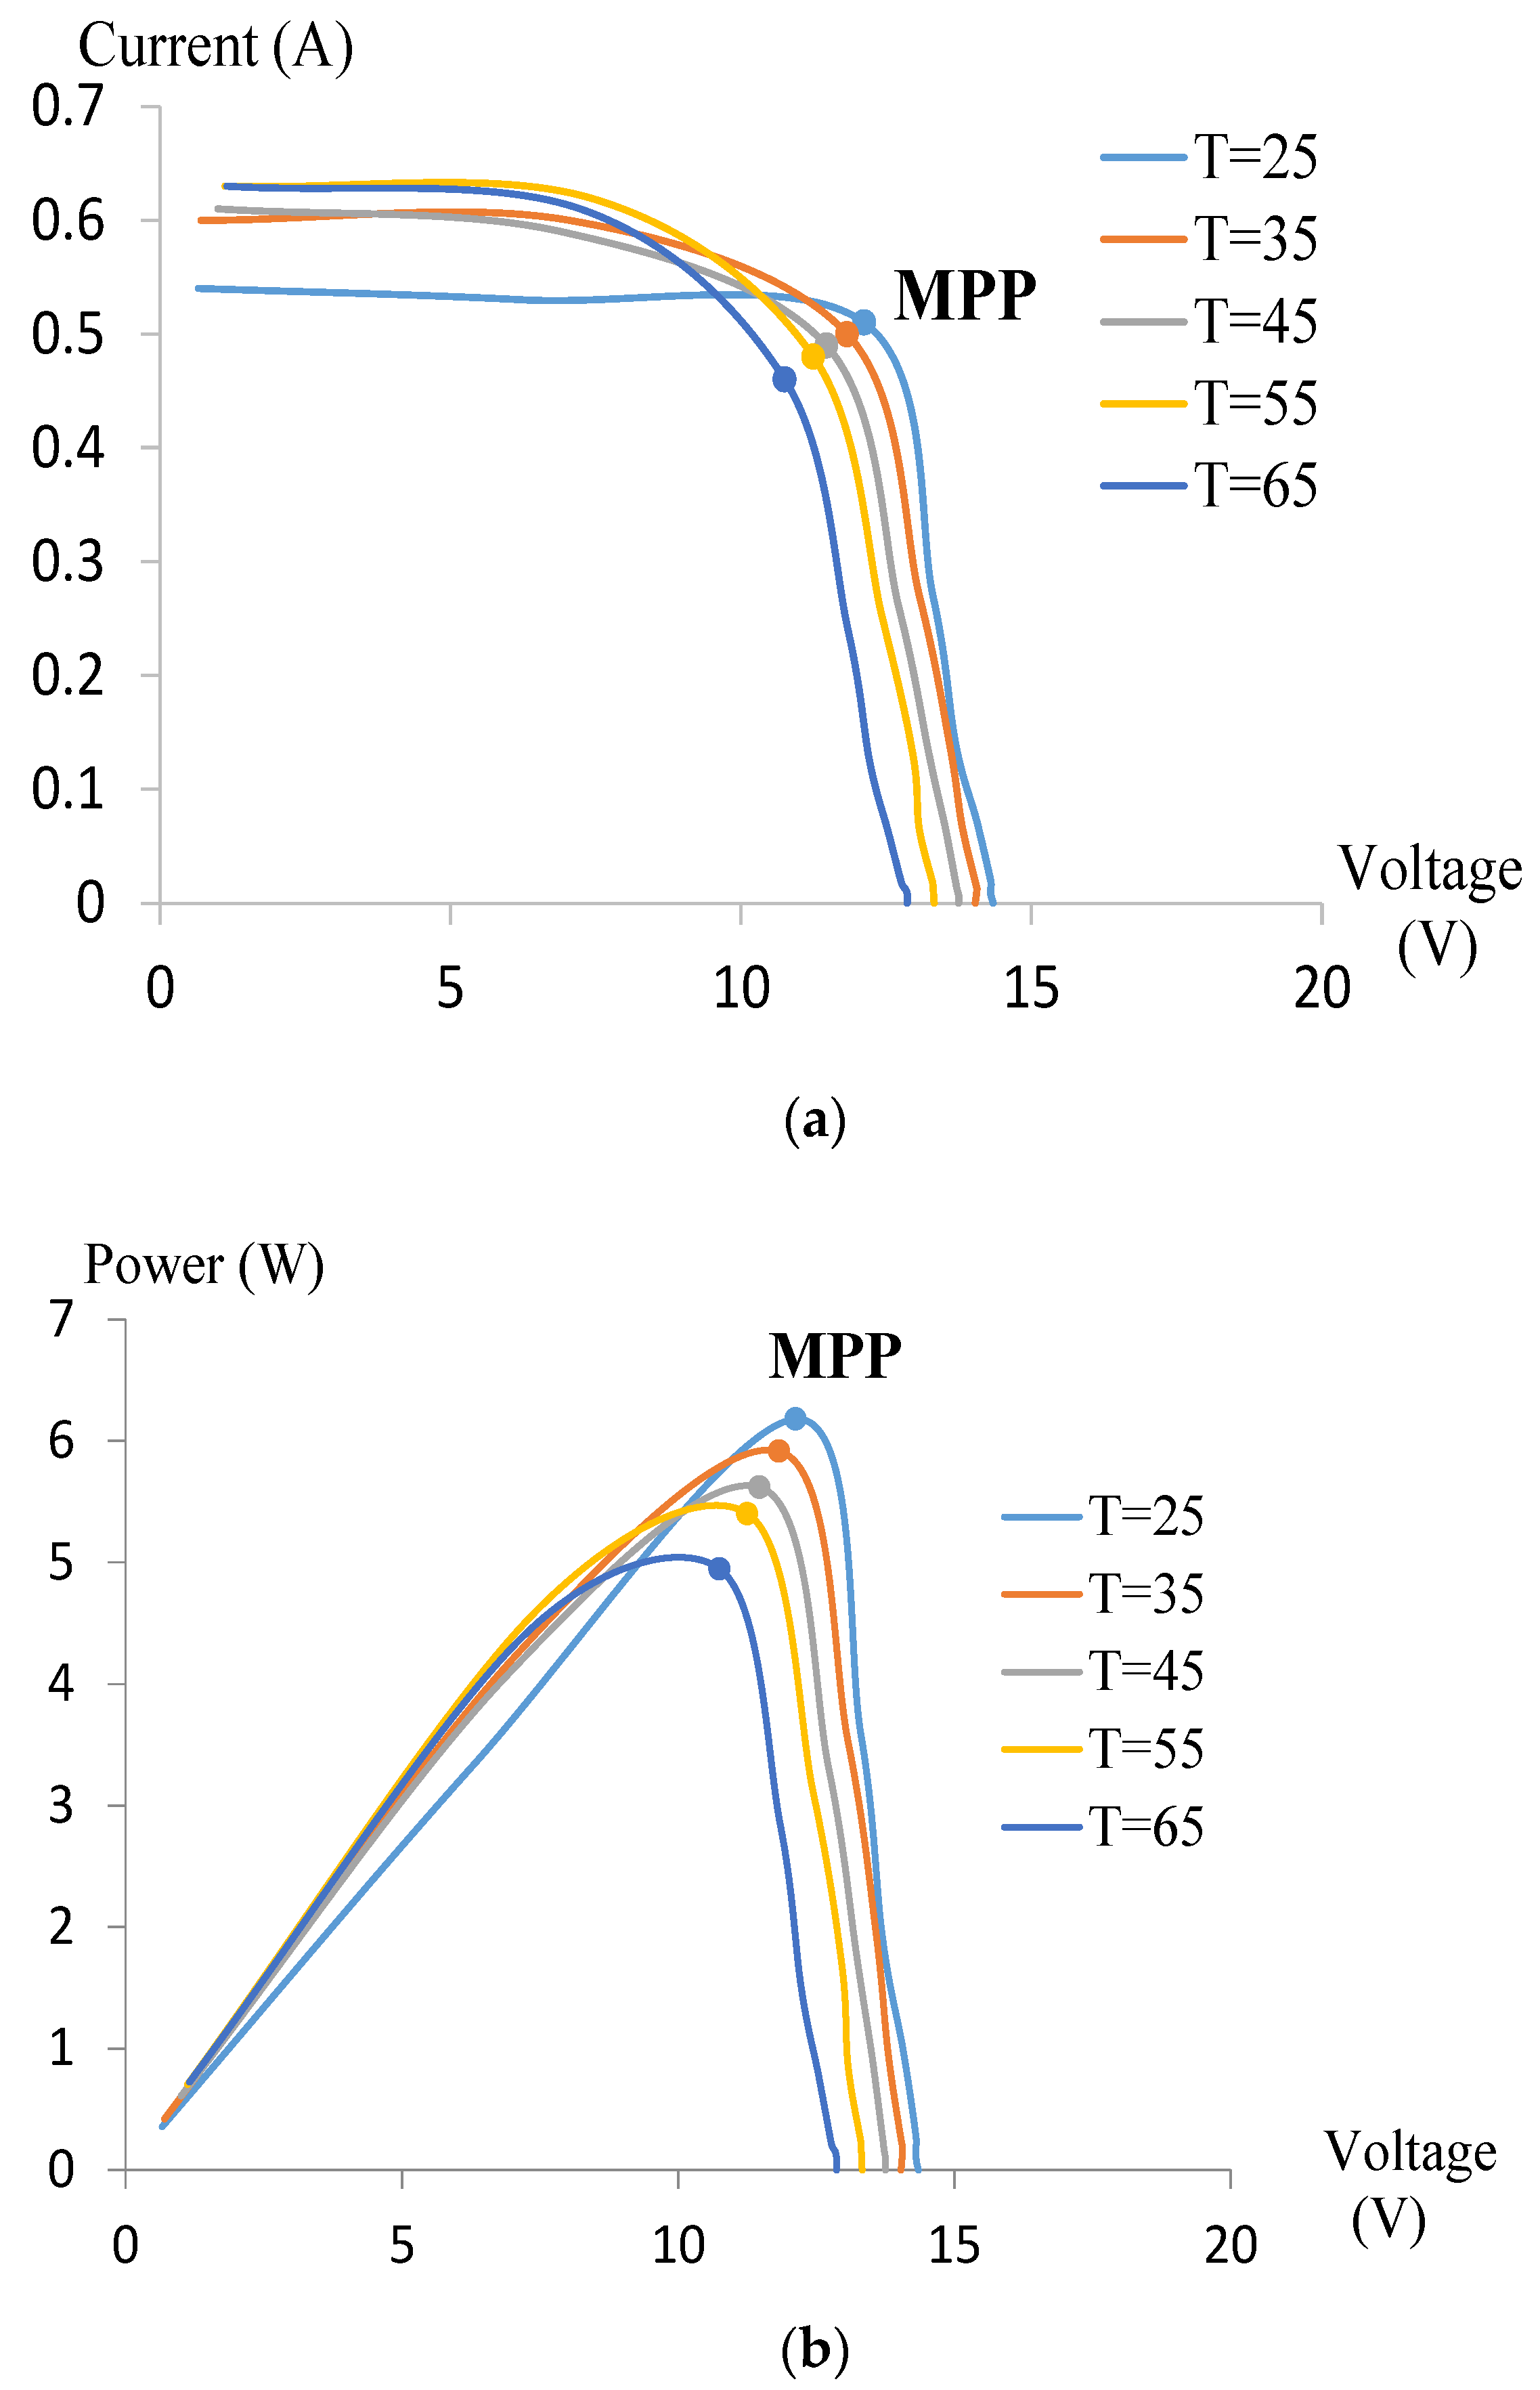
  • Different graphs were drawn based on the obtained results including the (I–V) curve, (P–V) curve, efficiency versus time, temperature versus time, and PV panel power versus time.

3. Results

3.1. Uncertainty Analysis

To assess confidence in the experimental results, an uncertainty analysis was performed. In the experimental setup, the uncertainty was due to several factors including the lux meter, thermocouples, voltmeter, and ammeter as summarized in Table 2.
The uncertainty of the used thermocouple was 0.5 °C for a minimum measurable value of 18 °C. Thus, the absolute uncertainty in % was et = 2.78%.
As for the lux meter, the uncertainty was el = 1.5%. However, the uncertainties of the voltmeter and the ammeter were eV = 1% and eA = 1%, respectively.
The total uncertainty of the experimental setup is the norm of the above uncertainties: e = e l 2 + e t 2 + e V 2 + e A 2 . Substituting all the above values in the equation of e, the total uncertainty was e = 3.46%, which is in the acceptable range.

3.2. Maximum Power Point (MPP)

To detect the MPP, (I–V) and (P–V) curves were drawn in Figure 3a,b, respectively. By keeping the irradiance and PV temperature constant, the relationship between the output power of the PV and the output voltage can be depicted by the P–V chart. As the temperature increased to 65 °C, a drop in the maximum output power from 6.2 W to 4.9 W was observed. At a load of 22 Ohms and a temperature of 25 °C, the MPP was obtained.

3.3. PCM and PV Temperature Variations

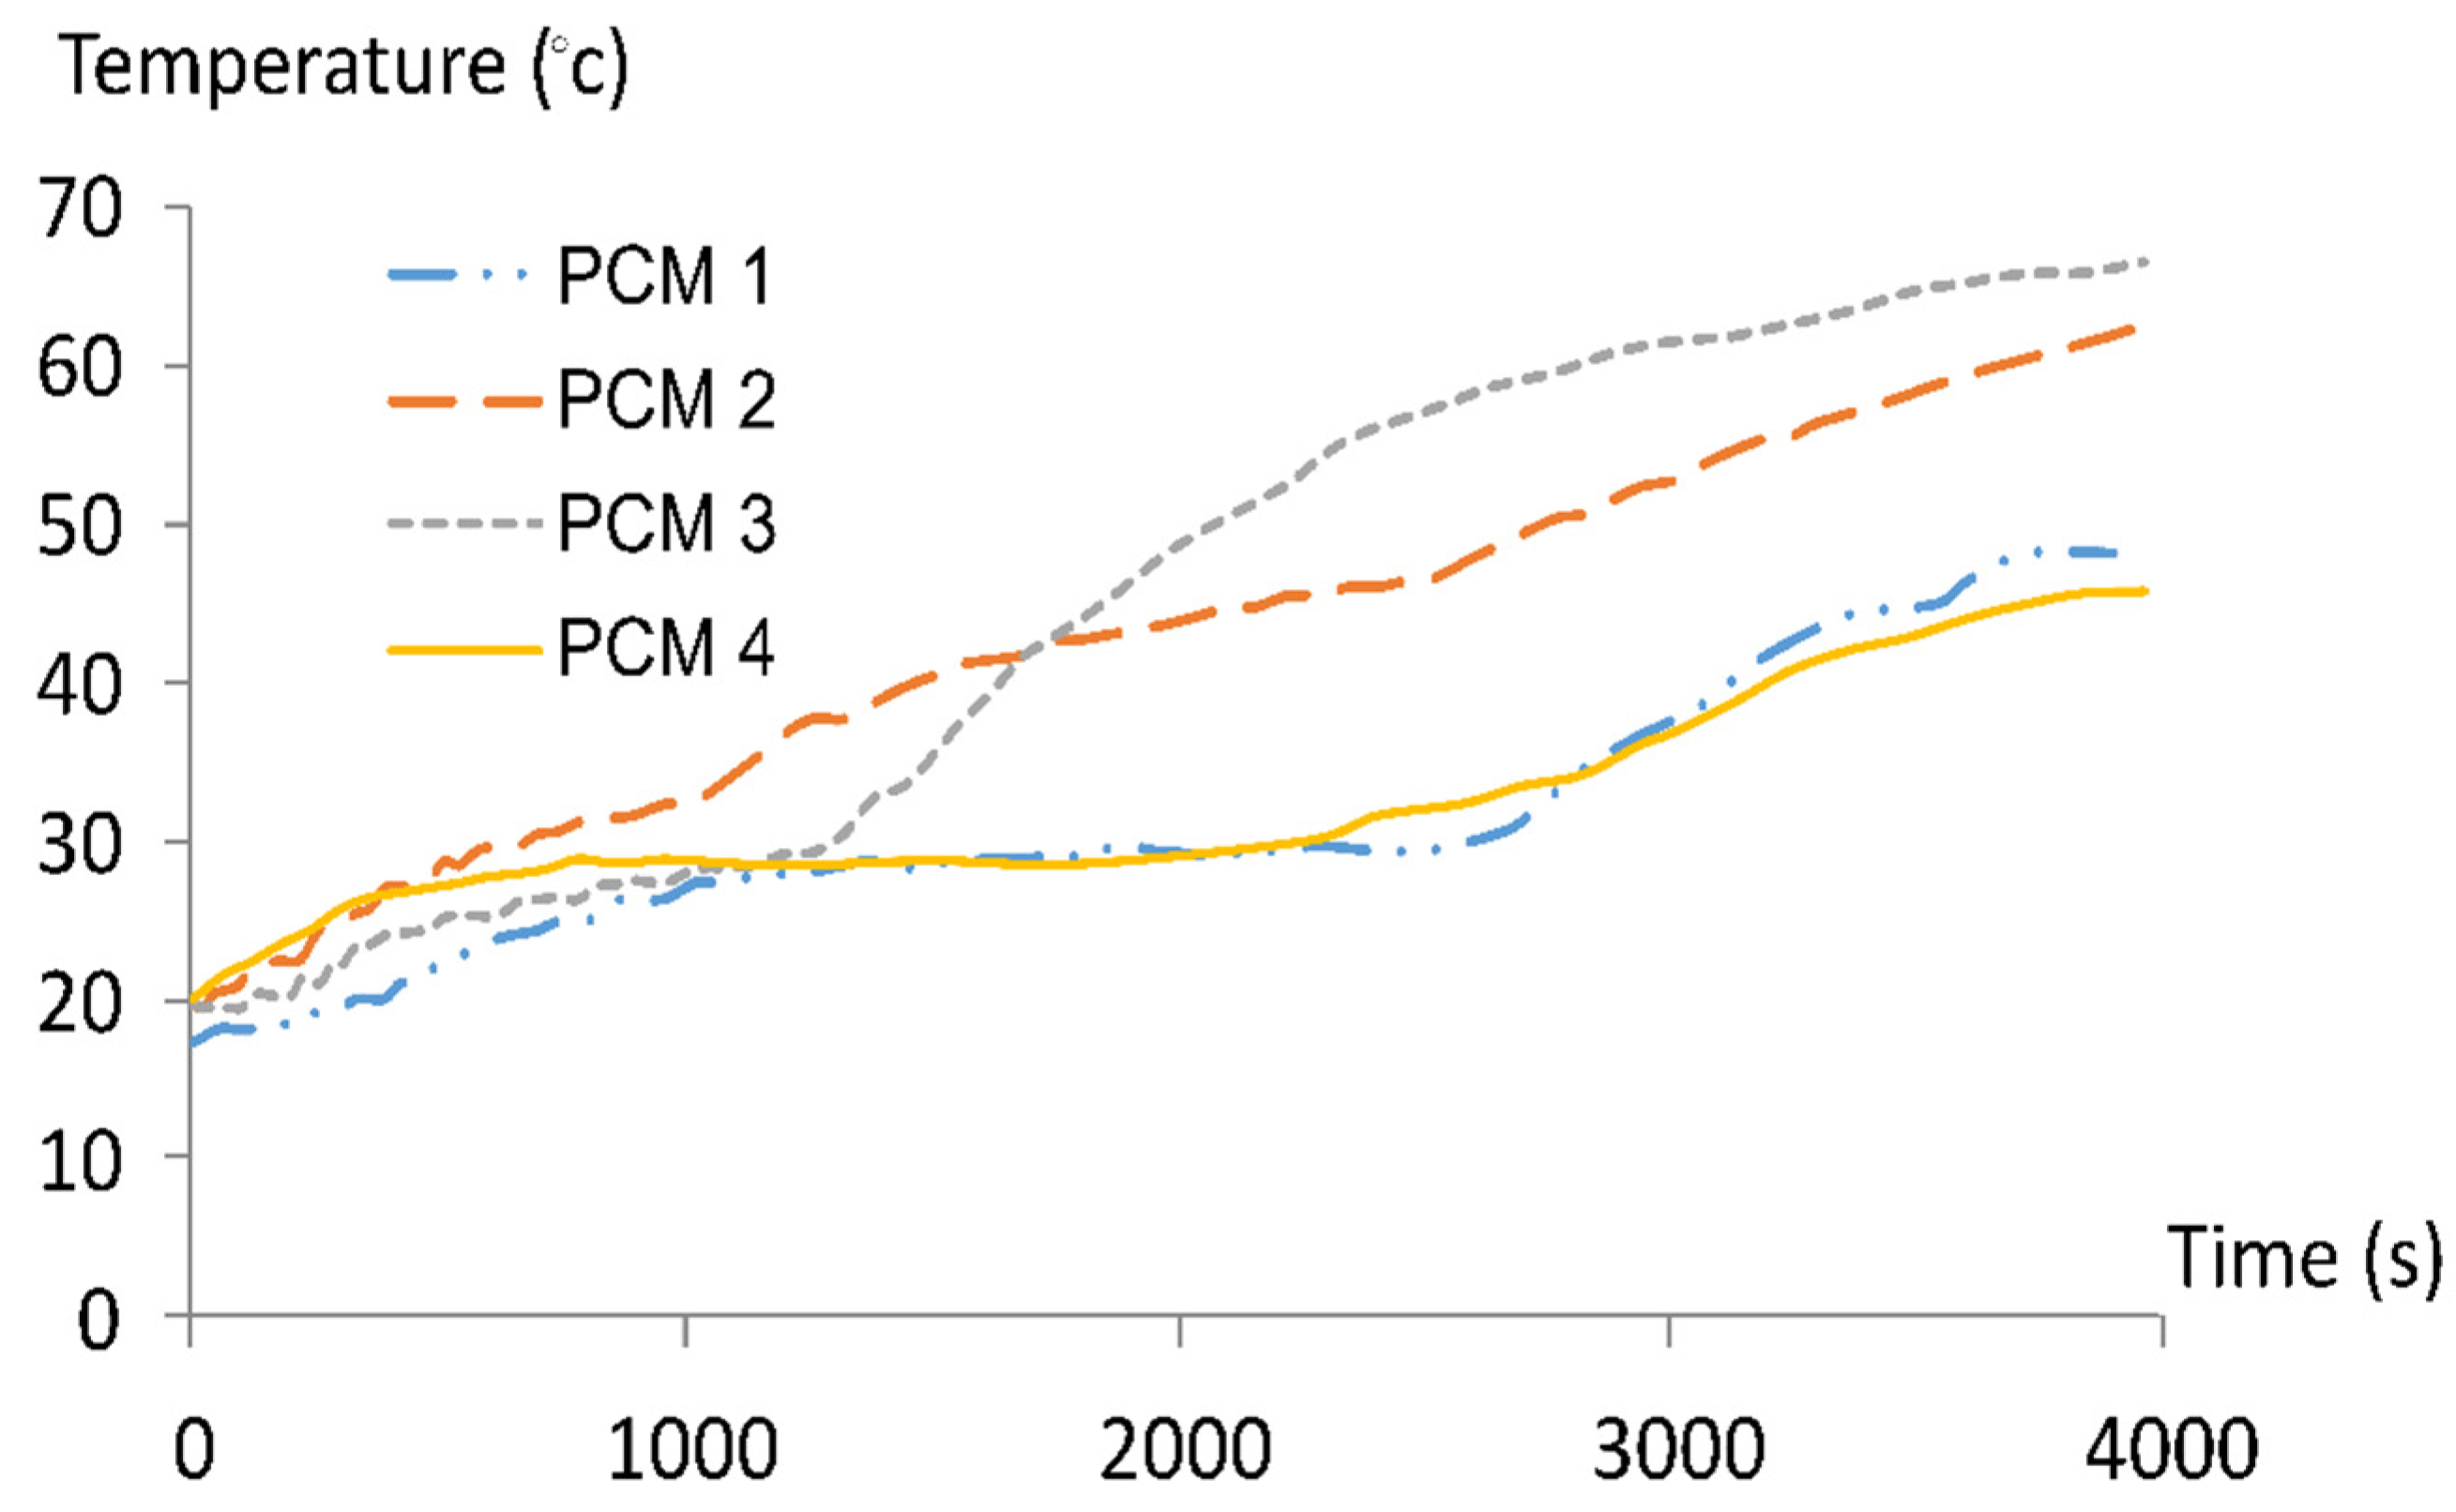
3.3.1. PCMs Temperature Variation

As shown in Figure 4, for PCM 1, the temperature increased from 19.5 °C to 29.5 °C (melting point) in 1020 s. However, during the next 1440 s, it increased slightly from 29.5 °C to 30 °C (transition phase) and then reached 48.2 °C in the remaining 1440 s. As for PCM 2, the temperature increased from 20 °C to 32.2 °C (melting point) during 840 s, whereas it increased to 46 °C in 1620 s and then reached 62.3 °C in the remaining 1440 s.
For PCM 3, the temperature increased quickly from 20 °C to 24.2 °C (melting point) in 420 s. This quick increase was followed by a transition phase with a slight increase from 24.2 °C to 28.4 °C in 1080 s. After complete melting, the temperature increased to 66.4 °C in the remaining 2400 s. Finally, the temperature of PCM 4 showed the same behavior as that of PCM 3, where it increased from 20 °C to 27.3 °C (melting point) in 540 s, then increased slightly to 30 °C in 1260 s, to finally increase to 45.6 °C in the remaining 2100 s.
It can be noticed from the curves in Figure 4 that each PCM undergoes three stages. The first stage is the increase in temperature before reaching the melting point, in which the PCM absorbs sensible heat in its solid state. The second stage is the stabilization of the temperature at the melting point. During this stage, the PCM absorbs the latent heat until it totally melts. The heat energy absorbed by each PCM as latent heat is equal to the actual mass multiplied by the latent heat of fusion (m×H). In the third stage, and after complete melting of the PCM, its temperature keeps on increasing, meaning that the PCM, in its liquid state, is absorbing sensible heat.
It should be noted that each experiment for a defined PCM was repeated several times to ensure that the data collected were accurate. It was found that the variation between the measurements was negligible for each type of PCM.

3.3.2. PV Temperature Variation with and without PCM

The temperature curves of the PV panel with PCM are divided into three stages, as shown in Figure 5. In the first stage, the temperature increase with PCM was approximately similar to that without PCM because the sensible energy stored by the PCM was negligible with respect to the energy stored by the PV. In the second stage, when the temperature of the PV stabilized (different slope observed from the first stage in the range of the melting point of the PCM), most of the heat energy was stored in the PCM as latent heat until the PCM totally melted. Then, the temperature continued increasing in the third stage (with a different slope than that of the melting point range).
The stabilized temperature of the PV panel using different PCMs depends on the melting point of the PCM. For example, PCM 1 melted at around 30 °C and the PV temperature stabilized at 57.4 °C, whereas PCM 2 melted at 32.2 °C and the PV temperature started to stabilize at 60 °C. The temperatures of the PV panel in each PCM experiment were very close, with 1 °C to 6 °C differences. The PV panel temperature increased to reach 50 °C just before the PCM started melting and absorbing heat.

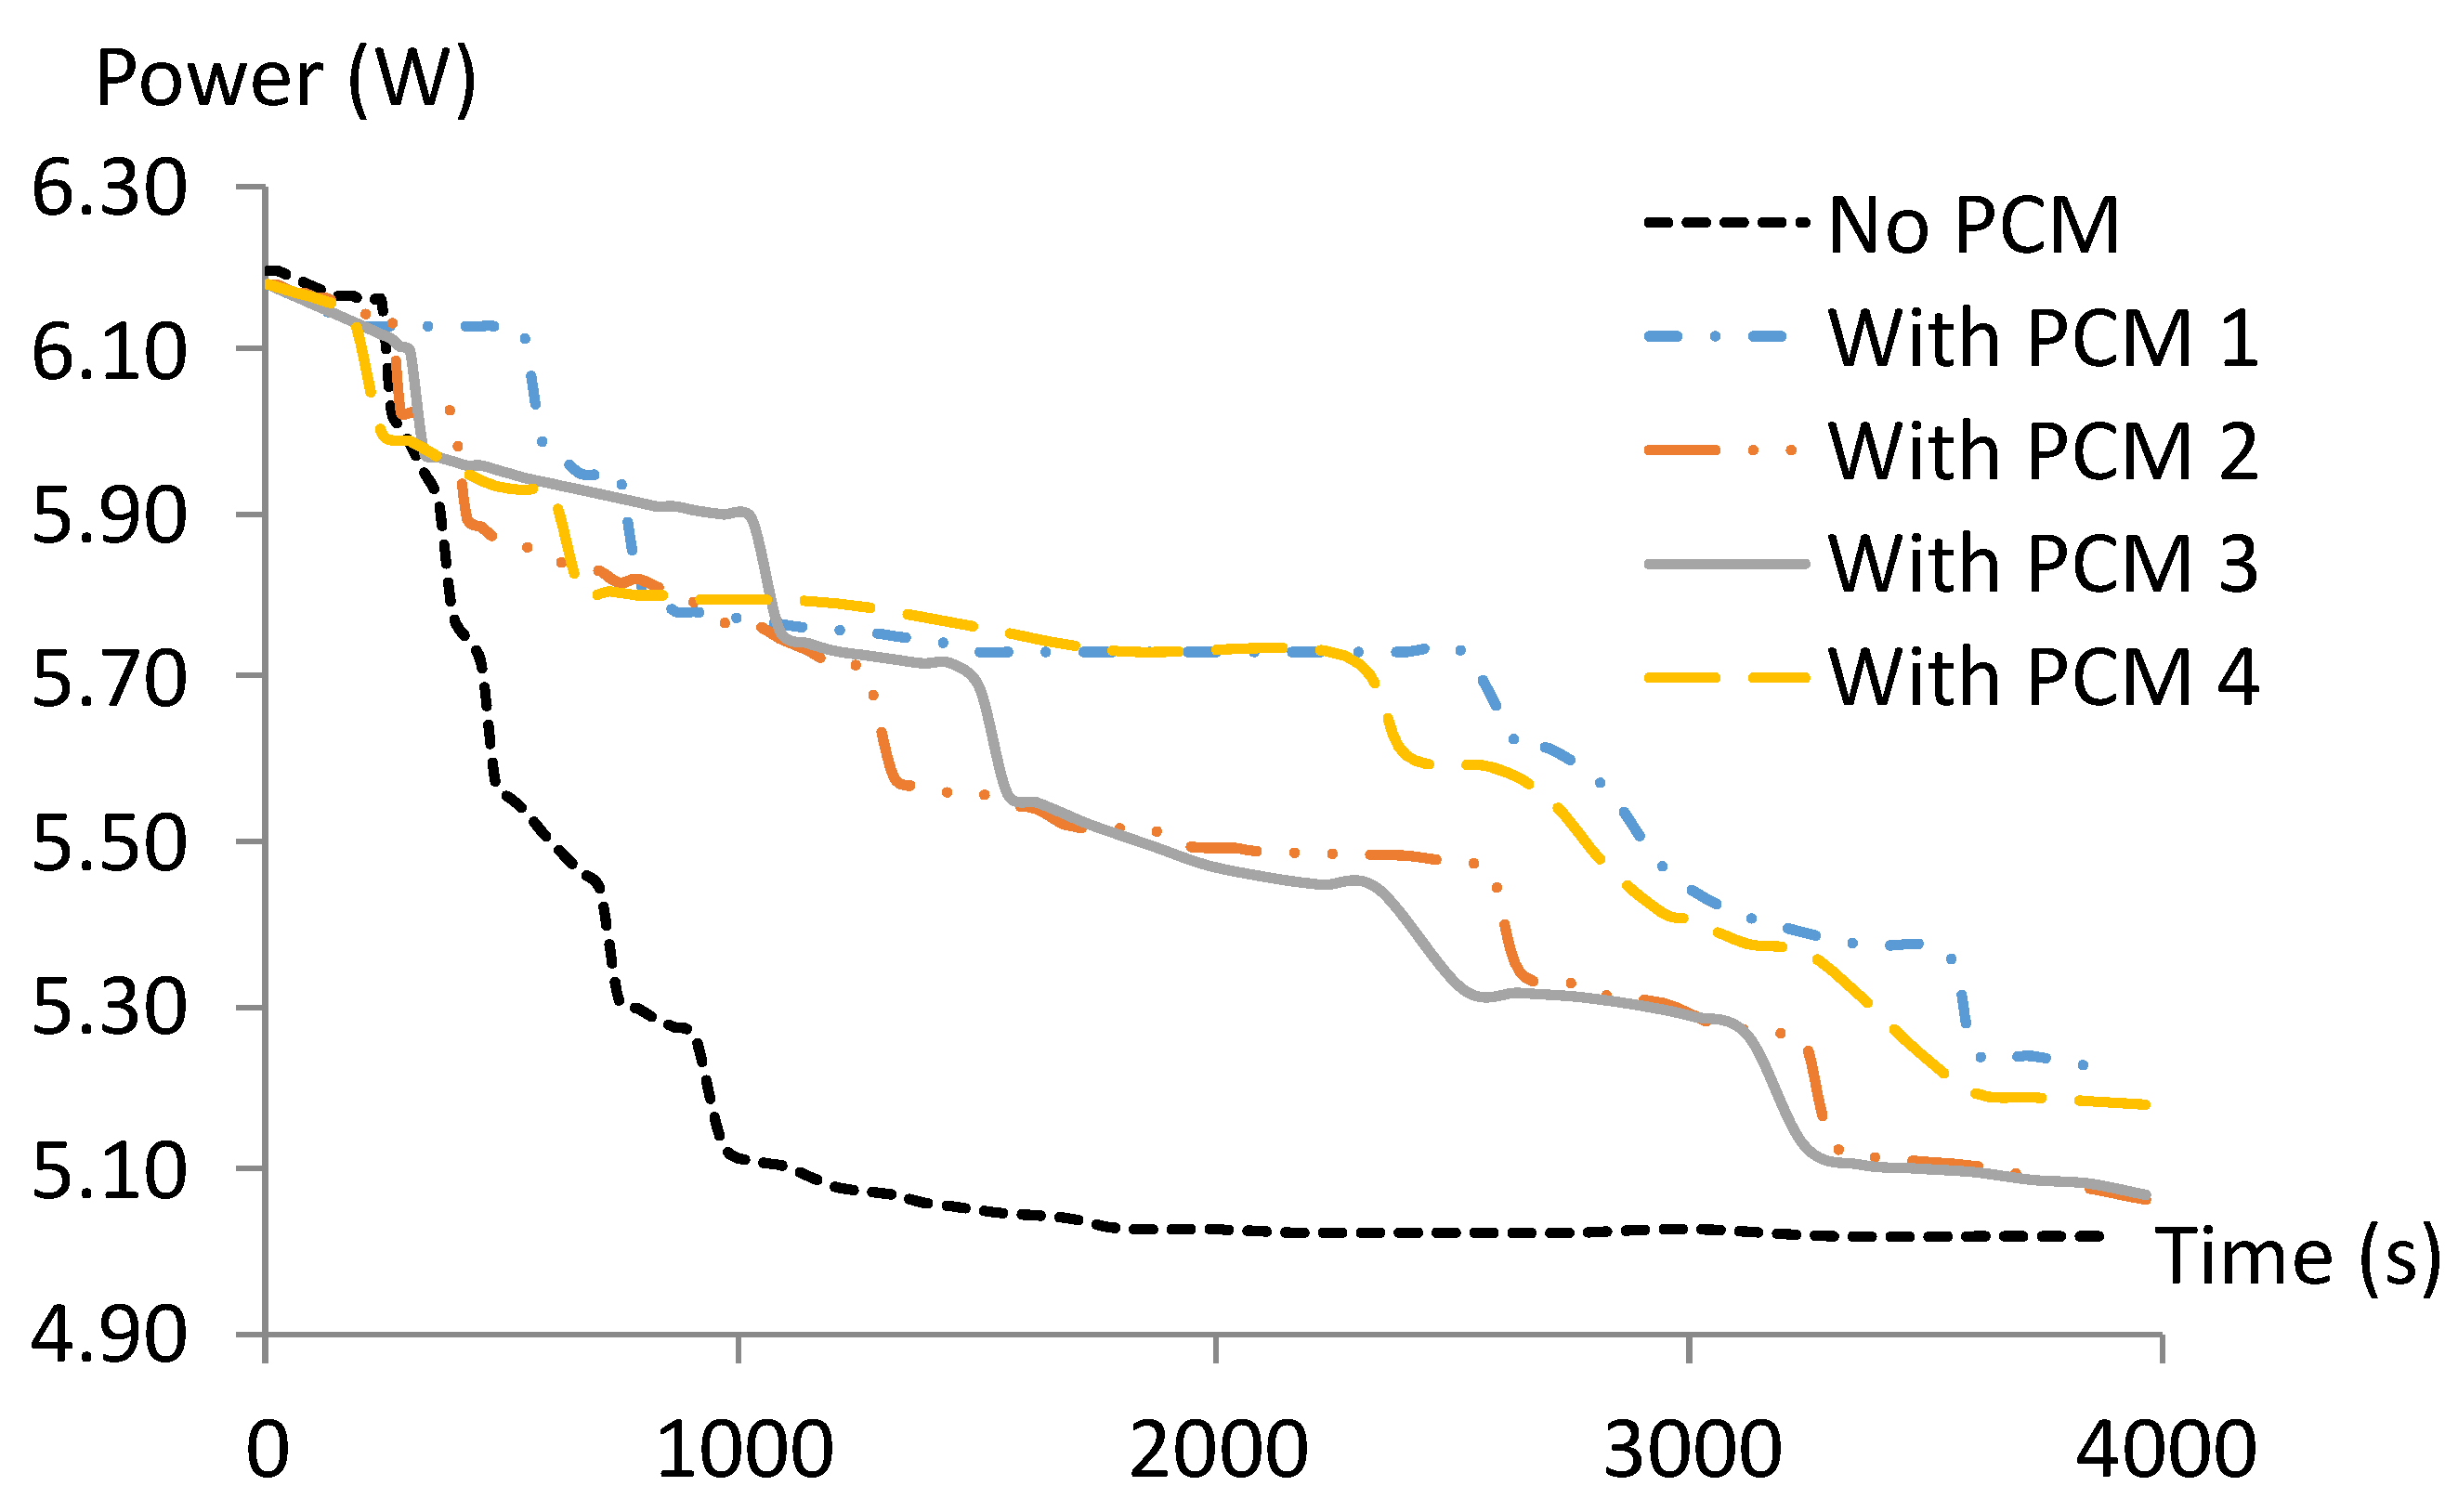
3.3.3. PV Panel Power Output

In Figure 6, the variation of the output power generated by the PV panel is plotted as a function of the experiment time. Figure 6 sheds light on the effect of the PCM added to the rear face of the panel. The output power in the reference experiment (without PCM) decreased quickly from 6.2 W to 5.1 W. However, it decreased slowly when different types of PCMs were used.
During the first time interval (0–1000 s), the PCMs prevented any sharp decreases in power. They conserved power at high values between 5.92 W and 5.72 W, or at 5.1 W in the case where no PCM was used. Thus, an approximate saving of 23% in power at this time was observed.

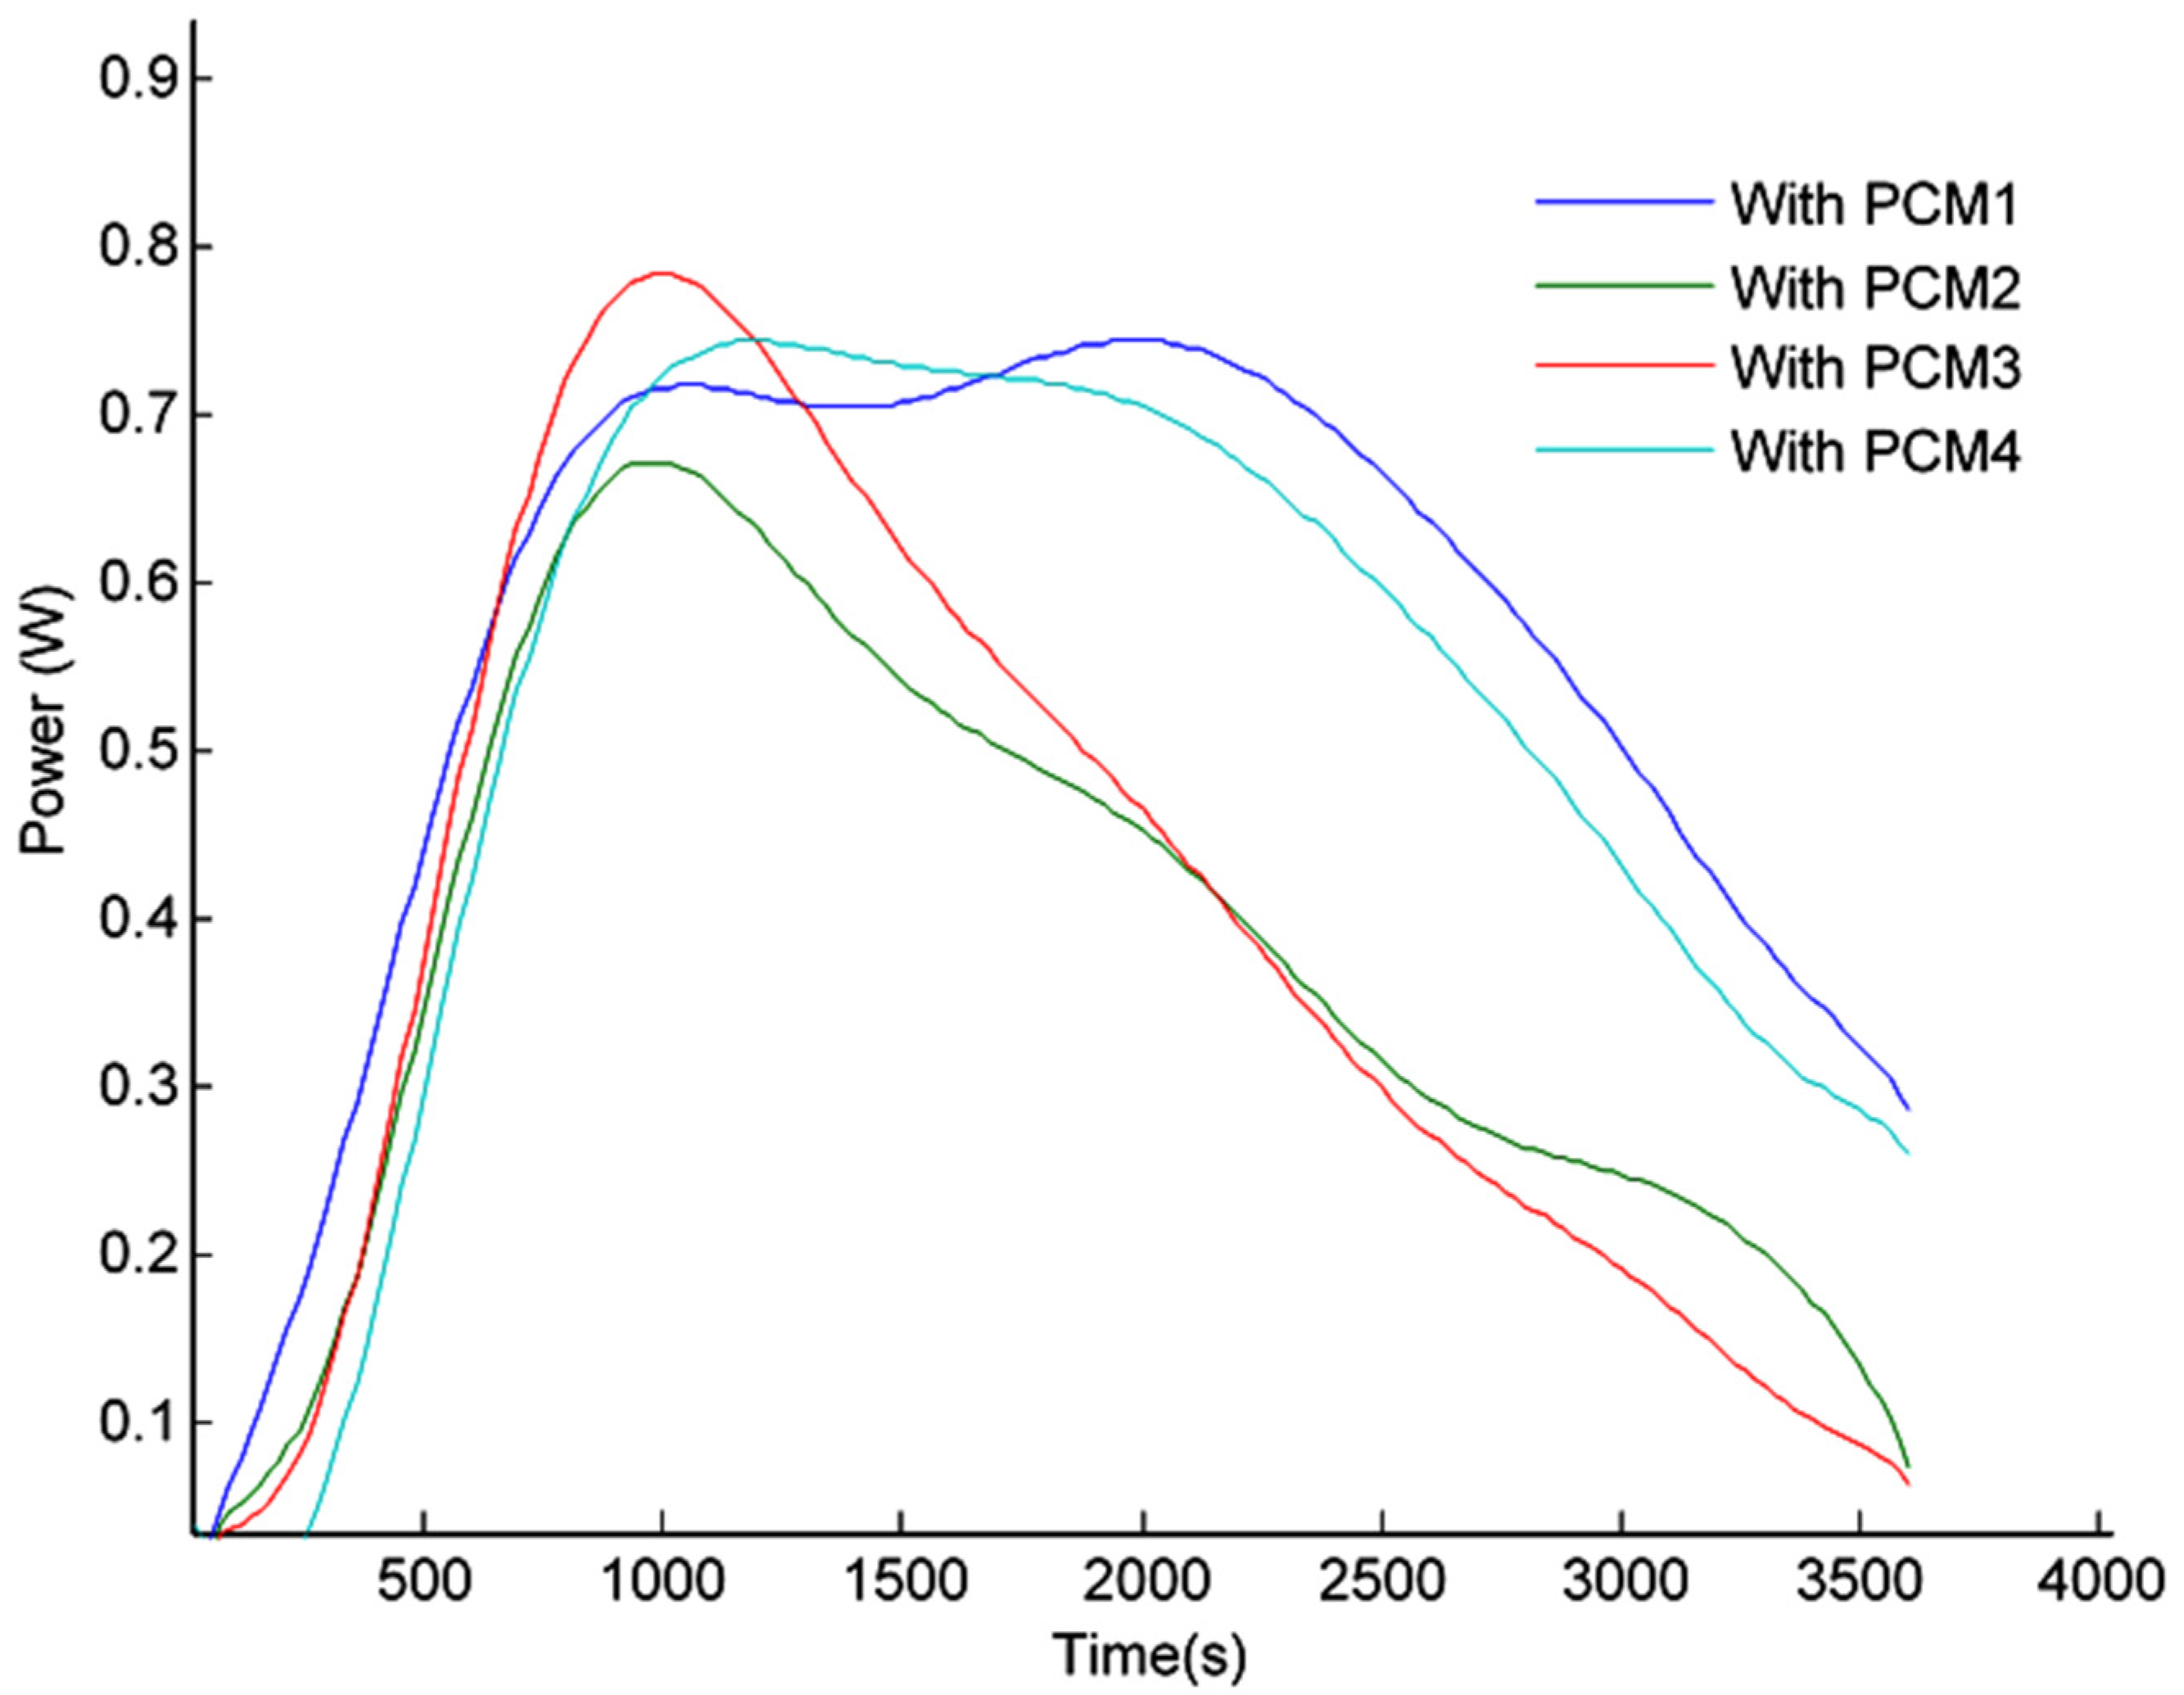
3.3.4. Power and Energy Gained

The improvement in electric energy after adding the PCM as an extracted heat medium can be calculated as follows:
P gained ( t ) = P PV PCM ( t ) P PV ( t )
Q gained = 0 t P PV PCM dt 0 t P PV dt
where PPV and PPV-PCM are the electric power from the PV panel in watts before and after using the PCMs, respectively. Qgained is the energy saved by using the PCMs in joules during a defined time t.
Using Equation (1), the power gained by each PCM was calculated as a function of time. Figure 7 shows that the power gained using the PCM increased over a period of time (0–1000 s). The power then remained constant for an interval of time (1000–2000 s) until it started to decrease.
According to Figure 7 and using PCM 3, the power gained by the panel reached its maximum value first because of its lower melting point. However, the power dropped suddenly as PCM 3 had low actual latent heat. For PCM 4, the power remained constant at a lower value than the peak of PCM 3, whereas PCM 1 had approximately the same power value as that of PCM 4 but remained constant for a longer time due to its higher latent heat. For PCM 2, the lowest power peak was reached and the power then decreased gradually due to the high melting point range of PCM 2.
The area under each curve in Figure 7, representing the energy gained by using different PCMs, is calculated using Equation (2). Moreover, the percentage of energy gained (PEG) is calculated using Equation (3):
P E G = E ( p r o t o t y p e 2 ) E ( p r o t o t y p e 1 ) E ( p r o t o t y p e 1 ) × 100
where E(prototype 2) is the energy generated by the panel in the case of prototype 2 where a different type of PCM was used and E(prototype 1) represents the energy generated by the panel in the case of prototype 1 without PCM. Table 3 summarizes the results of the energy gained by the PV with and without the PCM, where the energy gained represents the difference between the energy generated by the PV with and without PCM.

4. Discussion

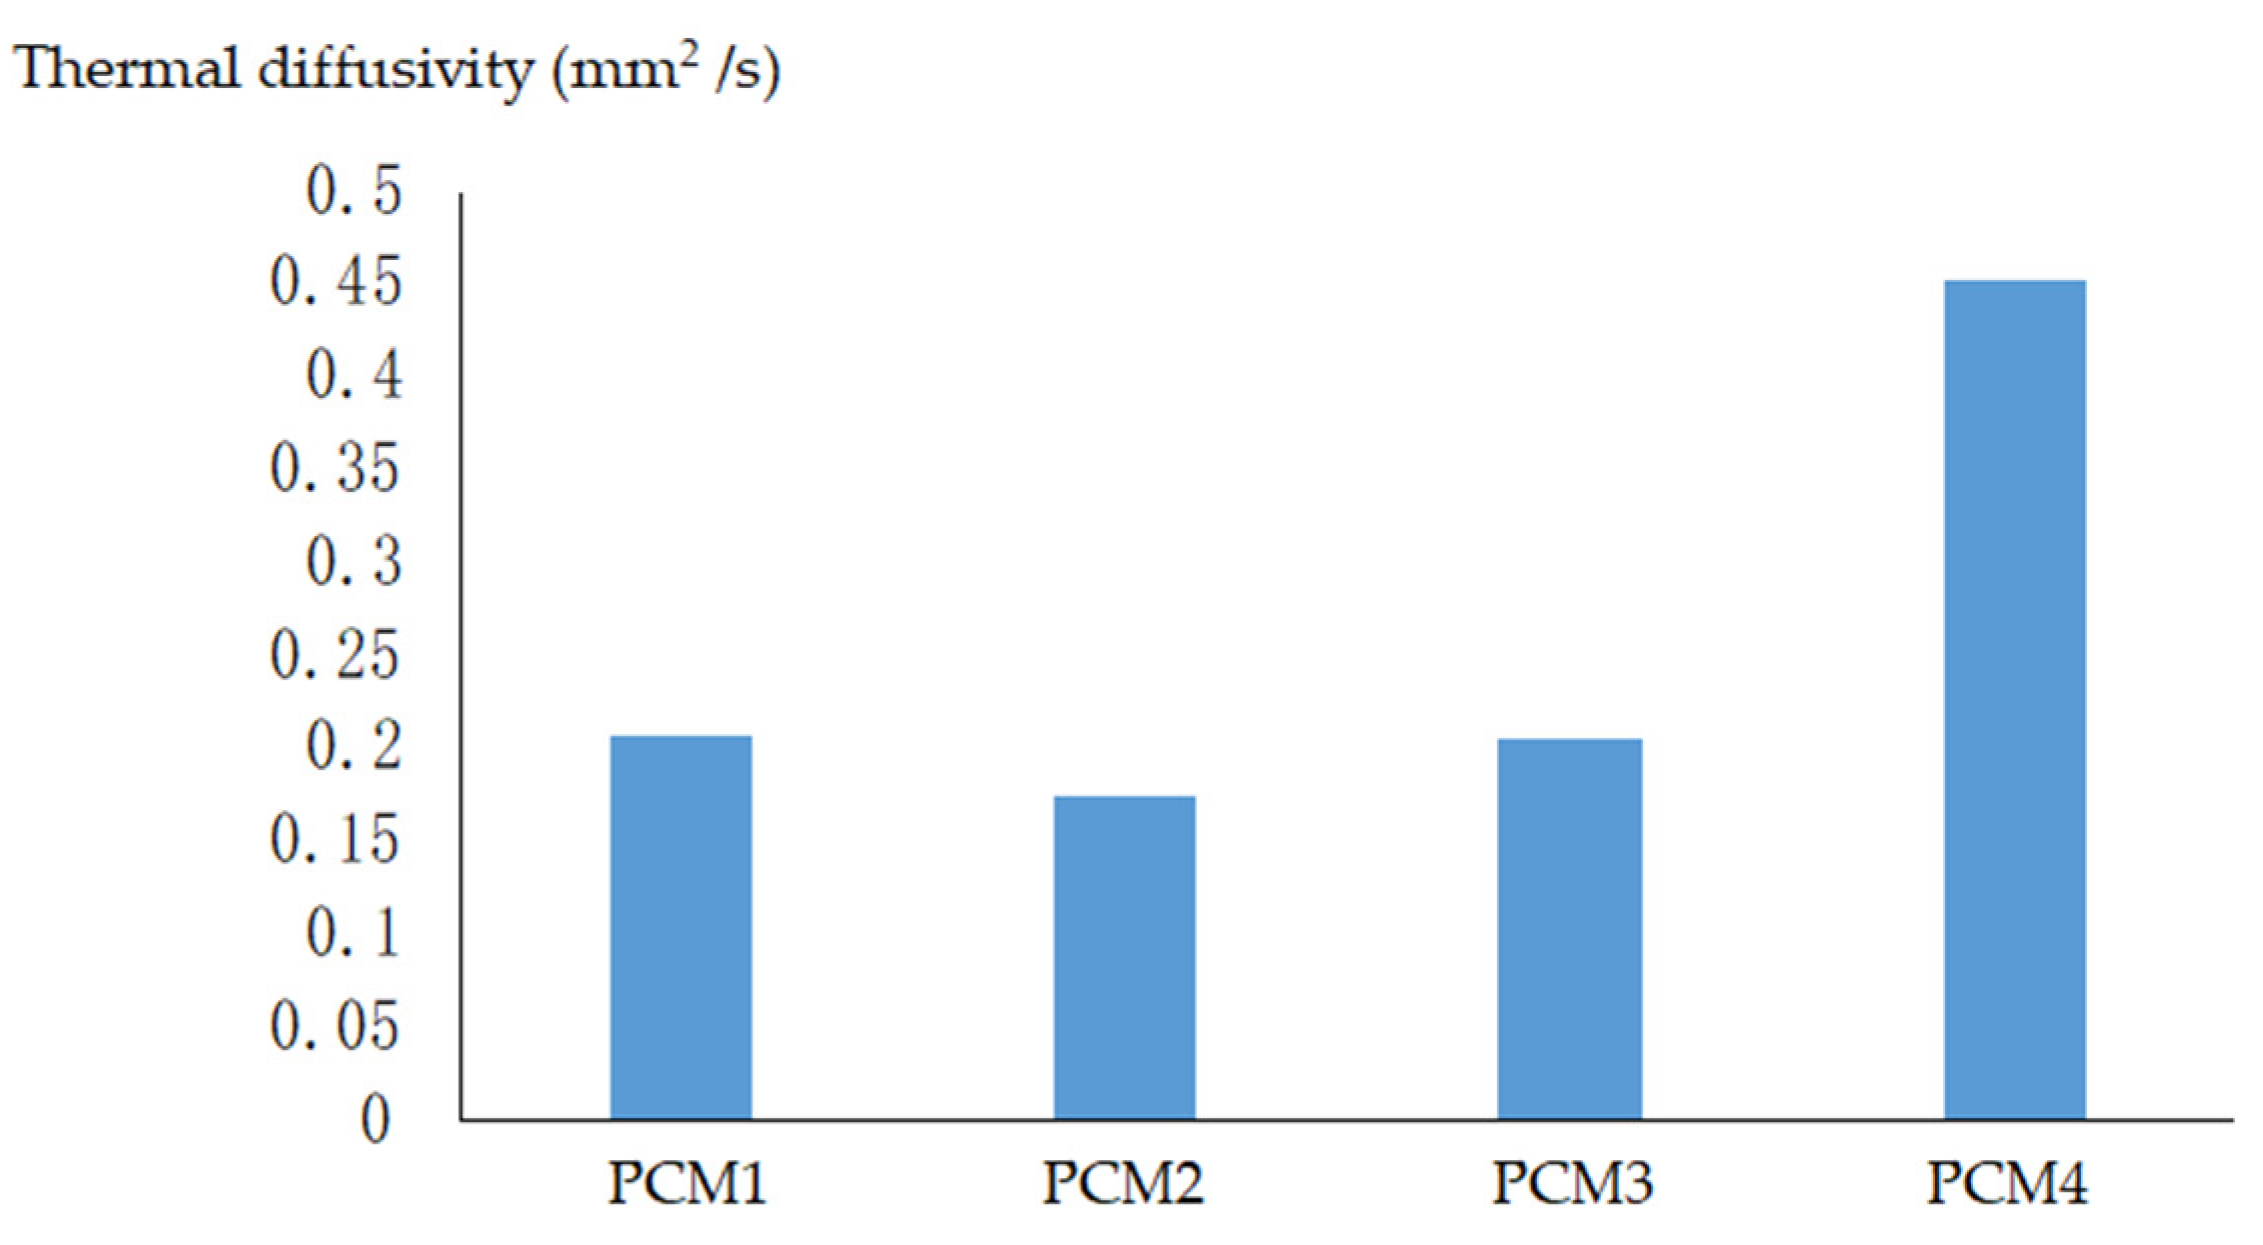
4.1. Thermal Diffusivity

To analyze the effects of the thermophysical properties of the PCMs used, a dimensionless parameter, thermal diffusivity, is introduced. Thermal diffusivity ( α ) is defined as the ratio of heat conducted to heat energy stored per unit volume of a material. It is also the ratio between the thermal conductivity (K) of a substance, and the product of its density (ρ) and specific heat capacity (Cp), as in Equation (4):
α = K ρ C p
The values of α are calculated using the values of K, ρ, and Cp listed in Table 1. These values are plotted in Figure 8.
Figure 8 shows that PCM 4 has the highest thermal diffusivity, which means that it has a high conduction rate relative to its heat storage capacity and so responds quickly to changes in temperature. Additionally, it is capable of transferring a high amount of energy over a long period of time. This keeps the panel cooled for a longer time, and thus, a larger gain in energy is obtained. This conclusion is backed up by the results presented in Figure 5. It can be observed that the PV temperature profile has a wider zone of latent storage and for a long period. Compared to the three other PCMs, PCM 4 maintained the panel temperature at the lowest level. Moreover, the results of PEG presented in Table 3 show clearly that the highest amount of energy gained is for the panel with PCM 4 (PEG = 14.1%).

4.2. Economic Analysis: A Case Study

The cost of PCM depends on the quantity used in the container. As the amount of PCM purchased increases, the cost per kg decreases significantly. By ordering high quantities of PCMs such as calcium chloride hexahydrate (PCM 4), 1 kg will cost around USD 0.75 instead of its actual price of USD 33 [24]. This high quantity can be used in cooling a large PV station producing megawatts of power. Calcium chloride hexahydrate (PCM 4) was shown to be the most efficient PCM in the experiments. It has a good price relative to the power enhancement it provides and compared to other PCMs.
To illustrate the above statements about PCM 4, a PV home station of 1080 Wh in Lebanon is considered. The station is composed of four 270 Wh panels with dimensions (1580 × 1069 × 10 mm3) that ensure the functioning of small equipment when utility electricity goes down. Note that Lebanon is a country with an average of 300 sunny days per year with 5-6 sunny hours per day. Thus, such a project is of a high importance.
For cost analysis, an outdoor experiment using the same experimental setup used in the indoor experiment on a panel of 10 watts nominal power was performed. The measurements were managed over a completely sunny day (3 July) and carried out in Beirut, Lebanon. The same procedure as in the indoor experiments was followed to calculate the PEG using PCM 4 (calcium chloride hexahydrate). The results showed a gain in power generation (PEG = 11.3%) due to the addition of PCM 4. The difference between the indoor (PEG = 14.1%) and outdoor (PEG = 11.3%) values might be due to variations in solar irradiance and boundary conditions.
Now, based on the outdoor experiment value of PEG, an economic study will be presented on the abovementioned PV home station of 1080 Wh capacity. The volume of one rear container of PCM to be added at the rear face of a PV module with dimensions of 1580 × 1069 × 10 mm3 is:
V PCM = a × b × c = 0.01689   m 3
Using PCM 4 with a density ρ = 1710   kg / m 3 (Table 1), the mass of PCM is then:
M PCM = ρ × V PCM = 28.8   kg
Thus, the cost of PCM to be used in the four PV panels is:
Cost   of   PCM = 4 × M PCM × price   per   kg = USD   87
The energy gained due to the cooling technique with PCM 4 is:
Energy   gained = PEG × Energy   generated = 11.3 % × 1080 = 122   Wh
In Lebanon, the average number of effective sunny hours is around 6 h per day. Thus, the power gained by the home station during a day is:
Power   gained   per   day = 6 × 122   Wh = 732   W
In Lebanon, the price of generating 1 kWh is USD 0.23 [28]. Thus, the money saved per day due to the use of PCM is:
Money   saved = 0.732 × 0.23 = USD   0.17 / day
As for the PCM containers added to the rear faces of the panels, the cost is evaluated at USD 150. In addition, the cost of assembly, installation, and labor is approximated to USD 150. Thus, the total cost of PCM integration in the system of four PV modules is USD 387. In order to recover this cost, the time needed is calculated as the ratio between the PCM cost and the daily money saved:
Recovery   time = 387 0.17 = 2298   days 6.5   years
After this period of time, the gain in power production will be of pure benefit. The cycle lifetime of a PV panel is 25 years; thus, 18.5 years will be of pure benefit due to the addition of PCM at the rear face of PV. It is worth mentioning that the benefit value may be decreased a little if we take into consideration the degradation of the PCM used over the lifetime of the project. A study performed by [29] showed that a decrease of 6% in the latent heat of fusion of micro-encapsulated octadecane mixture samples after 5400 cycles of use is detected.
It should be noted that the extra power gained due to the use of PCMs can help in decreasing the number of panels needed, especially for large stations, and thus, reduces the cost of construction of large PV stations.

5. Conclusions

In this paper, an experimental setup was made in order to improve the power generation of a PV module using PCM cooling techniques. Different types of PCM were used, where the selection was based on different parameters such as the melting point, latent heat of fusion, cost, and availability on the market. This makes the study consistent.
The results showed that each PCM has a different effect according to its thermophysical properties. All PCMs used in this experiment were able to achieve the goal of the study by reducing the panel’s temperature at a constant irradiance. The selection of a given PCM with a given melting point depends on the country where the PV panel will be used and on the average ambient temperature and irradiance available.
The results also showed that the addition of calcium chloride hexahydrate (having the highest thermal diffusivity among all tested PCMs, which means that it has a high conduction rate relative to its heat storage capacity and so responds quickly to changes in temperature) produced an increase of 14.1% in the energy generated by the PV. This technique seems appealing to be applied over a wide selection of PV panel stations.
This study should be conducted over a large period of time to see the effect of aging and degradation of a selected PCM, since it may affect its performance in cooling a PV module.
As a future work, this study will be extended to the use of different mixed PCMs in order to benefit from a wider range of thermal properties. Some mixtures of fatty acids seem to be potential candidates to be used as PCMs in solar applications.

Author Contributions

Conceptualization, M.H. and A.S.; methodology, M.H., F.K. and A.K.; validation, A.S., M.H. and H.R.; formal analysis, F.K. and A.K.; writing—original draft preparation, A.S., M.H., F.K. and A.K.; writing—review and editing, A.S. and H.R.; supervision, A.S., H.R. and M.H.; All authors have read and agreed to the published version of the manuscript.

Funding

The APC was funded by the Lebanese International University LIU.

Institutional Review Board Statement

Not applicable.

Informed Consent Statement

Not applicable.

Data Availability Statement

Data sharing is not applicable.

Conflicts of Interest

The authors declare no conflict of interest.

References

  1. Brinkworth, B.J. Estimation of flow and heat transfer for the design of PV cooling duct. Sol. Energy 2020, 69, 413–420. [Google Scholar] [CrossRef]
  2. Kawtharani, F.; Kawtharani, A.; Hammoud, M.; Hallal, A.; Shaito, A.; Assi, A.; Assi, I. Cooling PV modules using phase change material. In Proceedings of the 29th International Conference on Microelectronics, Beirut, Lebanon, 10–13 December 2017; pp. 347–351. [Google Scholar]
  3. Fayaz, H.; Rahim, N.A.; Hasanuzzaman, M.; Rivai, A.; Nasrin, R. Numerical and outdoor real time experimental investigation of performance of PCM based PVT system. Sol. Energy 2019, 179, 135–150. [Google Scholar] [CrossRef]
  4. Wongwuttanasatian, T.; Sarikarin, T.; Suksri, A. Performance enhancement of a photovoltaic module by passive cooling using phase change material in a finned container heat sink. Sol. Energy 2020, 195, 47–53. [Google Scholar] [CrossRef]
  5. Yao, J.; Xu, H.; Dai, Y.; Huang, M. Performance analysis of solar assisted heat pump coupled with build-in PCM heat storage based on PV/T panel. Sol. Energy 2020, 197, 279–291. [Google Scholar] [CrossRef]
  6. Akshayveer; Kumar, A.; Singh, A.P.; Singh, O.P. Effect of novel PCM encapsulation designs on electrical and thermal performance of a hybrid photovoltaic solar panel. Sol. Energy 2020, 205, 320–333. [Google Scholar] [CrossRef]
  7. Krauter, S. Increased electrical yield via water flow over the front of photovoltaic panels. Sol. Energy Mat. Sol. C 2004, 82, 131–137. [Google Scholar] [CrossRef]
  8. Huang, M.J.; Eames, P.C.; Norton, B. Thermal regulation of building-integrated photovoltaics using phase change materials. Int. J. Heat Mass Tran. 2004, 47, 2715–2733. [Google Scholar] [CrossRef]
  9. Prieto, C.; Cabeza, L.F. Thermal energy storage (TES) with phase change materials (PCM) in solar power plants (CSP). Concept and plant performance. Appl. Energy 2019, 254, 113646. [Google Scholar] [CrossRef]
  10. Batrancea, L.; Rus, M.-I.; Masca, E.S.; Morar, I.D. Fiscal Pressure as a Trigger of Financial Performance for the Energy Industry: An Empirical Investigation across a 16-Year Period. Energies 2021, 14, 3769. [Google Scholar] [CrossRef]
  11. Prieto, C.; Lopez-Roman, A.; Martinez, N.; Morera, J.M.; Cabeza, L.F. Improvement of phase change materials (PCM) used for solar process heat applications. Molecules 2021, 26, 1260. [Google Scholar] [CrossRef] [PubMed]
  12. De Gracia, A.; Navarro, L.; Castell, A.; Boer, D.; Cabeza, L.F. Life cycle assessment of a ventilated facade with PCM in its air chamber. Sol. Energy 2014, 104, 115–123. [Google Scholar] [CrossRef]
  13. Zhou, D.; Yuan, J.; Zhou, Y.; Liu, Y. Preparation and Properties of Capric–Myristic Acid/Expanded Graphite Composite Phase Change Materials for Latent Heat Thermal Energy Storage. Energies 2020, 13, 2462. [Google Scholar] [CrossRef]
  14. Salameh, W.; Elabed, I.; Kaddoura, Z.; Assi, A.; El-Rab, M.G.; Hammoud, M. The use of phase change material in the design of heat recovery and energy storage system applied to diesel generators. In Proceedings of the International Conference on Renewable Energies for Developing Countries, Beirut, Lebanon, 26–27 November 2014; pp. 38–42. [Google Scholar]
  15. Sudhansu, S.D.; Pramod, K.; Sarbjot, S.S. Hybrid photovoltaic-thermal systems utilizing liquid-gas phase change material. Energy Sources Part A Recovery Util. Environ. Eff. 2019, 43, 2896–2914. [Google Scholar]
  16. Skoplaki, E.; Palyvos, P.A. On the temperature dependence of photo-voltaic module electrical performance: A review of efficiency/power correlations. Sol. Energy 2009, 83, 614–624. [Google Scholar] [CrossRef]
  17. Mahamudul, H.; Rahman, M.M.; Metselaar, H.S.C.; Mekhilef, S.; Shezan, S.A.; Sohel, R.; Abu Karim, S.B.; Badiuzaman, W.N.I. Temperature Regulation of Photovoltaic Module Using Phase Change Material: A Numerical Analysis and Experimental Investigation. Int. J. Photoenergy 2016, 2016, 5917028. [Google Scholar] [CrossRef]
  18. Browne, M.C.; Norton, B.; McCormack, S.J. Phase change materials for photovoltaic thermal management. Renew. Sust. Energy Rev. 2015, 47, 762–782. [Google Scholar] [CrossRef]
  19. Mjallal, I.; Farhat, H.; Hammoud, M.; Ali, S.; Assi, I. Improving the Cooling Efficiency of Heat Sinks through the Use of Different Types of Phase Change Materials. Technologies 2018, 6, 5. [Google Scholar] [CrossRef] [Green Version]
  20. Mjallal, I.; Farhat, H.; Hammoud, M.; Ali, S.; Shaer, A.A.L.; Assi, A. Cooling Performance of Heat Sinks Used in Electronic Devices. MATEC Web. Conf. 2018, 171, 02003. [Google Scholar] [CrossRef]
  21. Farhat, H.; Mjallal, I.; Hammoud, M.; Ali, S.; Shaer, A.A.L.; Assi, A.; Assi, I. Investigating the effect of the density of phase change materials on cooling electronic packages. In Proceedings of the 29th International Conference on Microelectronics, Beirut, Lebanon, 10–13 December 2017; pp. 185–189. [Google Scholar]
  22. Assi, I.; Mjallal, I.; Farhat, H.; Hammoud, M.; Ali, S.; Shaer, A.A.L.; Assi, A. Using phase change material in heat sinks to cool electronics devices with intermittent usage. In Proceedings of the IEEE 7th International Conference on Power and Energy Systems ICPES, Toronto, ON, Canada, 1–3 November 2017; pp. 66–69. [Google Scholar]
  23. Cui, Y.; Xie, J.; Liu, J.; Wang, J.; Chen, S. A review on phase change material application in building. Adv. Mech. Eng. 2017, 9, 1–19. [Google Scholar] [CrossRef] [Green Version]
  24. Chandrasekar, M.; Rajkumar, S.; Valavan, D. A review on the thermal regulation techniques for non-integrated flat PV modules mounted on building top. Energy Build. 2015, 86, 692–697. [Google Scholar] [CrossRef]
  25. Biwole, P.H.; Eclache, P.; Kuznik, F. Phase-change materials to improve solar panel’s performance. Energy Build. 2013, 62, 59–67. [Google Scholar] [CrossRef] [Green Version]
  26. Ibra Hadad, Sigma Aldrich Company LLC, Lebanon. Available online: https://www.sigmaaldrich.com/chemistry.html (accessed on 10 March 2020).
  27. Mjallal, I.; Hammoud, M.; Habchi, C.; Lemenand, T. Cost Effective Device to Characterize Phase Change Materials. Meas. Sci. Technol. 2020, 31, 025903. [Google Scholar] [CrossRef]
  28. Berjawi, A.H.; Najem, S.; Faour, G.; Abdallah, C.; Ahmad, A. Assessing Solar PV’s Potential in Lebanon. National Center for Remote Sensing; CNRS: Beirut, Lebanon, 2017. [Google Scholar]
  29. Gao, E.; Zhang, B.; Stephenson, L.D.; Boddu, B.; Trovillion, J. Prediction of phase change material (pcm) degradation. In Proceedings of the Thermal Performance of the Exterior Envelopes of Whole Buildings XII, Clearwater, FL, USA, 1–5 December 2013. [Google Scholar]
Figure 1. Schematic of the constructed prototypes. Prototype 2 is duplicated four times for different type of PCMs.
Energies 14 05195 g001
Figure 2. Experimental setup.
Energies 14 05195 g002
Figure 3. (a) Current–voltage curve at different temperatures (MPP at T = 25 °C) (b) PV power as a function of voltage at different temperatures.
Energies 14 05195 g003
Figure 4. Variation of the temperature of each type of PCM as a function of time during experiments.
Energies 14 05195 g004
Figure 5. Variation of the PV temperature as a function of time with and without PCM.
Energies 14 05195 g005
Figure 6. Variation of the PV power output as a function of time.
Energies 14 05195 g006
Figure 7. Variation of power gained by using different PCMs.
Energies 14 05195 g007
Figure 8. Thermal diffusivity for the four types of PCM used in the experiments.
Energies 14 05195 g008
Table 1. Measured thermophysical properties of PCMs using the device of Mjallal et al. [27].
PCM 1PCM 2PCM 3PCM 4
NameSodium Sulfate DecahydrateSodium Phosphate Dibasic DodecahydrateDecanoic AcidCalcium Chloride Hexahydrate
Density (kg/m3)1485155210041710
Melting point (°C)32403029
Latent heat (kJ/kg)252270153180
Specific heat (kJ/kg·K)1.81.91.811.4
Thermal conductivity (W/m·K)0.5540.5140.3721.08
Table 2. Experimental uncertainties of different equipment used in the experimental setup.
EquipmentExperiment Error
Thermocouple0.5 °C
Lux meter1.5%
Voltmeter1%
Ammeter1%
Table 3. Energy generated and gained by the PV with and without using PCMs during 4000 s.
Energy Generated (kJ)Energy Gained (kJ)PEG (%)
Without PCM18.7400
With PCM 121.062.3112.37
With PCM 220.091.347.20
With PCM 320.151.407.50
With PCM 421.382.6414.10
Publisher’s Note: MDPI stays neutral with regard to jurisdictional claims in published maps and institutional affiliations.

