Article

Impact of Electrification on African Development-Analysis with Using Grey Systems Theory

1
Faculty of Engineering Management, Poznan University of Technology, Pl. Marii Skłodowskiej-Curie 5, 60-965 Poznań, Poland
2
Department of Information Economics, Institute of Socio-Economics, Poznań University of Economics and Business, Al. Niepodległości 10, 61-875 Poznań, Poland
3
Department of Microeconomics, Institute of Economics, Poznań University of Economics and Business, Al. Niepodległości 10, 61-875 Poznań, Poland
*
Author to whom correspondence should be addressed.
Energies 2021, 14(16), 5181; https://doi.org/10.3390/en14165181
Submission received: 26 July 2021 / Revised: 15 August 2021 / Accepted: 18 August 2021 / Published: 22 August 2021
(This article belongs to the Special Issue Energy Management: Economic, Social, and Ecological Aspects)

Abstract

:
In this paper, the authors discuss the problem of the influence of the level of electrification in African countries on their sustainable development. The first aim of the article is to determine the relationship between changes in the electrification index and changes in the indicators showing individual components of sustainable development for African countries. The analyzed indicators of sustainable development include GDP per capita, Human Deveopment Index (HDI), and the CO2 emissions per capita indicator. The second goal of the article was to develop a synthetic indicator of sustainable development. This study uses the method of relationship research based on Gray Systems Theory—Gray Incidence Analysis. The main conclusion from the research carried out is that improving access to electricity is a necessary condition for the sustainable development of African countries. The lack of improvement in the availability of electricity is a basic barrier to development, especially in the poorest African countries.

1. Introduction

More than a billion and a half people around the world lack access to electricity, and another billion suffer intermittent or marginal quality of service due to electrification. The majority of these people live in suburban or rural areas of sub-Saharan Africa and Asia. In highly developed countries, current strategies are more focused on reducing traditional sources of energy to increase the share of renewable sources in the energy mix. Energy development in a modern part of the world is aimed at accelerating the decarbonization process [1]. If the international agenda does not change that course, electrification rates will continue to diverge significantly among regions [2], which will lead to economic and social problems.
If we want to understand the scale of the problem in sub-Saharan Africa, we should compare it to other regions with plenty of developing countries. The level of electricity access in Latin America or Middle East and North Africa countries is approximately 80–90%. Countries such as Algeria, Egypt, Morocco, or Seychelles have full access to electricity, even though they are considered as developing in Africa. However, most sub-Saharan African countries are struggling to escape from “energy poverty”, with nearly 70% of their population lacking access to electricity [3]. Scientists claim that most sub-Saharan African states are in the middle of a power crisis [4], and the problem will deepen due to population growth. A power crisis may be characterized by inadequate, unreliable, and costly electricity infrastructure across African countries [5]. According to trends, it will be hard to achieve the goal defined as 45% of African countries will have universal access to electricity by 2050 [6]. However, there are some initiatives that focus on such goals. For example, in 2012, the Sustainable Energy for All initiative which is a global initiative introduced by the United Nations Secretary-General. Its main goal is to provide universal access to modern energy services by 2030. The UN underlined that substantial financial and technological investments would be required at a rate far exceeding historical levels [7].
Thanks to its geographical location Africa has great potential due to renewable sources of energy. Although every country in Africa has a surplus of energy resources, unfortunately, most of them are struggling with the financial issue due to energy sectors. The vast majority of countries, because of that, are far from being able to exploit their energy potential fully [7].
The aim of this paper is to measure the relationship between the dynamics of the access to electricity (% of populations) index and the dynamics in changes of indices mirroring individual components of sustainable development, i.e., the component connected with social development (represented by the HDI index), the component connected with economic development (represented by the GDP per capita index), and the component connected with environmental development (represented by the CO2 emissions per capita index) for African countries. Moreover, we defined the relationship between the dynamics of the access to electricity (% of populations) index and the dynamics of a synthetic index of sustainable growth proposed by us, based on the HDI, GDP per capita, and CO2 emissions per capita indices. In this paper, the method of relation research based on the Grey Systems Theory—Grey Incidence Analysis was used. Reaching the assumed goals will make it possible to verify the hypothesis, according to which there is a substantial relation between the increase in access to electricity index value and increase in value of both the indices selected by us and picturing individual components of sustainable development, as well as the increase in the elaborated synthetic index of sustainable development for African countries.
The selection of indices representing components of sustainable development stems from various premises. It is worth mentioning that, in this paper, development is understood in a broad context of economic, social, and environmental changes, which refer to the European understanding of the term “sustainable development”. Nowadays, we are experiencing a situation when the sustainable development of the economy and the human society has been under the threats of regional environmental pollution and large-scale ecological destruction at the same time [8,9]. In terms of economic development, the most often used measure is economic growth, understood as gross domestic product or economic growth in percentage values. However, in the case of economies based on raw materials, such as Nigeria, South Africa, and Libya, they are not reliable, even more so if such a country is inhabited by millions. Therefore, to picture the economic condition of a given country in the best possible way, the decision was made to use the gross domestic product per capita index, which represents the wealth distribution in a society.
The fact that development may not be understood solely in economic terms was already noted by A. Smith, who clearly distinguished the notions of material wealth and welfare. The material wealth is manifested in terms of the aforementioned economic measures, but welfare, due to its interdisciplinary character, is much more difficult to be measured. The welfare of a given country may be constituted by education, public health, access to public services, etc. Thus far, the best synthetic measure of welfare understood as social development is the Human Development Index (HDI). Its components are, among others, life expectancy at birth or expected years of schooling. Social orientation is visible. H. Rosling wrote that indices on actual life, especially those measured for children, are a measure of the temperature of an entire society because if a given country can take care of the youngest ones, provide them with good care and access to medications, and invests in their education, such a country will perform well in the international arena.
The final matter is the environment. According to studies, Africa is the most vulnerable to climate change. To the greatest degree, it will impact farming, which is the basic sector in the majority of African economies. In the face of a demographic explosion, violent phenomena—such as floods, droughts, increase in mean annual temperature—millions of people, who already today must survive for less than USD 2 per day, will lose their life opportunities. Nowadays, development with negligence of environmental matters is impossible, for if one lacks proper consideration for the environment today, in a few years, the economic development will be hindered by an ecological disaster. The matter of respect for the natural environment is obvious in highly developed countries but neglected in developing countries. Very often, the authorities and governments in poor countries must choose between economic growth, social development, and environmental protection.
Summing up the aforementioned issues, it seems that adopting a threefold approach makes it possible to describe the connection between electrification and sustainable growth more precisely. One must remember, though, that growth issues in developing countries are a result of historical, economic, political, social, and cultural conditions. Economy, such as social science, uses mathematical and econometric methods to enrich and broaden the researchers’ toolset. One cannot neglect the fact, though, that the interpretation of the obtained results should be conducted with due diligence. Human life and a man’s chances for improving one’s condition may not be unequivocally interpreted based on even the most perfect model.
The major contribution of our paper is founded on three components. First, we have researched the question of the influence of electrification on the sustainable growth of African countries from a new perspective. Until now, studies concentrated on the research of correlation between indices picturing the electrification level and selected indices of economic development. In other words, the researchers usually analyze if, for example, countries with better average access to electricity feature a better average GDP pc index. In our studies, we assumed a different perspective—we checked whether for each African country there is a connection between the access to electricity (% of populations) index and improvement in selected indices mirroring sustainable development. Such an approach to the study was possible owing to the employment of the Grey Incidence Analysis, rendering it possible to research relations between short time series. Secondly, we elaborated a new, synthetic index of sustainable growth, making consideration for three perspectives—economic, social, and ecological. Thirdly, we researched all African countries. Usually, researches are conducted in the context of sub-Saharan Africa, and countries in North Africa are combined with countries from the Arab Peninsula. In this research, all African countries were included for which data were available, which is a novelty approach to the research of electrification issue. The authors hope that this paper will contribute with new input in the discussion over the question of the importance of access to electric energy for the development of African countries.

2. Literature Review

2.1. Impact of Electrification on African Development

In the past few decades, the world’s energy demand and consumption maintained an uninterrupted growth [10]. The reason for this is the increasing energy consumption in developing countries that is accelerating economic growth. Moreover, phenomena such as population growth and urbanization have become the main force of world energy consumption growth [11,12,13].
Developing countries experience the same as some developed global effects such as rapid population growth, urbanization, and more industrialization. Those effects are determined mostly by the infrastructure for electricity, and it has emerged as an important factor in a country’s growth prospects for future development. The importance of information and communication technologies causes significant electricity demand [14]. At the same time, in sub-Saharan Africa, approximately 81% of the population relies only on traditional biomass fuels for cooking and heating. Using such type of energy is closely connected with such disadvantages: a significant amount of time spent on maintaining the source of energy, maintain mainly by women and children, on the fuel–wood collection, indoor air pollution, deforestation, and soil degradation [15]. Moreover, such a situation contributes to women’s disproportionate lack of access to education or income and inability to escape from poverty [16].
It is worth noticing that electrical energy has more advantages than other types of energy. For example, it enables much more efficient lighting [17], information and communication technologies, and more productive manufacturing of goods [18]. Better access to electricity and electrification, in general, causes energy development. At the same time, energy development has an elaborate impact on economic, social, and environmental development [16].
According to the data, sub-Saharan Africa is the only world region where the per capita consumption of electricity is falling [5]. This phenomenon can be explained by the low access to energy and the demographic boom, which hinders access to energy and causes the statistical inhabitant of Africa to have fewer units of electricity. Because of low electricity consumption across sub-Saharan Africa countries, we can face challenges due to economic growth, but at the same time, it is an insignificant contributor to carbon dioxide emissions and climate change. When we compare that region to all world regions, Africa has the lowest per capita emissions and is among the lowest emissions in terms of GDP output countries [5].
Electricity is considered an important driving force to promote economic and social development in countries. The increasing electricity consumption, especially industrial electricity consumption, can be understood as a symbol of a country’s economic development level [19]. However, there is too little interested in linking energy consumption with access to electricity. The authors express the view that before examining the relationship between energy consumption and income, it is worth looking at the issues of access to electricity. The level of consumption is determined by the access to electricity, and only then may it increase the income per capita. Access to electricity, as was already emphasized, is very sensitive in sub-Saharan Africa.
Later in this paper, the authors will present a literature review and examine existing researches where other authors linking electricity with economic growth, social development, and environmental issues. Over the past decades, numerous studies were conducted to examine the relationship between electricity consumption and economic growth. Most of them show that there is a strong relationship between electricity consumption and economic growth [20,21]. The electricity infrastructure of the countries is becoming a more and more important component of their economies [21]. Even without scientific research, we can say that electricity has become the preferred and dominant form of energy over the expanding portion of economic life in industrial economies. At the same time, it was a major source of improvement of the standard of living and has played a significant role in the technological and scientific advancement of the economy [22].
Wolde-Rufael [23] conducted a study on 17 African countries with annual data from 1971 to 2001. For cointegration, he used bounds tests [24] and for causality, the WALD test [25]. The cointegration results between electricity consumption and economic growth are not clear-cut among African countries. Only half of them are cointegrated (Benin, Cameroon, Republic of Congo, Gabon, Morocco, Nigeria, Sudan, Zambia, and Zimbabwe). Similar to the previous method, the WALD test shreds of evidence are also non-consensus among the selected countries. Based on the whole research of Wolde-Rufael, we can conclude that electricity consumption and economic growth are not related to Algeria, Congo Republic, Kenya, South Africa, and Sudan [26]. The topic of a causal relationship between energy consumption and income was well-studied in the energy economics literature [27] and environment literature. Different studies focused on different regions, countries, and periods and used different methods and variables for energy consumption and income. In the neo-classical framework, no part of economic growth is attributed to the greater use of energy, and it enters the national accounts only as a part of the economy’s output. Such an approach currently is unfortunately not convincing [28].
In many sub-Saharan countries, people are suffering from blackouts. Outages of electricity are frequent and unpredictable. According to the World Bank enterprise surveys, from the years 2006 to 2010, the average length of an outage is 6.6 h [29]. In the same survey, more than 50% of Africa businesses indicated inadequate power supply as a major infrastructure that dampens development [30]. Lack of reliability due to electricity has strong and direct (negative) effects on business activity. Frequent power outages result in foregone sales of goods and services and damaged equipment for businesses. It generated enormous losses for enterprises, calculated as approximately 6% of turnover on average for firms in the formal sector and a round of 16% turnover for informal sector enterprises [4]. Overall, it also affects country economies. Based on data from the World Bank’s Investment Climate Assessments and estimations, the lost load or unserved energy due to blackouts cost sub-Saharan African countries an average of 2.1% of GDP (in countries such as Nigeria or Tanzania, it is even more than 4%) [4].
A chronic problem with electricity affecting not only GDP but, in general, weaken economic growth. Mostly it causes by the lower productivity of the economy. Data collected through the World Bank’s Investment Climate Assessments by surveys and analyzed by Escribano et al. [31] suggest that in most countries of sub-Saharan Africa, infrastructure accounts for 30–60% of the effect of investment climate on firm productivity. Countries that are experiencing power shortages in Africa can enter into short-term leases with specialized operators who install new capacity. Emergency temporary generators account for an estimated 750 MW of capacity in sub-Saharan Africa and at the same time constitute a significant proportion of total capacity in some countries [5]. Unfortunately, such solutions are expensive, unsurprisingly the most expensive in Africa. Emergency power costs around USD 0.20–0.30 per kWh; meanwhile, the average cost of power in sub-Saharan Africa is USD 0.12 per kWh, twice more expensive than in other developing countries [5]. As it was mentioned before, better access to electricity lowers costs for companies and increases the overall level of investment, which leads to better economic growth [32].
Higher accessibility of electricity boosts the process of meeting social needs such as residential and domestic [29]. Moreover, it contributes to capital and labor productivity and promotes the export potentials of countries [33]. At the same time, it positively affects employment, decreases the poverty level [34], and improves the socio-economic development of a country.
Infrastructure, including electricity infrastructure, is also contributing to human development. The biggest effects we can spot in two main sectors are health care and education. Better access to energy improves health care; for example, hospitals can safely store medicines and vaccines [35]. On the other hand, higher access to electricity positively contributes to literacy and primary school graduation rate because students can read and study at any time during day and night. Many researchers showed that effect in their studies [36,37].
Better access to electricity has a significant impact on social development, but only if it will be undertaken sustainably [7]. It means broader usage of renewable sources of energy. At the same time, renewable energy sources such as solar power, biomass power, wind power, hydro-power, and geothermal energy should be utilized to their full potential to avert the further accumulation of greenhouses gases, promote sustainable development, secure energy supply, and support efforts to attain and contribute to social and economic development [38,39].
Growing demand and consumption of energy, apart from positive effects for economic performance, has a serious influence on the environment, especially the consumption of non-renewable energy on a large scale, which we can experience in many developing countries with plenty of resources such as coal. In many rural areas, people who lived on less than USD 2 per day still depend mostly on wood and other biomass fuels for most of their household and activities, which bring them income [16]. On the other hand, the whole power sector in sub-Saharan Africa accounts for less than one percent of global carbon dioxide emissions, excluding South Africa [40].
Many scientists who analyzed the energy industry believed that not only access to electricity but also energy efficiency is an important issue that should arise in debate. According to them, energy efficiency creates an enormous “win–win” opportunity for countries. On the one hand, the government can save more money, and, on the other hand, it leads to reduce negative externalities associated with energy use. Government intervention focused on energy efficiency can improve people’s welfare for two main reasons: Energy-based on the consumption of fossil fuels causes externalities such as harm to human health, climate change, and constraints on the foreign policy objectives of energy-importing countries [41]. Secondly, due to imperfect information, individuals and enterprises may not undertake private investments in energy efficiency. Government intervention due to increasing energy efficiency may use some specific strategies. The government as an entity may invest in energy infrastructure, which benefits efficiency. Additionally, the government may create a special polity that will encourage citizens and companies for private investments, which will benefit the whole economy. Such active intervention of state arises from some economic theories, especially from new structural economy [42].
More energy-efficient technologies offer promise for reducing the financial costs of electricity and environmental damages associated with energy production and usage [43]. Researchers observed that these technologies might not be adopted by individuals and firms due to their financial basis. It is another reason for government intervention in the field of electricity.
Thanks to comparative studies, the authors can demonstrate the ability to examine, compare, and contrast subjects or ideas. Comparative analysis shows how two subjects are similar or show how two subjects are different. Our study uses such an approach on three levels. We contrasted our outcomes with scientists who work separately on electrification and GDP, electrification and social development, and electrification and environmental. It allows a synthetic indicator of sustainable development to be created.

2.2. Essence of Grey Systems

The Grey Systems Theory, when understood as a tool, consists of a series of methods of modeling information uncertainty. It is a complementary theory for statistics, fuzzy logic, and rough set theory. The particular usefulness of the Grey Systems Theory manifests itself in the case of a specific type of uncertainty present in the process of system cognition, that is, the uncertainty that stems from information deficits [44]. These deficits are characterized by a lack of information completeness, little information, and the occurrence of information of a high level of subjectivity. Such an information uncertainty occurs very often in the case of systems, in which people are the key component—that is, economic systems. Due to the aforementioned considerations, the Grey Systems Theory is defined as a methodology being the opposite of the Big Data concept [45]. From a formal point of view, uncertainty modeling with the Grey Systems Theory is executed when analyses are conducted with the use of at least one out of three grey concepts, i.e., grey numbers, whitening function, or distributive understanding of grey.
The Grey Systems Theory, owing to the indicated advantages, is widely used in uncertainty modeling in economic systems. The Grey Systems Theory has been lately used, for example, for problems of:
  • − sustainable development [46,47,48];
  • − analysis of crypto-currencies [49];
  • − allocation of assets [50,51];
  • − credit risk evaluation [52];
  • − innovation and initiative [53];
  • − product prices settlement [54];
  • − analysis of product portfolio [55];
  • − Industry 4.0 [56].

3. Material and Method

3.1. Formal Structure of Models for Relation Analysis in the Grey Systems Theory

In this paper, time series are analyzed, consisting of values of the selected indices of sustainable growth for African countries. Some of the statistics collected and published for African countries feature the character of short time series—often, available data are a dozen or so years old.
In such a case, it is methodologically unreasonable to determine the correlation with the use of statistical measures, such as the Pearson linear correlation index. To verify this paper’s hypothesis, a methodology adequate for modeling short time series was used: the Grey Systems Theory.
The group of the Grey Systems Theory models, allowing for the analysis of relations between short series, is defined as the Grey Incidence Analysis. Within its frame, there are three types of models: distance, area, and panel. First and foremost, time series are modeled with the use of relation area models.
In area models, the similarity between two series is represented by an area plotted between two vectors illustrating subsequent values in the time series. This issue is presented in Figure 1.
In this paper, the most effective model of the Grey Incidence Analysis was used, based on the determination of the relative degree of grey incidence index. Moreover, a methodological triangulation concept was used, consisting in this case in the determination of three variants of the relative degree of the grey incidence index. Each of the variants differs in the method of unitarization of variables. Such an approach provides the possibility of verifying the stability of individual models, especially in the context of an answer to the question of whether the method of scaling variables influences the obtained results considerably.
The formal model of determining the relative degree of the grey incidence index may be presented as a procedure consisting of 5 steps.
Step 1. Determination of the time series set, for which the relative degree of grey incidence indices is determined.
Determination of geometrical probability between charts illustrating time series is plotted in pairs. In each pair, one of the time series is treated as a reference vector, and the other series is treated as an empirical vector. Reference vectors in the proposed model are time series presenting the access to electricity (% of populations) for each of the African countries included in the research. Empirical vectors are, on the other hand, time series presenting one by one: HDI (a social component of sustainable growth), GDP per capita (an economic component of sustainable growth), and CO2 emissions per capita (environmental component of sustainable growth) indices, as well as time series presenting a synthetic index of sustainable growth (the methodology of its determination is presented in Section 3.2).
X k ref = [ x k 1 ref ,   x k 2 ref ,   ,   x k j ref , , x k l ref ]
  • X k ref —reference vector for a kth object, where k = 1 , 2 , , m
  • J—j-th value in the reference series for k-th object j = 1 , 2 , , l
The set of the remaining vectors is as follows:
X k i = [ x k 1 i ,   x k 2 i ,   ,   x k j i , , x k l i ]
  • X k ref —reference vector for a kth object, where k = 1 , 2 , , m
  • J—j-th value in the reference series for k-th object j = 1 , 2 , , l
Step 2. The first stage of time series standardization.
The first stage of time series standardization in the relative degree of the grey incidence model was conducted with three methods, obtaining three models: (a), (b), and (c).
(a)
Standardization that included the division of all terms in the series by their initial values, according to Equations (3) and (4):
Y k ref = [ x k 1 ref x k 1 ref ,   x k 2 ref x k 1 ref ,   , x k j ref x k 1 ref   , , x k l ref x k 1 ref ] = [ y k 1 ref ,   y k 2 ref ,   , y k j ref   , , y k l ref ]
Y k i = [ x k 1 i x k 1 i ,   x k 2 i x k 1 i ,   , x k j i x k 1 i   , , x k l i x k 1 i ] = [ y k 1 i , y k 2 i ,   , y k j i   , , y k l i ]
(b)
Standardization that included the division of all terms in the series by arithmetic means for all values, according to Equations (5) and (6):
Y k ref = [ x k 1 ref x ¯ k r e f ,   x k 2 ref x ¯ k r e f ,   , x k j ref x ¯ k r e f   , , x k l ref x ¯ k r e f ] = [ y k 1 ref ,   y k 2 ref ,   , y k j ref   , , y k l ref ]
Y k i = [ x k 1 i x ¯ k i ,   x k 2 i x ¯ k i ,   , x k j i x ¯ k i   , , x k l i x ¯ k i ] = [ y k 1 i , y k 2 i ,   , y k j i   , , y k l i ]
(c)
Standardization that included the division of all terms in the series by maximum values, according to Equations (7) and (8):
Y k r e f = [ x k 1 r e f x k m a x r e f ,   x k 2 r e f x k m a x r e f ,   , x k j r e f x k m a x r e f   , , x k l r e f x k m a x r e f ] = [ y k 1 r e f ,   y k 2 r e f ,   , y k j r e f   , , y k l r e f ]
Y k i = [ x k 1 i x k m a x i ,   x k 2 i x k m a x i ,   , x k j i x k m a x i   , , x k l i x k m a x i ] = [ y k 1 i , y k 2 i ,   , y k j i   , , y k l i ]
Step 3. The second stage of time series standardization.
Then, in the second stage of the standardization procedure, from each value in the time series, their initial values are deducted, which is described as zeroing initial elements of the time series. After the standardization process, the time series assumes the form presented by Equations (9) and (10). This stage is common for each of the three models described in Step 2: (a), (b), and (c).
Y k ref = [ y k 1 ref y k 1 ref ,   y k 2 ref y k 1 ref ,   , y k j ref y k 1 ref , , y k l ref y k 1 ref ] = [ y k 1 ref ,   y k 2 ref , , y k j ref , , y k l ref ]
Y k i = [ y k 1 i y k 1 i ,   y k 2 i y k 1 i ,   , y k j i y k 1 i   , , y k l i y k 1 i ] = [ y k 1 i ,   y k 2 i , , y k j i , , y k l i ]
Step 4. Determination of model parameters | s ref | , | s i | , | s ref s i | .
Model parameters, i.e., | s ref | , | s i | , | s ref s i | for each of the three decision models, (a), (b), and (c), are determined with Equations (11)–(13).
| s ref | = | j = 2 l 1 y k j ref + 0.5 · y k l ref |
| s i | = | j = 2 l 1 y k j i + 0.5 · y k l i |
| s ref s i | = | j = 2 l 1 ( y k j i y k j ref ) + 0.5 · ( y k l i y k l ref ) |
Step 5. Calculation of the relative degree of grey incidence r ref i
The relative degree of grey incidence r ref i is determined with Equation (14).
r ref i = 1 + | s ref | + | s i | 1 + | s ref | + | s i | + | s ref s i |
The values, which may assume the relative degree of grey incidence, are from the range of (0–1). The lower the r ref i index value, the smaller the geometrical similarity of the two time series. The higher the r ref i index value, the greater the geometrical similarity of two time series.

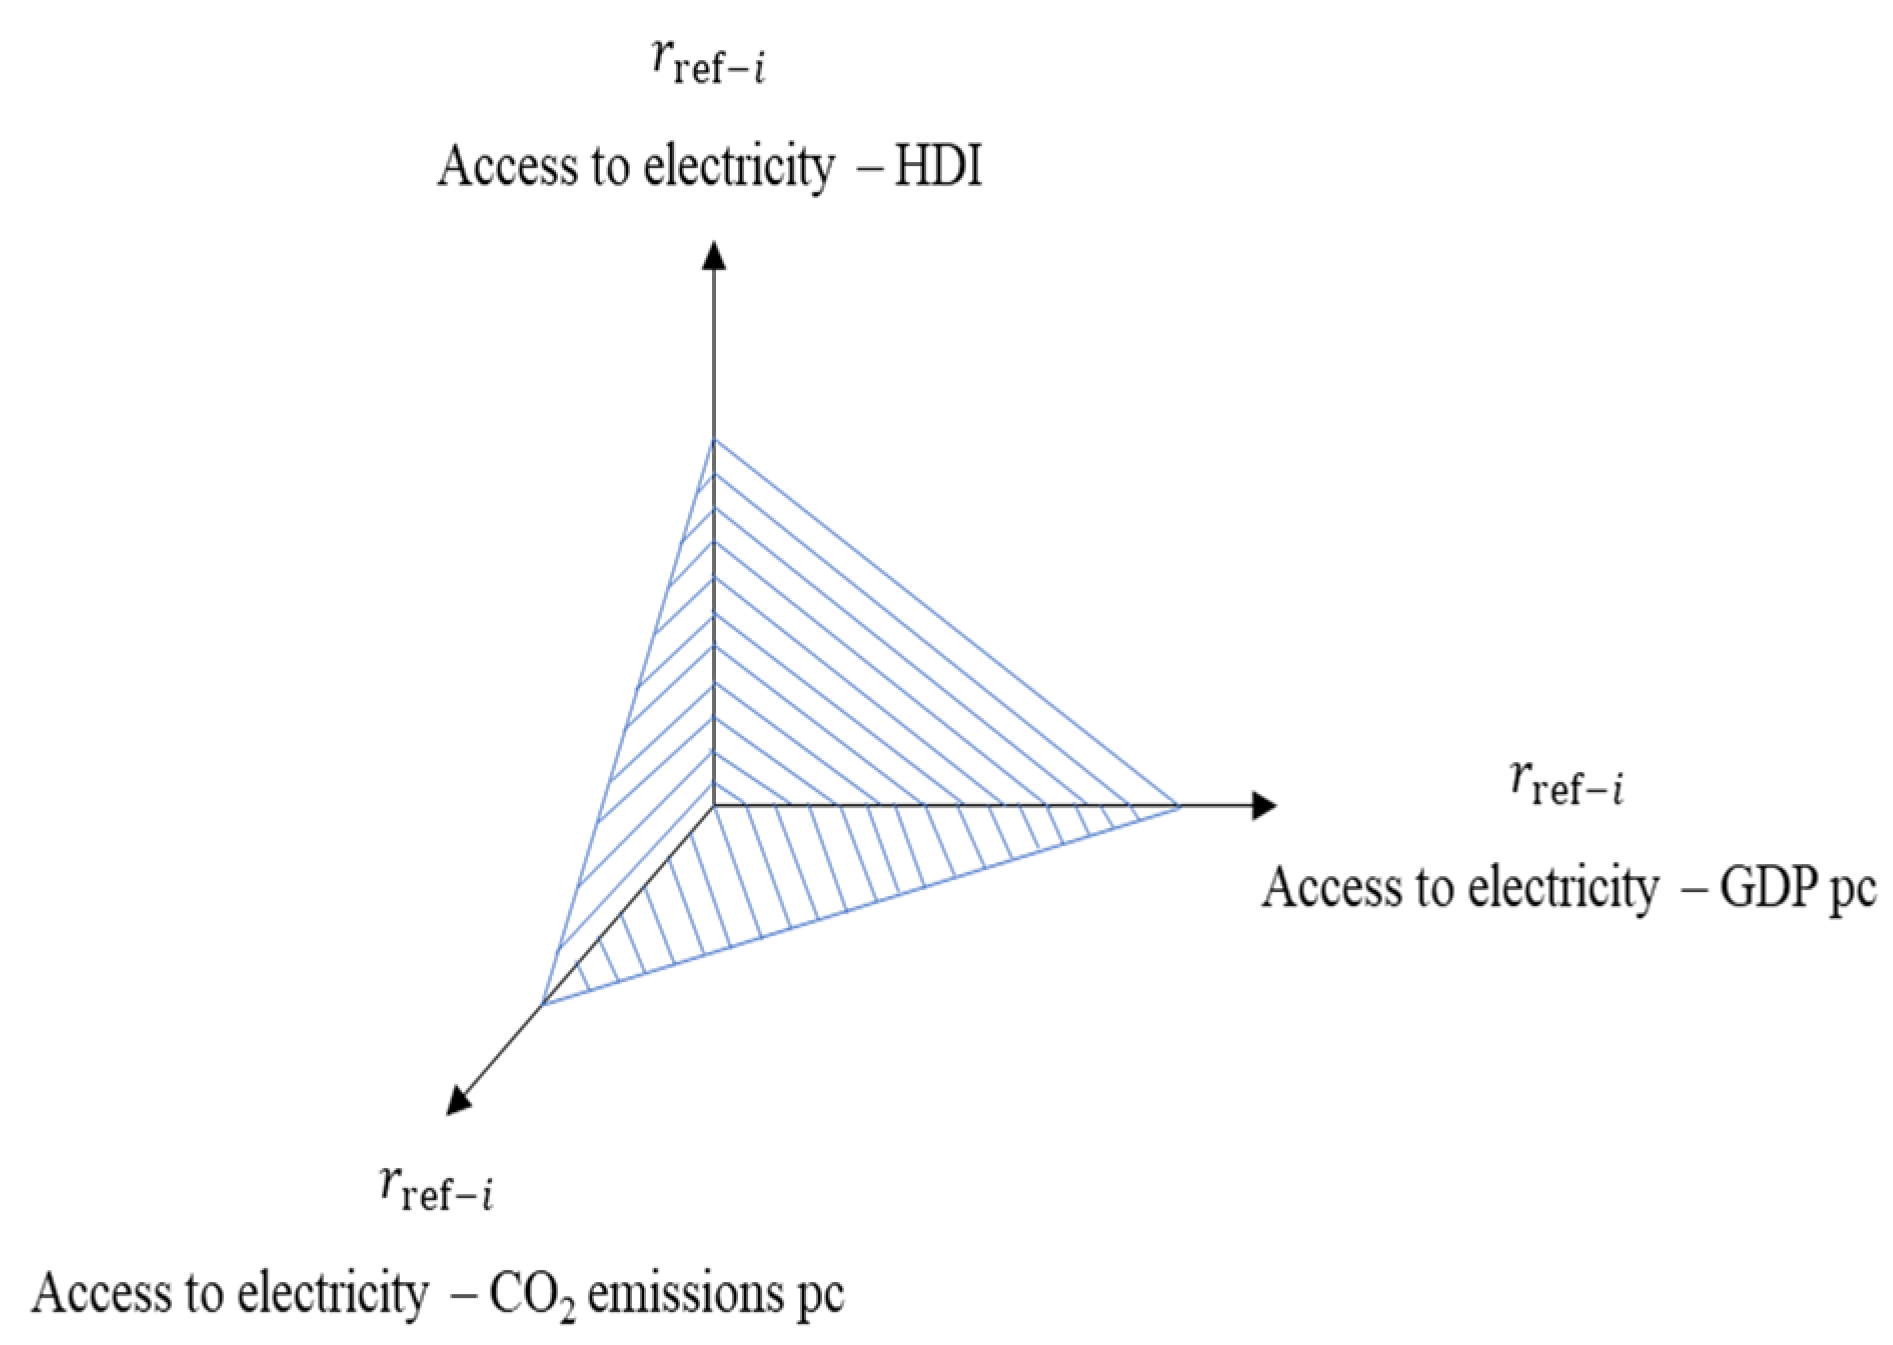
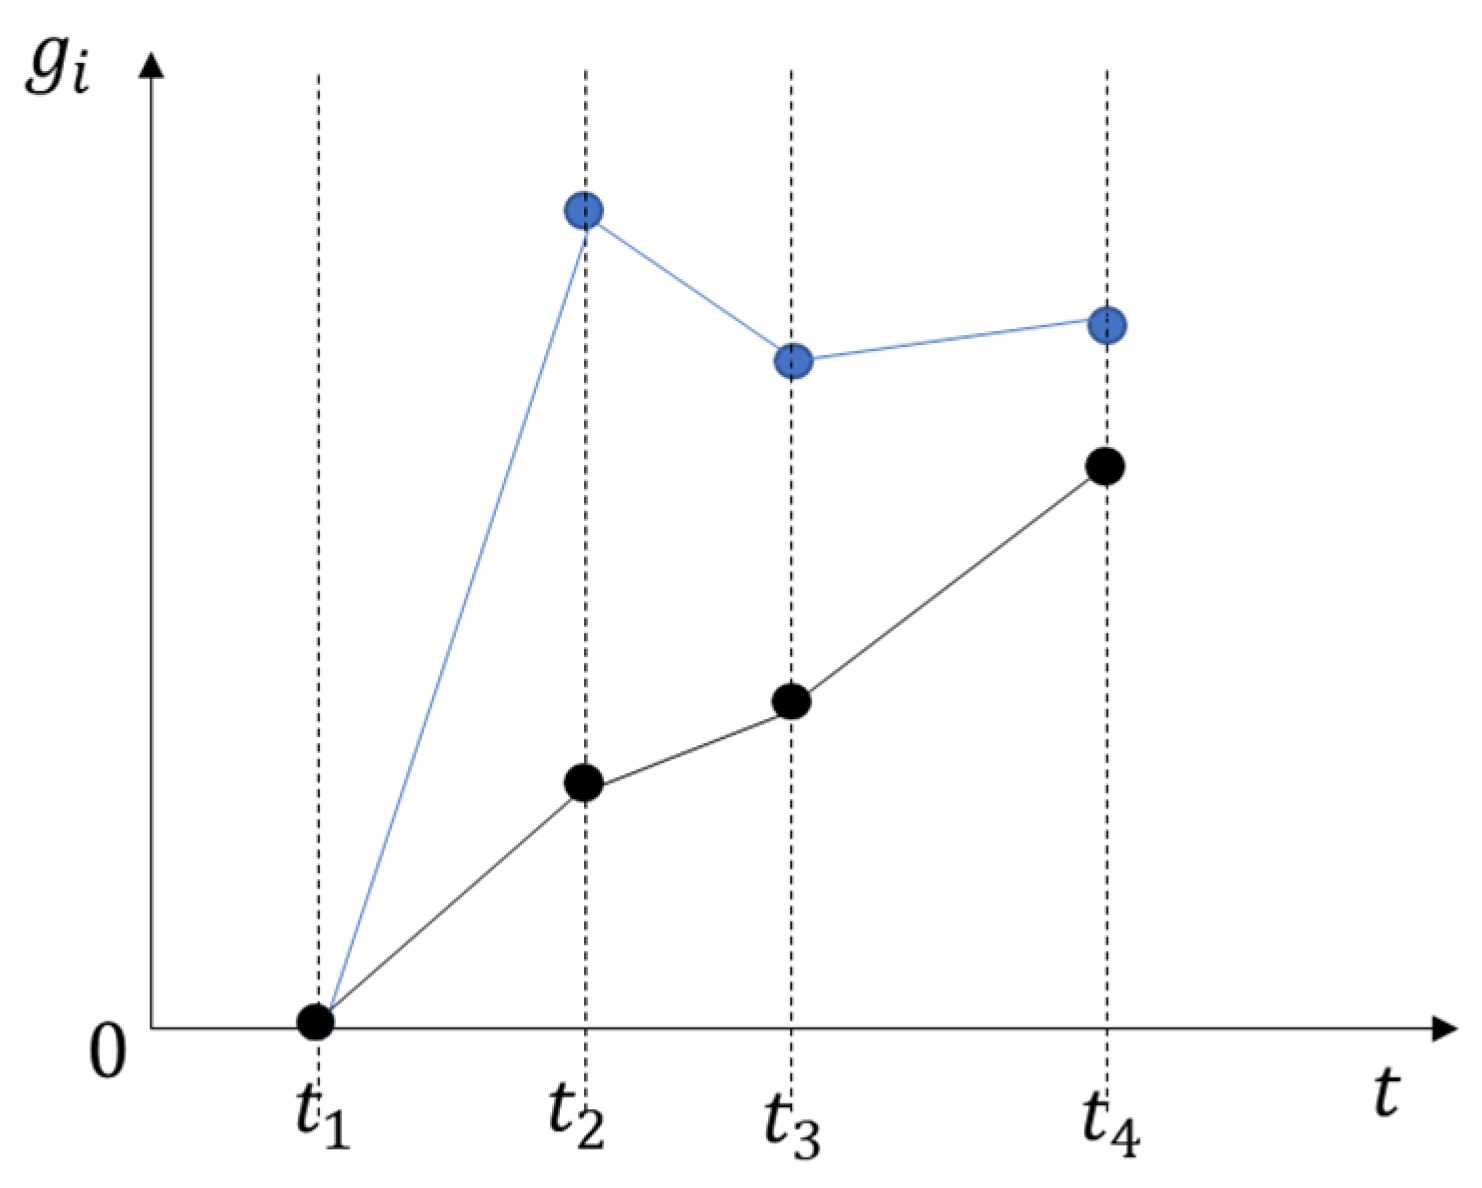
3.2. Development of Synthetic Index of Sustainable Growth

The synthetic index of sustainable growth is determined based on three components:
Index r ref i for the relation of access to electricity—HDI;
Index r ref i   for the relation of access to electricity—GDP pc;
Index r ref i for the relation of access to electricity—CO2 emissions pc.
Each of the three indices is plotted on a radar graph (Figure 2). The maximum field area that is possible to be obtained is assigned with 100%. This field may be determined with the use of the analytical method of calculating the areas of polygons (Gaussian elimination):
F = 1 2 | i = 1 n X i ( Y i + 1 Y i = 1 ) |                                    
where:
F —calculated area;
X i ,   Y i —coordinates of the ith vertex; vertices are numbered one by one, from 1 to n.
The value of the synthetic index of sustainable growth for individual objects is defined through the determination of a ratio of the area (in percent) plotted on the radar graph with values of component indices to the maximum area possible to be obtained.

4. Empirical Results

4.1. Characteristics of Research Sample

The study makes consideration for results obtained for 50 African countries. Two (2) countries, Burundi and Somalia, were excluded from the study. The reason for the exclusion was data deficits that rendered it impossible to execute the calculation procedure described in Chapter 3. The final set of African countries, constituting the research sample included, is as follows: Algeria ( o 1 ), Angola ( o 2 ), Benin ( o 3 ), Botswana ( o 4 ), Burkina Faso ( o 5 ), Cameroon ( o 6 ), Central African Republic ( o 7 ), Chad ( o 8 ), Comoros ( o 9 ), Congo, Dem. Rep. ( o 10 ), Congo, Rep. ( o 11 ), Cote d’Ivoire ( o 12 ), Djibouti ( o 13 ), Egypt, Arab Rep. ( o 14 ), Equatorial Guinea ( o 15 ), Eritrea ( o 16 ), Eswatini ( o 17 ), Ethiopia ( o 18 ), Gabon ( o 19 ), Gambia ( o 20 ), Ghana ( o 21 ), Guinea ( o 22 ), Guinea-Bissau ( o 23 ), Kenya ( o 24 ), Lesotho ( o 25 ), Liberia ( o 26 ), Libya ( o 27 ), Madagascar ( o 28 ), Malawi ( o 29 ), Mali ( o 30 ), Mauritania ( o 31 ), Mauritius ( o 32 ), Morocco ( o 33 ), Mozambique ( o 34 ), Namibia ( o 35 ), Niger ( o 36 ), Nigeria ( o 37 ), Rwanda ( o 38 ), Senegal ( o 39 ), Seychelles ( o 40 ), Sierra Leone ( o 41 ), South Africa ( o 42 ), South Sudan ( o 43 ), Sudan ( o 44 ), Tanzania ( o 45 ), Togo ( o 46 ), Tunisia ( o 47 ), Uganda ( o 48 ), Zambia ( o 49 ), Zimbabwe ( o 50 ). Data from the period of 2010–2018 were used in the research.

4.2. Research Results

Step 1. Determination of the time series set, for which the relative degree of grey incidence indices is determined.
For each country, a database was compiled, in which the values of the following indices were collected:
Access to electricity (% of the population)—as a reference time series ( X k r e f ) ;
HDI—as the first empirical time series ( X k 1 ) ;
GDP per capita—as the second empirical time series ( X k 2 ) ;
CO2 emissions per capita—as the third empirical time series ( X k 3 ) .
Sample values of individual time series for selected African countries are presented in Table 1.
Step 2. The first stage of time series standardization.
(a)
Sample results of standardization that included the division of all terms in the series by their initial values, according to Equations (3) and (4) for selected African countries, are presented in Table 2.
(b)
Sample results of standardization that included the division of all terms in the series by arithmetic mean for all values in the series, according to Equations (5) and (6) for selected African countries, are presented in Table 3.
(c)
Sample results of standardization that included the division of all terms in the series by maximum values, according to Equations (7) and (8) for selected African countries, are presented in Table 4.
Step 3. The second stage of time series standardization.
In Step 3, for each model: (a), (b), and (c) is a result of Step 2 of the procedure, the second stage of standardization is executed with deduction of initial values from every value in the time series, which is defined as zeroing of initial elements of the time series. The results of the second stage of standardization for all models are presented in Table 5, Table 6 and Table 7.
Step 4. Determination of model parameters | s ref | , | s i | , | s ref s i | .
The results of the fourth step of the proposed model are presented in Table 8.
Step 5. Calculation of the relative degree of grey incidence r ref i .
Table 9 presents the determined values of the relative degree of grey incidence indices between the access to electricity and the HDI, GDP pc, and CO2 emissions pc indices for two selected African countries.
According to the procedure presented in Section 3.2, and based on the relative degree of grey incidence r ref i indices for the relation between the dynamics of changes in access to electricity (HDI), access to electricity (GDP pc), and access to electricity (CO2 emissions pc), the values of synthetic growth index were determined for each of the studied African countries in three variants: (a), (b) and (c).
Table 10 and Figure 3, Figure 4 and Figure 5 presents cumulative results for values of synthetic sustainable growth indices for the studied African countries in 2010–2018.

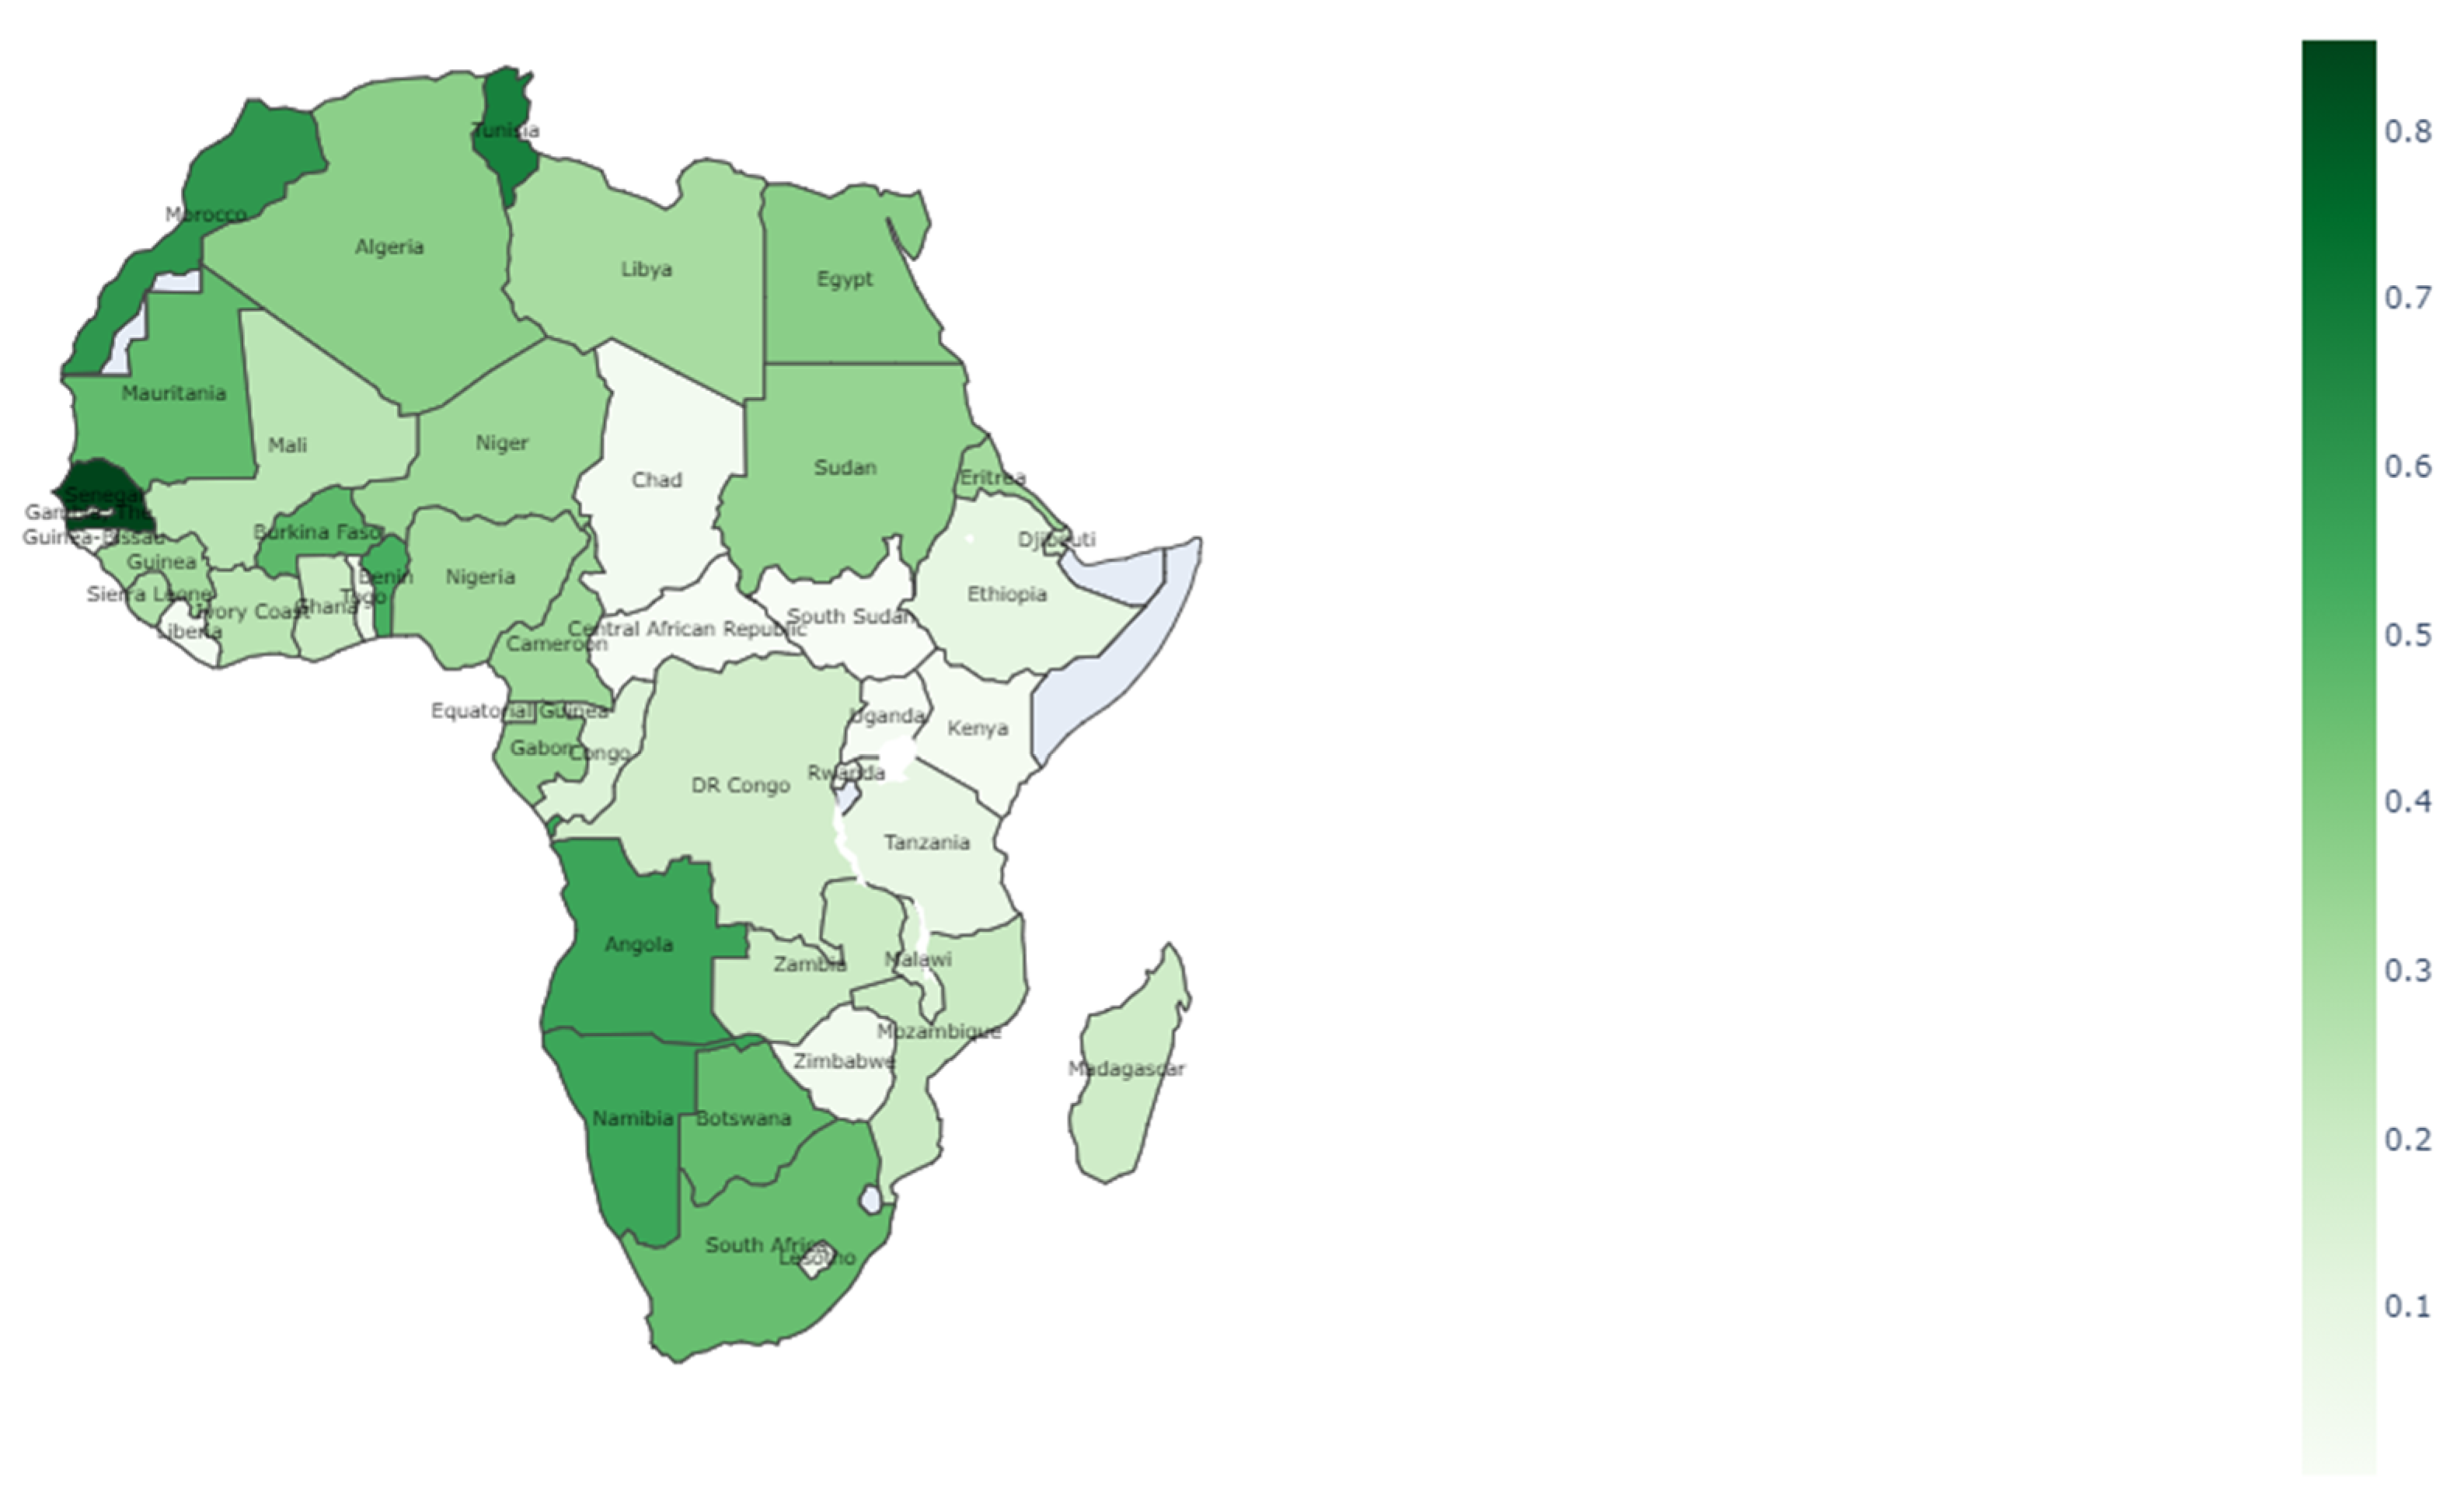
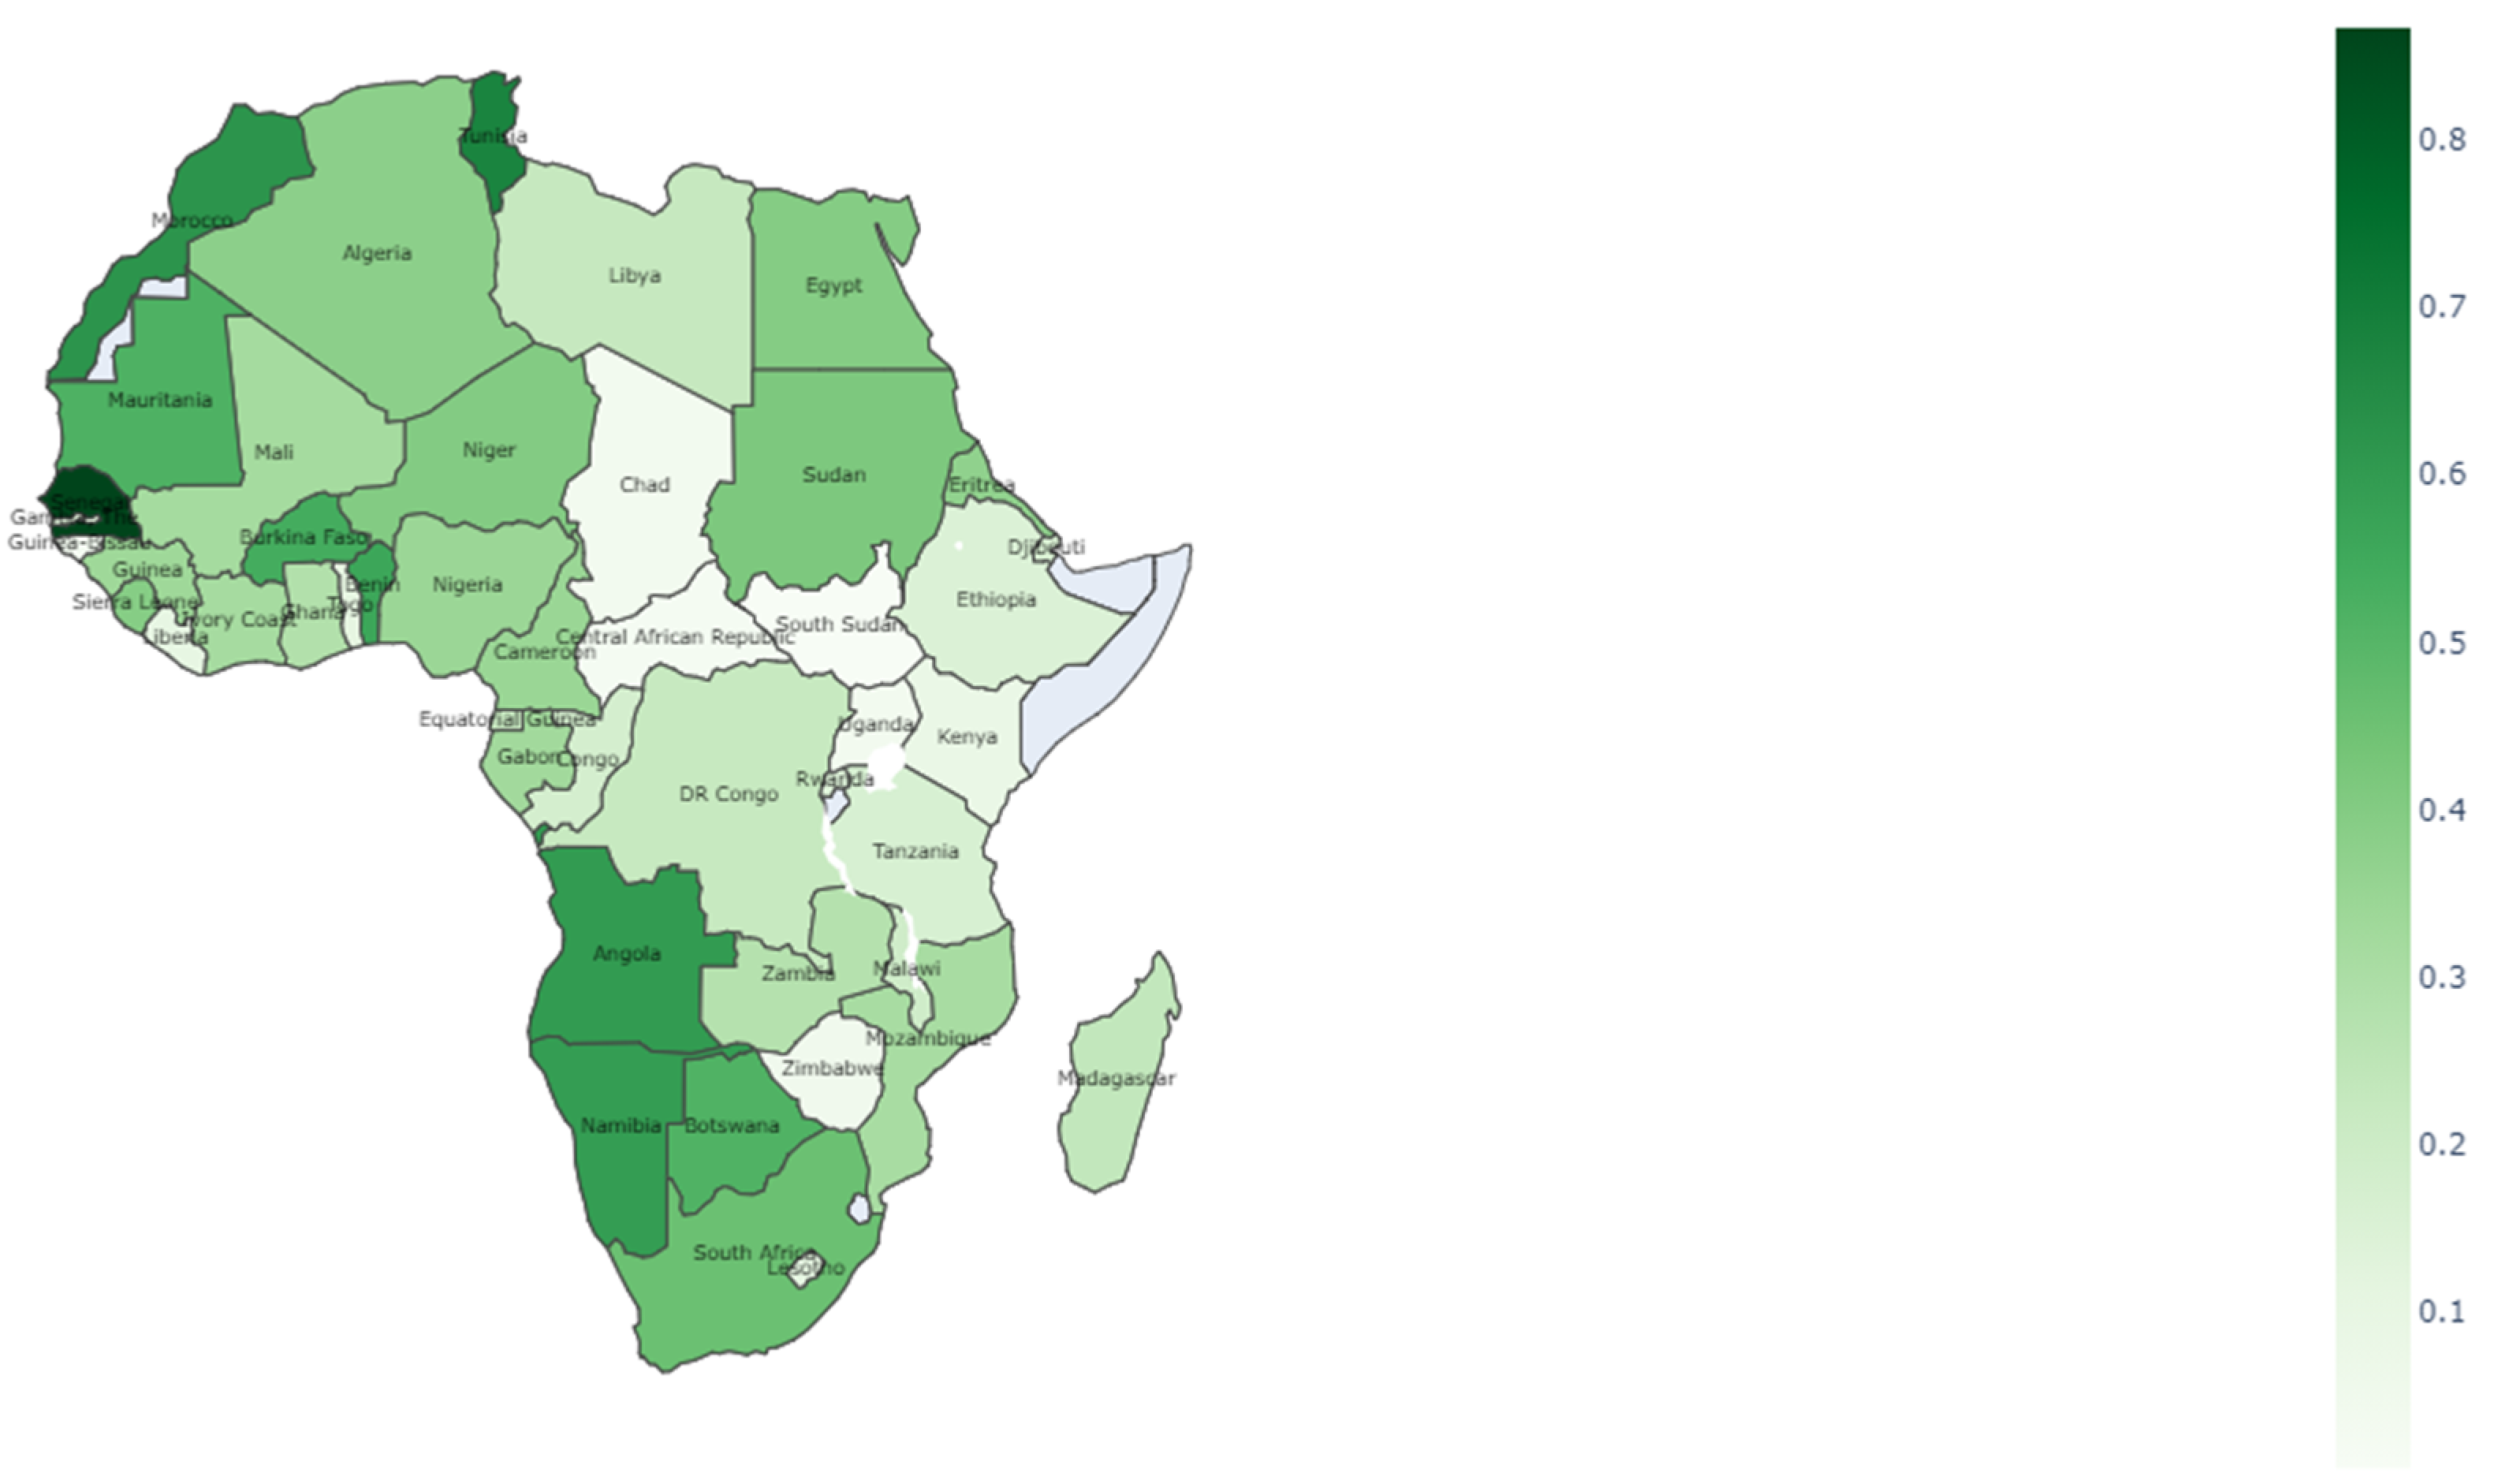
4.3. Results Discussion

The first aim of this paper was to define the relationship between the dynamics of the access to electricity (% of populations) index and the dynamics in changes in indices mirroring individual components of sustainable development, i.e., component connected with social development (represented by the HDI index), component connected with economic development (represented by the GDP per capita index), and component connected with environmental development (represented by the CO2 emissions per capita index) for African countries.
Relationships between dynamics of individual indices were defined through the determination of values of the relative degree of grey incidence indices. This index is determined for two time series—it may assume a value in the range of 0.5–1.0. The higher value of the index, the more extensive the relation between the dynamics of the researched time series. If for a given country, there would be extensive relations between, for example, the dynamics of the access to electricity (% of populations) index and the dynamics of the HDI index, it would mean that considerable improvement in the access to electricity index influences the considerable improvement of the HDI index for the country. Additionally, analogously, if there were extensive relations between the dynamics of the access to electricity (% of populations) index and the dynamics of the GDP pc index, it would mean that the considerable improvement in the access to electricity (% of populations) index influences the considerable improvement in the GDP pc index.
What is important, the direction of reasoning assumed in this paper is different from the correlation between two selected indices often adopted in studies. We did not want to verify if, for example, countries with better average access to electricity feature a better average GDP pc index. For the aforementioned example, our direction of reasoning pertains to the question of whether, for each country, there is a relation between the improvement of the access to electricity (% of populations) index and improvement of the GDP pc index.
For subsequent ranges of values of the relative degree of grey incidence r ref i index, we have assumed the following scale of relation extent:
r ref i ( 0.5 ÷ 0.6 ) —very weak impact of the access to electricity onto a selected index;
r ref i ( 0.6 ÷ 0.7 ) —weak impact of the access to electricity onto a selected index;
r ref i ( 0.7 ÷ 0.8 ) —moderate impact of the access to electricity onto a selected index;
r ref i ( 0.8 ÷ 0.9 ) —strong impact of the access to electricity onto a selected index;
r ref i ( 0.9 ÷ 1.0 ) —very strong impact of the access to electricity onto a selected index.
The scale shows that, for example, if for a given country the index between the dynamics of the access to electricity (% of populations) and the dynamics of the GDP pc amounts to 0.95, then there is a highly positive relationship between them—in other words: there is a very strong impact of the access to electricity index improvement onto the improvement of the GDP pc index. As a consequence, the dynamics of the GDP pc index are fundamentally influenced by the dynamics of the access to electricity (% of populations) index.
As a result of the conducted research, the highest values of indices were featured by the most developed African countries, for example, Senegal, Ivory Coast, Libya, Morocco, and Tunisia. All fragmentary results are presented in Table 11, Table 12 and Table 13. This means that the very strong impact on the dynamics of their indices, picturing individual components of sustainable growth, is exerted by the improving access to electric energy. The worst performing countries in the setups are especially: South Sudan, Guinea-Bissau, and Liberia. This means that in the face of lack of improving access to electric energy, these countries feature the worst dynamics of indices picturing individual components of sustainable growth (in the research, we used HDI, GDP per capita, and CO2 emissions per capita indices). In the context of the conducted studies, it must be stated that improving access to electricity is the prerequisite for both the development itself and especially for the sustainable growth of African countries. A lack of improvement in access to electric energy is the fundamental barrier in development, especially in the case of the poorest African countries. The investments in the development alone, for example, the development understood economically, do not contribute to the improvement of the quality of human life. For instance, in Nigeria, in 2015, the GDP value was higher than in Poland, and in the same year, the GDP per capita amounted to USD 5500, and 80 million people (of which 75% were inhabitants of rural areas) were lacking access to electric energy. Nigeria is an example of a country with an economy based on raw materials, which generates the vast majority of its GDP from the export of crude oil and petroleum products. An increase in electrification should not be the sole goal in itself but a step forward on the path of building better foundations for economic growth and social development. The second aim of this paper was to define the relationship between the dynamics of the access to electricity (% of populations) index and the dynamics of a synthetic index of sustainable growth proposed by us, based on HDI, GDP per capita, and CO2 emissions per capita indices. Irrespective of the used model variant ((a), (b), or (c)), the highest values of the synthetic index of sustainable growth were featured by three countries: Senegal, Tunisia, and Morocco. The countries with the worst values of this index were South Sudan, Guinea-Bissau, and the Central African Republic. Thus, the research results for the elaborated synthetic index of development confirm the relations observed during studies on relations between the dynamics of the access to an electric energy index and individual indices illustrating the dynamics of subsequent components of sustainable growth.

5. Conclusions

In this paper, we researched how the change in the dynamics of the electrification level influences the dynamics of indices picturing the sustainable growth of African countries. We utilized the approach based on the analysis of short time series with the Grey Incidence Analysis method. This is quite a novelty in comparison to the hitherto studies, based on statistical analyses, requiring large trial samples.
Until now, studies mostly concentrated on the analysis of the correlation between indices picturing the electrification level and selected indices of economic development. Owing to our approach, we could analyze the connection between the increase (or decrease) in the electrification level (access to electricity) and values of sustainable development indices (HDI, GDP per capita, and CO2 emissions per capita) for each individual African country. Moreover, we defined the relationship between the dynamics of the access to electricity index and the dynamics of a synthetic index of sustainable growth proposed by us, based on the HDI, GDP per capita, and CO2 emissions per capita indices. The studies were conducted for a group of all African countries, for which the data on the electrification level indices and the components of synthetic development are published.
The obvious practical implication of the obtained model is the recommendation for governments of African countries to invest in the development of the power sector and electrification on a wide scale. The conducted research allowed us to Equationte a thesis that the increase in the electrification level may favor a considerable increase in all indices of sustainable growth. As was stressed at the beginning, only Algeria, Egypt, Morocco, and Seychelles feature full, 100% access to electric energy. The problems, however, include deficiencies of governmental institutions and a high level of corruption. This spurs the lack or too low an interest in the matters of access to electric energy among local economic decision-makers. This is, however, a clear signal for international institutions, such as the UN, World Bank, and Development Assistance Committee, providing development assistance. The development assistance donors, when investing in Africa, focus mainly on the social infrastructure (20–30% of funds from development assistance financing), such as investments in education, access to water, and public services. These are important aspects, but based on the elaborated model, the investments in electrification will bring both an improvement of economic indices (GDP per capita) and a higher HDI index level, thus contributing to the development. Moreover, apart from the improvement in the quality of people’s lives, improved access to electricity will spur growth in entrepreneurship and facilitate running a business. It is thus recommended for donor countries and institutions providing multilateral assistance to develop specific projects and programs facilitating the development of electrification in African countries.
The great advantage of the proposed method is that it enables the analysis of short time series (thanks to the application of the method based on the gray systems theory). However, in the case of long time series, it becomes possible to use statistical-based studies (e.g., correlation studies). In this case, the advantages of the developed method are limited. Considering, however, that most of the world’s data on the issues of sustainable development are short-term in nature, the developed method has a significant advantage over statistical methods.
Conclusions drawn from the study indicate that electrification should be a priority for governments of African countries. For the authors, however, the notion of electrification was understood as the access to energy, irrespective of its origin. Due to the global climate agenda, which aims at achieving climatic neutrality through the reduction in CO2 emission, as well as the potential of African countries (climatic conditions), it seems reasonable to conduct future research with differentiation between the traditionally sourced energy (e.g., consumption of hard coal or brown coal) and energy from renewable sources. The research could deliver recommendations for concrete African countries, which electric energy type they should invest in to maximize benefits (including the economic ones) and, at the same time, minimize losses (mainly environmental ones). Such research would have to make consideration for access to raw materials (many African countries have considerable coal beds) and varied potential for renewable energy sources (insolation, winds frequency and speed, water resources).

Author Contributions

Conceptualization, M.N., A.R. and P.Ł.; methodology, M.N.; software, M.N.; validation, M.N., A.R. and P.Ł.; formal analysis, M.N.; investigation, M.N., A.R. and P.Ł.; resources, A.R.; data curation, A.R.; writing—original draft preparation, M.N., A.R. and P.Ł.; writing—review and editing, M.N., A.R. and P.Ł.; visualization, M.N.; supervision, M.N., A.R. and P.Ł.; project administration, M.N., A.R. and P.Ł.; funding acquisition M.N., A.R. and P.Ł. All authors have read and agreed to the published version of the manuscript.

Funding

The publication was financed from the funds for the statutory activity of the Faculty of Engineering Management at Poznan University of Technology, under the grant: Selected applications of grey systems theory and classical quantitative methods in management and quality sciences, No. 0811/SBAD/1031, Project leader—Marcin Nowak, PhD, and statutory funds of Poznań University of Economcs and Business.

Institutional Review Board Statement

Not applicable.

Informed Consent Statement

Not applicable.

Data Availability Statement

Not applicable.

Conflicts of Interest

The authors declare no conflict of interest.

References

  1. Barbier, E. The green economy post Rio+20. Science 2012, 338, 887–888. [Google Scholar] [CrossRef] [PubMed]
  2. Szabó, S.; Bódis, K.; Huld, T.; Moner-Girona, M. Sustainable energy planning: Leapfrogging the energy poverty gap in Africa. Renew. Sustain. Energy Rev. 2013, 28, 500–509. [Google Scholar] [CrossRef]
  3. World Energy Outlook 2012—Analysis—IEA. Available online: https://www.iea.org/reports/world-energy-outlook-2012 (accessed on 26 July 2021).
  4. Eberhard, A.; Rosnes, O.; Shkaratan, M.; Vennemo, H. Africa’s Power Infrastructure: Investment, Integration, Efficiency. Dir. Dev. Infrastruct. 2011. [Google Scholar] [CrossRef]
  5. Eberhard, A.; Shkaratan, M. Powering Africa: Meeting the financing and reform challenges. Energy Policy 2012, 42, 9–18. [Google Scholar] [CrossRef]
  6. Banerjee, S.; Wodon, Q.; Diallo, A.; Pushak, T.; Uddin, E.; Tsimpo, C.; Foster, V. Access, Affordability and Alternatives: Modern Infrastructure Services in Sub-Saharan Africa; Background Paper 2; Africa Infrastructure Country Diagnostic, World Bank: Washington, DC, USA, 2008. [Google Scholar]
  7. Chirambo, D. Addressing the renewable energy financing gap in Africa to promote universal energy access: Integrated renewable energy financing in Malawi. Renew. Sustain. Energy Rev. 2016, 62, 793–803. [Google Scholar] [CrossRef]
  8. Panwar, N.L.; Kaushik, S.C.; Kothari, S. Role of renewable energy sources in environmental protection: A review. Renew. Sustain. Energy Rev. 2010, 15, 1513–1524. [Google Scholar] [CrossRef]
  9. Jayanthakumaran, K.; Verma, R.; Liu, Y. CO2 emissions, energy consumption, trade and income: A comparative analysis of China and India. Energy Policy 2012, 42, 450–460. [Google Scholar] [CrossRef]
  10. Suganthi, L.; Samuel, A.A. Energy models for demand forecasting—A review. Renew. Sustain. Energy Rev. 2012, 16, 1223–1240. [Google Scholar] [CrossRef]
  11. Apergis, N.; Payne, J.E. Renewable and non-renewable electricity consumption-growth nexus: Evidence from emerging market economies. Appl. Energy 2011, 88, 5226–5230. [Google Scholar] [CrossRef]
  12. Ouedraogo, N.S. Energy consumption and human development: Evidence from a panel cointegration and error correction model. Energy 2013, 63, 28–41. [Google Scholar] [CrossRef]
  13. Chen, S.-T.; Kuo, H.-I.; Chen, C.-C.; Chen, S.-T.; Kuo, H.-I.; Chen, C.-C. The relationship between GDP and electricity consumption in 10 Asian countries. Energy Policy 2007, 35, 2611–2621. [Google Scholar] [CrossRef]
  14. Apergis, N.; Payne, J.E.; Apergis, N.; Payne, J. A dynamic panel study of economic development and the electricity consumption-growth nexus. Energy Econ. 2011, 33, 770–781. [Google Scholar] [CrossRef]
  15. Wicke, B.; Smeets, E.; Watson, H.; Faaij, A. The current bioenergy production potential of semi-arid and arid regions in sub-Saharan Africa. Biomass Bioenergy 2011, 35, 2773–2786. [Google Scholar] [CrossRef]
  16. Kaygusuz, K. Energy services and energy poverty for sustainable rural development. Renew. Sustain. Energy Rev. 2011, 15, 936–947. [Google Scholar] [CrossRef]
  17. Fouquet, R. Heat, Power and Light: Revolutions in Energy Services; Edward Elgar: Cheltenham, Northampton, UK, 2008. [Google Scholar]
  18. Kander, A.; Malanima, P.; Warde, P. Power to the People: Energy in Europe over the Last Five Centuries; Princeton University Press: New Jersey, NJ, USA, 2014. [Google Scholar]
  19. Shao, Z. On electricity consumption and economic growth in China. Renew. Sustain. Energy Rev. 2017, 76, 353–368. [Google Scholar] [CrossRef]
  20. Ferguson, R.; Wilkinson, W.; Hill, R.; Ferguson, R.; Wilkinson, W.; Hill, R. Electricity use and economic development. Energy Policy 2000, 28, 923–934. [Google Scholar] [CrossRef]
  21. Yoo, S.H. The causal relationship between electricity consumption and economic growth in the ASEAN countries. Energy Policy 2006, 34, 3573–3582. [Google Scholar] [CrossRef]
  22. Rosenberg, N. The Role of Electricity in Industrial Development. Energy J. 1998, 19, 7–24. [Google Scholar] [CrossRef]
  23. Wolde-Rufael, Y. Electricity consumption and economic growth: A time series experience for 17 African countries. Energy Policy 2006, 34, 1106–1114. [Google Scholar] [CrossRef]
  24. Pesaran, M.H.; Shin, Y.; Smith, R.J. Bounds testing approaches to the analysis of level relationships. J. Appl. Econom. 2001, 16, 289–326. [Google Scholar] [CrossRef]
  25. Toda, H.Y.; Yamamoto, T. Statistical inference in vector autoregressions with possibly integrated processes. J. Econom. 1995, 66, 225–250. [Google Scholar] [CrossRef]
  26. Tang, C.F. A re-examination of the relationship between electricity consumption and economic growth in Malaysia. Energy Policy 2008, 36, 3067–3075. [Google Scholar] [CrossRef]
  27. Mozumder, P.; Marathe, A. Causality relationship between electricity consumption and GDP in Bangladesh. Energy Policy 2007, 35, 395–402. [Google Scholar] [CrossRef]
  28. Alam, M.S. Economic Growth with Energy; MPRA Paper No. 1260; MPRA: Boston, MA, USA, November 2006. [Google Scholar]
  29. Ogundipe, A.A.; Akinyemi, O.; Ogundipe, O.M. Electricity Consumption and Economic Development in Nigeria. Int. J. Energy Econ. Policy 2016, 6, 134–143. [Google Scholar] [CrossRef] [Green Version]
  30. Jones, C.I. Intermediate Goods and Weak Links in the Theory of Economic Development. Am. Econ. J. Macroecon. 2011, 3, 1–28. [Google Scholar] [CrossRef] [Green Version]
  31. Escribano, A.; Guasch, J.; Pena, J. Assessing the Impact of Infrastructure Quality on Firm Productivity in Africa: Cross-Country Comparisons Based on Investment Climate Surveys from 1999 to 2005; Doc. Trab. Econ. Ser. Working Paper 9; World Bank: Washington, DC, USA, 2009. [Google Scholar]
  32. Reinikka, R.; Svensson, J. Confronting Competition Investment Response and Constraints in Uganda; World Bank: Washington, DC, USA, 1999; Volume 2242. [Google Scholar] [CrossRef]
  33. Narayan, P.K.; Smyth, R. Multivariate granger causality between electricity consumption, exports and GDP: Evidence from a panel of Middle Eastern countries. Energy Policy 2009, 37, 229–236. [Google Scholar] [CrossRef]
  34. Cotte, A.; Clara, P.; Pardo Martínez, I.; Poveda, A.C.; Pardo Martínez, C.I. Trends in Economic Growth, Poverty and Energy in Colombia: Long-Run and Short-Run Effects. Energy Syst. 2011, 2, 281–298. [Google Scholar] [CrossRef] [Green Version]
  35. Jimenez, A.; Olson, K. Renewable Energy for Rural Health Clinics, National Renewable Energy Laboratory. Renewable Energy for Rural Health Clinics. Available online: https://www.nrel.gov/docs/legosti/fy98/25233.pdf (accessed on 7 April 2021).
  36. Barnes, D.F. Electric Power for Rural Growth: How Electricity Affects Rural Life in Developing Countries; Westview Press: Boulder, CO, USA, 1988. [Google Scholar]
  37. Foley, G. Electricity for Rural People; Panos Institiue: London, UK, 1991; Volume 1. [Google Scholar]
  38. Renewable Energy Sources and Climate Change Mitigation—IPCC. Available online: https://www.ipcc.ch/report/renewable-energy-sources-and-climate-change-mitigation/ (accessed on 26 July 2021).
  39. Uddin, S.N.; Taplin, R. Trends in renewable energy strategy development and the role of CDM in Bangladesh. Energy Policy 2009, 37, 281–289. [Google Scholar] [CrossRef]
  40. International Energy Agency, CO2 Emissions from Fuel Combustion, IEA, France 2011. Available online: https://www.oecd-ilibrary.org/energy/co2-emissions-from-fuel-combustion-2011_co2_fuel-2011-en (accessed on 26 July 2021).
  41. Allcott, H.; Greenstone, M. Is There an Energy Efficiency Gap? J. Econ. Perspect. 2012, 26, 3–28. [Google Scholar] [CrossRef]
  42. Lin, J.Y. New structural economics: The third wave of development thinking. Asian Pac. Econ. Lit. 2013, 27, 1–13. [Google Scholar] [CrossRef]
  43. Gerarden, T.; Newell, R.; Stavins, R. Assessing the Energy-Efficiency Gap. J. Econ. Lit. 2017, 55, 1486–1525. [Google Scholar] [CrossRef] [Green Version]
  44. Liu, S.; Yang, Y.; Xie, N.; Forrest, J. New progress of Grey System Theory in the new millennium. Grey Syst. Theory Appl. 2016, 6, 2–31. [Google Scholar] [CrossRef]
  45. Karr-Wisniewski, P.; Lu, Y. When more is too much: Operationalizing technology overload and exploring its impact on knowledge worker productivity. Comput. Human Behav. 2010, 26, 1061–1072. [Google Scholar] [CrossRef]
  46. Javanmardi, E.; Liu, S.; Xie, N. Exploring Grey Systems Theory-Based Methods and Applications in Sustainability Studies: A Systematic Review Approach. Sustainability 2020, 12, 4437. [Google Scholar] [CrossRef]
  47. Luthra, S.; Mangla, S.K.; Shankar, R.; Garg, C.P.; Jakhar, S. Modelling critical success factors for sustainability initiatives in supply chains in Indian context using Grey-DEMATEL. Prod. Plan. Control. 2018, 29, 705–728. [Google Scholar] [CrossRef]
  48. Kokocińska, M.; Nowak, M.; Łopatka, P. Measuring the efficiency of economic growth towards sustainable growth with grey system theory. Sustainability 2020, 12, 121. [Google Scholar] [CrossRef]
  49. Jalali, M.F.M.; Heidari, H. Predicting changes in Bitcoin price using grey system theory. Financ. Innov. 2020, 6, 1–12. [Google Scholar] [CrossRef] [Green Version]
  50. Mills, E.F.E.A.; Baafi, M.A.; Amowine, N.; Zeng, K. A hybrid grey MCDM approach for asset allocation: Evidence from China’s Shanghai Stock Exchange. J. Bus. Econ. Manag. 2020, 21, 446–472. [Google Scholar] [CrossRef] [Green Version]
  51. Nguyen, P.H.; Tsai, J.F.; Kumar, V.A.G.; Hu, Y.C. Stock investment of agriculture companies in the Vietnam stock exchange market: An AHP integrated with GRA-TOPSIS-MOORA approaches. J. Asian Financ. Econ. Bus. 2020, 7, 113–121. [Google Scholar] [CrossRef]
  52. Huang, X.; Sun, J.; Zhao, X. Credit Risk Assessment of Supply Chain Financing with a Grey Correlation Model: An Empirical Study on China’s Home Appliance Industry. Complexity 2021, 2021, 1–12. [Google Scholar] [CrossRef]
  53. Xu, J.; Li, Y. Grey incidence analysis model of classification variables and its application on innovation & entrepreneurship education in Jiangsu. J. Grey Syst. 2018, 30, 123–128. [Google Scholar]
  54. Wang, Z.Y.; Feng, J.W. The Pricing Method based on Grey System Theory for Auto Production in China. J. Tech. Econ. Manag. 2018, 3, 39–43. [Google Scholar]
  55. Nowak, M.; Mierzwiak, R.; Wojciechowski, H.; Delcea, C. Grey portfolio analysis method. Grey Syst. Theory Appl. 2020, 10, 439–454. [Google Scholar] [CrossRef]
  56. Luthra, S.; Kumar, A.; Zavadskas, E.K.; Mangla, S.K.; Garza-Reyes, J.A. Industry 4.0 as an enabler of sustainability diffusion in supply chain: An analysis of influential strength of drivers in an emerging economy. Int. J. Prod. Res. 2019, 58, 1505–1521. [Google Scholar] [CrossRef]
  57. World Bank Open Data|Data. Available online: https://data.worldbank.org/ (accessed on 26 July 2021).
Figure 1. The idea of the area model in graphic form. Source: own work.
Energies 14 05181 g001
Figure 2. Graphical interpretation of the synthetic index of sustainable growth. Source: own work.
Energies 14 05181 g002
Figure 3. Cumulative results for values of synthetic sustainable growth indices for the studied African countries in 2010–2018—a standardization model that breaks down all terms in the series by their initial values (a). Source: own work.
Energies 14 05181 g003
Figure 4. Cumulative results for values of synthetic sustainable growth indices for the studied African countries in 2010–2018—a model to substantiate standardization, which included the division of all terms in the series by arithmetic means for all values in the series (b). Source: own work.
Energies 14 05181 g004
Figure 5. Cumulative results for values of synthetic sustainable growth indices for the studied African countries in 2010–2018—a model to support standardization by dividing all terms in a series by the maximum values in the series ©. Source: own work.
Energies 14 05181 g005
Table 1. The set of time series for two selected African countries, for which the relative degree of grey incidence indices is determined. Source: own study based on data from: [57].
Algeria201020112012201320142015201620172018
Access to electricity 98.87899.05098.76599.53999.84199.93199.990100.000100.000
HDI0.7210.7280.7280.7290.7360.740.7430.7450.746
GDP pc13.09613.50013.30313.05713.00312.01611.62411.55111.750
CO2 emissions pc3.2753.2683.4273.4723.6793.7963.673.7073.891
Angola201020112012201320142015201620172018
Access to electricity33.39434.60035.66736.87232.00042.00040.66841.96343.259
HDI0.5170.5330.5440.5550.5650.5720.5780.5820.582
GDP pc658867117413768281797338710373117097
CO2 emissions pc1.2361.2521.3461.2771.6421.2191.1831.2571.223
Table 2. Time series standardized against their initial values for two selected African countries. Source: own calculated.
Algeria201820172016201520142013201220112010
Access to electricity 1.0111.0111.0111.0111.0101.0070.9991.0021.000
HDI1.0351.0331.0311.0261.0211.0111.0101.0101.000
GDP pc0.8970.8820.8880.9180.9930.9971.0161.0311.000
CO2 emissions pc1.1881.1321.1211.1591.1231.0601.0460.9981.000
Angola201820172016201520142013201220112010
Access to electricity1.2951.2571.2181.2580.9581.1041.0681.0361.000
HDI1.1261.1261.1181.1061.0931.0741.0521.0311.000
GDP pc1.0771.1101.0781.1141.2421.1661.1251.0191.000
CO2 emissions pc0.9891.0170.9570.9861.3281.0331.0891.0131.000
Table 3. Time series standardized against their arithmetic means for two selected African countries.
Algeria201820172016201520142013201220112010
Access to electricity 1.0041.0041.0041.0041.0031.0000.9920.9950.993
HDI1.0151.0131.0111.0071.0010.9920.9900.9900.981
GDP pc0.9370.9210.9270.9581.0371.0411.0601.0761.044
CO2 emissions pc1.0881.0371.0261.0611.0290.9710.9580.9140.916
Angola201820172016201520142013201220112010
Access to electricity1.1441.1091.0751.1100.8460.9750.9430.9150.883
HDI1.0421.0421.0351.0241.0110.9930.9740.9540.925
GDP pc0.9761.0060.9771.0091.1251.0571.0200.9230.906
CO2 emissions pc0.9460.9720.9150.9431.2700.9881.0410.9680.956
Table 4. Time series standardized against their maximum values for two selected African countries. Source: own calculations.
Algeria201820172016201520142013201220112010
Access to electricity 1.0001.0001.0000.9990.9980.9950.9880.9900.989
HDI1.0000.9990.9960.9920.9870.9770.9760.9760.966
GDP pc0.8700.8560.8610.8900.9630.9670.9851.0000.970
CO2 emissions pc1.0000.9530.9430.9760.9460.8920.8810.8400.842
Angola201820172016201520142013201220112010
Access to electricity1.0000.9700.9400.9710.7400.8520.8240.8000.772
HDI1.0001.0000.9930.9830.9710.9540.9350.9160.888
GDP pc0.8680.8940.8680.8971.0000.9390.9060.8200.805
CO2 emissions pc0.7450.7660.7200.7421.0000.7780.8200.7620.753
Table 5. The results of the second stage of standardization for model (a) for two selected African countries. Source: own calculations.
Algeria201820172016201520142013201220112010
Access to electricity 0.0110.0110.0110.0110.0100.007−0.0010.0020.000
HDI0.0350.0330.0310.0260.0210.0110.0100.0100.000
GDP pc−0.103−0.118−0.112−0.082−0.007−0.0030.0160.0310.000
CO2 emissions pc0.1880.1320.1210.1590.1230.0600.046−0.0020.000
Angola201820172016201520142013201220112010
Access to electricity0.2950.2570.2180.258−0.0420.1040.0680.0360.000
HDI0.1260.1260.1180.1060.0930.0740.0520.0310.000
GDP pc0.0770.1100.0780.1140.2420.1660.1250.0190.000
CO2 emissions pc−0.0110.017−0.043−0.0140.3280.0330.0890.0130.000
Table 6. The results of the second stage of standardization for model (b) for two selected African countries. Source: own calculations.
Algeria201820172016201520142013201220112010
Access to electricity 0.0110.0110.0110.0110.0100.007−0.0010.0020.000
HDI0.0340.0330.0300.0260.0200.0110.0100.0100.000
GDP pc−0.107−0.123−0.117−0.086−0.007−0.0030.0170.0320.000
CO2 emissions pc0.1720.1210.1100.1460.1130.0550.043−0.0020.000
Angola201820172016201520142013201220112010
Access to electricity0.2610.2270.1920.228−0.0370.0920.0600.0320.000
HDI0.1160.1160.1090.0980.0860.0680.0480.0290.000
GDP pc0.0700.0990.0710.1030.2190.1510.1130.0170.000
CO2 emissions pc−0.0100.016−0.041−0.0130.3140.0320.0850.0120.000
Table 7. The results of the second stage of standardization for model (c) for two selected African countries.
Algeria201820172016201520142013201220112010
Access to electricity 0.0110.0110.0110.0110.0100.007−0.0010.0020.000
HDI0.0340.0320.0290.0250.0200.0110.0090.0090.000
GDP pc−0.100−0.114−0.109−0.080−0.007−0.0030.0150.0300.000
CO2 emissions pc0.1580.1110.1020.1340.1040.0510.039−0.0020.000
Angola201820172016201520142013201220112010
Access to electricity0.2280.1980.1680.199−0.0320.0800.0530.0280.000
HDI0.1120.1120.1050.0950.0820.0650.0460.0270.000
GDP pc0.0620.0880.0630.0920.1950.1340.1010.0150.000
CO2 emissions pc−0.0080.013−0.032−0.0100.2470.0250.0670.0100.000
Table 8. Model components for the determination of the relative degree of grey incidence r ref i for two selected African countries. Source: own calculations.
Access to Electricity—HDI
Model parametersAlgeriaAngola
(a)(b)(c)(a)(b)(c)
| s ref | 0.0560.0560.0551.0470.9240.808
| s i | 0.1590.1560.1530.6620.6130.588
| s ref s i | 0.1030.1000.0980.3840.3110.219
Access to Electricity—GDP pc
Model parametersAlgeriaAngola
(a)(b)(c)(a)(b)(c)
| s ref | 0.0560.0560.0551.0470.9240.808
| s i | 0.3280.3420.3180.8920.8080.718
| s ref s i | 0.3830.3980.3730.1550.1160.089
Access to Electricity—CO2 Emissions pc
Model parametersAlgeriaAngola
(a)(b)(c)(a)(b)(c)
| s ref | 0.0560.0560.0551.0470.9240.808
| s i | 0.7330.6720.6170.4190.4000.315
| s ref s i | 0.6770.6160.5620.6280.5240.493
Table 9. Values of the relative degree of grey incidence r ref i indices for two selected African countries. Source: own calculations.
r ref i AlgeriaAngola
(a)(b)(c)(a)(b)(c)
Access to electricity—HDI0.9220.9240.9250.8760.8910.916
Access to electricity—GDP pc0.7830.7790.7860.9500.9590.966
Access to electricity—CO2 emissions pc0.7250.7370.7490.7970.8160.812
Table 10. Cumulative results for values of synthetic sustainable growth indices for the studied African countries in 2010–2018. Source: own calculations.
Country(a)Rank (a)(b)Rank (b)(c)Rank (c)
Algeria37.10%1437.93%1739.79%20
Angola55.26%459.78%462.49%4
Benin52.22%656.07%659.43%6
Botswana46.09%1051.24%956.46%9
Burkina Faso47.31%853.81%757.86%8
Cameroon32.40%1834.56%1938.16%22
Central African Republic0.57%482.24%494.51%49
Chad2.70%443.83%466.04%46
Comoros37.57%1340.71%1345.03%14
Congo, Dem. Rep.17.60%3122.27%3027.47%32
Congo, Rep.13.76%3417.41%3319.91%37
Cote d’Ivoire25.00%2431.55%2437.36%23
Djibouti15.28%3215.76%3518.46%38
Egypt, Arab Rep.37.57%1239.56%1541.04%17
Equatorial Guinea23.59%2621.39%3126.80%33
Eritrea31.15%2036.95%1840.31%18
Eswatini6.64%409.21%4312.53%44
Ethiopia9.85%3714.87%3616.90%39
Gabon33.44%1632.59%2234.06%27
Gambia, The11.12%3612.35%3914.45%41
Ghana20.73%2728.20%2631.44%28
Guinea30.60%2133.43%2139.99%19
Guinea-Bissau0.39%492.92%485.62%48
Kenya2.00%468.15%4414.37%42
Lesotho4.77%4110.57%4121.01%36
Liberia2.16%459.97%4224.50%34
Libya30.20%2222.51%2930.20%29
Madagascar18.66%3023.44%2828.86%31
Malawi14.35%3319.13%3236.45%26
Mali24.89%2531.66%2342.12%16
Mauritania46.53%951.72%858.88%7
Mauritius13.55%3514.81%3716.64%40
Morocco59.95%362.05%364.23%3
Mozambique20.20%2831.01%2539.76%21
Namibia55.05%559.02%560.89%5
Niger33.04%1740.00%1443.52%15
Nigeria31.27%1934.45%2036.94%24
Rwanda4.30%4213.46%3824.28%35
Senegal85.42%186.74%186.69%1
Seychelles47.73%750.79%1052.00%11
Sierra Leone27.42%2339.28%1655.12%10
South Africa45.26%1145.52%1146.00%13
South Sudan0.01%500.61%501.77%50
Sudan34.68%1541.42%1247.04%12
Tanzania8.66%3816.23%3428.87%30
Togo7.02%3910.66%4012.65%43
Tunisia67.59%267.85%268.85%2
Uganda1.22%473.53%4710.03%45
Zambia19.63%2927.36%2736.48%25
Zimbabwe3.66%434.81%455.96%47
Where: (a) a standardization model that breaks down all terms in the series by their initial values; (b) a model to substantiate standardization, which included the division of all terms in the series by arithmetic means for all values in the series; (c) a model to support standardization by dividing all terms in a series by the maximum values in the series.
Table 11. Cumulative results for the index of access to electricity—HDI. Source: own calculations.
Country(a)Rank (a)(b)Rank (b)(c)Rank (c)
Algeria0.9219130.9236130.924914
Angola0.8758170.8908150.916115
Benin0.935490.941990.96189
Botswana0.9337100.9409100.96308
Burkina Faso0.7400300.7676260.796525
Cameroon0.952780.957680.96926
Central African Republic0.5381460.5774480.609948
Chad0.6495350.6875350.734335
Comoros0.968250.971250.98822
Congo, Dem. Rep.0.6915340.7203340.748834
Congo, Rep.0.6977320.7313330.770929
Cote d’Ivoire0.998220.998520.99871
Djibouti0.8041200.8145200.820022
Egypt, Arab Rep.0.8819150.8847170.887117
Equatorial Guinea0.9272110.9282110.928612
Eritrea0.7508220.7676250.784327
Eswatini0.6920330.7351320.765030
Ethiopia0.8792160.8857160.862619
Gabon0.7470260.7489300.752533
Gambia, The0.7277310.7441310.761731
Ghana0.7444270.7646270.781628
Guinea0.8046190.8306190.893816
Guinea-Bissau0.5260490.5737490.608149
Kenya0.5370470.5838460.624647
Lesotho0.5918420.6427420.706938
Liberia0.5318480.5781470.635246
Libya0.986630.983740.98664
Madagascar0.7427280.7582280.800724
Malawi0.7410290.7742230.878718
Mali0.6251400.6532390.696140
Mauritania0.7491240.7705240.792826
Mauritius0.7486250.7509290.753832
Morocco0.985140.986330.98803
Mozambique0.6429370.6791360.710836
Namibia0.9077140.9169140.935311
Niger0.7757210.8044210.823121
Nigeria0.8249180.8423180.855220
Rwanda0.5456450.5933450.638945
Senegal0.998710.999810.98495
Seychelles0.963160.964260.96367
Sierra Leone0.6048410.6521400.700239
South Africa0.957470.959170.954510
South Sudan0.5050500.5469500.582350
Sudan0.7492230.7742220.814523
Tanzania0.5887430.6305430.680542
Togo0.6257390.6631380.684741
Tunisia0.9255120.9266120.927813
Uganda0.5617440.6046440.677643
Zambia0.6323380.6714370.707937
Zimbabwe0.6434360.6509410.659244
Where: (a) standardization model that included the division of all terms in the series by their initial values, (b) standardization model that included the division of all terms in the series by arithmetic means for all values in the series, (c) standardization model that included the division of all terms in the series by maximum values in the series.
Table 12. Cumulative results for the index of r ref i access to electricity—GDP pc. Source: own calculations.
Country(a)Rank (a)(b)Rank (b)(c)Rank (c)
Algeria0.7830190.7785220.786426
Angola0.950020.959420.96582
Benin0.7935170.8160170.830518
Botswana0.8155140.8365140.847714
Burkina Faso0.890860.904550.90289
Cameroon0.7968160.8200160.840516
Central African Republic0.5237490.5455490.564249
Chad0.5648450.5792450.597046
Comoros0.7140250.7388270.755231
Congo, Dem. Rep.0.875080.904460.93374
Congo, Rep.0.5673440.5729470.587148
Cote d’Ivoire0.6251390.6664380.710836
Djibouti0.6923270.7122310.732935
Egypt, Arab Rep.0.6641320.6795360.687839
Equatorial Guinea0.6760290.6622390.690838
Eritrea0.7675200.8005190.827719
Eswatini0.6832280.7259280.759730
Ethiopia0.5944430.6312410.657341
Gabon0.8071150.8061180.810022
Gambia, The0.6019420.6011430.611445
Ghana0.6701310.7257290.743032
Guinea0.995510.995310.98341
Guinea-Bissau0.5528470.6363400.673040
Kenya0.6390350.7479260.793725
Lesotho0.7025260.7784230.872913
Liberia0.6021410.7099320.822820
Libya0.6361360.5850440.636143
Madagascar0.7496220.7652240.806224
Malawi0.6717300.6998340.777129
Mali0.7465230.7841210.833617
Mauritania0.8651100.8815100.886411
Mauritius0.6103400.6248420.640942
Morocco0.869290.8805110.894610
Mozambique0.8401110.8766120.90748
Namibia0.8276130.8471130.846315
Niger0.7339240.7627250.779628
Nigeria0.905230.917230.92455
Rwanda0.6257380.7195300.781727
Senegal0.893350.903470.91696
Seychelles0.6453340.6695370.693337
Sierra Leone0.8303120.886580.96053
South Africa0.875170.881890.881612
South Sudan0.5032500.5175500.531250
Sudan0.7866180.8222150.819821
Tanzania0.6328370.6871350.742933
Togo0.7540210.7999200.808623
Tunisia0.903240.905040.91037
Uganda0.5415480.5715480.622344
Zambia0.6573330.7004330.741734
Zimbabwe0.5609460.5792460.594047
Where: (a) standardization model that included the division of all terms in the series by their initial values, (b) standardization model that included the division of all terms in the series by arithmetic means for all values in the series, (c) standardization model that included the division of all terms in the series by maximum values in the series.
Table 13. Cumulative results for the index of r ref i access to electricity—CO2 emissions pc. Source: own calculations.
Country(a)Rank (a)(b)Rank (b)(c)Rank (c)
Algeria0.7254240.7371250.748528
Angola0.7970180.8161170.811623
Benin0.8620110.8706140.869914
Botswana0.7788190.8036200.823820
Burkina Faso0.913860.939450.94977
Cameroon0.6449340.6450360.656138
Central African Republic0.5544460.6081400.653539
Chad0.5492470.5520490.568249
Comoros0.7662210.7716230.786825
Congo, Dem. Rep.0.6062370.6249370.643840
Congo, Rep.0.8392140.8738120.851215
Cote d’Ivoire0.7007280.7311260.746729
Djibouti0.6132360.5977440.615745
Egypt, Arab Rep.0.901280.903590.90898
Equatorial Guinea0.6686300.6542340.692534
Eritrea0.8212150.8462150.841717
Eswatini0.5389480.5346500.547950
Ethiopia0.5803410.6179390.634042
Gabon0.8157170.8032210.814922
Gambia, The0.6827290.6968320.712331
Ghana0.7748200.8095180.818921
Guinea0.5982380.6054420.624943
Guinea-Bissau0.5197490.5565480.583447
Kenya0.5560440.6215380.670236
Lesotho0.5585430.5939450.638741
Liberia0.5968390.7025300.806024
Libya0.7574220.7246270.757426
Madagascar0.6613310.7051290.705033
Malawi0.6605320.6871330.756827
Mali0.919350.943540.97285
Mauritania0.920140.936670.98374
Mauritius0.7066260.7123280.725430
Morocco0.8167160.8234160.827519
Mozambique0.7129250.7971220.843516
Namibia0.8798100.8899100.891513
Niger0.8598120.8879110.891712
Nigeria0.6409350.6522350.661937
Rwanda0.6547330.7572240.839818
Senegal0.998410.997010.99682
Seychelles0.977820.977020.95736
Sierra Leone0.893090.937860.98613
South Africa0.7017270.6975310.705332
South Sudan0.5063500.5588470.594446
Sudan0.8521130.8727130.897711
Tanzania0.7402230.8065190.90799
Togo0.5545450.5671460.576748
Tunisia0.904770.904280.906610
Uganda0.5637420.6077410.678535
Zambia0.936430.959630.99681
Zimbabwe0.5915400.6049430.617444
Where: (a) standardization model that included the division of all terms in the series by their initial values, (b) standardization model that included the division of all terms in the series by arithmetic means for all values in the series, (c) standardization model that included the division of all terms in the series by maximum values in the series.
Publisher’s Note: MDPI stays neutral with regard to jurisdictional claims in published maps and institutional affiliations.

