Article

Reconfigurable Power Quality Analyzer Applied to Hardware-in-Loop Test Bench

1
Department of Electrical Engineering, Sukkur IBA University, Sukkur 65200, Pakistan
2
School of Electrical and Electronics Engineering, Chung-Ang University, Seoul 06910, Korea
3
Department of Intelligent Energy and Industry, Chung-Ang University, Seoul 06910, Korea
*
Author to whom correspondence should be addressed.
Energies 2021, 14(16), 5134; https://doi.org/10.3390/en14165134
Submission received: 6 July 2021 / Revised: 13 August 2021 / Accepted: 16 August 2021 / Published: 19 August 2021

Abstract

:
Integration of renewable energy resources and conventional grids leads to an increase in power quality issues. These power quality issues require different standards to be followed for accurate measurement and monitoring of various parameters of the power system. Conventional power quality analyzers (PQAs) are programmed to a particular standard and cannot be reconfigured by the end user. Therefore, conventional PQAs cannot meet the challenges of a rapidly changing grid. In this regard, a Compact RIO-based (CRIO-based) PQA was proposed, that can be easily reprogrammed and cope with the challenges faced by conventional PQAs. The salient features of the proposed PQA are a high processing speed, interactive interface, and high-quality data-storage capacity. Moreover, unlike conventional PQAs, the proposed PQA can be monitored remotely via the internet. In this research, a hardware-in-loop (HIL) simulation is used for performing the power-quality assessment in a systematic manner. Power quality indices such as apparent power, power factor, harmonics, frequency disturbance, inrush current, voltage sag and voltage swell are considered for validating the performance of the proposed PQA against the Fluke’s PQA 43-B.

1. Introduction

The increase in the power demand during the last two decades has been significant. The major use of renewable energy sources for reducing CO2 emissions and global warming requires the use of electronic devices, i.e., power converters, capacitor switches, and transformer energizing. This resulted in an obstructive effect in power systems [1]. The increase in the number of distributed energy sources and the system complexity resulted in unpredictable behavior in power systems that require efficient and effective power quality (PQ) measurements and monitoring. International standards provide an explanation of the method of accumulating and representing approximate data and identifying different indices for distinguishing PQ disturbances. The International Electrotechnical Commission (IEC) 61000-4-30 standard defines the methods for measuring and interpreting the results of PQ parameters in a 50/60-Hz system, which include active power (P), reactive power (Q), frequency, voltage sags and swells, voltage disturbance, supply voltage unbalance, and voltage and current harmonics and subharmonics [2].
An offline simulation of the power converters and power system applications in a software environment such as MATLAB/Simulink, PLECS, PSim, Dig SILENT, and Multisim was widely used to verify the design considerations and behaviors of circuits [3]. Although an offline simulation is a low-cost method and requires little setup, it is unacceptable in power electronics and power system applications as they suffer from high jitter, and their results are not reliable [4]. Offline simulations do not represent real circuit behavior and provide unrealistic and incorrect results [5].
Compared with an offline simulation, real-time simulation results are more deterministic and much closer to the experimental results. A real-time simulation or the so-called hardware-in-loop simulation executes the simulation with very specific timing requirements [6]. A real-time simulation is highly deterministic and is designed to study the behavior of power converter and power system applications with precise timing and reliability [7]. The use of a real-time simulation is essential for testing power converter applications as they may operate at a high switching frequency [8]. It should be noted that the simulation time step should be a hundred times less than the switching period in order to guarantee simulation accuracy and reflect actual converter behavior [9]. The switching frequency of the power converter may reach up to 200 KHz or higher, which results in a simulation time step at the nanosecond level. The microcontroller and microprocessor are not suitable in these situations, where an extremely low latency is desired [10]. A field programmable gate array (FPGA) is the best fit in power converter and power system applications as it offers true parallelism and has a processing speed a hundred times faster than that of a microprocessor and microcontroller [11]. An FPGA offers the flexibility of a software as no physical change is required in the device and the speed of the hardware, thus offering a time step at the nanosecond level [12].
The use of hardware-in-loop (HIL) has become popular owing to the emphasis on de-risking power systems, power electronics devices, and the associated electrical equipment and apparatus used in the system [13]. HIL is remarkably applicable as it yields a more practical environment than simulation. A key application of HIL is the designing and verification of algorithms for power converter controllers [14]. HIL may be used for the testing and verification of design models in fields such as traction control, anti-lock braking system [15], vehicle applications for testing and verification of electronic control units [16], examining a controller for electrical locomotive systems [17], performance and evaluation testing of an electrical motor drive system [18,19], validating control systems for magnetic levitation applications and a wide variety of applications [20,21,22].
Moreover, various other applications exist, as discussed in [23], for the HIL test bench. It is ideal to test the system early and verify a design using the HIL setup before the final deployment in order to reduce the costs and time spent. HIL architecture can facilitate the understanding of system behavior and the mitigation of any issues that can possibly occur during model verification.
A measuring instrument can be realized after a suitable synchronization phase is realized and fast Fourier transform (FFT) processing is started in consecutive periods of microseconds [24]. A complete PQ analysis requires the measurement of each phase of voltage and current in a three-phase four-wire system wherein voltages and currents must be perceived, measured, and analyzed with perfect spectral resolution and accuracy. This means that the measuring instrument must be able to (I) evaluate the incoming frequency of the signals, (II) transform them into digital form; (III) calculate the FFTs in parallel in a very short duration of time (microseconds); (IV) detect and classify previously mentioned PQ events; and (V) store and manage the data. The instruments that are proposed in the literature are actually based on conventional spectral analysis techniques that are executed in digital signal processing (DSP) hardware. Their computational speed, when such a continuous and fast processing and analysis is required, limits their usage. A FPGA-based HIL system offers true parallelism and is a hundred times faster than a microprocessor and microcontroller.
PQA designing has been the subject of many researchers for different purposes in different environments [25]. Although there exits commercial PQAs, they are quite expensive and are not reprogrammable for different IEEE standards. Few authors, such as in [26] introduced an energy logger circuit powered by a battery to monitor the energy harvested by different piezoelectric-based converters. The author of [27] presented a measuring system that measures the reactive power component and has a very low cost. Moreover, the article [28] shows a low-cost power quality analyzer based on frequency analysis which measures the AC waveform to detect power quality issues. In [29] a power quality analyzer was designed with an event logging capability, synchronized phasor measurement and an inter-area oscillation identifier. All aforementioned conventional PQAs are fixed in terms of measurement features and standards. Therefore, conventional PQAs cannot be reprogrammed and hence cannot meet the current demands of the rapidly changing grid.
In this paper, HIL simulation is used for PQ assessment in a systematic manner. It should be noted that the proposed CRIO-based PQ analyzer can be used independently and as well as in an HIL environment. As a base model, a three-phase, three-level neutral point clamped (NPC) converter is used for the real-time simulation using the HIL environment. The load voltage generated from the NPC is supplied for operating different loads using a power amplifier. Finally, the load voltage and load current are given as an input to the CRIO modules for obtaining the results of various PQ indices such as power, power factor, harmonics, frequency disturbance, inrush current, and voltage sag and swell. Compared with the aforementioned conventional PQAs, the proposed PQA offers the following benefits:
  • Can be installed at any location to measure the quality impacts, and the results can be monitored via the internet;
  • Provides robust measurement and algorithms implemented on hardware with reconfigurable firmware to meet the challenges of a rapidly changing grid;
  • Provides a flexible, interactive interface and high-quality data storage capacity from the grid;
  • Data are monitored on the low-power side to ensure safety for system users;
  • Complies with the international power-quality standards of the Institute of Electrical and Electronics Engineers and the International Electrotechnical Committee.
In summary, the HIL test bench is used to implement a three-phase NPC inverter. The output of the inverter is amplified to 220 V using a power amplifier and then connected to the load for various considered scenarios. The PQ analysis is performed using NI CRIO and a Fluke-based PQA. The study is organized as follows: Section 2 presents an explanation of the various PQ indices that determine the state of the power system. Section 3 presents a brief description of the RT HIL platform available at our university. Section 4 presents the RT HIL implementation scheme used in this research, a brief explanation of the CRIO hardware with its capabilities, and a discussion of the model implemented in the PHIL architecture. Section 5 presents an analysis and the experimental results obtained for the various considered scenarios. Finally, the conclusions of this research are presented in Section 6.

2. Power Quality Indices

The PQ indices (PQIs), which are continuously checked and monitored during the operation of the power system, are referred to for determining the state of the power system. In this paper, the PQIs listed by the IEEE standard 1459 [30] are adopted, and mathematical modelling is described for them.

2.1. Harmonics Distortion

The harmonics comprise multiples of the fundamental reference signal and can be determined using the Fourier transform and a superposition of the voltage and current waveforms. The fundamental harmonics can only be found for an ideal electrical system, i.e., of 50 Hz or 60 Hz. Harmonics are present owing to the use of non-linear loads, which generate them. Non-linear loads include electronic power converters, arc furnaces, high pressure discharge lamps, arc welders, power inverters, television power supplies, light emitting diodes, mobile and laptop chargers, and similar electronic devices and equipment [31].
The current and voltage can be expressed in a Fourier series as follows:
i ( t ) = a n sin w t + b n cos w t
a n = 1 π 0 2 π i ( t ) sin ( n w t ) d ( w t )
b n = 1 π 0 2 π i ( t ) cos ( n w t ) d ( w t )
where the root mean square (rms) of the current can be found by:
I rms = a n 2 + b n 2
The rms of the subharmonic current can be calculated as:
I sub-rms = ( I 2 2 + I 3 2 + I 4 2 + I 5 2 + + I n 2 )
The THD of current can then be found by:
% THD I = ( I 2 2 + I 3 2 + I 4 2 + I 5 2 + + I n 2 ) I 1 rms × 100
Similarly, voltage (V(t)) can also be expressed in Fourier series as follows:
V ( t ) = a n sin w t + b n cos w t
a n = 1 π 0 2 π V ( t ) sin ( n w t ) d ( w t )
b n = 1 π 0 2 π V ( t ) cos ( n w t ) d ( w t )
Similarly, rms of voltage can be expressed as:
V rms = a n 2 + b n 2
The rms of the subharmonic voltage can be calculated as:
V sub-rms = ( V 2 2 + V 3 2 + V 4 2 + V 5 2 + + V n 2 )
The THD of the Voltage can be find by:
% THD V = ( V 2 2 + V 3 2 + V 4 2 + V 5 2 + + V n 2 ) V 1 rms × 100

2.2. Power and Power Factor
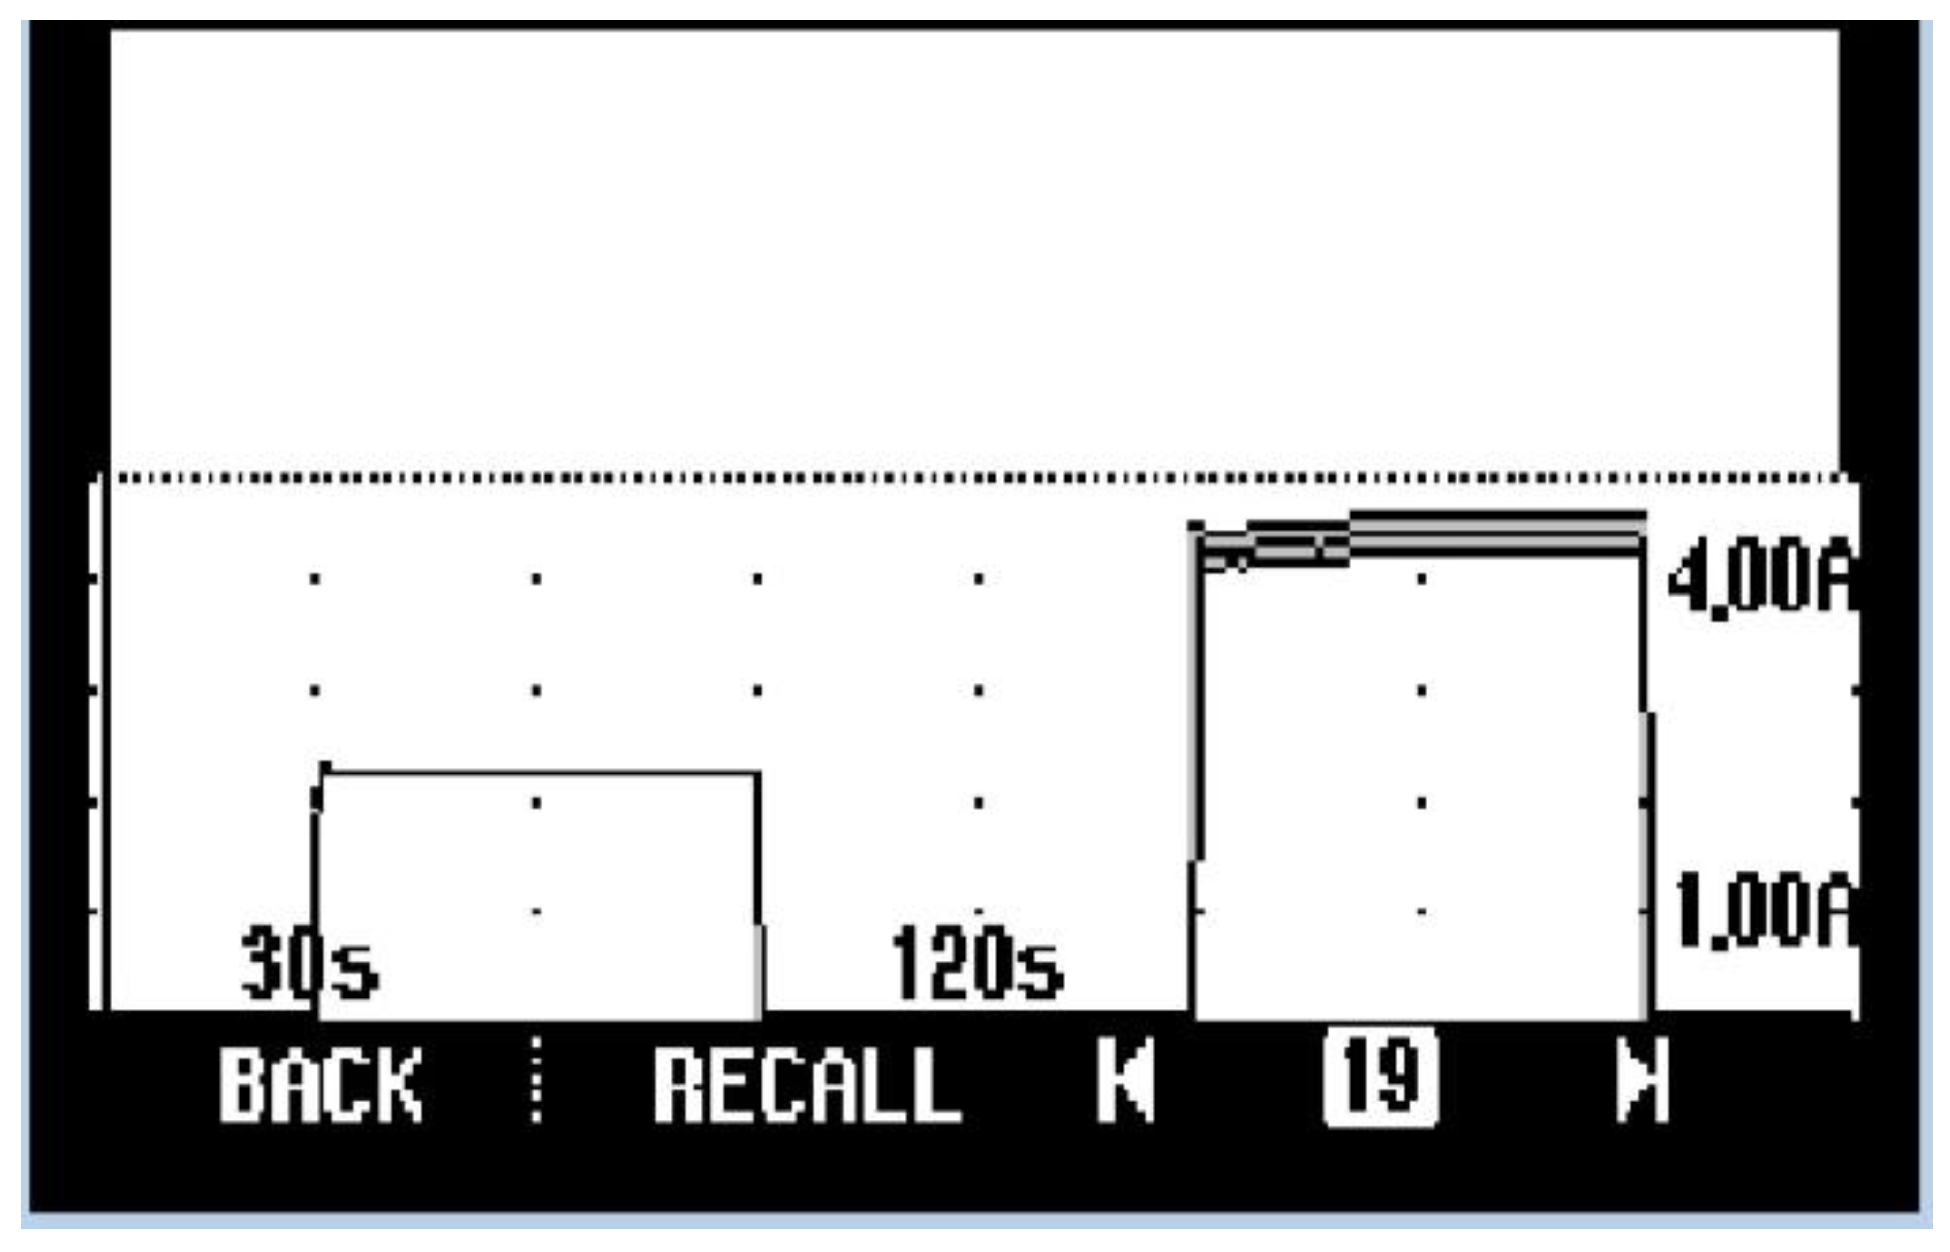
The measurement of power includes active power (P), reactive power (Q) and apparent power (S).
P = V 1 I 1 cos ϕ 1
Q = V 1 I 1 sin ϕ 1
S = VI
V and I are the rms values of voltage and current. Similarly, the power factor can be calculated as follows:
PF = P S

2.3. Inrush Current

The starting current of an induction motor is quite large due to the fact that slip (S) is unity and rotor resistance (R) is very low. The inrush current can be calculated as:
I start = S start 3 * V t
β = I start I nominal
where Sstart = HPrated × code letter factor, Vt is the terminal voltage of an IM and β is the ratio between Istart and Inominal.

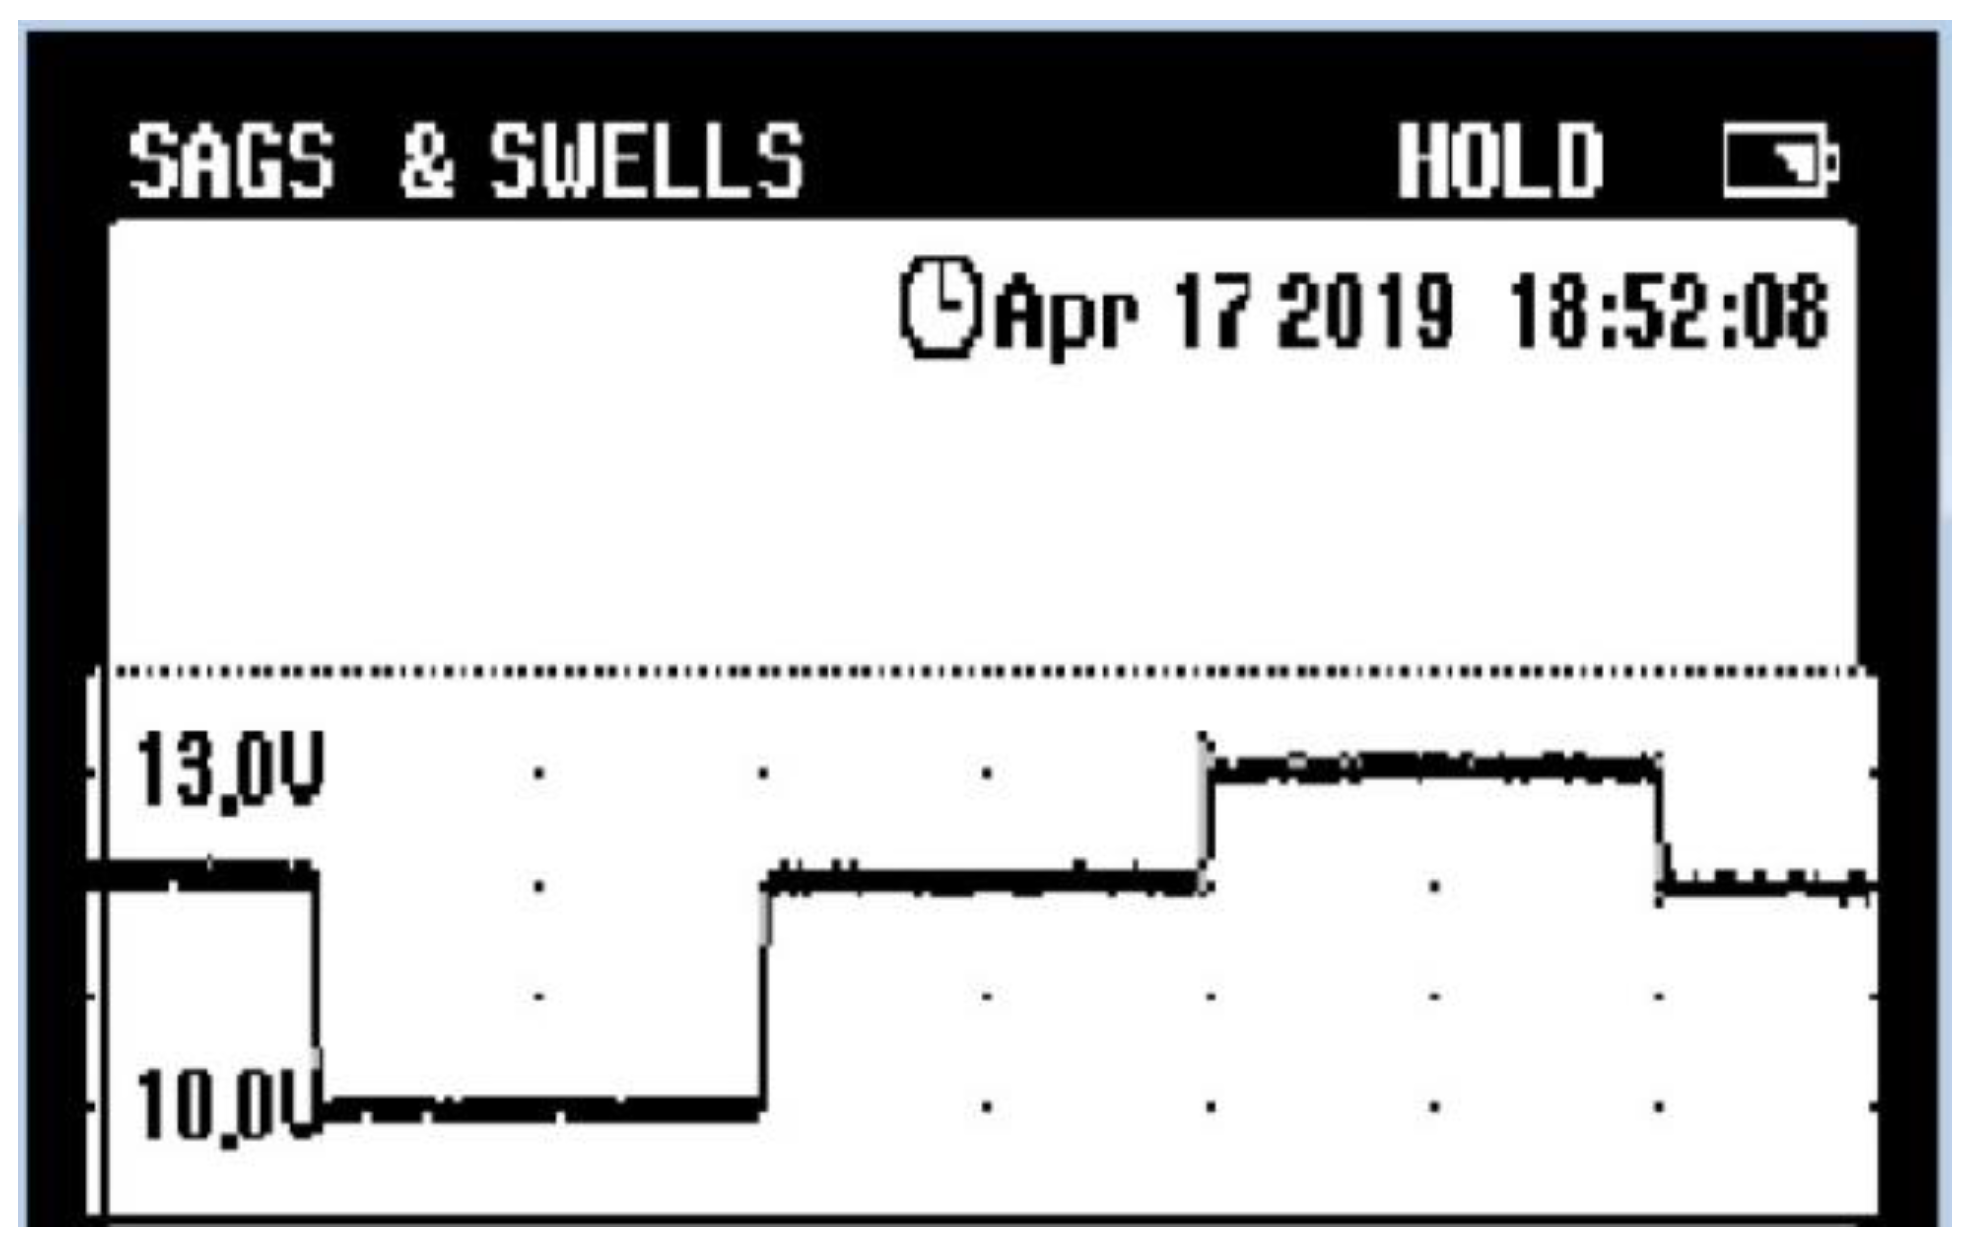
2.4. Voltage Sag and Swell

Whenever load is increased suddenly in a power system a voltage sag is observed at the receiving end, due to the voltage drop in the generator, the transformer and line resistance for short term and long term are as follows:
y ( t ) = A ( 1 α ( μ ( t t 1 ) μ ( t t 2 ) ) ) sin ( w t )
where
0.1 α 0.9   and   T t 2 t 1 9 T
Voltage swell is observed in the power system due to a sudden drop of a huge load or due to excesses of the capacitive load at the receiving end.
y ( t ) = A ( 1 + α ( μ ( t t 1 ) μ ( t t 2 ) ) ) sin ( w t )
where
0.1 α 0.9   and   T t 2 t 1 9 T

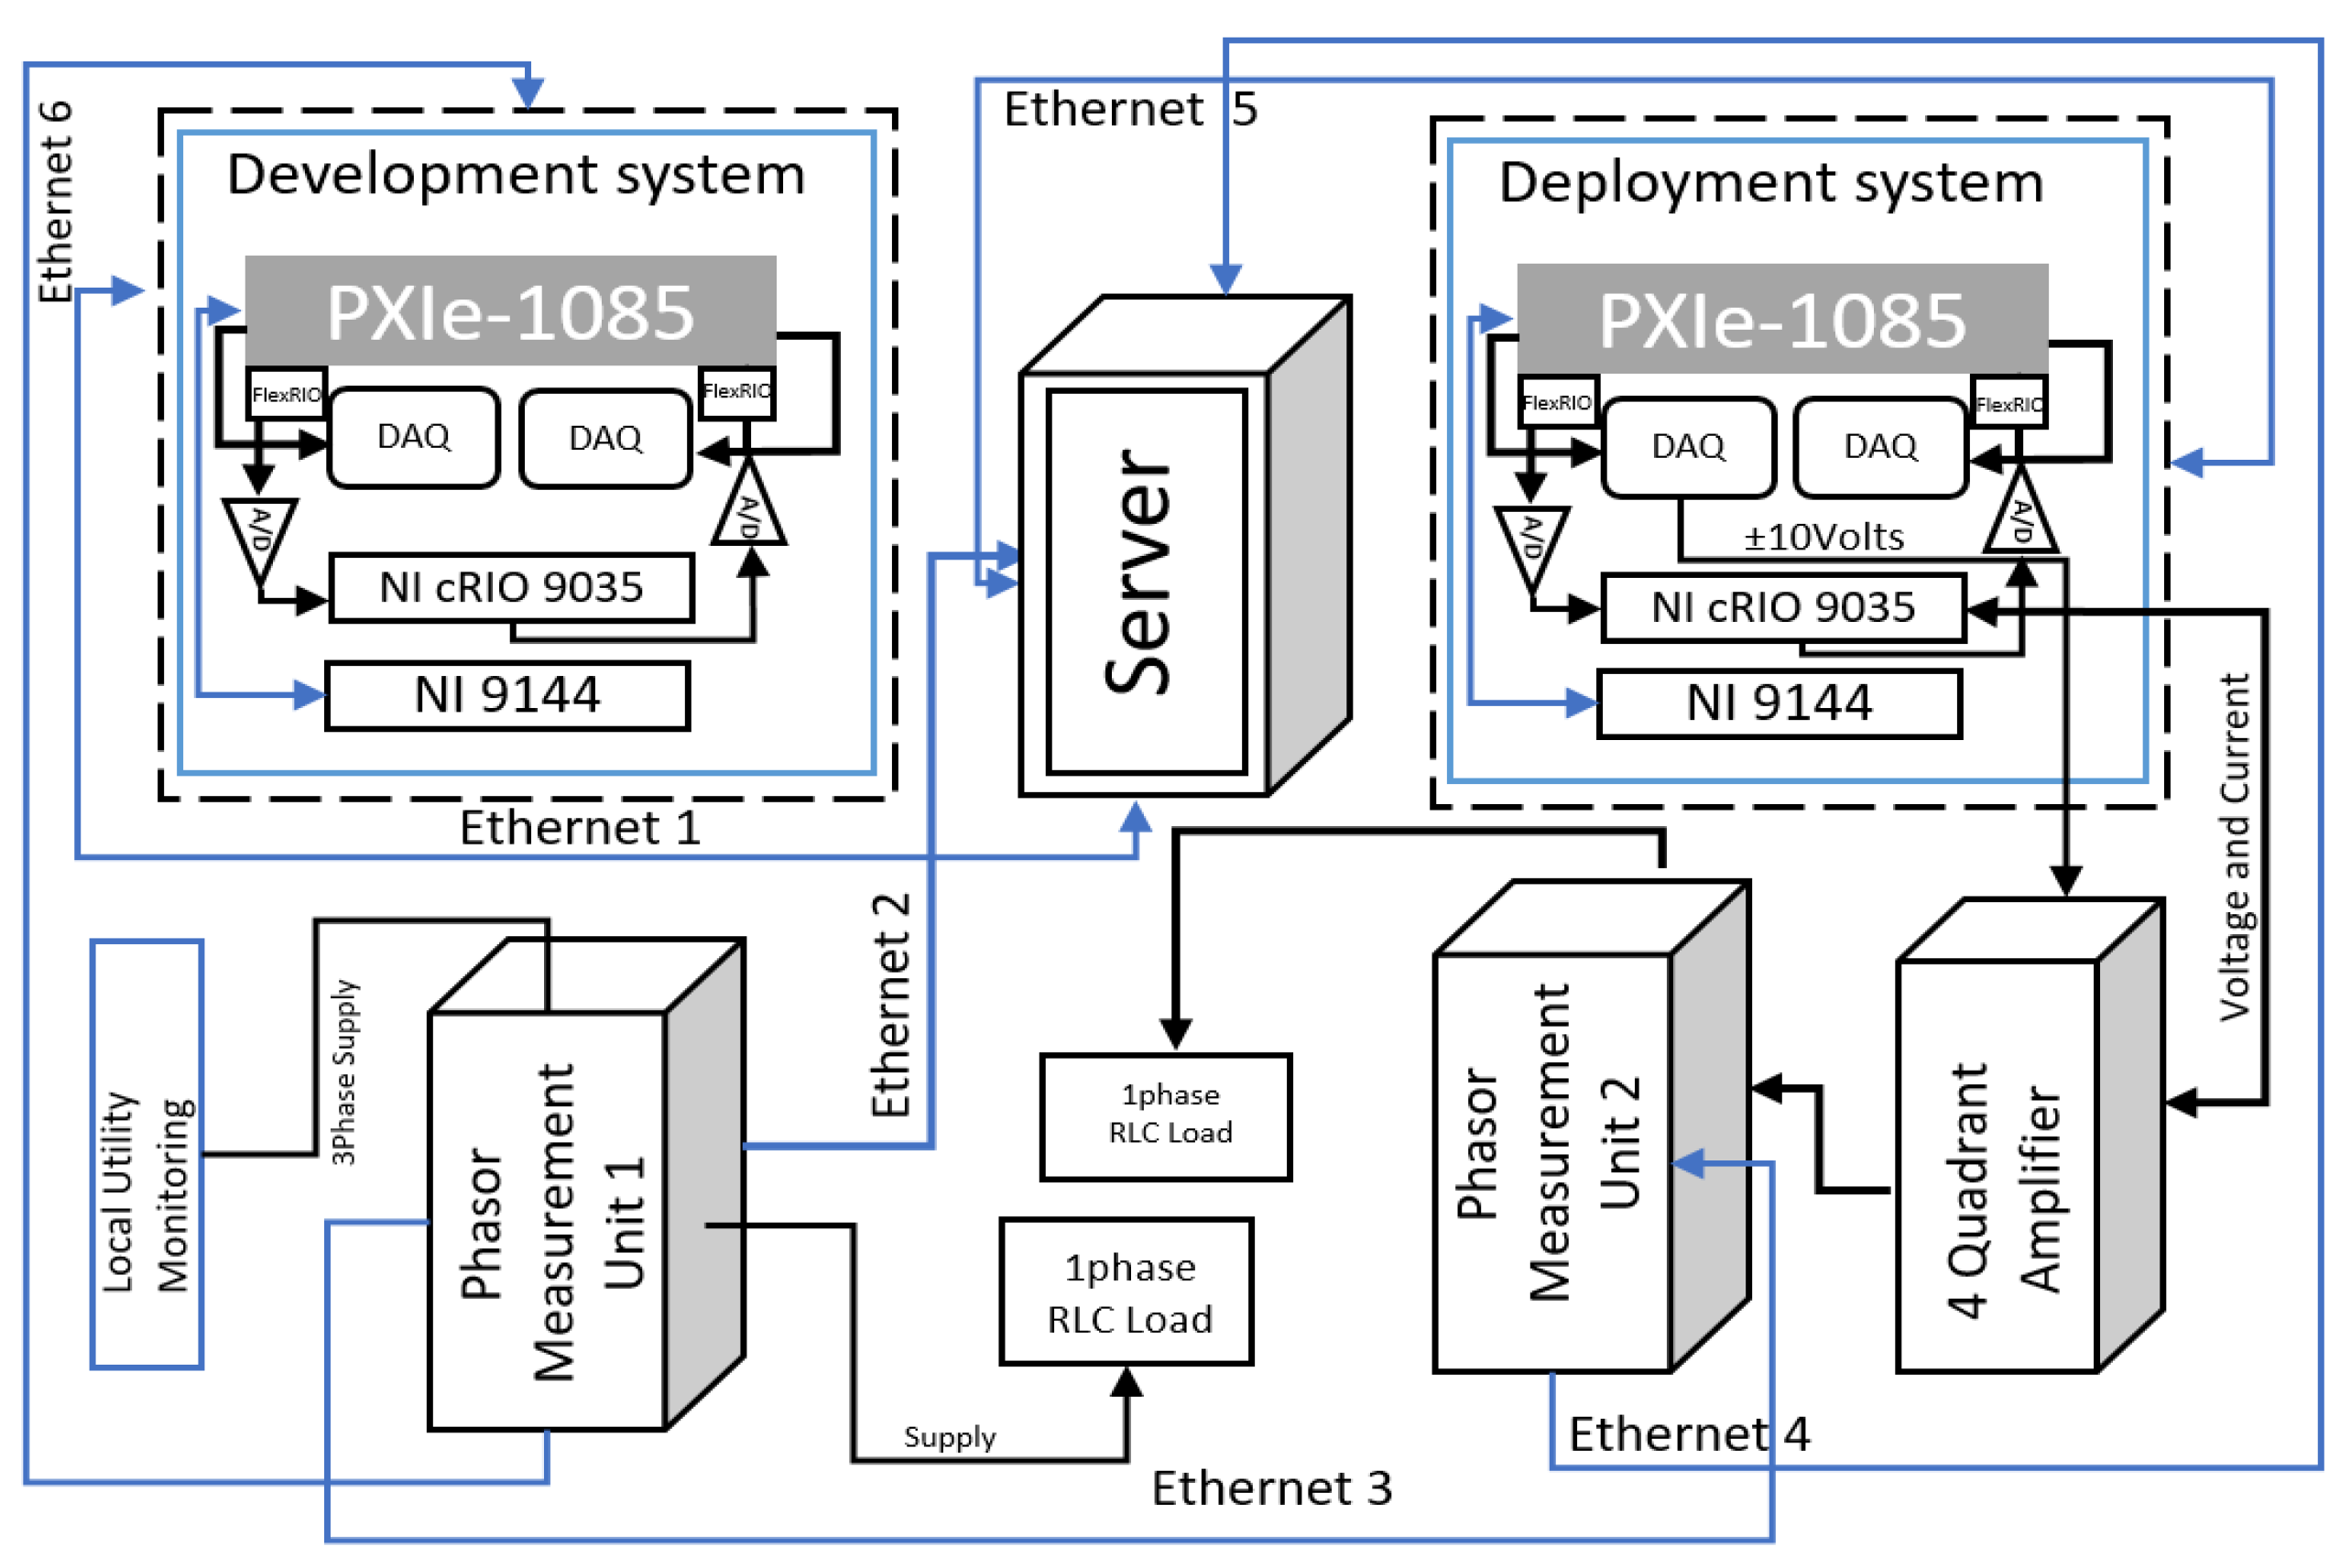
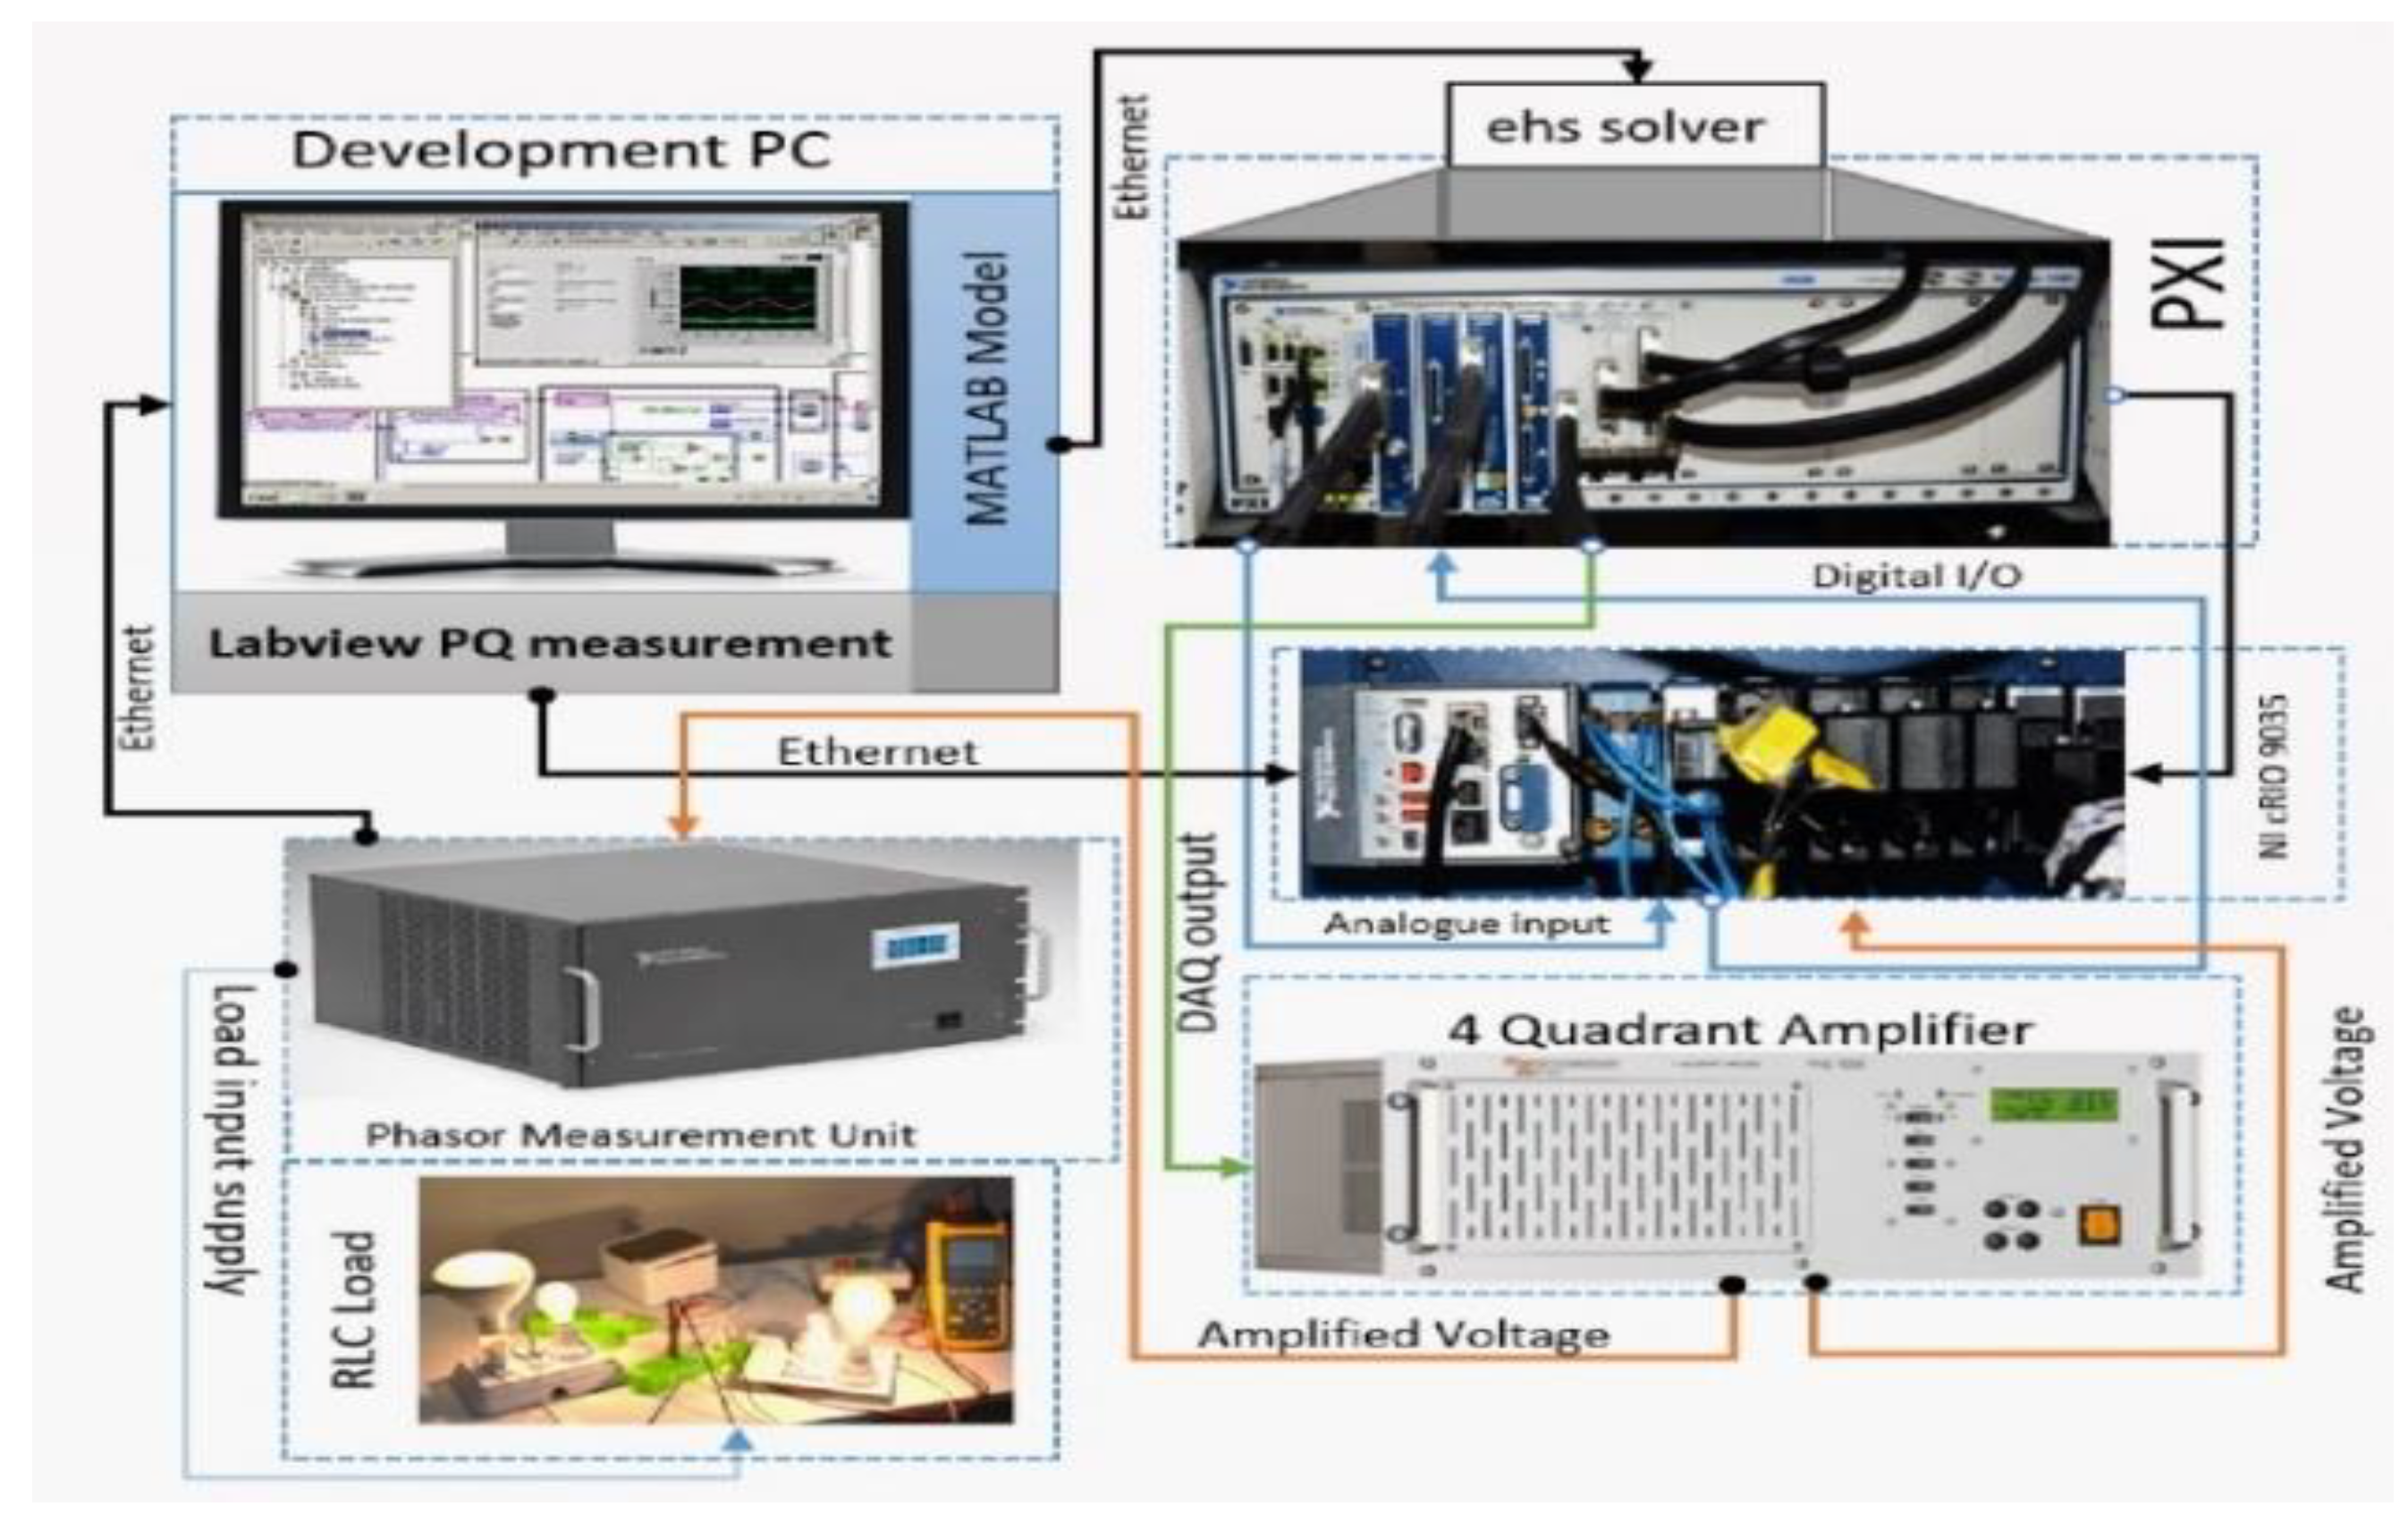
3. Description of the RT-PHIL Platform

Figure 1 presents the diagram of a typical RT-HIL platform, which consists of a server (master-control unit) and is connected to communicate with the other panels, i.e., development panel, deployment panel, phasor measurement units, and power amplifier. The PXI with a high throughput is physically connected with the controller through a high-speed digital input, digital output cards that transfer data at a rate of 100 MHz, and analogue output cards with a data transfer rate of 1 mega samples/s, which are called FlexRIOs. The controller used is an FPGA-based NI CRIO 9035 that provides both hardware and software flexibility in configuring it as per the requirements of the application.

4. Real-Time Implementation in Power Hardware-in-Loop

The HIL architecture facilitates users to build a model in MATLAB/PLECS/PSIM/Multisim and burn it into PXI through eHS solver provided by OPAL RT, which is an FPGA-based floating point solver that facilitates the users to burn an electrical circuit on FPGA automatically with a step size of nanoseconds and without having to code in VHDL or calculate system equations. The overall scheme of the RT system discussed above is shown in Figure 2. Hardware, i.e., CRIO used for PQ will be discussed in the upcoming section.

4.1. Compact RIO Hardware Description

Compact RIO combines the RT operating system with an embedded floating-point processor, a remarkable FPGA performance, and hot-swappable analogue and digital input/output modules, that provide quality and hardware flexibility. Each module in CRIO is directly connected with the FPGA, thus realizing minimum jitter and high-speed input/output signal processing [32]. The FPGA is physically linked to the RT processor via the PCI bus, as shown in Figure 3, which presents the internal architecture of the CRIO with an open retrieve to basic hardware resources. The FPGA and RT processor are programmed in LabVIEW, which is a graphical-based programming language platform. LabVIEW has an integrated data fetching mechanism for circulating data from the FPGA to the input/output modules and from the FPGA to the RT processor for the real-time analysis, data logging, post processing, and communication with a host computer. CRIO provides a compact solution, small size, wide operating temperature of −40 °C to +70 °C, and a low operating power consumption.

4.2. CRIO-Based PQ Analysis

The FGPA and RT in NI CRIO 9035 was programmed for PQ analysis using NI LabVIEW, and effective communication was developed between them for data sharing. The RT system containing pools of different Vis, reads the data from the FPGA VI using FIFOs for the THD analysis of the voltage and current, active power, reactive power, frequency, energy, voltage sag, voltage swell, and current measurement, as shown in Figure 4. Considering the IEC standard 61000-4-7: 2002 and EN50160, harmonic and inter-harmonic LabVIEW VI was developed, and for aggregated frequency values, IEC 61000-4-30: 2008 was adopted, which specified that the time duration considered for the voltage quality parameters (harmonics, inter-harmonics, and unbalance) must be 12 cycles for a 60 Hz system or a 10-cycle time interval for a 50 Hz system and is implemented using the zero-crossing method [33,34,35]. For the voltage and current measurement, 24-bit CRIO modules NI 9244 with the capability of measuring 400 V rms L–N and 800 V rms and NI 9247 with the capability of measuring 50 A rms were used to acquire data at 50,000 samples/s/channel. The data are then filtered and resampled for conversion into a fixed number of samples/cycle for the power calculations.

4.3. Model Loaded in PXI

As a base model, a three-phase, three-level NPC converter was used for a real-time simulation developed in MATLAB Simulink, as shown in Figure 5. This model was loaded into the OPAL-RT eHS-64 solver at a step size of 200 ns. The sinusoidal pulse width modulation (SPWM)-based PWM control for the NPC model was developed in LabVIEW FPGA and deployed in CRIO. The digital input/output module NI 9401 was used to control the switches of the NPC for the three-phase output voltage and current. After the model was loaded in the PXI, control was applied through CRIO, and a three-phase voltage was observed from different analogue output pins of the data acquisition (DAQ) card that is directly connected with the PXI. The DAQ can generate a maximum of ±10 V depending on the input and the load cannot be operated under ±10 V. From one of the analogue outputs of the DAQ single-phase, four quadrant amplifiers were fed, which increased the voltage to 220 V for different scenarios as discussed in the results section.

5. Experimental Results

In order to compare the performance of the CRIO-based PQ analyzer and traditional Fluke-based PQ analyzer, three different scenarios were considered. The analysis is further discussed in the following case studies.

5.1. Analysis of Experimental Setup for First-Case Scenario

In this case, the results were obtained and analyzed with the RLC load in the HIL environment using the CRIO and the Fluke PQ analyzer. The RLC load with a 100 W incandescent bulb, 50 W fluorescent lamp, and a pump of 0.437 kW 0.5 HP used in this case study as comprise, capacitive, and inductive loads, respectively. The output of the DAQ ±10 V was increased to 220 V using a four-quadrant amplifier, and the load was connected at the output of the amplifier. The output voltage and total load current was presented in Figure 6, Figure 7, Figure 8 and Figure 9. The voltage THD and its spectra were measured as shown in Figure 10 and Figure 11 using CRIO and the Fluke-based PQ analyzer, respectively. Similarly, the current THD and its spectra are shown in Figure 12 and Figure 13 using CRIO and the Fluke-based PQ analyzer, respectively. The current spectra show that the third and fifth harmonics are present in the system. Similarly, other parameters such as active power (P), reactive power (Q), apparent power (S), displacement power factor, and power factor are also measured through both the PQ analyzers as shown in Figure 14. The measurements are further compared for both the PQ analyzers, as shown in Table 1.

5.2. Analysis of Experimental Setup for Second-Case Scenario

For the inrush current measurement and analysis inductive load considered, i.e., two water pumps of the same power rating, as discussed earlier in the first-case scenario. Initially both the pumps were in the off condition as can be observed before 7.5 ms, when the current is zero. As the pumps are powered up, the inrush current is observed to increase from 7.5 ms to 20 ms with an amplitude of 9 A for the first three cycles, and this decays gradually after each proceeding cycle, and it takes a total of the first seven cycles to come into the steady state condition, which is almost 20 ms.
For the inrush current measurement, the Fluke was set to indicate a 5-A step for each box. It can be observed in Figure 15 that the results obtained are the same as those observed in the case of the CRIO. However, there is a slight difference in the peak value of the current. The Fluke shows a peak of 8.5 A in Figure 16, whereas the results obtained from CRIO show a peak of almost 9 A for the first three cycles. The comparison of the obtained results is shown in the Table 2.

5.3. Analysis of Experimental Setup for Third-Case Scenario

Figure 17 depicts the real-time monitoring of a hydro power generator using NI CRIO. The purpose of using this hardware, particularly for the analysis of the voltage sag and swell, is the availability of suitable loads for creating sags and swells for a fixed given excitation. So, in this regard, a nominal voltage of 12 Volts AC is generated via manual excitation of the hydro power generator. The results of the voltage sag and swell are obtained for 4 min by operating the CRIO PQ analyzer along with the Fluke PQ analyzer.
Initially, the system is operating at no load with its nominal voltage output of approximately 12 V for the first half minute, as shown in Figure 18 and Figure 19. Then, in the next 1 min, resistive and inductive load is applied to the generator in such a manner that the voltage drops below 10.8 V for observing the voltage sag. Again, for the next 1 min, the load is removed from the system and it allows its nominal output. Now, for analyzing the voltage swell, the capacitive load is connected in the system, and resultant increased voltage is observed beyond 13.2 V for another 1 min. Finally, the system is returned to its normal state by removing the load in the last half minute. The current variations in response to various load variations are shown in Figure 20 and Figure 21 using the CRIO and Fluke PQA, respectively.
In addition, the CRIO PQ analyzer provides a flexible, user-friendly interface and is also capable of real-time frequency measurement, as shown in Figure 22 with respect to the loads connected and removed at different time intervals, as discussed earlier. Moreover, the phasor or vector diagram in the case of different loads can also be obtained using the proposed PQA as shown in Figure 23a–c for resistive, inductive, and capacitive loads, respectively, for resistive load voltage and current in phase. However, for the inductive and capacitive load the phasor diagrams are 90 degrees out of phase.
Thus, comparing the CRIO PQ analyzer with the Fluke PQ analyzer in terms of voltage sags and swells, frequency measurement, and phasor diagram, the CRIO PQ analyzer is found to be a more compact and reconfigurable solution. Cloud computing-based smart applications are growing progressively to deal with different power quality applications [36,37]. In contrast to the conventional PQAs, the CRIO-based PQA can be monitored remotely via the internet.

6. Conclusions and Future Work

The integration of renewable energy into a modern grid has posed new PQ challenges. Conventional measurement instruments may not be adequate for meeting the challenges of the grid of tomorrow. In contrast to traditional PQA tools, a cost-effective CRIO-based PQA is presented in this paper, as it is software designed and provides a user-defined solution for identifying a problem early and preventing the occurrence of a power outage. The efficacy of the proposed PQA is verified by comparing its results with the state-of-the-art Fluke’s 43-B PQA54. The proposed PQA can be modified or extended easily in a short period of time according to the latest international standards or any additional functionality required by the customer; however, its major limitation is that the customer should be familiar with the LabVIEW FPGA in order to modify the functionalities. The paper also illustrates the architecture of the HIL test bench to investigate and validate the performance of an electrical system in real time. A three-phase NPC converter loaded in the NI PXIe-1085 HIL and controlled through the CRIO for its real-time simulation and actual single-phase load was driven using a four-quadrant power amplifier for the PQ analysis. The results obtained via the PQA were in agreement with the requirements of the IEC standard 61000-4-7, 15, 30, and EN50160. The superiority of the CRIO hardware lies in the fact that, in addition to the PQA analysis, the same CRIO module in the HIL architecture may be used as rapid control prototyping for power converters.
Further work is required in different areas related to the control of each PQ index discussed in the study. For example, for THD reduction, active power filters can be designed in the HIL environment, and their performance can be evaluated as compared with passive low-pass filters. The inrush current can be decreased for a lower number of cycles using the controllers discussed in the literature. Moreover, our university installed a 1-MW grid connected a PV power plant. The proposed CRIO-based PQA will be implemented for monitoring the PQ of an overall photovoltaic grid and PV inverter output signals injected into the grid remotely via the internet.

Author Contributions

Conceptualization, J.B. and V.B.; methodology, H.M.M.; software, S.A.; writing—original draft preparation, S.S.H.B.; supervision, S.S.H.B., funding, J.-S.R. All authors have read and agreed to the published version of the manuscript.

Funding

This work was supported in part by the Human Resources Development (No.20204030200090) of the Korea Institute of Energy Technology Evaluation and Planning(KETEP) grant funded by the Korea government Ministry of Trade, Industry and Energy, in part by the Basic Science Research Program through the National Research Foundation of Korea by the Ministry of Education under Grant 2016R1D1A1B01008058, and in part by the Brain Pool (BP) Program through the National Research Foundation of Korea (NRF) by the Ministry of Science and ICT under Grant 2019H1D3A1A01102988.

Conflicts of Interest

The authors declare no conflict of interest.

References

  1. Ray, P.K.; Asit, M.; Tapas, P. Power quality analysis in solar PV integrated microgrid using independent component analysis and support vector machine. Optik 2019, 180, 691–698. [Google Scholar] [CrossRef]
  2. Betta, G.; Ferrigno, L.; Laracca, M. Cost-effective FPGA instrument for harmonic and interharmonic monitoring. IEEE Trans. Instrum. Meas. 2013, 62, 2161–2170. [Google Scholar] [CrossRef]
  3. Mohamadian, S.; Tessarolo, A.; Castellan, S.; Shoulaie, A. Steady-state simulation of LCI-fed synchronous motor drives through a computationally efficient algebraic method. IEEE Trans. Power Electron. 2017, 32, 452–470. [Google Scholar] [CrossRef]
  4. Mohamadian, S.; Castellan, S.; Tessarolo, A.; Ferrari, G.; Shoulaei, A. An algebraic algorithm for motor voltage waveform prediction in dual-LCI drives with interconnected DC-links. IEEE Trans. Energy Convers. 2016, 31, 506–519. [Google Scholar] [CrossRef]
  5. Sanghavi, B.M.; Tejaswini, C.; Venkateshappa, V. DC/DC boost converter using DSP controller for fuel cell. Perspect. Commun. Embed.-Syst. Signal-Process. PICES 2019, 2, 248–251. [Google Scholar]
  6. Lauss, G.F.; Faruque, M.O.; Schoder, K.; Dufour, C.; Viehweider, A.; Langston, J. Characteristics and design of power hardware-in-the-loop simulations for electrical power systems. IEEE Trans. Ind. Electron. 2016, 63, 406–417. [Google Scholar] [CrossRef]
  7. Dinavahi, V.R.; Iravani, M.R.; Bonert, R. Real-time digital simulation of power electronic apparatus interfaced with digital controllers. IEEE Trans. Power Deliv. 2001, 16, 775–781. [Google Scholar] [CrossRef]
  8. Goni, O.; Sanchez, A.; Todorovich, E.; De Castro, A. Resolution analysis of switching converter models for hardware-in-the-loop. IEEE Trans. Ind. Inform. 2014, 10, 1162–1170. [Google Scholar] [CrossRef]
  9. Lucia, O.; Urriza, I.; Barragan, L.A.; Navarro, D.; Jimenez, O.; Burdío, J.M. Real-time FPGA-based hardware-in-the-loop simulation test bench applied to multiple-output power converters. IEEE Trans. Ind. Appl. 2011, 47, 853–860. [Google Scholar] [CrossRef]
  10. Millitzer, J.; Mayer, D.; Henke, C.; Jersch, T.; Tamm, C.; Michael, J.; Ranisch, C. Recent Developments in Hardware-in-the-Loop Testing. In Model Validation and Uncertainty Quantification; Springer: Cham, Switzerland, 2019; Volume 3, pp. 65–73. [Google Scholar]
  11. Lauss, G.; Strunz, K. Multirate partitioning interface for enhanced stability of power hardware-in-the-loop real-time simulation. IEEE Trans. Ind. Electron. 2019, 66, 595–605. [Google Scholar] [CrossRef]
  12. Faruque, M.O.O.; Dinavahi, V. Hardware-in-the-loop simulation of power electronic systems using adaptive discretization. IEEE Trans. Ind. Electron. 2010, 57, 1146–1158. [Google Scholar] [CrossRef]
  13. Faruque, M.O.; Strasser, T.; Lauss, G.; Jalili-Marandi, V.; Forsyth, P.; Dufour, C.; Dinavahi, V.; Monti, A.; Kotsampopoulos, P.; Martinez, J.A.; et al. Real-time simulation technologies for power systems design, testing, and analysis. IEEE Power Energy Technol. Syst. J. 2015, 2, 63–73. [Google Scholar] [CrossRef]
  14. Stackler, C.; Evans, N.; Bourserie, L.; Wallart, F.; Morel, F.; Ladoux, P. 25 kV–50 Hz railway power supply system emulation for power-hardware-in-the-loop testings. IET Electr. Syst. Transp. 2019, 9, 86–92. [Google Scholar] [CrossRef] [Green Version]
  15. Washington, C. HIL Simulation Boosts Automotive Design Efficiency. EE Times. Available online: http://www.eetimes.com/document.asp?doc_id=1272817 (accessed on 9 May 2007).
  16. Terwiesch, P.; Keller, T.; Scheiben, E. Rail vehicle control system integration testing using digital hardware-in-the-loop simulation. IEEE Trans. Control Syst. Technol. 1999, 7, 352–362. [Google Scholar] [CrossRef] [Green Version]
  17. Oh, S.C. Evaluation of motor characteristics for hybrid electric vehicles using the hardware-in-the-loop concept. IEEE Trans. Veh. Technol. 2005, 54, 817–824. [Google Scholar] [CrossRef]
  18. Bevis, T.; Edrington, C.S.; Leonard, J. Application of power hardware-in-the-loop for electric vehicles: A case study utilizing switched reluctance machines. In Proceedings of the IECON 2010-36th Annual Conference on IEEE Industrial Electronics Society, Glendale, AZ, USA, 7–10 November 2010; IEEE: Piscataway, NJ, USA, 2010; pp. 2499–2503. [Google Scholar]
  19. Guillaud, X.; Faruque, M.O.; Teninge, A.; Hariri, A.H.; Vanfretti, L.; Paolone, M.; Dinavahi, V.; Mitra, P.; Lauss, G.; Dufour, C.; et al. Applications of real-time simulation technologies in power and energy systems. IEEE Power Energy Technol. Syst. J. 2015, 2, 103–115. [Google Scholar] [CrossRef] [Green Version]
  20. Fleming, F.; Edrington, C.S. A power hardware in the loop applications study for benchmarking electromagnetic device modeling methods. In Proceedings of the America Society Naval Engineer Electric Machines Technology Symposium, Philadelphia, PA, USA, 23–24 May 2012. [Google Scholar]
  21. Ren, W.; Steurer, M.; Woodruff, S. Applying controller and power hardware-in-the-loop simulation in designing and prototyping apparatuses for future all electric ship. In Proceedings of the 2007 IEEE Electric Ship Technologies Symposium, Arlington, VA, USA, 21–23 May 2007; IEEE: Piscataway, NJ, USA, 2007; pp. 443–448. [Google Scholar]
  22. Langston, J.; Sloderbeck, M.; Steurer, M.; Dalessandro, D.; Fikse, T. Role of hardware-in-the-loop simulation testing in transitioning new technology to the ship. In Proceedings of the 2013 IEEE Electric Ship Technologies Symposium (ESTS), Arlington, VA, USA, 22–24 April 2013; IEEE: Piscataway, NJ, USA, 2013; pp. 514–519. [Google Scholar]
  23. Brandl, R.; Hernandez, H.; Geibel, D. HIL methods supporting the development process from simulations to real environment testing. DER J. 2012, 8, 343–356. [Google Scholar]
  24. Himmler, A.; Stockmann, L.; Walter, S.; Laux, S. Developments Targeting Hybrid Test Systems for HIL Testing. In Proceedings of the AIAA Scitech 2019 Forum, San Diego, CA, USA, 7–11 January 2019; p. 1707. [Google Scholar]
  25. O’Driscoll, E.; O’Donnell, G.E. Industrial power and energy metering–a state-of-the-art review. J. Clean. Prod. 2013, 41, 53–64. [Google Scholar] [CrossRef]
  26. Pellegrinelli, G.; Baù, M.; Cerini, F.; Dalola, S.; Ferrari, M.; Ferrari, V. Portable energy-logger circuit for the experimental evaluation of energy harvesting solutions from motion for wearable autonomous sensors. Procedia Eng. 2014, 87, 1230–1233. [Google Scholar] [CrossRef] [Green Version]
  27. Rodrigues, E.M.G.; Godina, R.; Shafie-Khah, M.; Catalão, J.P.S. Experimental results on a wireless wattmeter device for the integration in home energy management systems. Energies 2017, 10, 398. [Google Scholar] [CrossRef] [Green Version]
  28. Tomesc, L.; Dobra, P.; Abrudean, M. Low-cost power quality analizer. IFAC Proc. Vol. 2007, 40, 157–162. [Google Scholar] [CrossRef]
  29. Atalik, T.; Čadirci, I.; Demirci, T.; Ermis, M.; Inan, T.; Kalaycioglu, A.S.; Salor, Ö. Multipurpose platform for power system monitoring and analysis with sample grid applications. IEEE Trans. Instrum. Meas. 2013, 63, 566–582. [Google Scholar] [CrossRef]
  30. Electromagnetic Compatibility—Testing and Measurement Techniques—General Guide on Harmonics and Interharmonics Measurements and Instrumentation, for Power Supply Systems and Equipment Connected Thereto. Int. Std. IEC 61000-4-7. 2002. Available online: https://webstore.iec.ch/publication/4226 (accessed on 5 July 2021).
  31. Langella, R.; Alfredo, T. IEEE Standard Definitions for the Measurement of Electric Power Quantities under Sinusoidal, Nonsinusoidal, Balanced, or Unbalanced Conditions, 2010. Available online: https://ieeexplore.ieee.org/document/5439063 (accessed on 5 July 2021).
  32. Deng, J.; Lam, C.S.; Wong, M.C.; Wang, L.; Sin, S.W.; Martins, R.P. A Power Quality Indexes Measurement System Platform with Remote Alarm Notification. In Proceedings of the IECON 2018-44th Annual Conference of the IEEE Industrial Electronics Society, Washington, DC, USA, 21–23 October 2018; IEEE: Piscataway, NJ, USA, 2018; pp. 3461–3465. [Google Scholar]
  33. Bilik, P.; Koval, L.; Hajduk, J. CompactRIO embedded system in power quality analysis. In Proceedings of the 2008 International Multiconference on Computer Science and Information Technology, Wisła, Poland, 20–22 October 2008; IEEE: Piscataway, NJ, USA, 2008; pp. 577–580. [Google Scholar]
  34. IEC 61000-4-7 Amend.1 to Ed.2: Electromagnetic Compatibility (EMC): Testing and Measurement Techniques—General Guide on Harmonics and Interharmonics Measurements and Instrumentation, for Power Supply Systems and Equipment Connected Thereto. Available online: https://standards.iteh.ai/catalog/standards/iec/c4e1c16d-4eec-481b-a45f-67dd8fee0e1a/iec-61000-4-34-2005-amd1-2009 (accessed on 5 July 2021).
  35. IEC 61000-4-30 Electromagnetic Compatibility (EMC): Testing and Measurement Techniques—Power Quality Measurement Methods. Available online: https://webstore.iec.ch/publication/68642 (accessed on 5 July 2021).
  36. Lakhan, A.; Dootio, M.A.; Groenli, T.M.; Sodhro, A.H.; Khokhar, M.S. Multi-Layer Latency Aware Workload Assignment of E-Transport IoT Applications in Mobile Sensors Cloudlet Cloud Networks. Electronics 2021, 10, 1719. [Google Scholar] [CrossRef]
  37. Sodhro, A.H.; Sangaiah, A.K.; Sodhro, G.H.; Lohano, S.; Pirbhulal, S. An energy-efficient algorithm for wearable electrocardiogram signal processing in ubiquitous healthcare applications. Sensors 2018, 18, 923. [Google Scholar] [CrossRef]
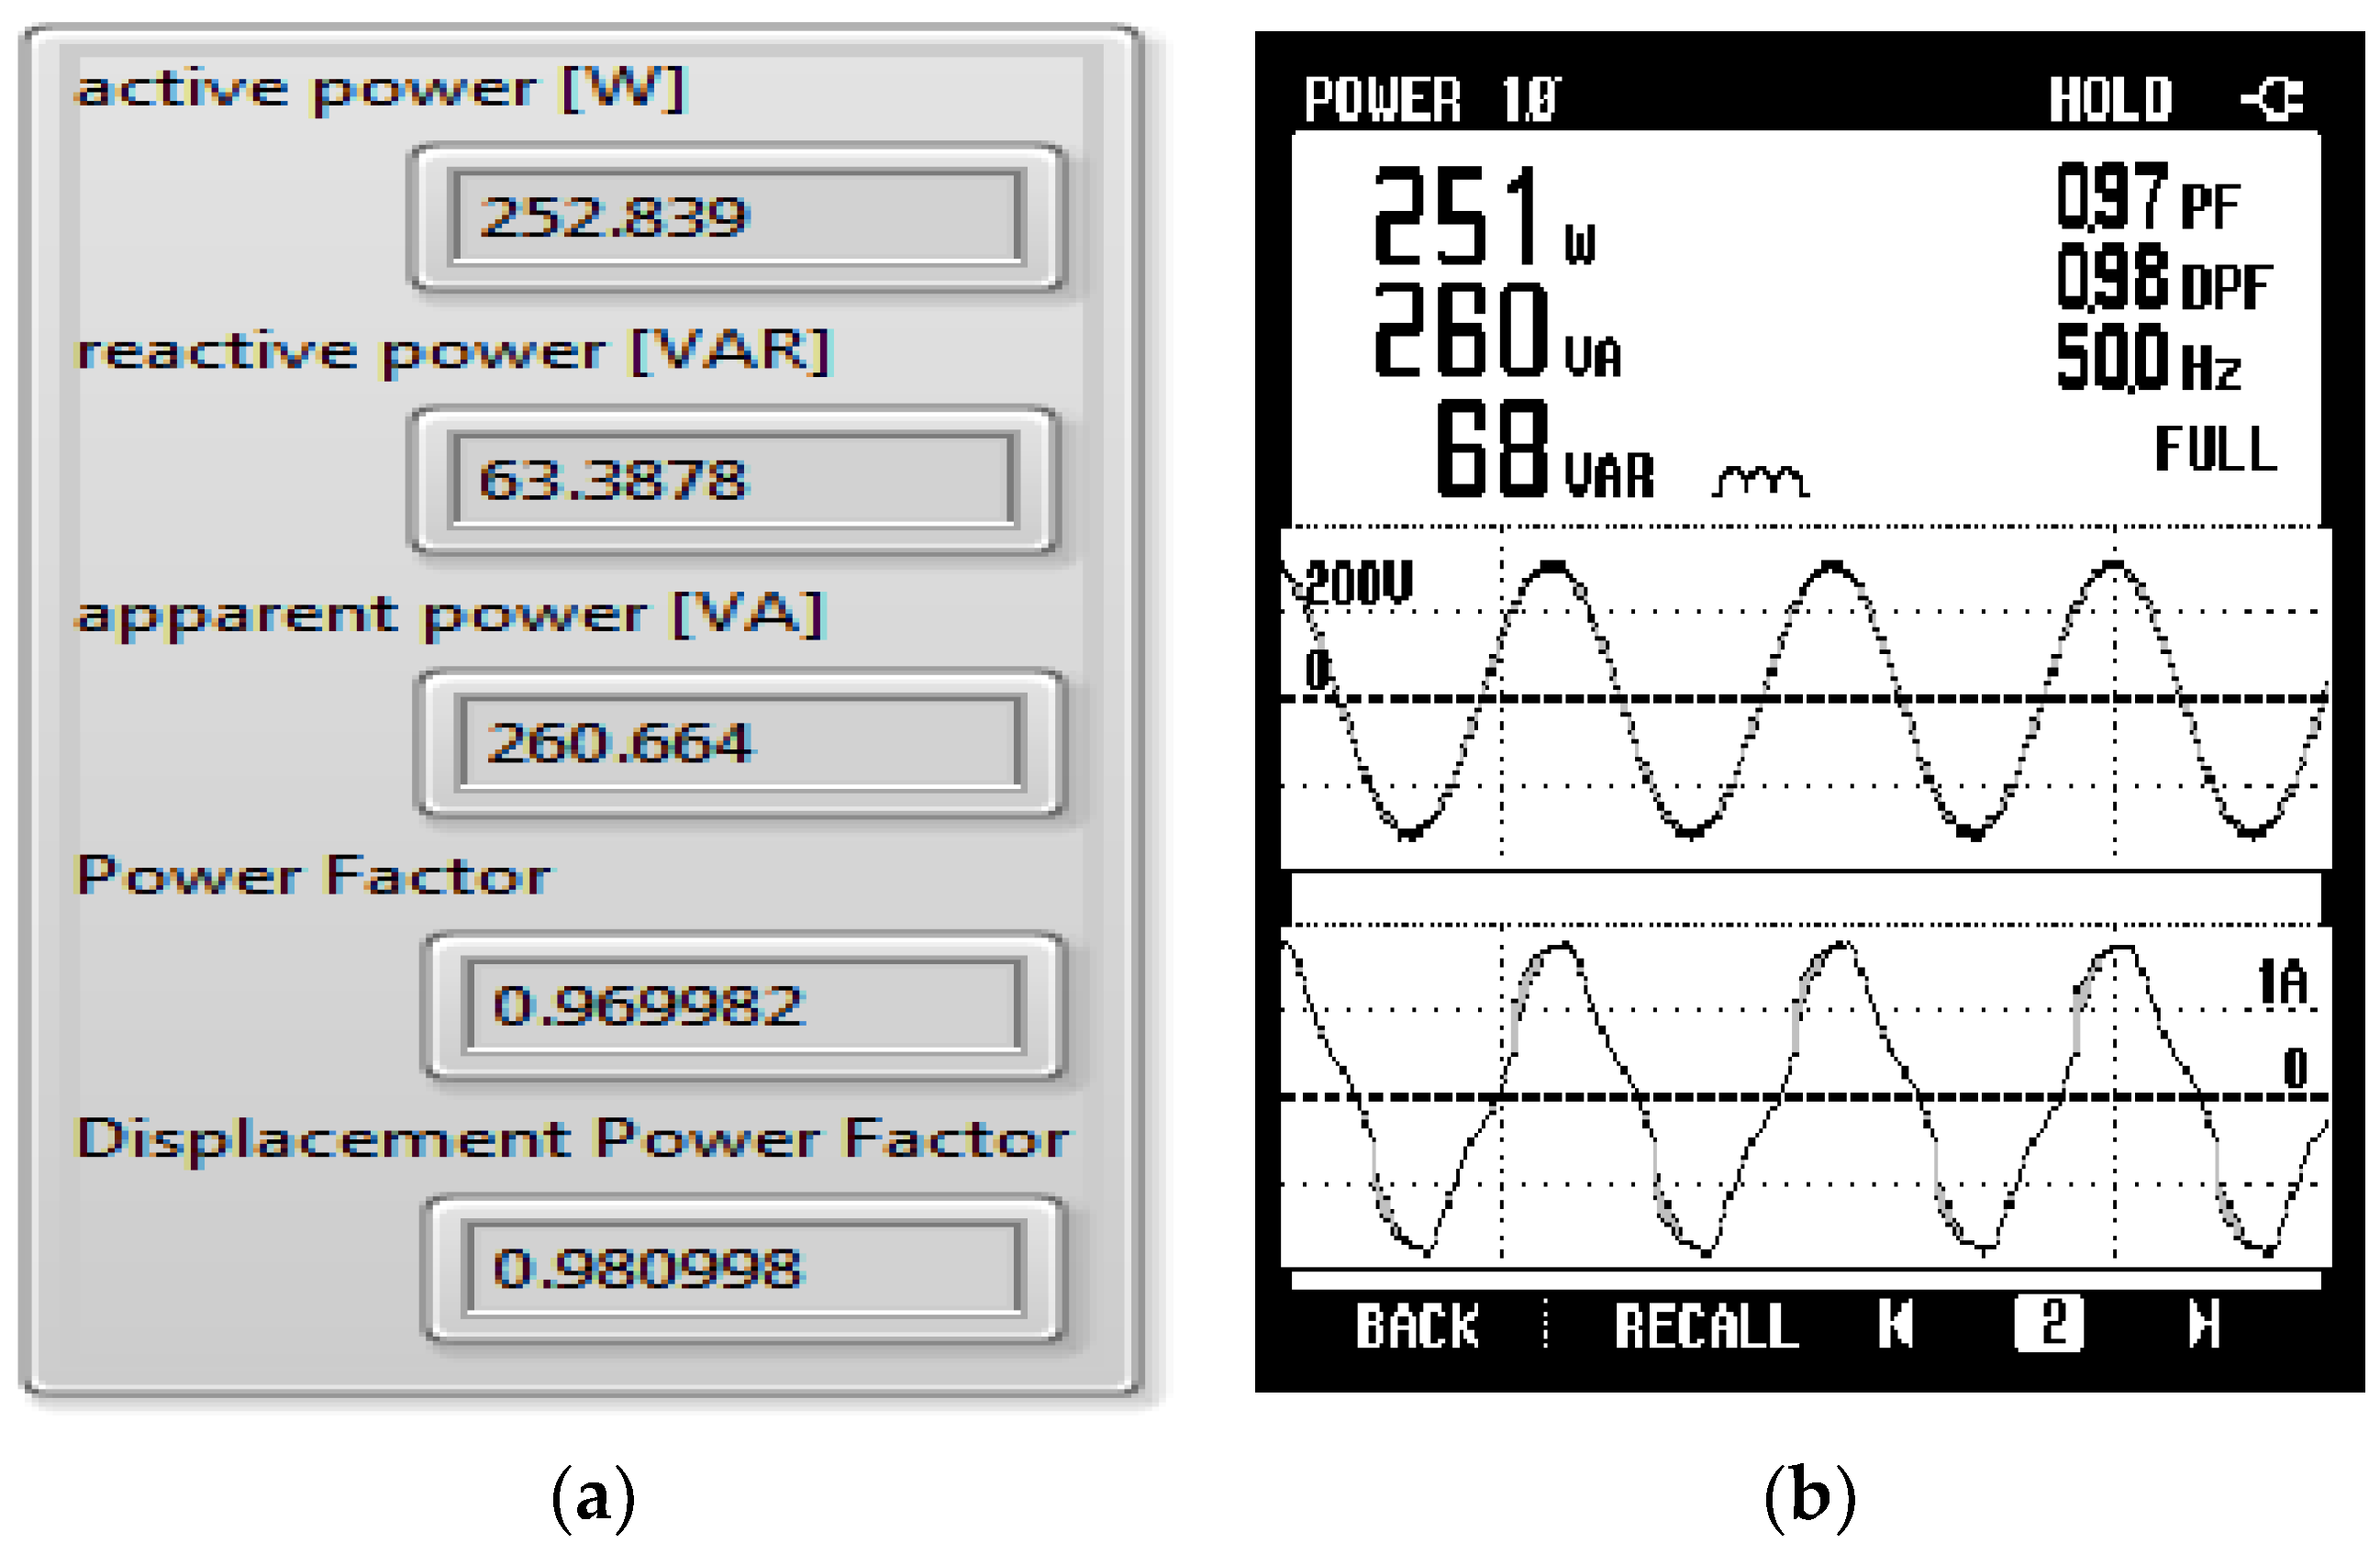
 [Green Version]
Figure 1. RT-HIL Platform at our university.
Energies 14 05134 g001
Figure 2. Experimental Setup of Hardware-in-Loop.
Energies 14 05134 g002
Figure 3. NI CRIO architecture.
Energies 14 05134 g003
Figure 4. Proposed LabVIEW RT and FPGA Code Block in CRIO.
Energies 14 05134 g004
Figure 5. Circuit model of three NPC converter.
Energies 14 05134 g005
Figure 6. Output voltage waveform using CRIO PQ analyzer.
Energies 14 05134 g006
Figure 7. Output voltage waveform using Fluke PQ analyzer.
Energies 14 05134 g007
Figure 8. Output current waveform obtained using CRIO PQ.
Energies 14 05134 g008
Figure 9. Output current waveform obtained using Fluke PQ analyzer.
Energies 14 05134 g009
Figure 10. Output voltage THD and its spectra using CRIO PQ analyzer.
Energies 14 05134 g010
Figure 11. Output voltage THD and its spectra obtained using Fluke PQ analyzer.
Energies 14 05134 g011
Figure 12. Output current THD and its spectra obtained using CRIO PQ analyzer.
Energies 14 05134 g012
Figure 13. Output current THD and its spectra using Fluke PQ analyzer.
Energies 14 05134 g013
Figure 14. (a) Active, reactive, and apparent power, power factor and displacement power factor using CRIO PQ analyzer; (b) active, reactive, and apparent power, power factor and displacement power factor using Fluke PQ analyzer.
Energies 14 05134 g014
Figure 15. Inrush current measurement using CRIO PQ analyzer.
Energies 14 05134 g015
Figure 16. Inrush current measurement performed using Fluke PQ analyzer.
Energies 14 05134 g016
Figure 17. Real-time monitoring of hydro power generation using CRIO.
Energies 14 05134 g017
Figure 18. Voltage sag and swell measurement using CRIO PQ analyzer.
Energies 14 05134 g018
Figure 19. Voltage sag and swell measurement using Fluke PQ analyzer.
Energies 14 05134 g019
Figure 20. Current during voltage sag and swell using CRIO PQ analyzer.
Energies 14 05134 g020
Figure 21. Current during voltage sag and swell using Fluke PQ analyzer.
Energies 14 05134 g021
Figure 22. Frequency deviation during voltage sag and swell using CRIO PQ Analyzer.
Energies 14 05134 g022
Figure 23. Vector diagram of (a) resistive load (b) inductive load and (c) capacitive load using CRIO PQ analyzer.
Energies 14 05134 g023
Table 1. Results comparison of proposed CRIO-based PQA and conventional Fluke PQ Analyzer.
Power Quality IndicesPQ AnalyzerCRIO-BasedFluke-Based
Voltage RMS219.91 V219.80 V
Current RMS1.16672 A1.16200 A
Reactive Power68.3878 VAR68.000 VAR
Apparent Power260.554 VA260.000 VA
Active Power252.839 W251.000 W
Power Factor0.9699820.97000
Voltage THD %0.2592790.20000
Current THD %14.667714.7000
Table 2. Comparison of the results of the inrush current obtained using CRIO and Fluke.
DeviceMaximum Inrush I For Number: Of CyclesSteady State I after Cycles and Time
CRIO9 A for 3 cycles7 Cycles 20 ms
Fluke8.5 A for 3 cycles7 Cycles 20 ms
Publisher’s Note: MDPI stays neutral with regard to jurisdictional claims in published maps and institutional affiliations.

