1. Introduction
With the Paris Agreement in 2015, the members of the UNFCCC agreed to undertake ambitious efforts to keep the global average temperature rise well below 2 °C above pre-industrial levels and to strive for an increase of less than 1.5 °C within this century [
1]. In order to reach this ambitious long-term goal, nations have to take action and drastically reduce their overall carbon dioxide (CO
2) emissions. Regarding the EU’s total emissions, the road transportation sector makes a share of 21% [
2], whereas road buses in combination with other heavy-duty vehicles contribute to 5.6% of the total emitted CO
2 [
3]. Following the conversion of conventional-powered buses to purely electric-drive ones fed by green energy would have a significant impact on the overall determined goal, which is the reason why the EU started the European Clean Bus deployment initiative in 2016 [
4], which is based on three pillars. The first initiative is a public declaration from cities and regions, manufacturers, and transport organizations endorsing a common ambition to accelerate the roll out of clean buses. The second one is the creation of a deployment platform to exchange information, create coalitions, leverage potential investment action, and issue recommendations on specific policies. Finally, the third pillar is the creation of an expert group bringing together actors from the demand and the supply side. In this context, e-buses can play an important role, by completely avoiding local emissions in the city and reducing the overall emissions proportionally to the increase in renewables in each national energy mix. Nevertheless, the adoption of electric buses is currently slow, as depicted in
Figure 1, where the electric bus registration in thousands of units is presented for the different regions on the left vertical axis, and the percentage deviation in respect to the previous year for the same regions is reported with straight lines on the right vertical axis. As can be seen, China is leading the market with a registration of 78,000 new vehicles in 2020, up in respect to the previous year by 9% and a total sales share of 27%.
Europe is steadily growing at a relatively low pace, registering about 7000 e-buses in 2020 making up 4% of all new bus registration in Europe. On the other hand, considering the number of announced available models of e-buses for the years to come, it is possible to notice how in China and Europe, the numbers are constant, whereas in the USA, an increase is foreseen over the years.
The reasons behind this slow introduction of electric buses into the market are mainly due to the high upfront capital investment in comparison to traditional buses [
5] and the need for proper designing and realization of charging facilities [
6,
7]. Moreover, the performances of an electric bus are highly influenced by driving distances, road orography, weather conditions, traffic congestions, and different passenger demands [
8], thus being difficult for local public transport companies to assess whether a specific e-bus model is capable to substitute the actual traditional vehicle and if the substitution determines different timetables due to charging necessities. In the literature, the estimation of the energy consumption along a route of electric buses is usually obtained considering driving cycles, which are standardized, as reported in [
9], where a tool for assessing the energy consumption of city transit electric buses is proposed. In other works, driving cycles are acquired from real operation data of electric vehicles, as reported in [
10], where standard cycles and real data from Beijing electric vehicles are compared and assessed, or as in [
11], where a real-world dataset from more than 16,000 electric buses in Shenzhen has been used to understand operating and charging patterns. Moreover, in [
12], GPS devices are used to collect locations and times of all the bus lines in Cuenca, Ecuador in order to define which line to prioritize for the electrification according to emissions criteria. Finally, in [
7], the energy consumption value to be used to size the charging infrastructure of an electric bus fleet in Finland is obtained by testing a 12 m prototype.
Table 1 summarizes the review of the studies presented above. In the present work, real data are collected from traditional internal combustion engine buses that are currently in operation to derive a specific drive cycle that accurately resembles the actual operating conditions to which an equivalent e-bus would be subjected. These data are provided to a simulation tool that evaluates the consumption of the equivalent e-bus. In more detail, in
Section 2, the methodology proposed to study the electrification of a line of local public transport service is presented. Then, in
Section 3, the methodology is applied to a real test-case scenario constituted by the electrification of one line of the local public transport in Algeciras Bay to evaluate the overall energy consumption of an equivalent e-bus along the specific line considered. Finally, in
Section 4, several considerations on the best charging system infrastructure are reported, while in
Section 5, conclusions are presented.
2. Methodology
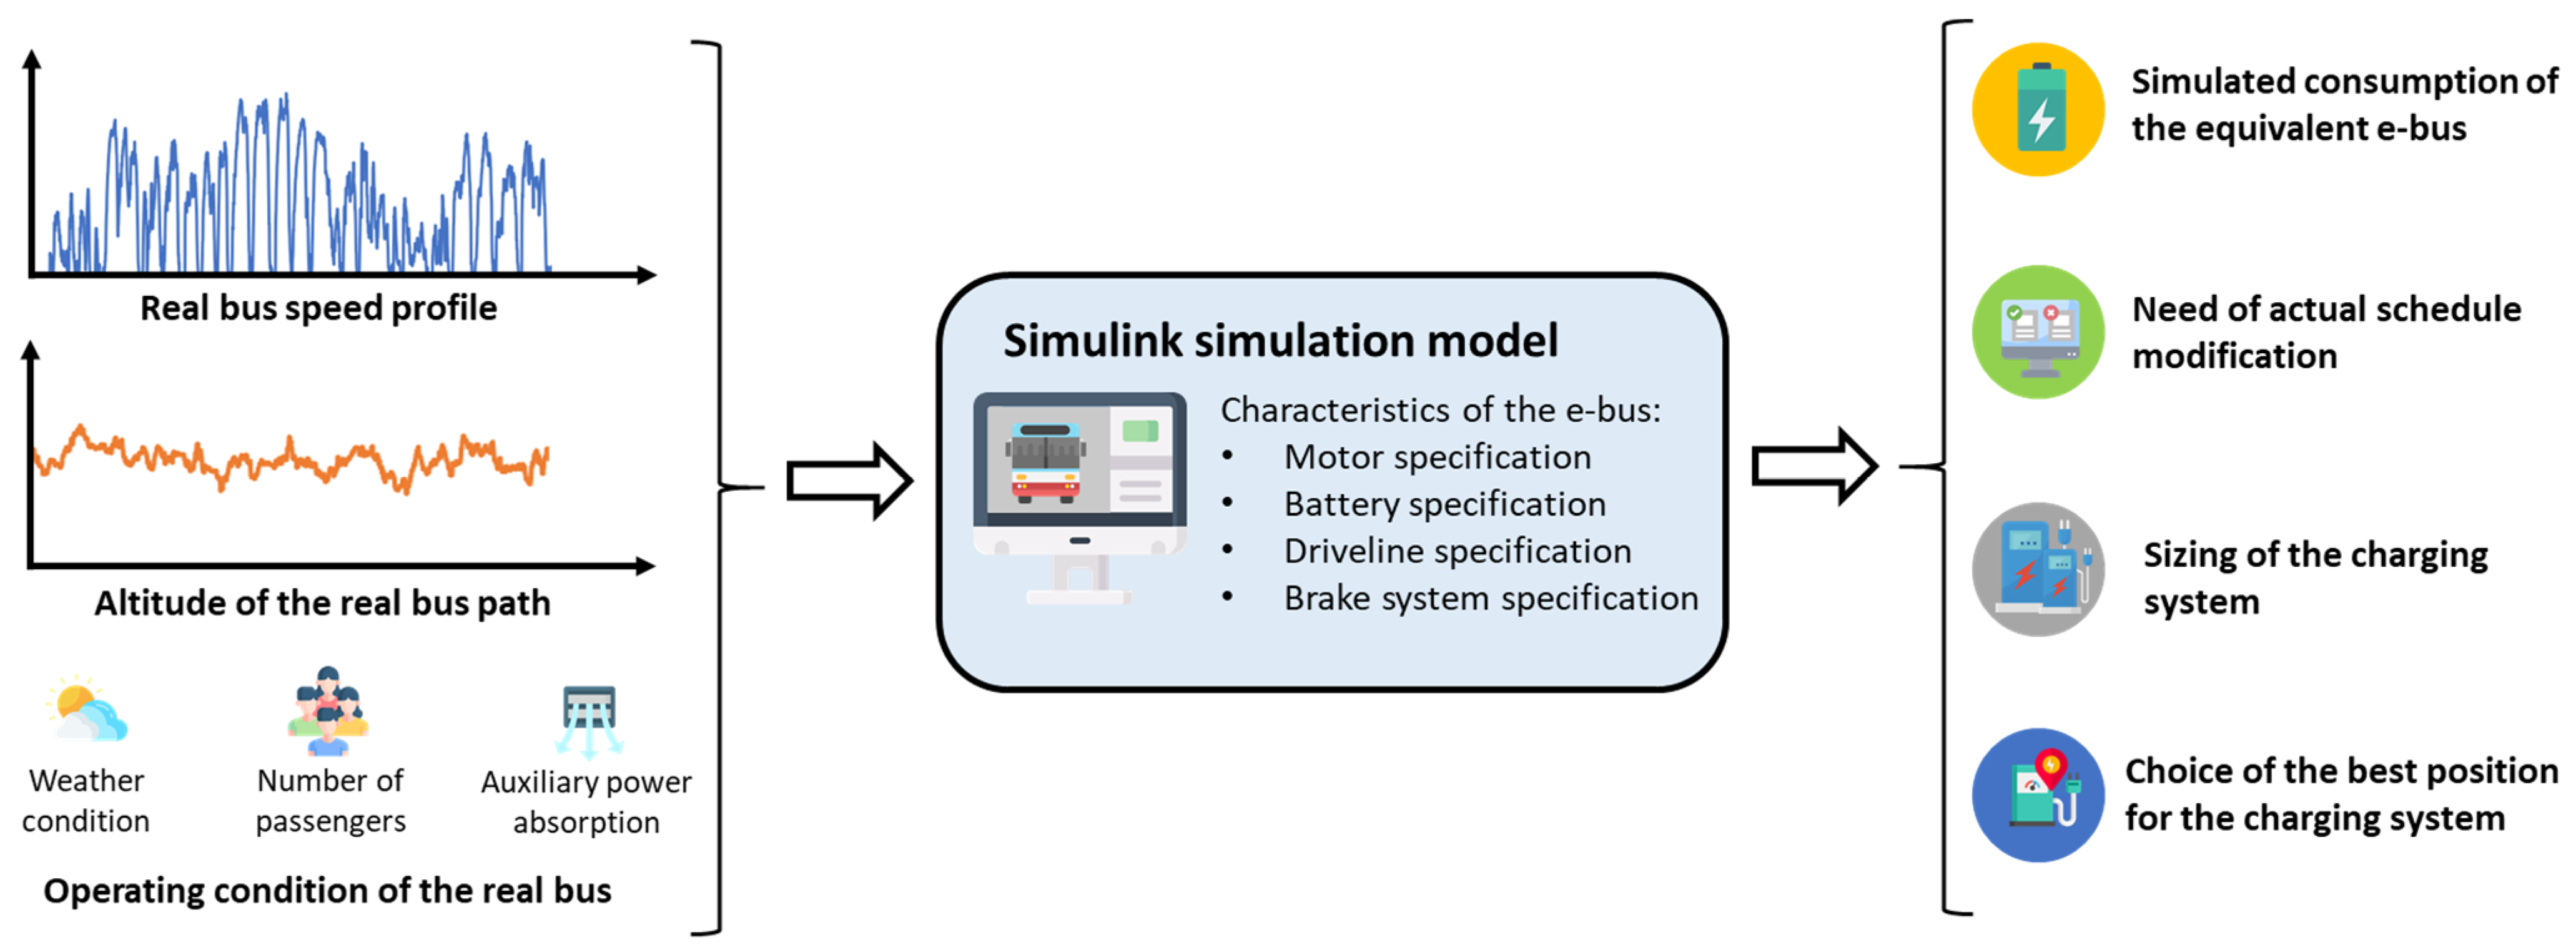
The present work aims to propose a methodology to aid the transition towards electrification of public transport service companies. In more detail, as depicted in
Figure 2, the idea is to use real data coming from actual buses currently deployed by the public transport service companies (such as the bus speed profile along a specific line, the corresponding altitude profile, and the operating conditions of the bus, i.e., the auxiliary power absorption, the number of passengers along the route, and the weather conditions) to run a Simulink simulation model developed to evaluate the consumption of an e-bus. This model simulates the corresponding consumption for an equivalent electric bus in terms of size and seat capacity subjected to the same operating conditions, speed, and altitude profile of the traditional propelled bus. The e-bus considered is characterized inside the model by considering its motor, battery, brake system, and driveline specifications. The main outcome of the model is the simulated consumption of the equivalent e-bus, which is very useful information to make several other considerations in case of the electrification of the line, such as the need for modification of the actual bus schedule, the choice of the best charging system in terms of typology (depot or opportunity charging system), geographical location, and size (capacity of charge).
2.1. Simulink Simulation Model
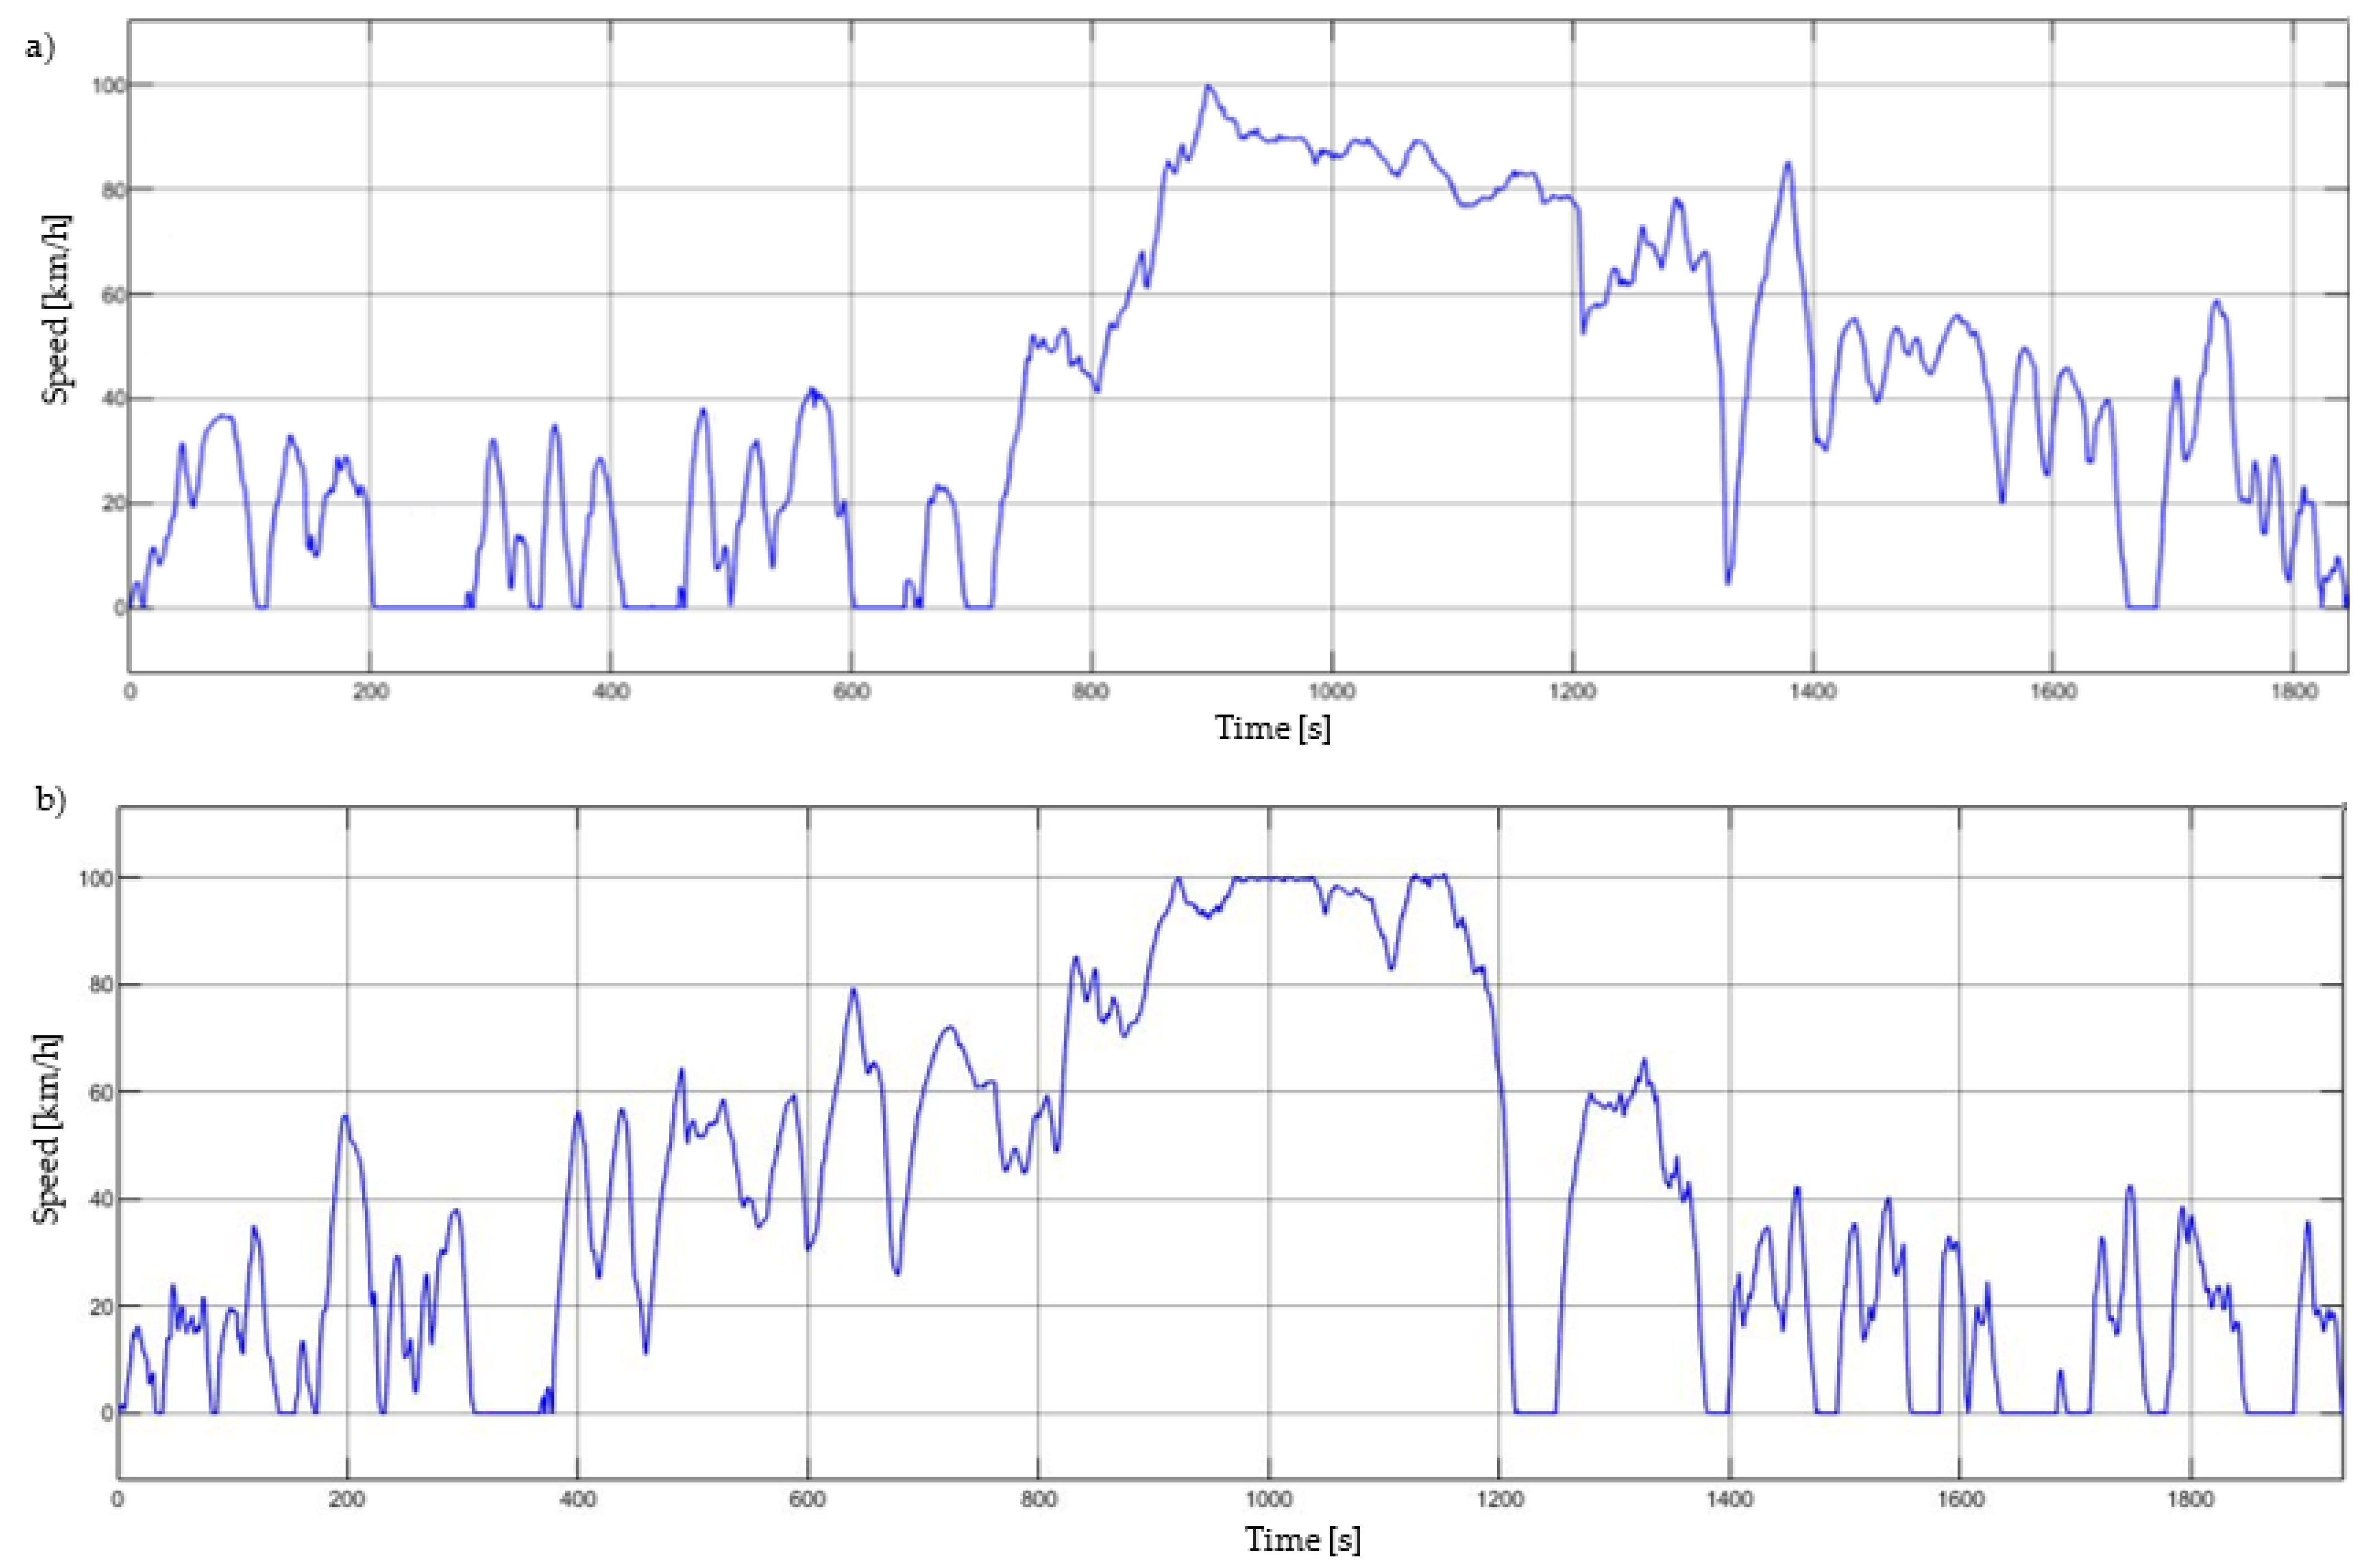
The Simulink simulation model considered in the present work takes inspiration from [
14], where an e-car simulation model is presented. More specifically, in the present work, the driving cycle that is fed to the model is not a standardized driving cycle such as the New European Drive Cycle (NEDC), but derives from real data related to a real bus during its scheduled working hours. In this way, the driving cycle takes into account not only the path conditions but also the impact generated by traffic conditions. Moreover, the Simulink model has been modified in order to be capable of accepting an altitude profile. Indeed, from the altitude variation, it is possible to calculate the slope of the road for each single time frame. This parameter is fundamental while considering the motion equation as described in the following. Furthermore, since the Simulink model in [
15] was considered for an electric car, thus, most of the parameters of the model have been changed to represent a bus scenario.
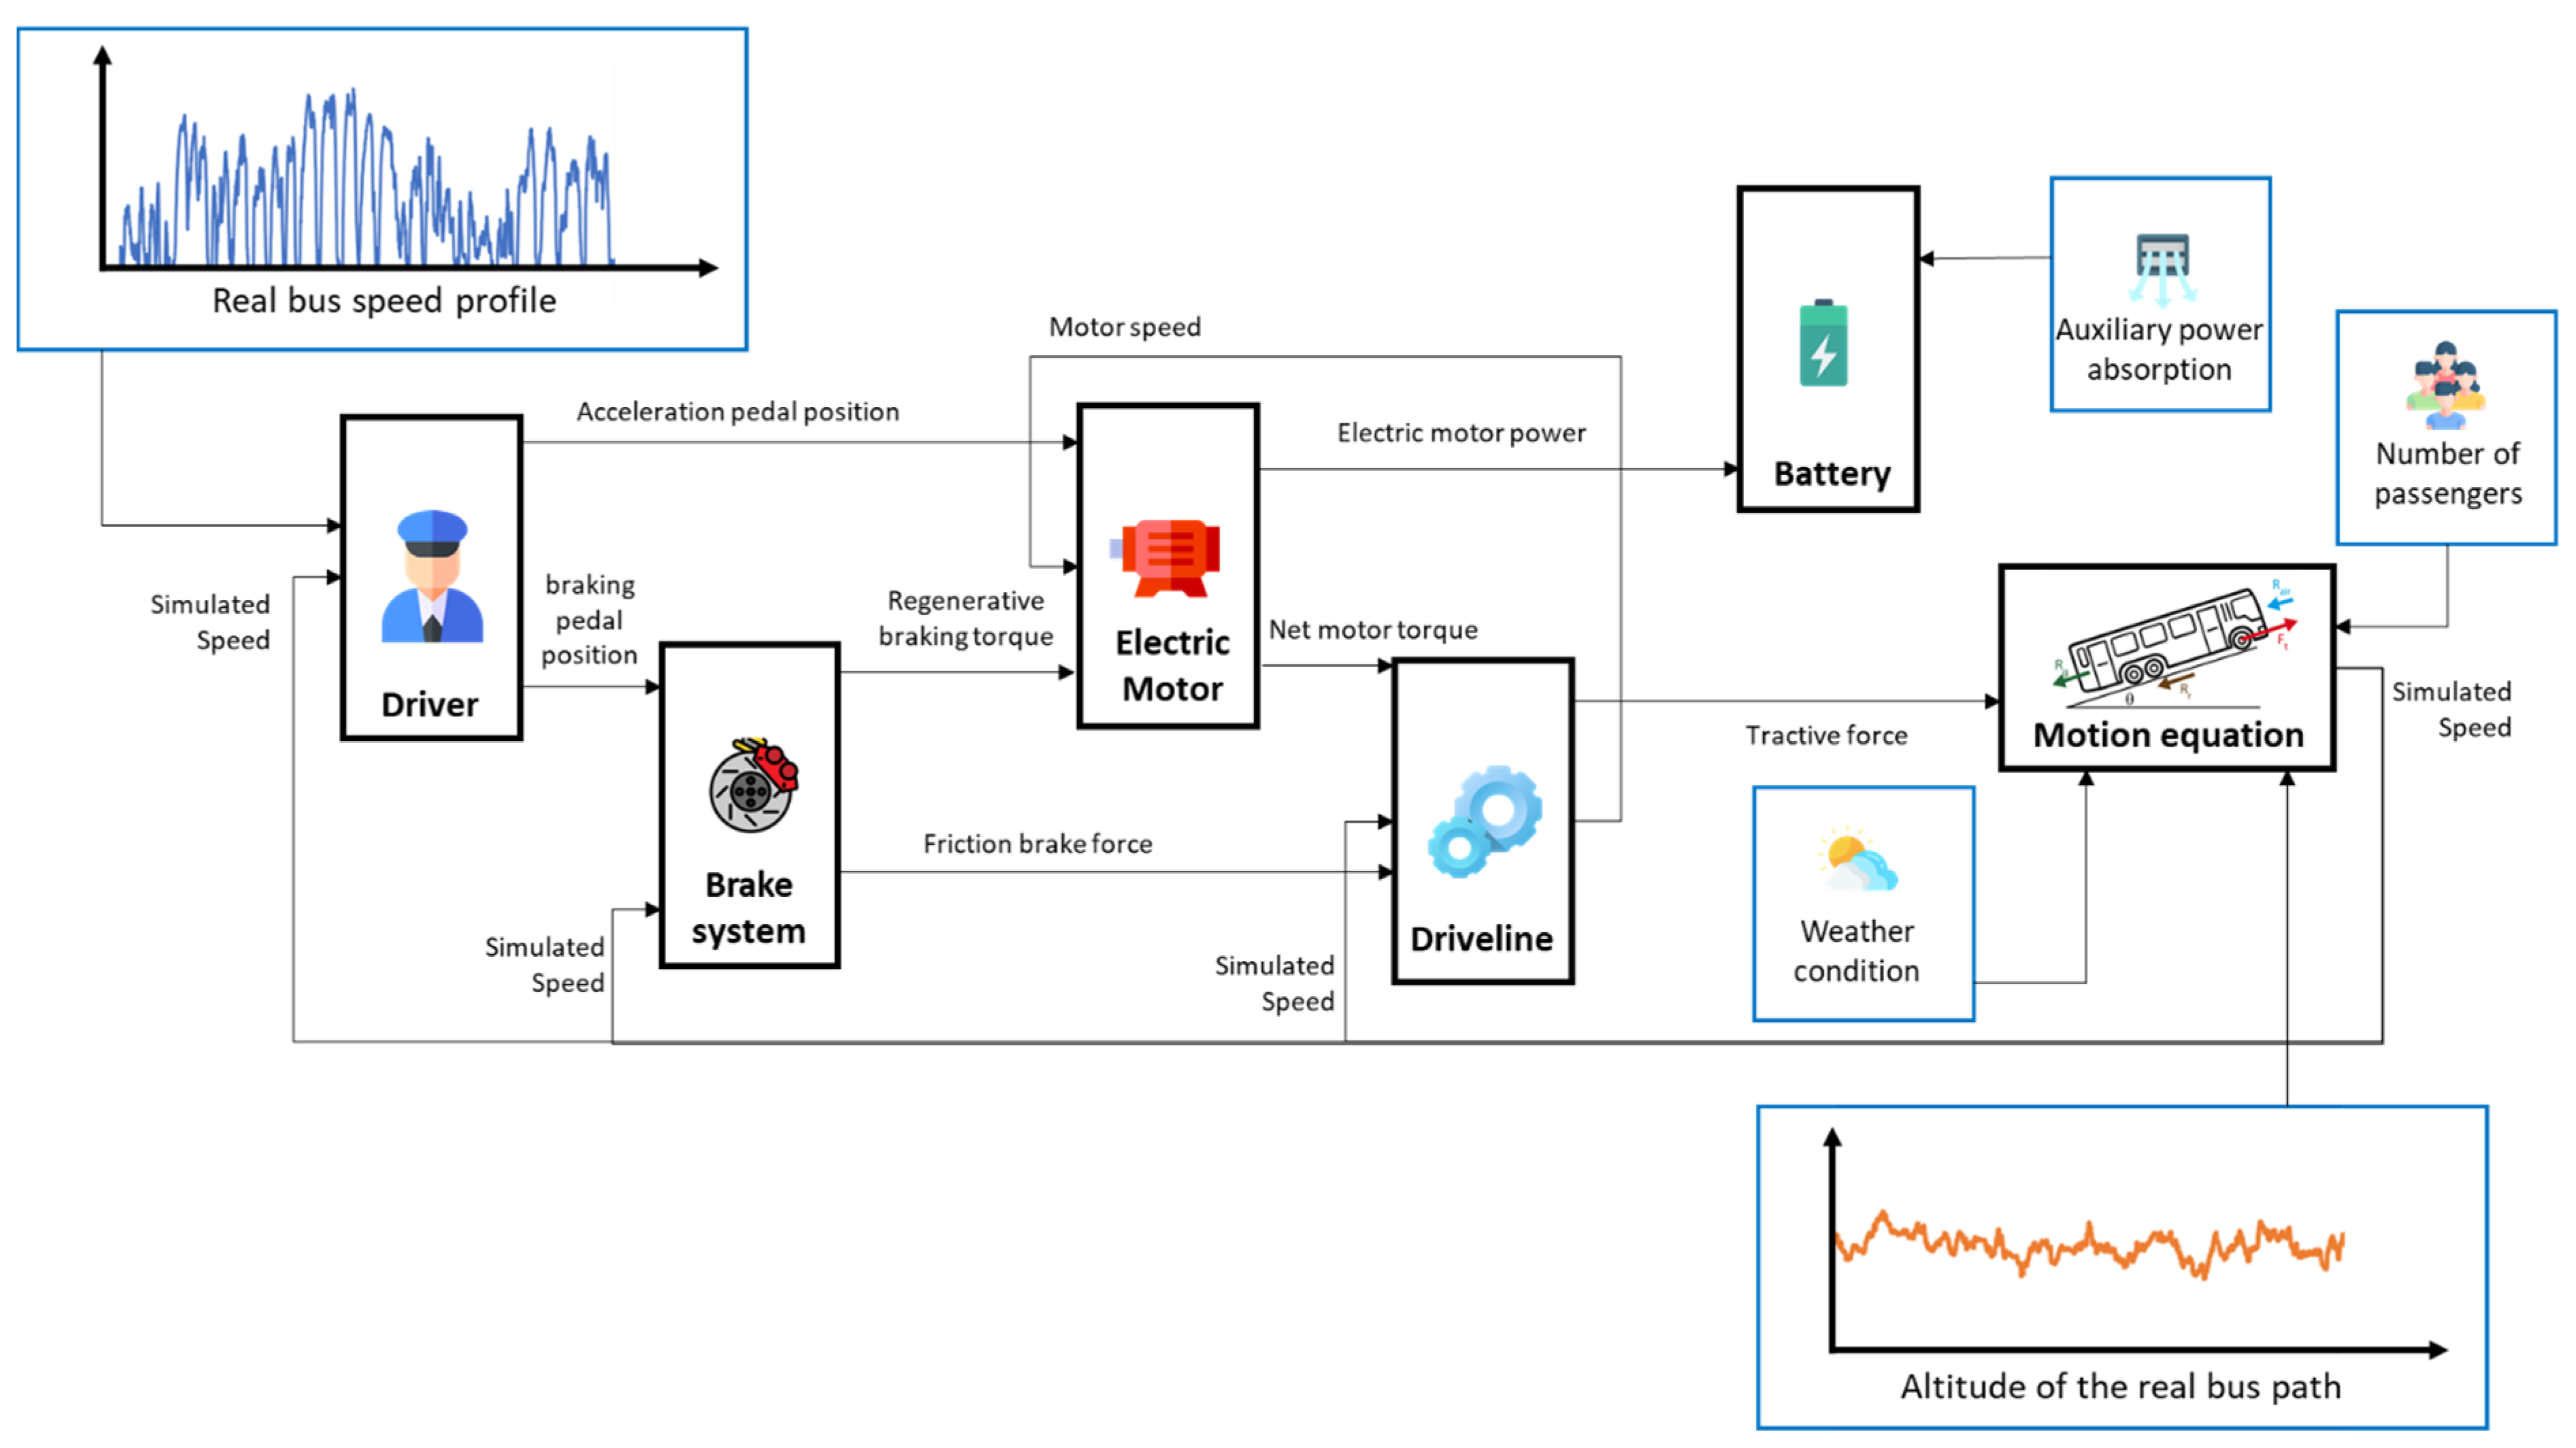
In
Figure 3, the graphic representation of the Simulink model used in the present work is reported. The model can be divided into six main blocks: the driver, the brake system, the electric motor, the battery, the driveline, and the motion equation block. The real bus speed profile is compared with the simulated speed, and the driver block works as a proportional integral derivative (PID) controller and adapts the acceleration and brake pedal position in order to follow the real bus speed profile. According to the brake pedal position the brake system block gives as an output the braking force and the regenerative braking command, respectively, to the driveline and motor blocks. As a function of technical parameters of the considered motor (peak torque, rated power) and of variables of the simulator (angular speed of the motor, position of the accelerator, regenerative braking command), the motor block calculates the motor torque and power, which are, respectively, fed to the driveline and the battery. The driveline block calculates the traction force acting on the vehicle as a function of the input motor torque, the torque spin loss, the friction braking force, and the ratio between the gear and wheel radius. As will be presented shortly, the motion equation block (according to the traction force and all of the opposing forces acting on the vehicle) calculates the simulated speed of the vehicle, which is given in a closed loop to the driver block. Finally, the battery block estimates the energy that is used by the bus considering the motor power and the auxiliary power that are needed. In the following, the blocks will be described in more detail. The main inputs of the model can be summarized into three categories: real bus operating data, assumed operating data, and rated data of the equivalent considered e-bus. Concerning the inputs relative to the real bus, the speed profile and the contextual altitude profile have been obtained by using the GPS of a smartphone Google Pixel 4a by means of the free-to-use application Phyphox [
16]. The data have been filtered and elaborated before being fed to the Simulink simulation model. Regarding the operating conditions of the real bus, several assessments were made considering weather data for the location in terms of temperature and pressure (which are used to calculate the density of the air) and the average number of passengers along the line. The main assumed operating data are the tire pressure, the auxiliary power, and the initial state of charge of the battery. On the other hand, the main rated data of the equivalent considered e-bus are the width and height (useful to determine the frontal area of the bus), the curb weight of the vehicle, the gear ratio, the tire nominal pressure and size, the drag coefficient, the maximum power and torque of the electric motor, the maximum braking force of the braking system, and the regenerative braking threshold in terms of velocity. Furthermore, rated parameters of the battery are also taken into account such as the open-circuit voltage, the rated capacity, and the internal resistance of the battery.
2.2. Brake System Block
This block represents the braking system of the e-bus. It receives as inputs the pedal position of the brake, which is transformed into a desired brake force by scaling linearly the pedal position in respect to the maximum brake force, calculated as a function of the road adhesion coefficient. The desired brake force is then split into the regenerative brake force and the friction brake force according to a specific braking factor. Moreover, the regenerative brake force can assume non-null values only for vehicle speed above a certain threshold usually in the range 10–25 km/h [
17]. Finally, the regenerative brake force is converted into a corresponding torque at the crankshaft by means of a parameter taking into account the gear ratio and the tire radius.
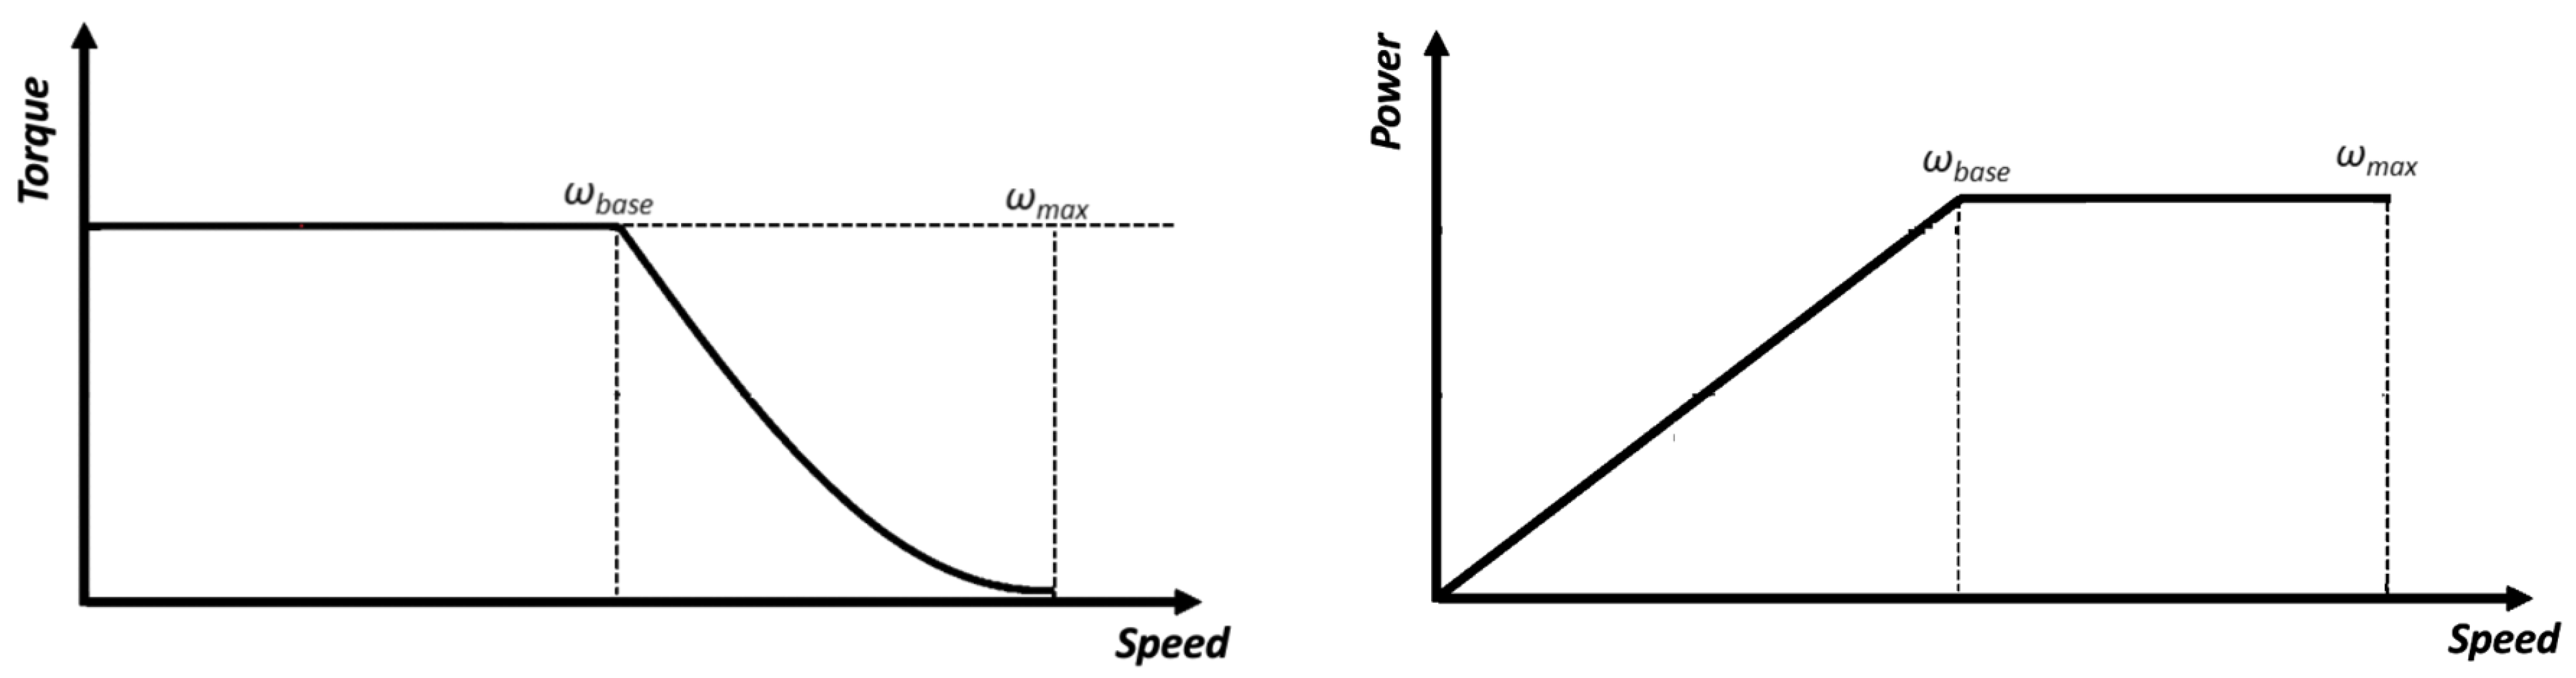
2.3. Electric Motor Block
The electric motor block receives as input from the driver block the accelerator pedal position. This signal is converted into a corresponding positive torque by linearly scaling the pedal position in respect to the minimum in each instant between the rated torque of the electric motor and the torque coming from the ratio between the rated power and the actual angular motor speed, respectively, if it is working in the constant torque region or in the constant power region, as depicted in
Figure 4.
Moreover, the allowable regenerative torque is defined in respect to the previously cited minimum according to a specific factor and then used as a lower bound to convert the regenerative brake torque at the crankshaft coming from the brake block into the actual regenerative torque, which can be developed. The next step is adding with opposite signs the accelerating torque and the regenerative torque in order to obtain for each time interval the net motor torque
, which is used to calculate the mechanical output power of the motor
by multiplying it by the angular speed of the motor. On the other hand, the electric input power of the motor
supplied by the battery is defined as a function of losses as reported in (1), where the losses are defined as in (2) as a function of the net torque of the motor, the angular speed of the motor
, and several parameters, which take into account the copper losses
, the iron losses
, the windage losses
, and constant power losses
.
During the regenerative braking phase, the mechanical power coming from the driveline is converted into electric power by the electric motor acting as a generator.
Finally, the electric motor block outputs are the electric motor power needed from the battery and the net motor torque supplied to the driveline.
2.4. Driveline Block
The driveline block receives as inputs the net motor torque from the electric motor, the friction brake force from the braking system, and the simulated speed of the vehicle. The simulated speed of the bus is converted into the angular speed of the crankshaft through the ratio between the tire radius and the gear ratio. The angular speed is then multiplied by the torque spin losses to obtain the driveline power losses. The torque spin losses are evaluated as a linear function of the rated torque of the motor and of the spin loss coefficient, which is assumed to be constant. The torque spin losses are also subtracted from the net motor torque coming from the electric motor block in order to determine the driveline torque output. The latter is then converted into the positive tractive force supplied by the driveline to the tires by means of the ratio between the tire radius and the gear ratio. The friction brake force coming from the brake system block is then subtracted from the positive tractive force to obtain the net tractive force acting on the vehicle, which is delivered to the motion equation block.
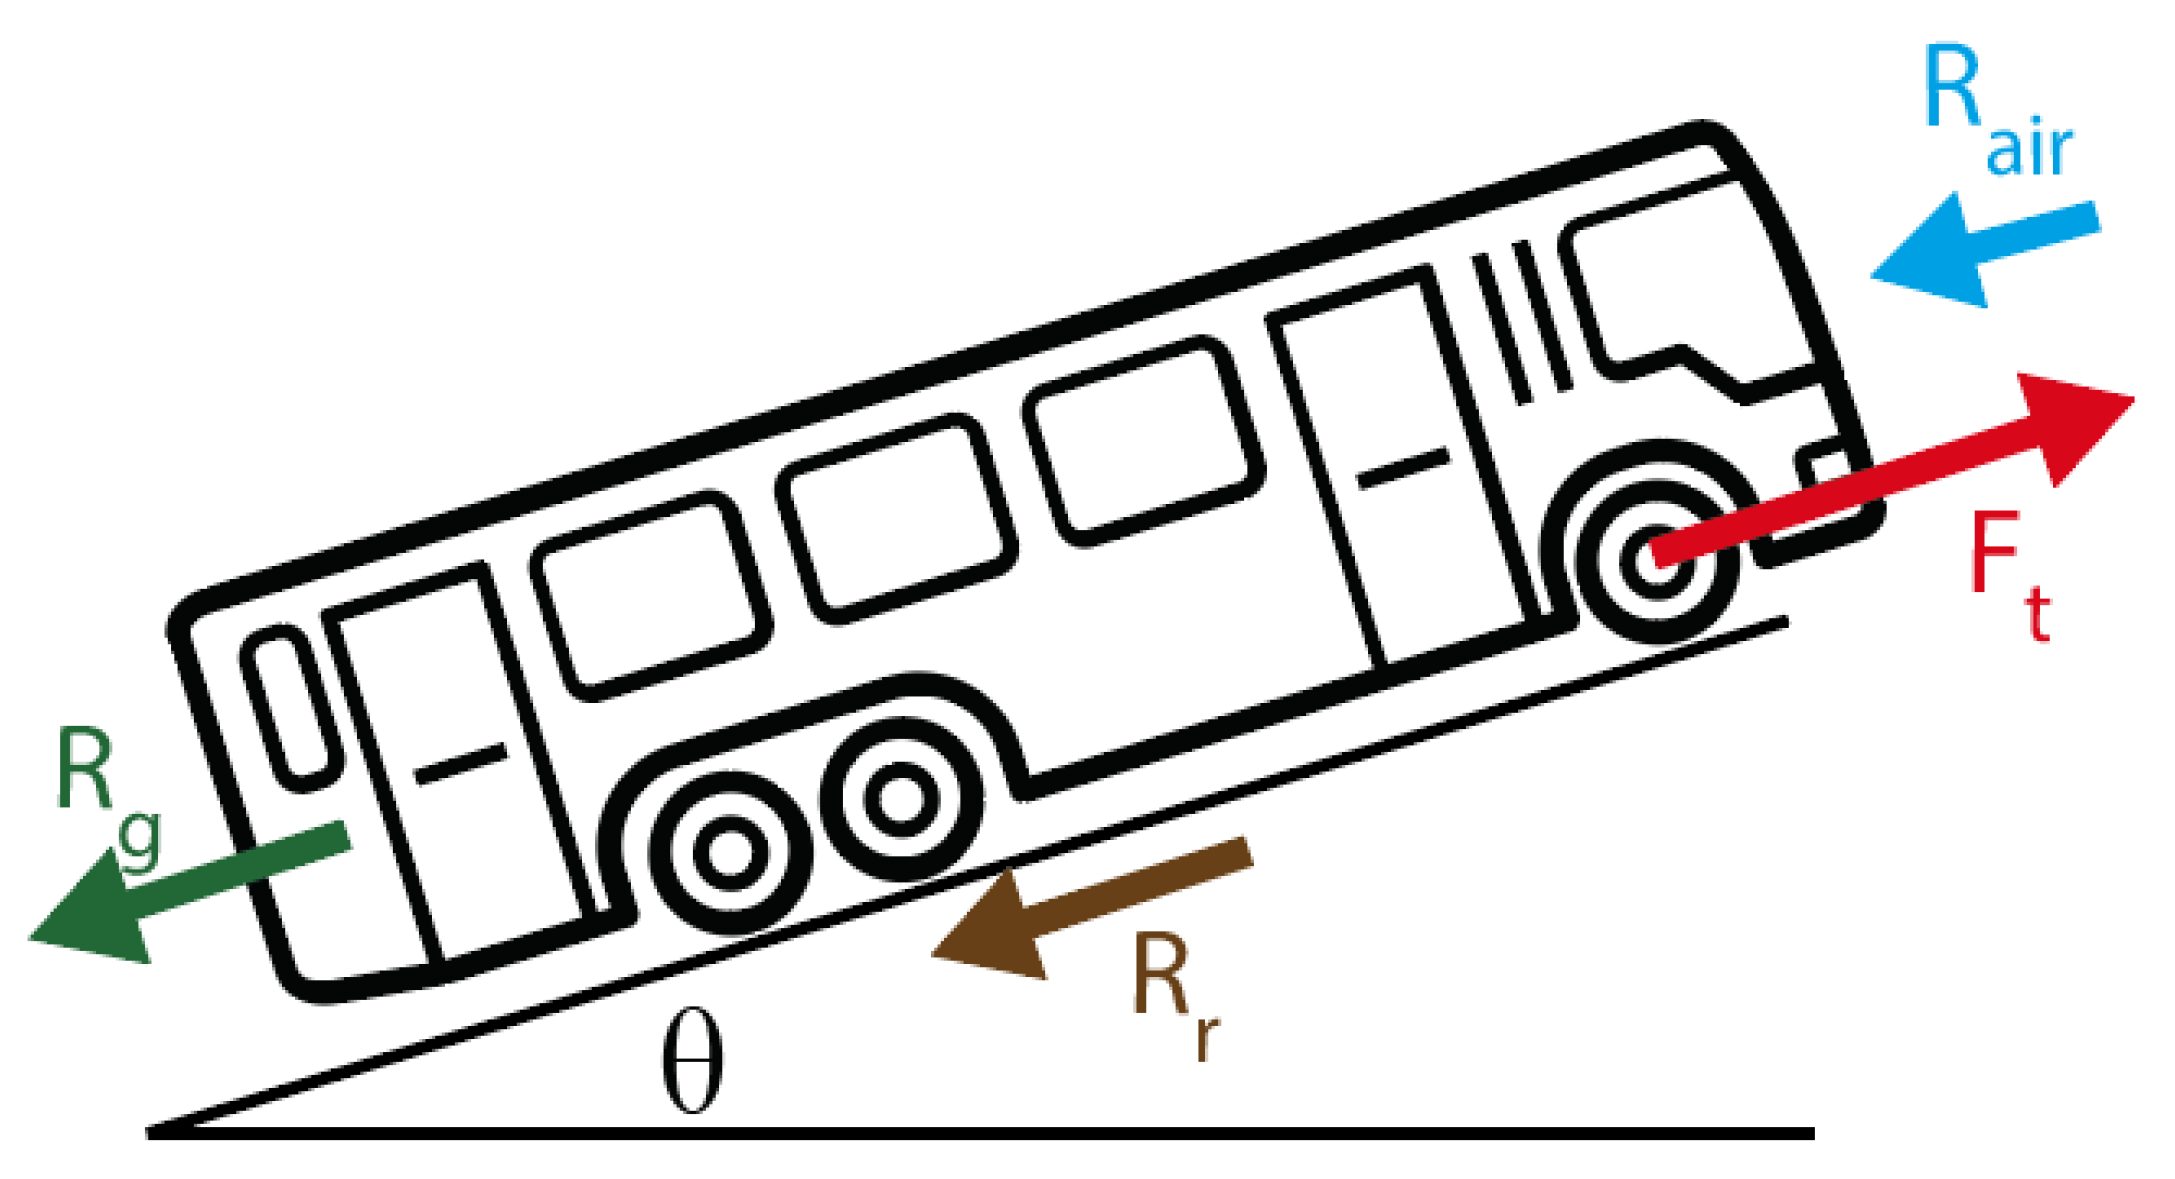
2.5. Motion Equation Block
The motion equation block receives as an input the net tractive force acting on the vehicle and compares it with the sum of resistances acting in the opposite direction on the bus. Indeed, in every second of the trip of the bus, its motion mainly depends on the following four forces (
Figure 5): the inertial force, the aerodynamic force (
), the resistance force due to the grade (
), and the rolling resistance (
) [
18].
where
is a rolling coefficient function of the pressure of the tires and of the simulated speed of the vehicle
. The rolling resistance is given by the product of the rolling resistance coefficient times the normal component of the weight force, the force perpendicular to the road on which the vehicle’s wheels are rolling; therefore, if the vehicle is running on an inclined plane, the force vertical component is defined by the product of the vehicle’s mass
, the acceleration of gravity
times the cosine of the road slope
. Concerning the aerodynamic force, it is a function of the density of the air
(which is calculated as a function of the ambient conditions), of the frontal area of the bus
, of the drag coefficient
, and of the simulated speed of the vehicle. The grade resistance is a function of the nominal mass of the vehicle plus the mass of all the onboard passengers
and of the slope of the road profile
, which is derived from the variation of the altitude profile along the line.
The inertial force related to all the rotating components inside the vehicle is instead taken into account by considering the concept of equivalent mass expressed in (6). To obtain the equivalent mass
, the static mass
(which is a function of the vehicle and the number of passengers onboard) is increased by a factor
, which varies from vehicle to vehicle.
As already mentioned, to accelerate the vehicle, the net tractive force acting on the vehicle
must exceed the sum of all the resistances, as expressed by the motion equation in (7).
The net tractive force can assume positive values, hence the vehicle is said to be in the powering mode, negative values, which means the vehicle is braking (braking mode), and finally, a nil value of the causing the vehicle’s natural deceleration (coasting mode). The motion of the vehicle is an alternation of these three phases. Exploiting (7), it is possible to calculate the acceleration of the vehicle and, consequently, its simulated speed. The latter is then supplied back to the driver, brake system, and driveline block in a closed loop.
2.6. Battery Block
The battery block receives as inputs the electric motor power needed from the electric motor and the power absorbed by the auxiliary systems. The two are summed to evaluate the total power of discharge of the battery. For the battery, the Thevenin equivalent circuit shown in
Figure 6 is considered. Therefore, the battery is represented by an ideal voltage source defined as the open-circuit voltage
in series with the resistance
, which represents the internal resistance of the battery. According to the Thevenin equivalent circuit, assuming constant no-load voltage, battery losses will vary with the current depending on the total power consumed by the electric motor. Therefore, battery losses can be expected to be lower if the total power consumed by the engine is reduced.
According to (8), the real discharge power of the battery is equal to the ideal discharge power net of the losses linked to the internal resistance of the battery.
from which it is possible to retrieve the discharge current (9).
Knowing the discharge current against time, it is possible to evaluate the state of charge (SOC) of the battery (10) as a function of the rated energy content of the battery
measured in kWh. The SOC provides the current battery status. It is expressed in percentage values, where 0% indicates that the battery is completely discharged and 100% indicates a full charge.
At this point, the energy average consumption of the e-bus
measured in kWh/km can be calculated according to (11) as a function of the initial amount of energy inside the battery
and the overall traveled distance in km
.
As a consequence, the consumption of the e-bus can be simulated along its route, giving the possibility to draw several significant considerations on the more proper charging system infrastructure for each considered case study, as will be shown in more detail in
Section 3 and
Section 4.
4. Charging System
An electric bus fleet can rely on two main charging systems: overnight and opportunity charging. Their representation is sketched in
Figure 14. Overnight charging systems, as the name suggests, aim to charge the fleets of buses during the night at the depot with plug-in connectors and charging power for each connector from 40 up to 150 kW. The output power mainly depends on whether an AC or DC charging system is installed. In the case of an AC charging system, the onboard charger of the bus is employed to perform the AC-DC conversion, and the offboard structure only includes power and communication cables, metering, and protection devices. The AC charging system (mode 3) allows maximum power up to about 43 kW (86 kW if two Type2 plugs are used). If, instead, higher charging powers are required or the electric buses do not dispose of the onboard charger, a DC charging system is necessary (mode 4), which means that the conversion stage is now performed offboard the vehicle inside the charging system, and therefore, the infrastructure capital costs are higher. In this case, the power limit is imposed by the cable and the connector; as a matter of fact, the Combo 2 (CCS2) connector allows us to reach 200 A without the need for special liquid cooling systems. Normally, in order not to increase the power required too much from the public distribution network, the output current is limited to 150 A, which corresponds to a nominal power of about 100 kW considering the typical voltage values of the batteries of the actual electric buses on the market. It may happen that, to complete the service without weighing down the vehicle too much with larger batteries, electric buses require additional daytime recharges or occasional recharges that take advantage of the halt times at the terminus and/or at the stops; this bus charging system takes the name of opportunity charging. The opportunity charging system employs overhead pantographs, which can support charging powers up to 600 ÷ 750 kW. Given the high power required, the connection to the electricity grid cannot take place directly from the low voltage distribution but must take place from the medium voltage distribution.
In this paragraph, the aim is to find out the location and the size of the two abovementioned charging systems, which assure a correct operation of the bus line without degrading the service.
The most important data necessary in addition to the vehicle characteristics, to display the analysis, are the total energy consumption on the entire line, the number of round trips each bus of the line performs, and the stopping time at each terminal station.
Battery performances, in particular rated power and capacity, degrade over time due to multiple aging mechanisms. Battery aging can be divided into calendar and cycling aging. Calendar aging includes all the processes that lead to a degradation of the battery cell occurring while the battery is at rest. In recent lithium-ion batteries, the main aging mechanism impacting on calendar aging is the solid electrolyte interphase (SEI) formation on the negative electrode [
33].
Cycling aging, instead, is related to the use of the battery and its severity mainly depends on charging/discharging current rates, cycle depths, and battery temperature. Therefore, in this field, the persistent use of high charging powers related to the opportunity charging system could significantly increase the impact of this side effect. However, given the high battery capacity of the electric buses considered, the C-rate does not exceed the common and suggested value of 1C. Therefore, the aging effect of the charging systems considered in this study is neglected.
The negative effects of the battery aging on the energy capacity have been taken into account by selecting a higher minimum SOC with respect to the one suggested by the manufacturer.
Following the indications of Line M-120 timetable [
34], it can be deduced that in order to cover all the scheduled trips, three buses are necessary for the peak time slot in the weekdays (four if we also consider the bus necessary to cover the direct service of line M-120D); this number decreases to two on Saturday and to one on Sunday. At the weekend, the direct service is not provided.
4.1. Opportunity Charging
Given the fast pace of the timetable and the length of the considered line, the installation of opportunity charging systems becomes necessary.
The overall timetable of line M-120 is divided into the planning timetables of the three necessary buses as shown in
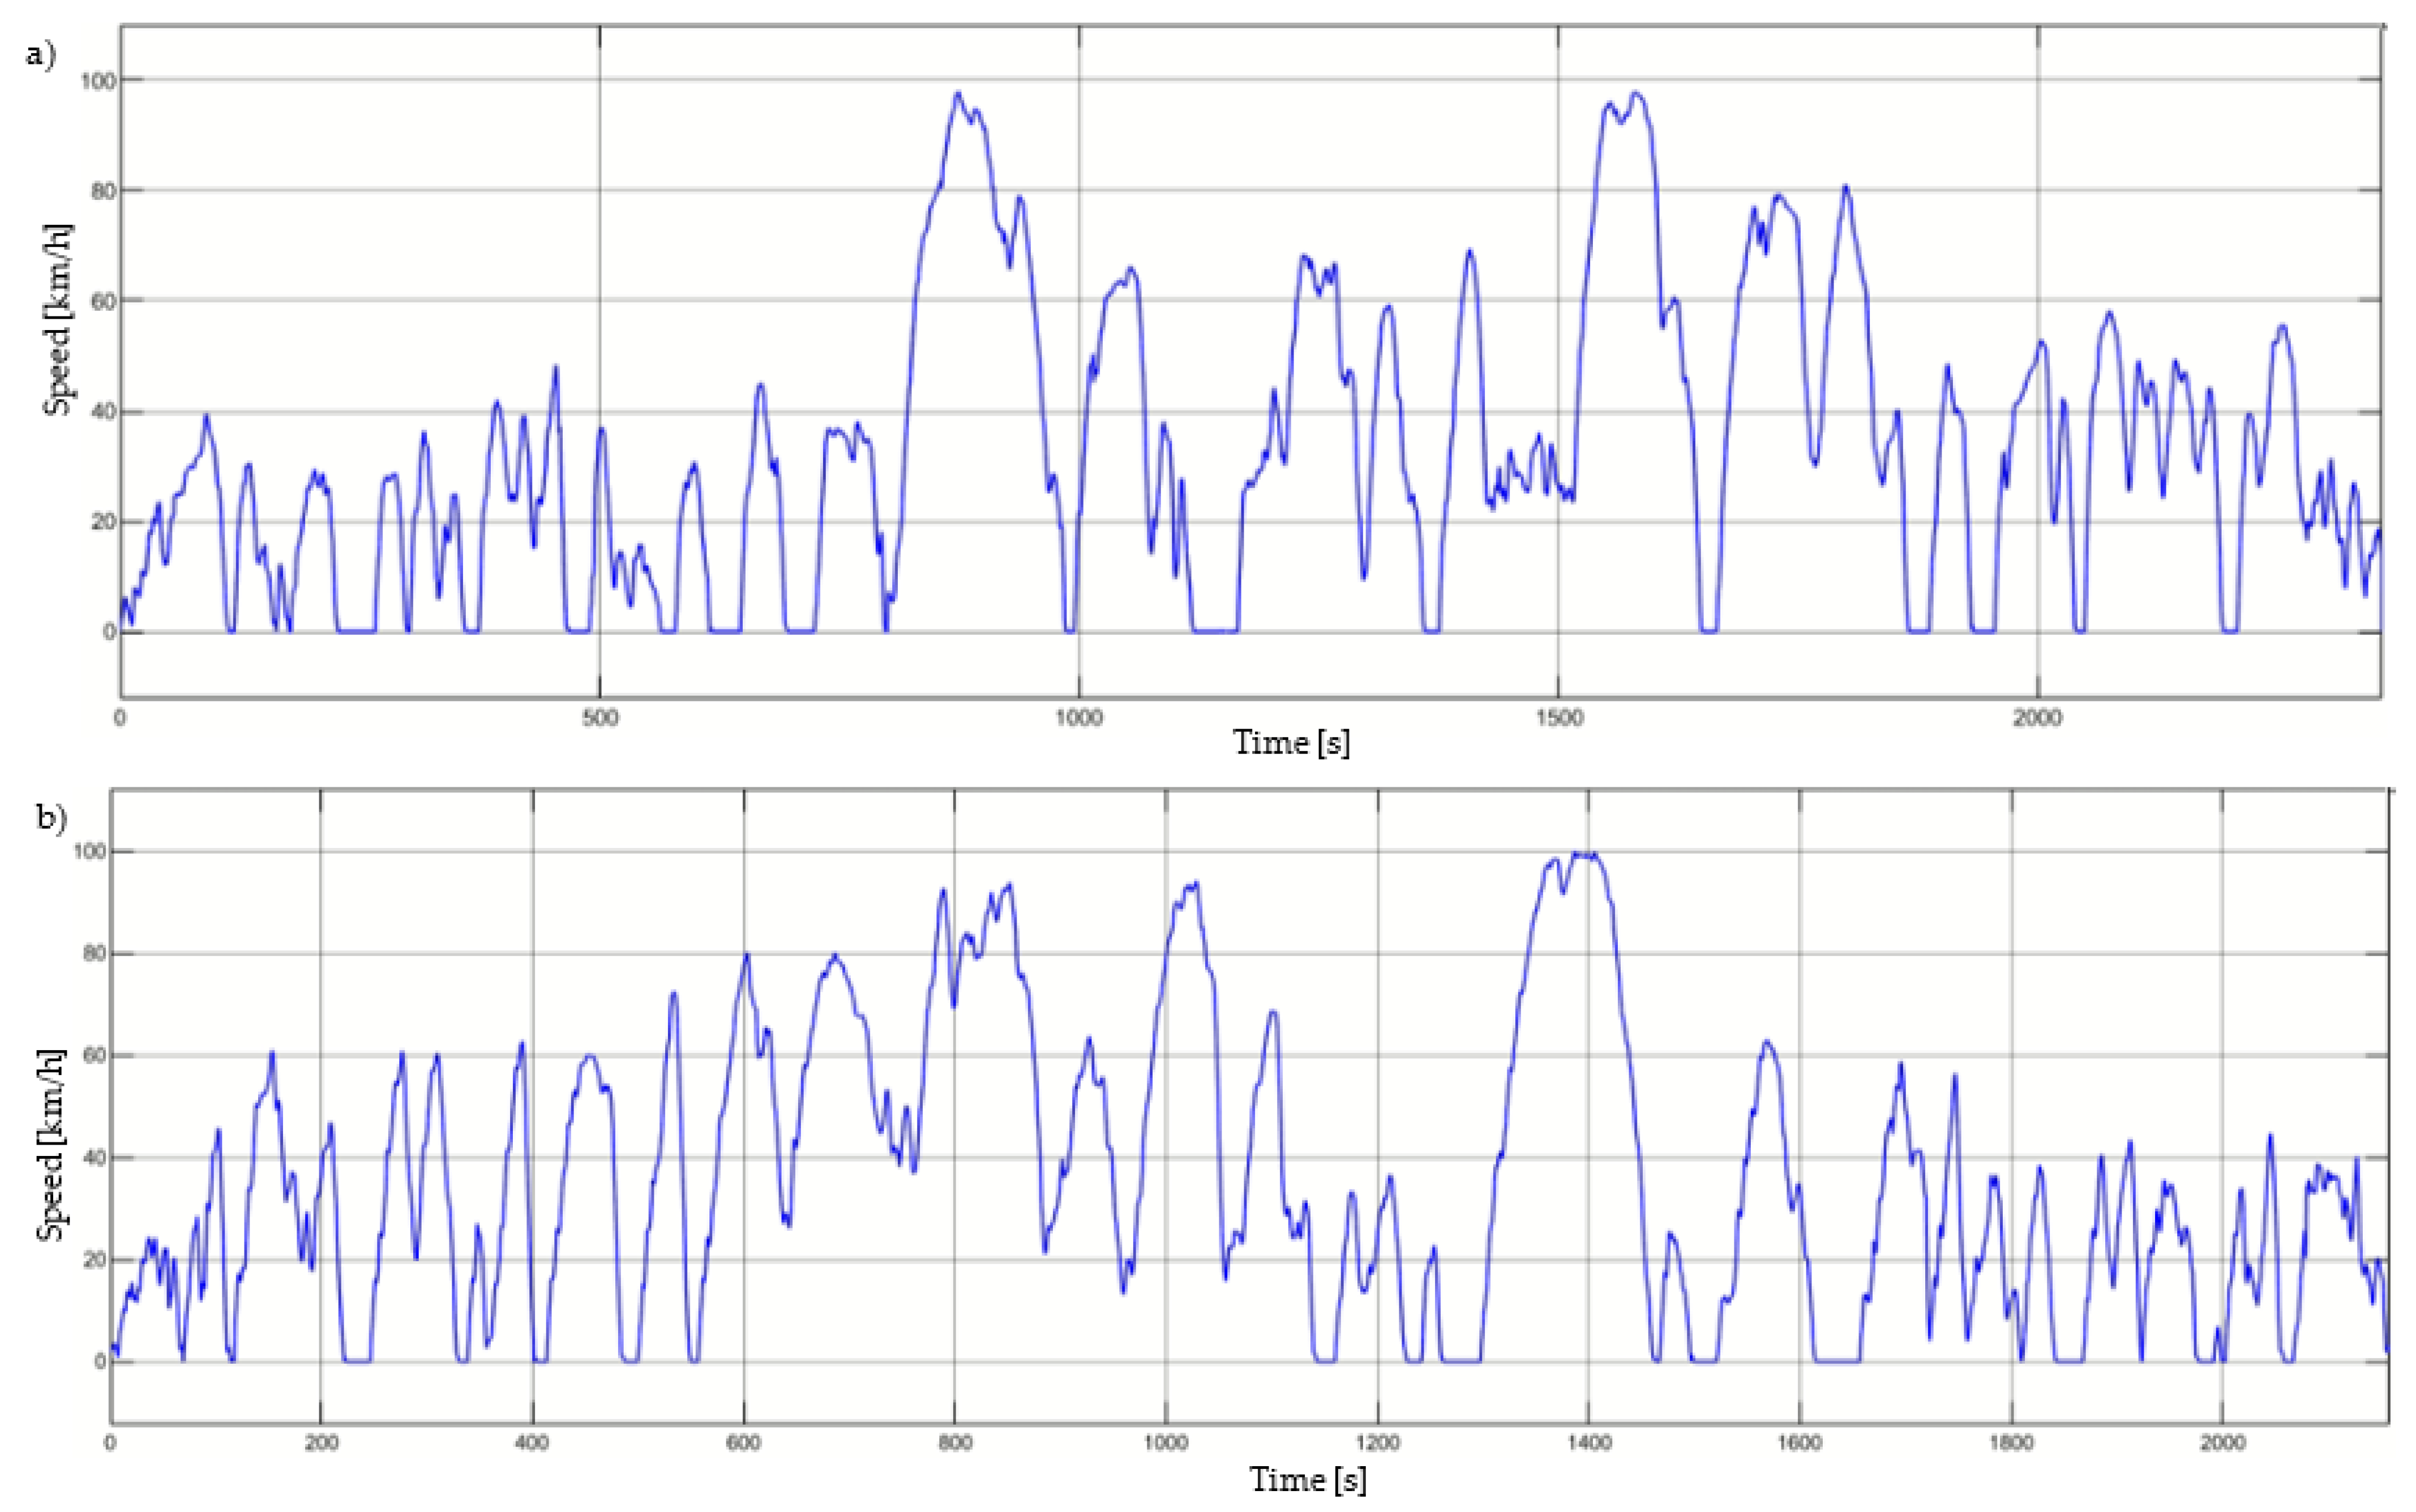
Figure 15. As can be seen, the scheduled duration of the trip is 45 min, and according to the reported timetable, the bus immediately starts another trip as it arrives at one of the terminals. However, the real case is that the trip between Algeciras and La Linea always lasts less than 45 min; as a matter of fact, in all the measured runs (three round trips and, hence, six single runs) the running time was between 36 ÷ 40 min. This implies a stopping time at the two terminals, which range between 5 up to 10 min. This period is indeed necessary also for the offboarding and onboarding process of the passengers and to apply the opportunity charging.
To size the charging system necessary to electrify a bus line, the worst-case scenario must be considered so that the service is correctly provided also in the most disadvantageous case. In our study, this scenario is verified when the auxiliaries absorb the maximum power of 27.5 kW, leading in this way to a consumption (considering on average 22 passengers on the bus) of 2.405 kWh per km for the trip from Algeciras to La Linea and of 2.522 for the return one (for the normal service and not the direct one).
Different solutions for the opportunity charging systems have been simulated and the obtained results are described in the following. However, in the proposals for the opportunity charging system, the technical limits mentioned by the manufacturer must be considered, and according to the datasheet of the chosen electric bus, a maximum charging power of 450kW is allowed. Moreover, a recommended maximum depth of discharge for a lithium-ion battery is usually about 80% and an additional safety margin of 10% must be considered in order to allow the bus to return to the depot at any moment in case of an emergency and to deal with the decrease in energy capacity over time due to battery aging. Therefore, a minimum SOC of 30% must be always guaranteed.
Finally, if the electric bus stops at the Algeciras terminal for a time interval long enough to be recharged with the overnight charging system, then this charging solution will be preferred. This situation occurs for both Buses 2 and 3 in the intervals 15:30–18:30 h and 12:30–14:30, respectively. Therefore, in these time intervals, the electric buses are connected to the charging system installed for the overnight charging, which is usually rated at 43 kW AC, instead of to the opportunity charger.
4.1.1. One Opportunity Charger of 450 kW
The first solution reckons on the installation of just one opportunity charger (Opp Charger) with a rated power of 450 kW installed in the San Bernardo bus station. In
Figure 16, the SOC of the three buses with this charging solution is displayed. As can be noticed, even if this is the best solution in terms of cost, it does not allow for the correct operation of the service, since both the SOC of Bus 1 and Bus 3 fall below the safe limit margin of 30%.
4.1.2. Two Opportunity Chargers of 300 kW
The second solution foresees the installation of two opportunity chargers of 300 kW, one in each of the two terminals. In this case, as shown in
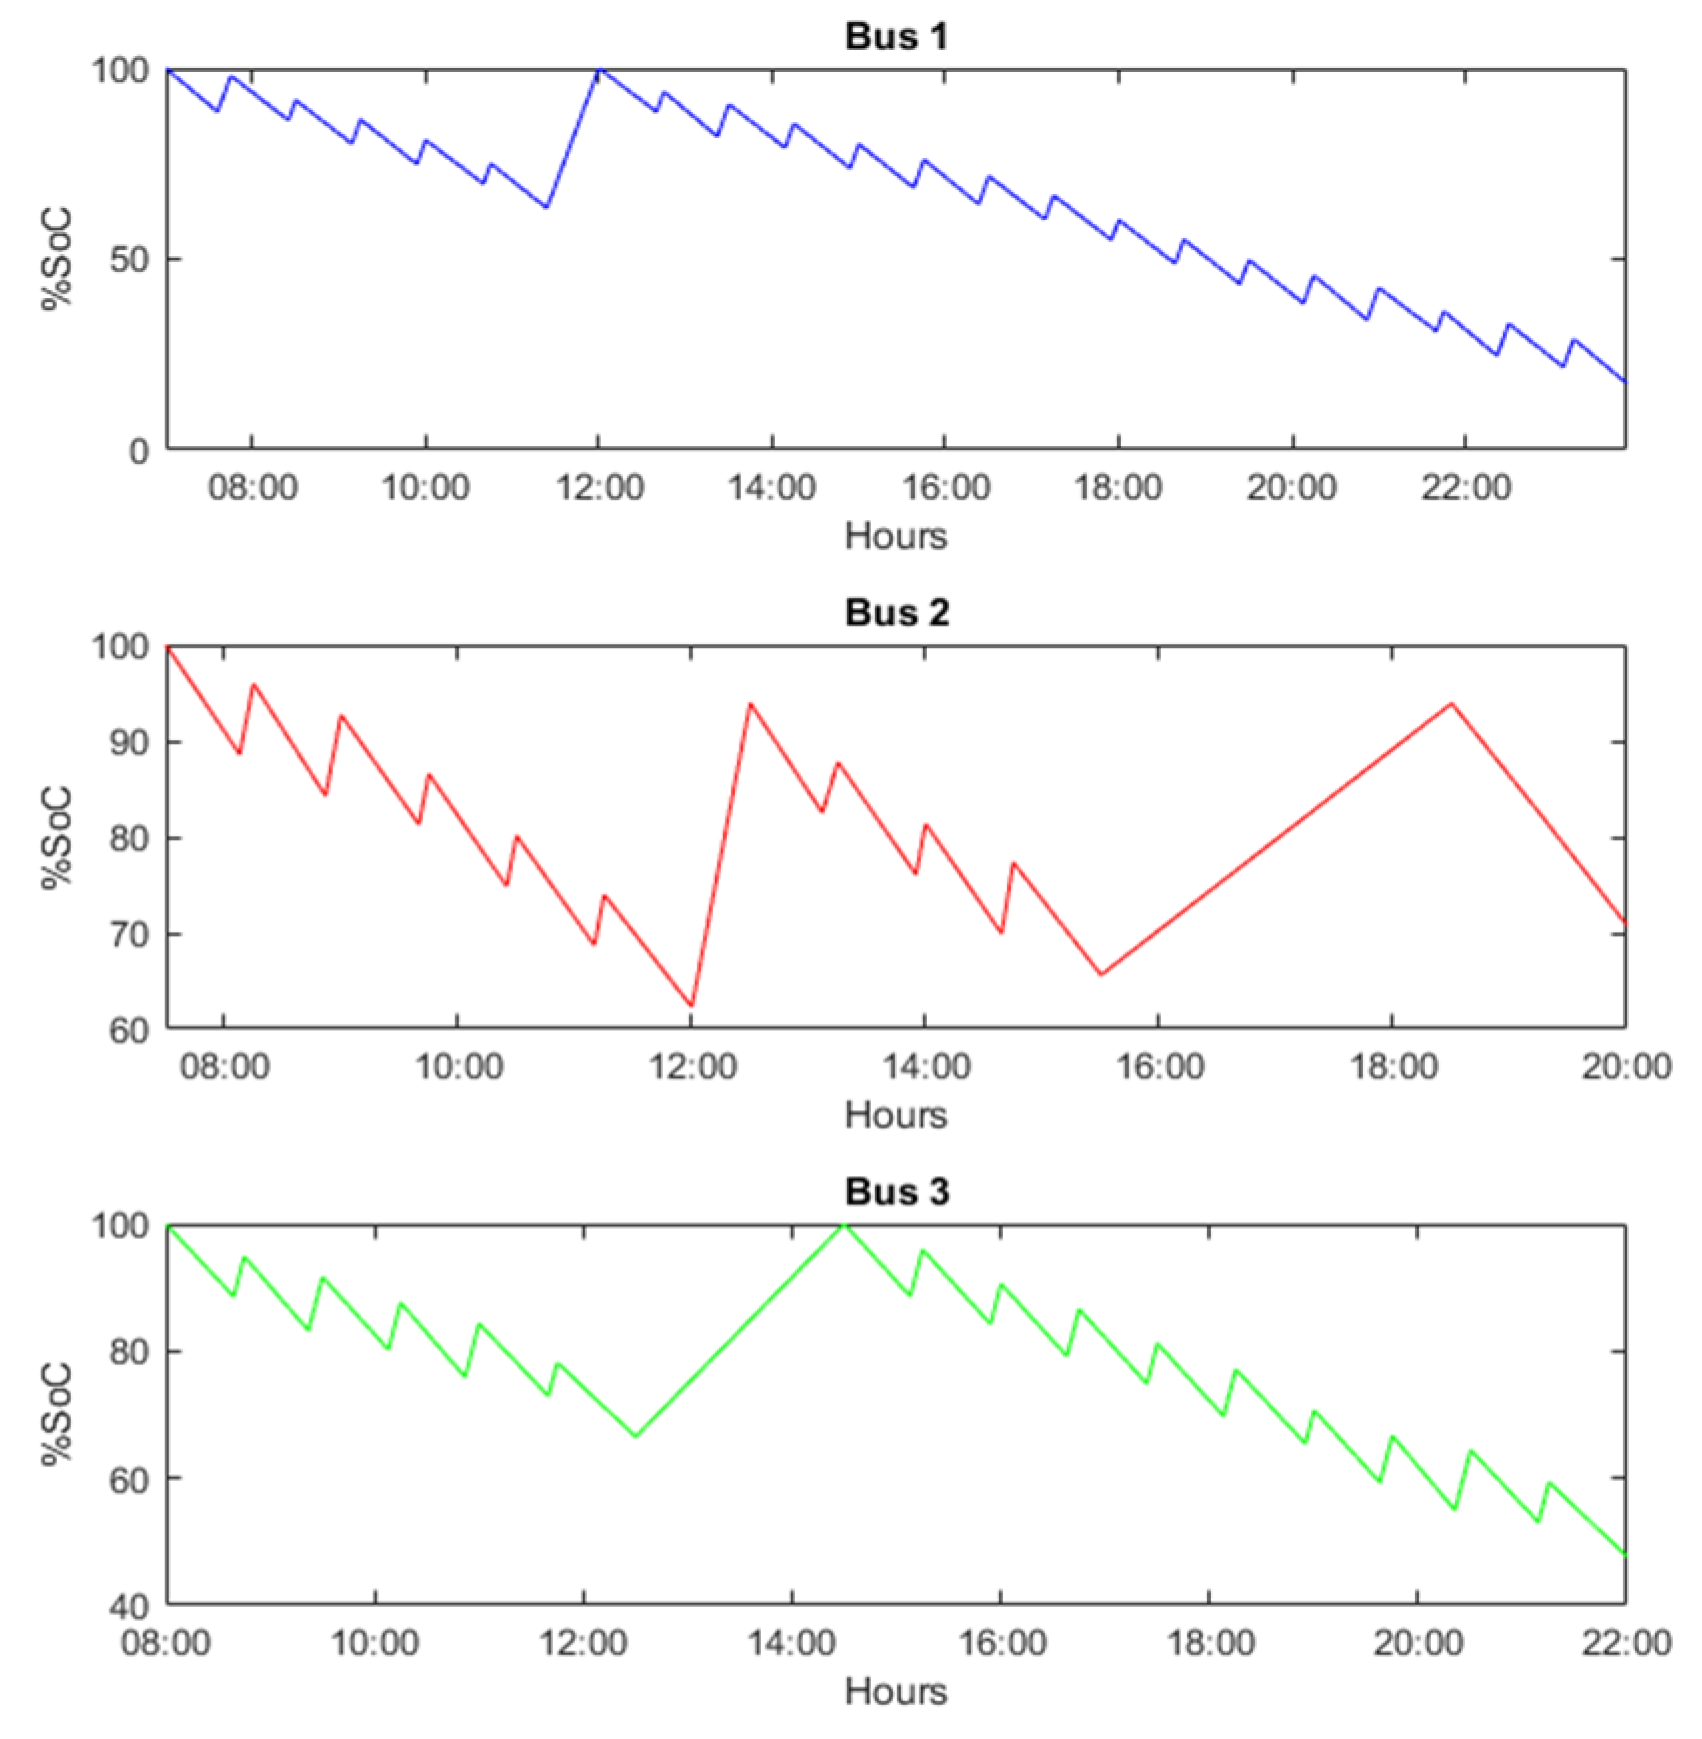
Figure 17, the only critical situation is that of Bus 1 whose SOC, about 21:30–22 h, decreases under the limit of 30%. However, this aspect could be solved by performing a switch of buses between Buses 1 and 2 to perform the last two round trips at 21 h and 22:30 h. Indeed, Bus 2 ends the operation at 20 h with 70% of SOC. It could be recharged in the time interval 20–21 h using the depot charging system and, then, picked back to perform the last two round trips instead of Bus 1, which, hence, will return to the depot at about 09:00 PM with a SOC of 34%.
With this solution, the maximum DOD is reached by Bus 1 at the end of its daily operation. Nevertheless, since the bus recharged approximately at the end of each trip, along the day, the SOC variations have small entity. This fact helps to prolong the battery life; as a matter of fact, the smaller the discharge (low DoD), the longer the battery will last. The situation is even better for Buses 2 and 3; their SOC varies throughout the day in the range 65–95% and 50–100%, respectively.
4.1.3. Two Opportunity Chargers of 350 kW
In this last case, the rating power of the two Opp Chargers is increased at 350 kW. The SOC of the three buses along the day, recharged according to this solution, is reported in
Figure 18. As can be seen, in all three cases, the SOC always remains higher than the limit, and no buses switch is necessary.
The maximum DOD in this case is always achieved by Bus 1 at the end of its daily operation, and it does not differ so much from the previous case. Instead, for the other two buses, the situation is slightly meliorate with respect to the previous case; their maximum DOD is 30% and 45%, respectively.
For the service on Sunday, currently, only one bus is employed continuously during the day. However, in the case of an electric bus fleet, the best solution will be the exchange of the bus with another one of the three every time its battery is almost near the threshold value. Therefore, in this way, all three (four considering that of the direct line service) buses will be used along the day, and they will not rely on the opportunity charging system.
4.2. Depot Charging
The buses of Line M-120 start and finish their operation at the depot San Bernardo in Algeciras. Therefore, the overnight charging infrastructure must be installed in this location.
To size the depot charging system, the most critical case is the operation during weekdays, since in this period, three buses are employed (the fourth bus of line M-120D runs only twice). In
Table 5, the arrival times and SOC of the buses are reported along with the departing times on the following morning.
If we assume to employ an AC 43 kW charging system, the necessary times to recharge each of the three buses are computed through (12), where
is the energy capacity of the battery,
is the final SOC with which the bus ends the daily operation and arrives at the bus depot (this value is taken from
Table 5),
is the charging power, and finally,
is the efficiency if the charging system. They result in 7 h, 2.5 h, and 4.6 h for Buses 1, 2, and 3, respectively.
Therefore, by overlapping recharging time with the stopping time of the three buses during the night, it can be concluded that the two AC charging poles of 43 kW are enough to recharge all the buses before their first run of the morning. In particular, one charging station is used by the second bus from 20 h up to about 22.30 h, then, from midnight, it will be dedicated to Bus 1. Finally, the second charging pole during the night will recharge Bus 3, and hence, all the vehicles will be able to start the operation with a full battery.
4.3. Future Expansion
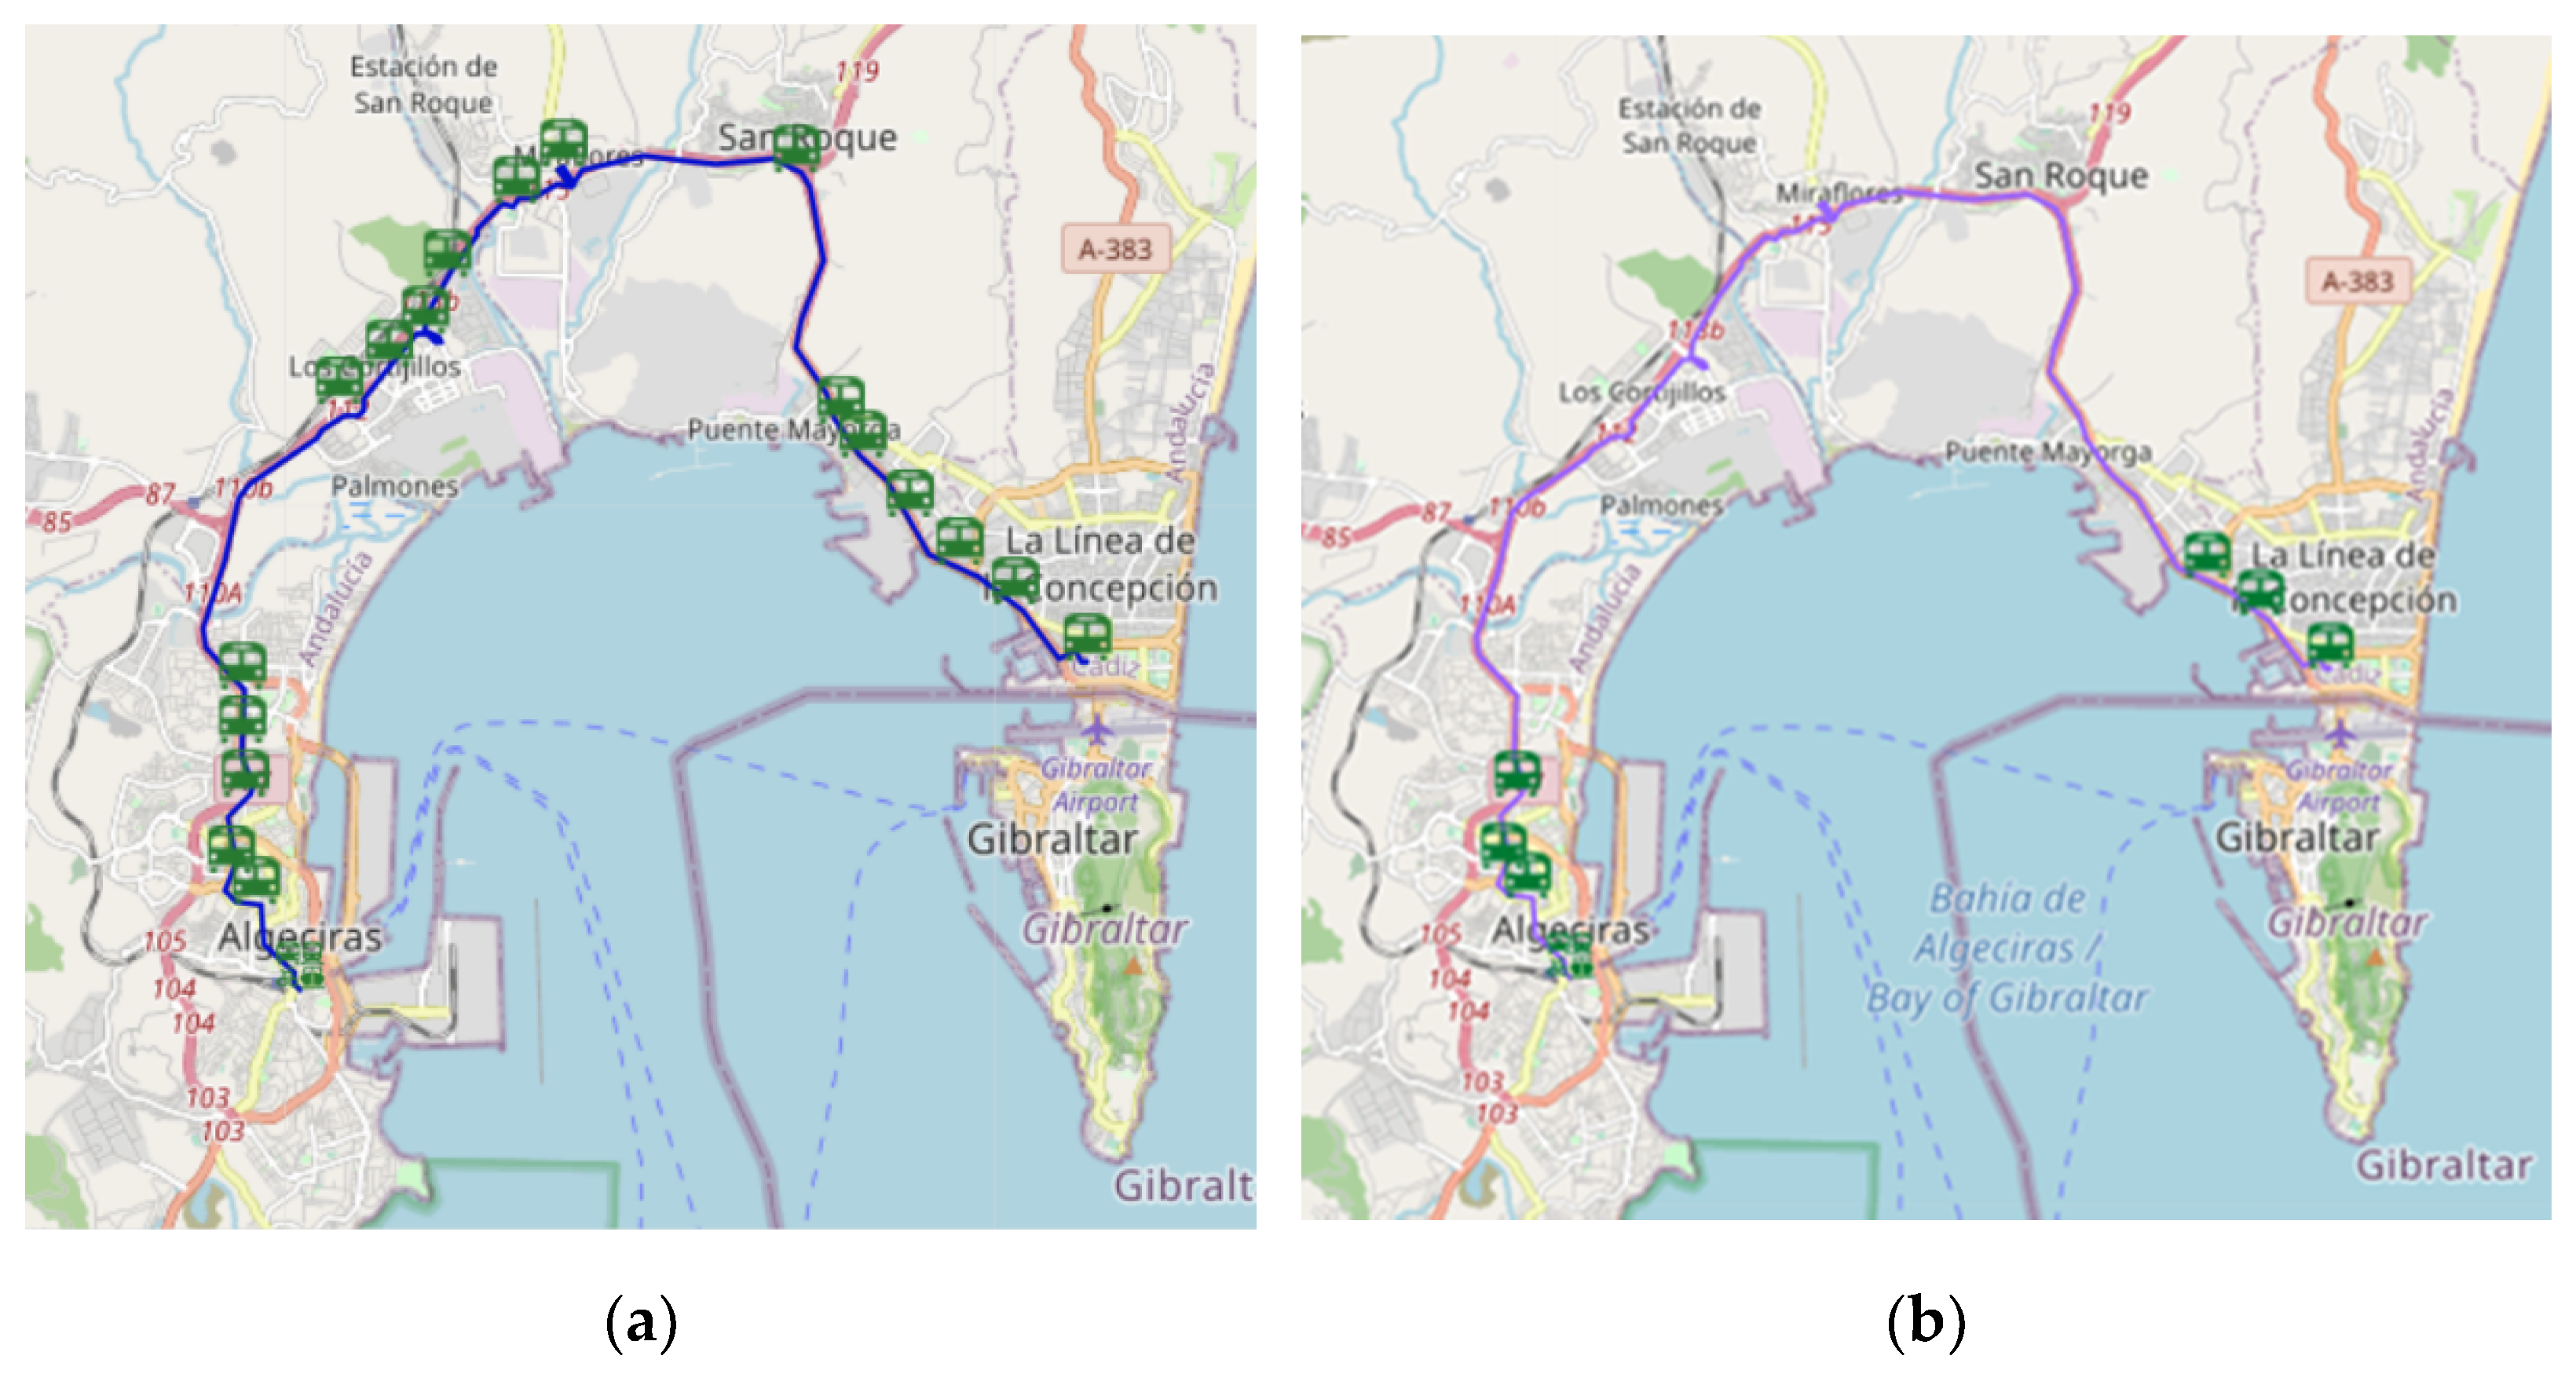
The installation of the charging infrastructure necessary for the electrification of line M-120 could represent a good starting point for the electrification of other lines, which start or end the operation in the analyzed terminals. For instance, line M-121, which connects La Linea to Los Barrios could take advantage of the opportunity charger installed in La Linea bus station. This line, whose route is 23 km long and is represented in
Figure 19a), is operating from Monday to Friday with the schedule reported in
Figure 19b).
Since the covered path overlaps with that of Line M-120 for most of the travel time and the bus model currently employed is the same, the energy consumption calculated for line M-120 of 2.522 kWh/km is used also for this line. Therefore, it results that to compute a round trip, the bus will consume about 116 kWh. Given the low number of runs the bus of this line must cover, its electrification would be possible even by using only the Opp Charger installed in La Linea, just ensuring that its charging time does not overlap those of line M-120.
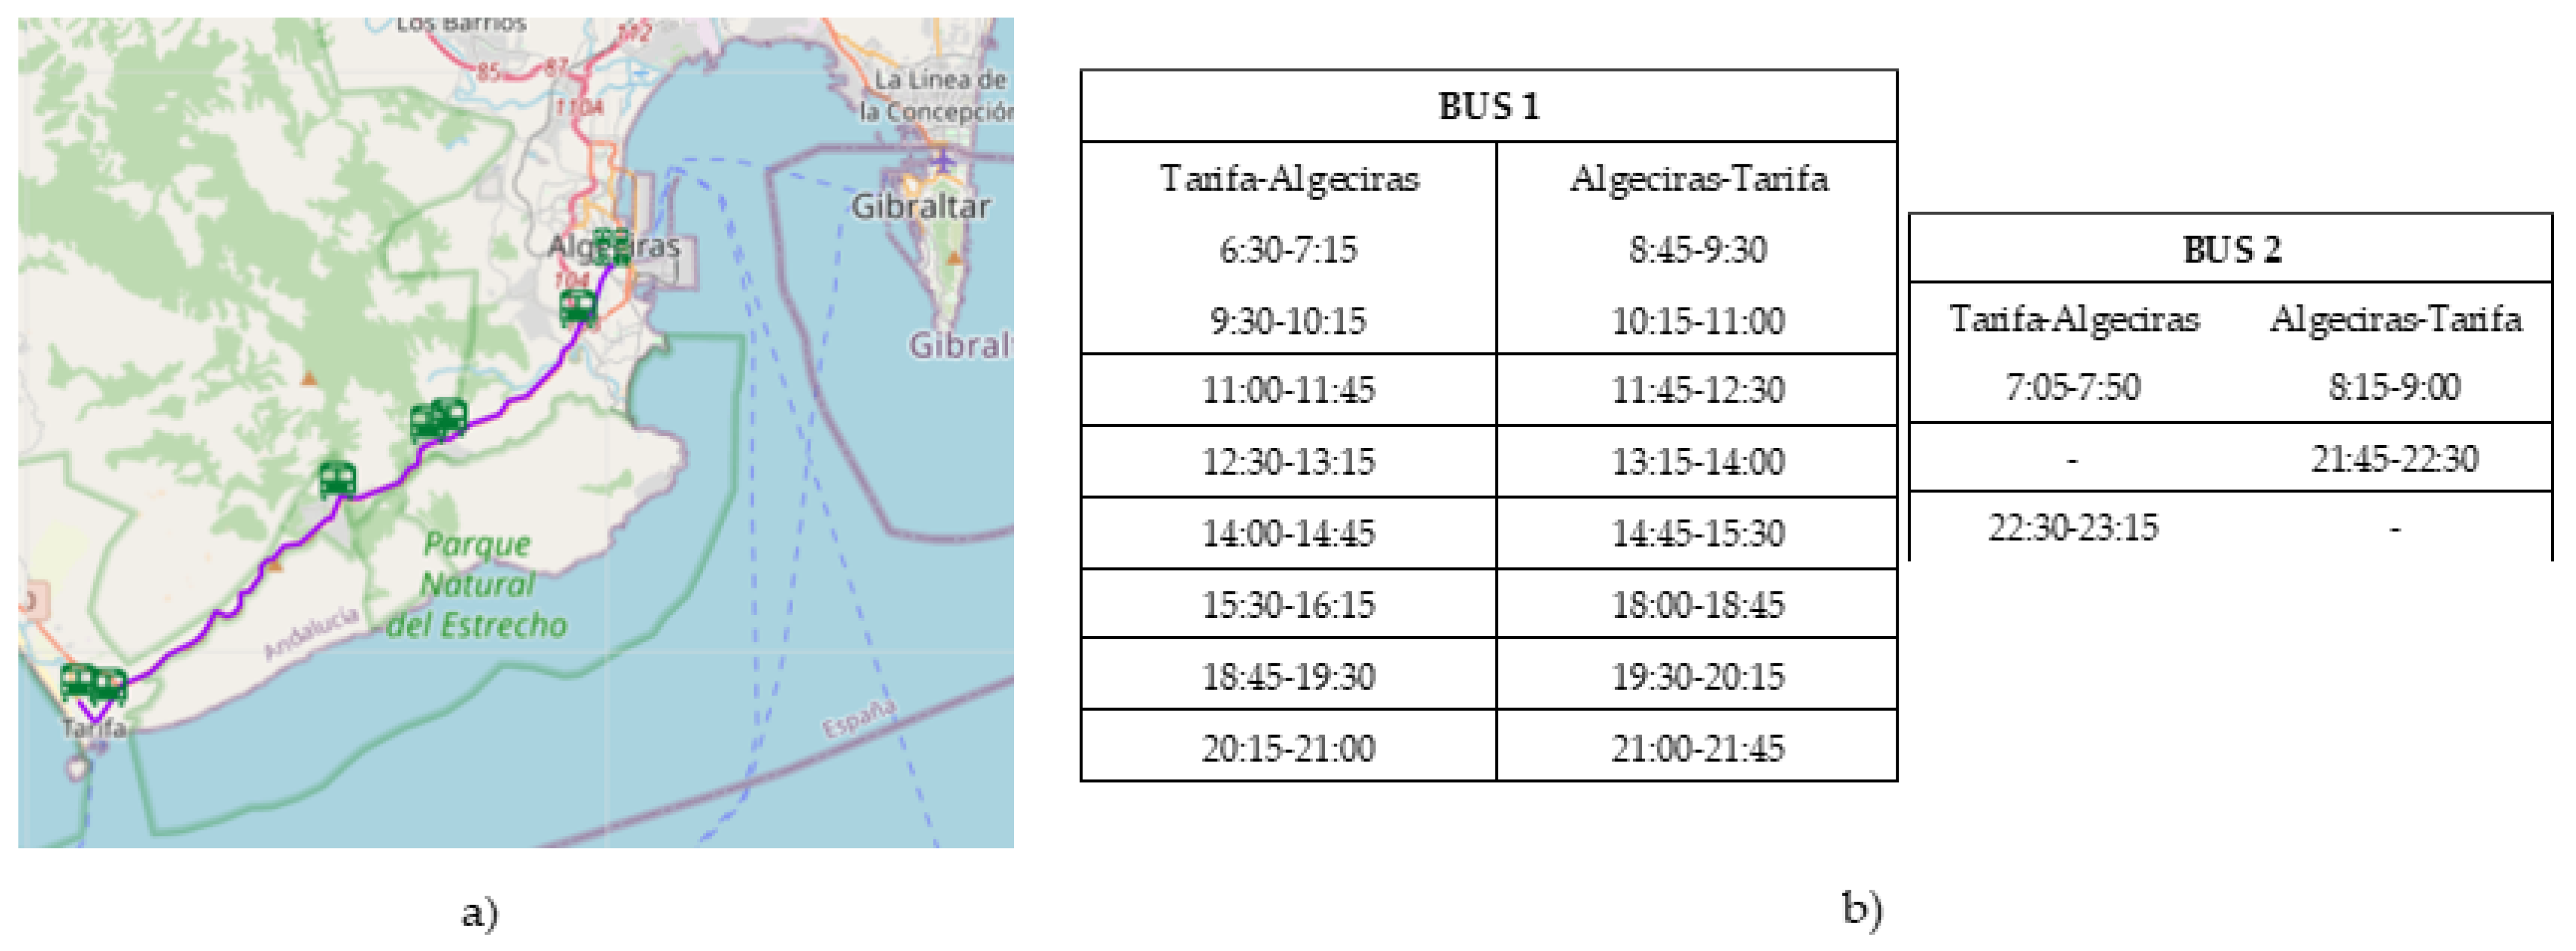
Another line that could effectively benefit from the charging infrastructure installed in the bus station of Algeciras is line M-150, which connects Algeciras to Tarifa for an overall length of 21 km. The covered path and the timetable of the two buses necessary to provide the service are reported in
Figure 20a,b, respectively. As for Line M-120, the official duration of the trip is set at 45 min; however, the real run lasts less as measured during the real tests. In particular, it has never exceeded 40 min.
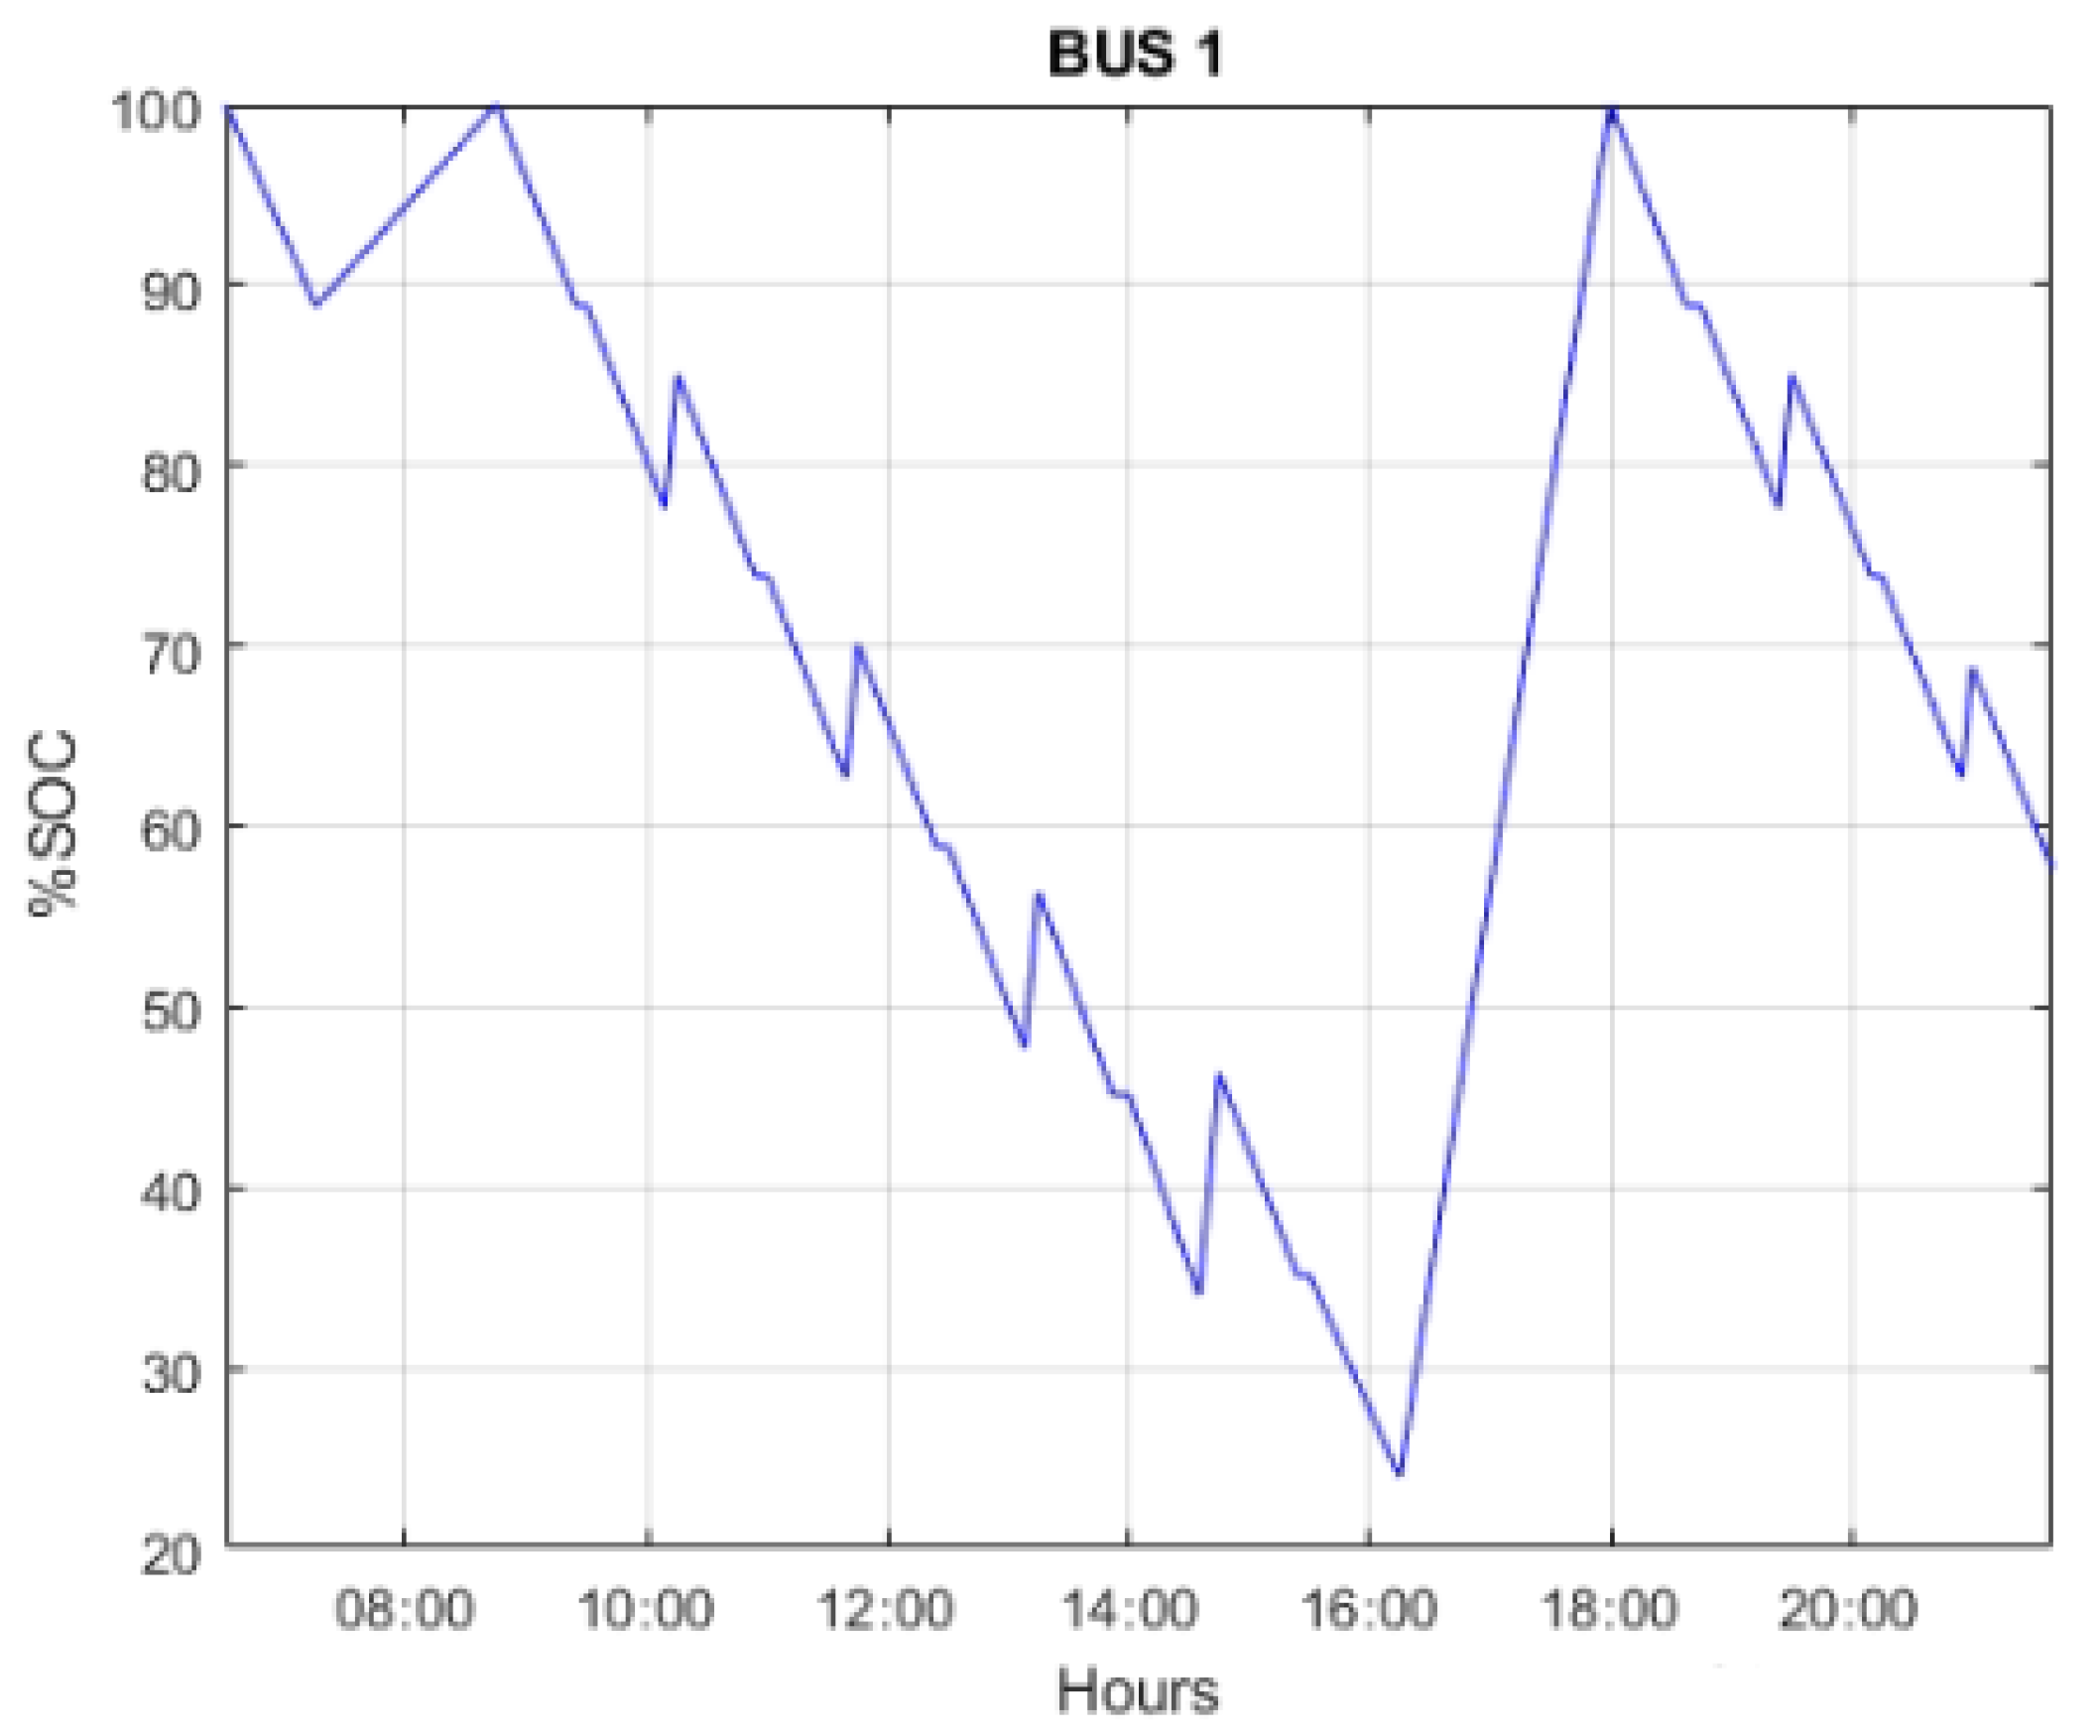
The energy consumption in the worst-case scenario for a roundtrip in this case is about 106 kWh. The simulated SOC profile of Bus 1 is reported in
Figure 21. Instead, the SOC of Bus 2 is not shown, since for this bus, the charging time does not represent a problem given the very long stopping times. The SOC of Bus 1 after 15:30 h goes under the limit value of 30%; however, this critical situation could be avoided by using Bus 2 for the runs, which are performed in the time interval 14:45–16:15 h. Indeed, it is stopped at Algeciras depot from about 9:30 h (it returns to Algeciras at 9:00 h after the last morning run); therefore, it would have all the necessary time to be recharged up to 100% and, hence, substitute Bus 1 for the critical runs.
Nevertheless, to correctly electrify line M-150, an overnight charging system composed of one AC 43-kW charging pole is needed to be installed in Tarifa bus station.
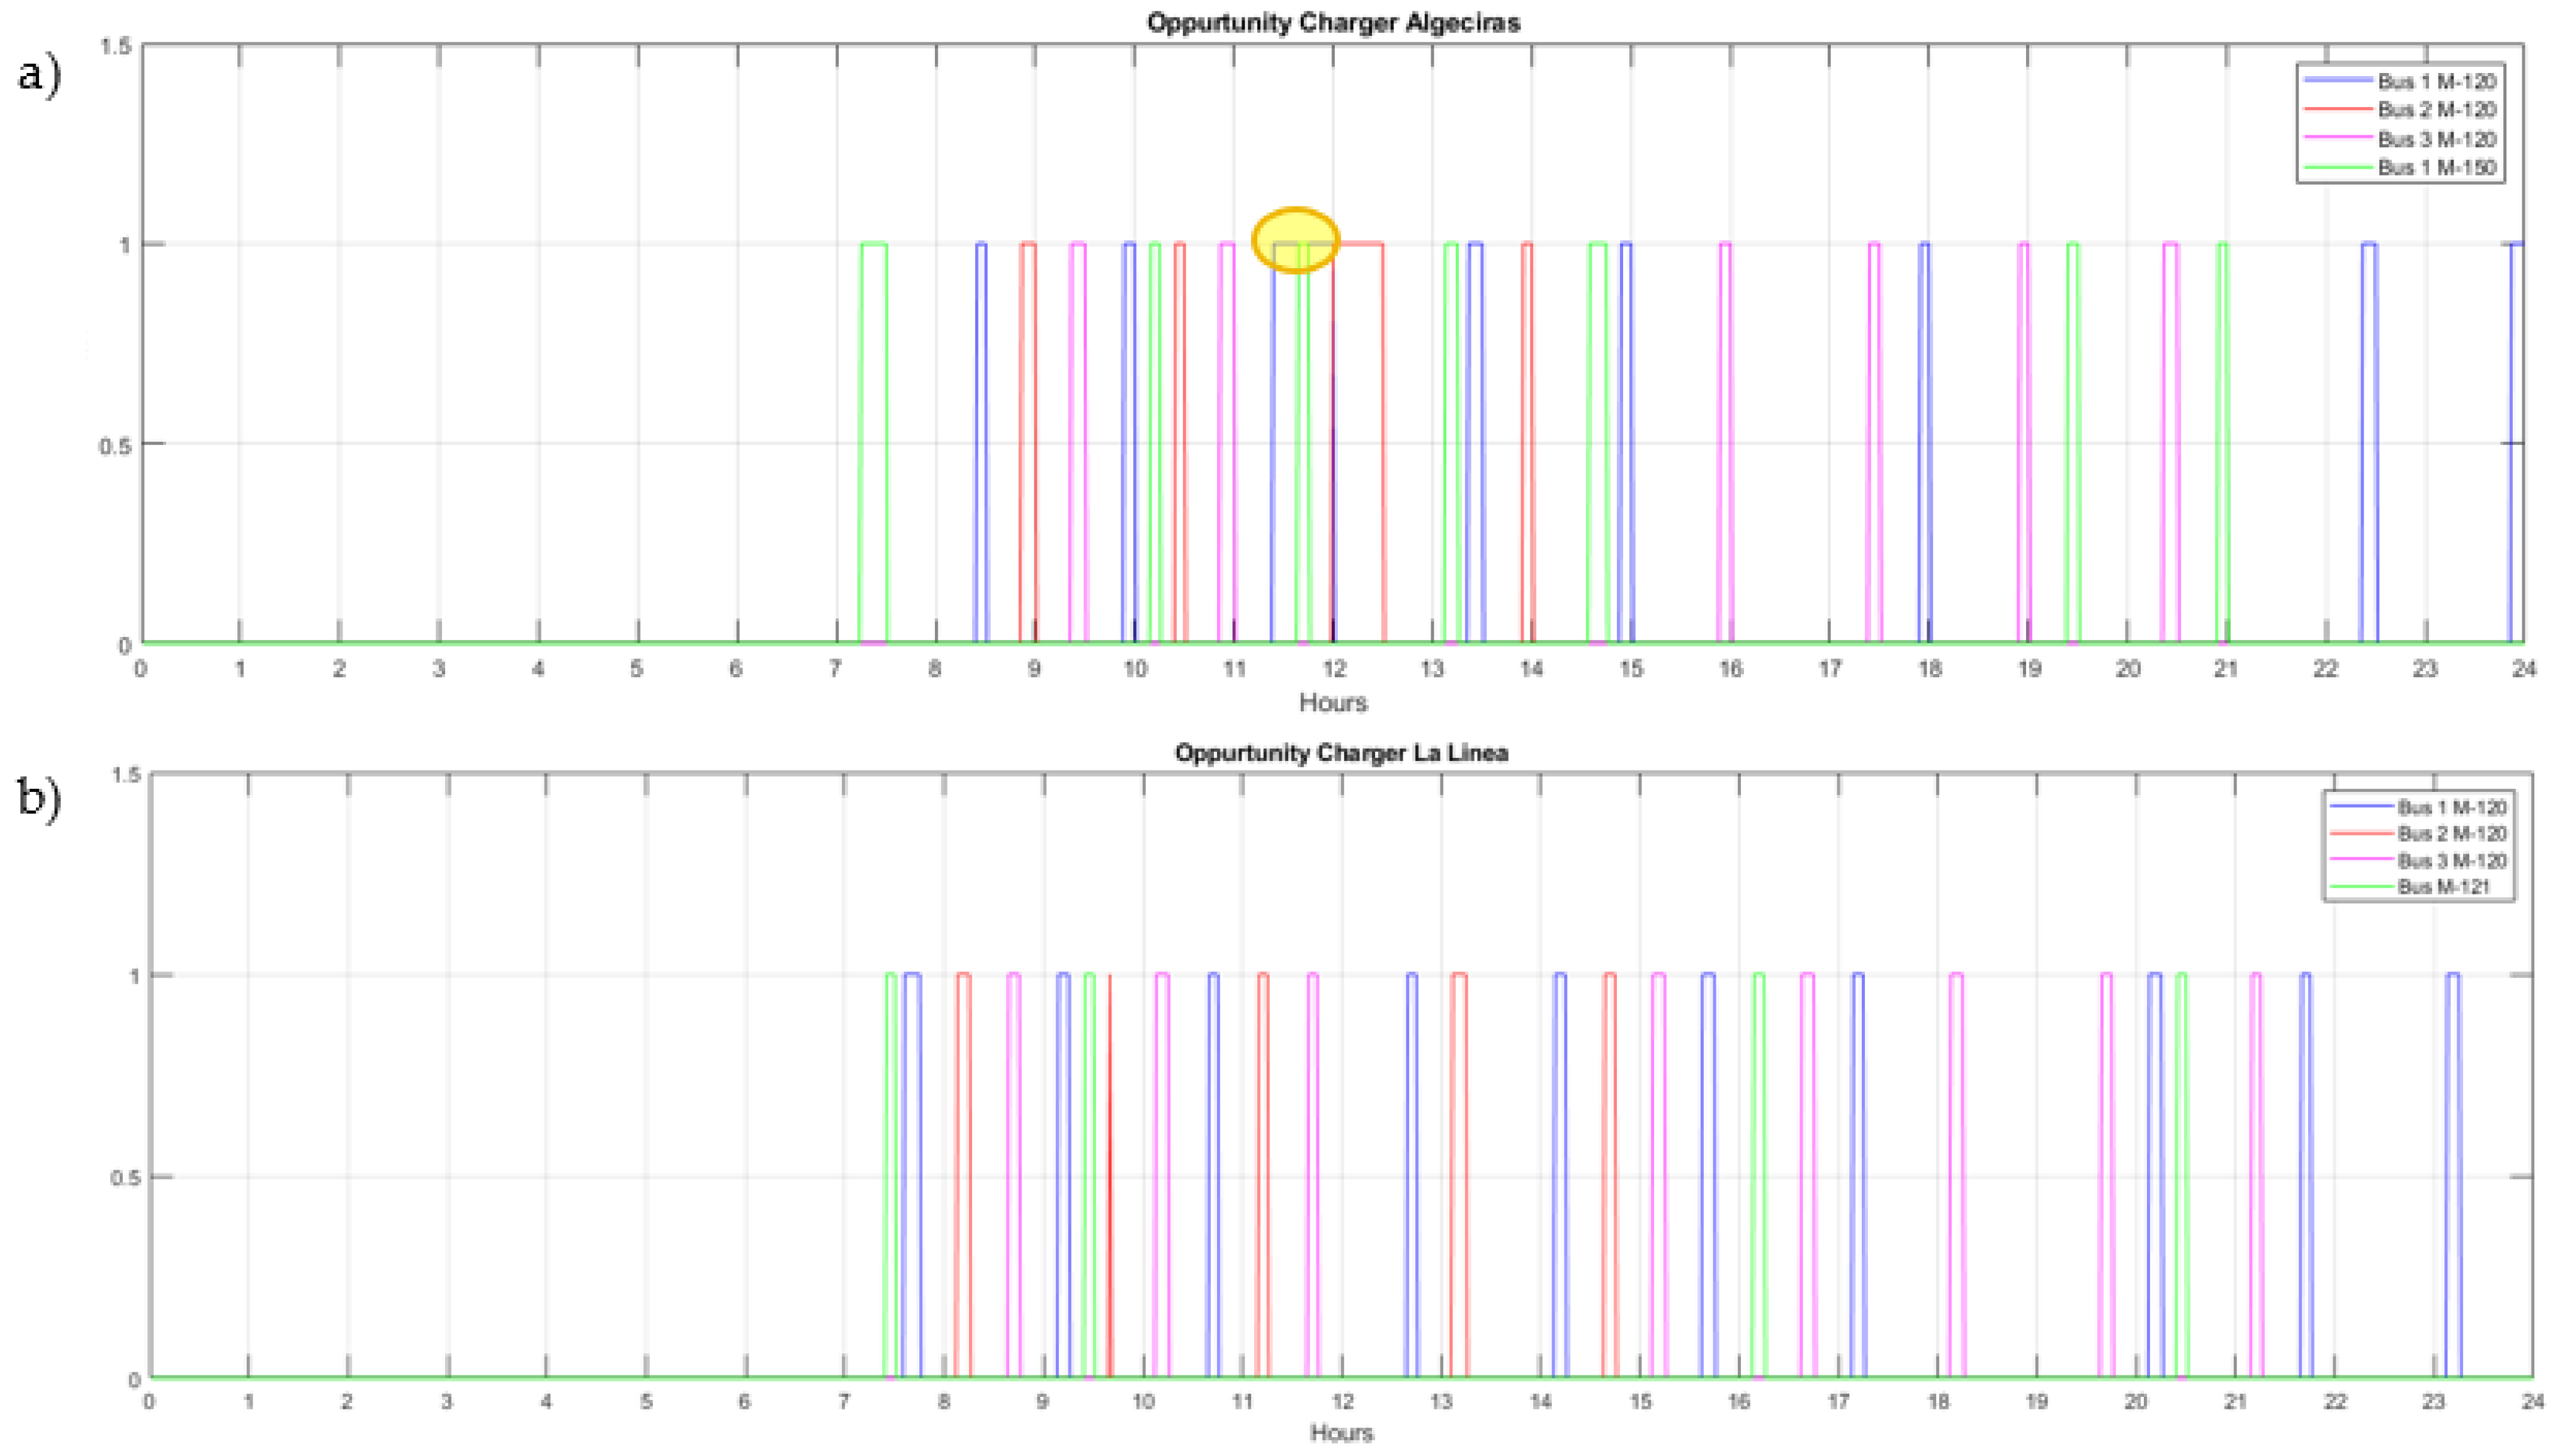
Lastly, in
Figure 22, the occupation profile of the two opportunity chargers is reported. Values of the Y axes equal to 1 imply that the Opp Charger is occupied and, hence, in operation. On the contrary, Y values equal to 0 denote that the Opp Charger is free and, hence, turned off.
For the charger installed in Algeciras, a critical overlapping situation (highlighted by a yellow circle) occurs between 11.30–12 h (the charging period of Bus 1 line M-120), which can last 5/10 min (the charging time of the bus of line M-150). Bus 1 of line M-120 arrives some minutes before 11.30 h to Algeciras station with about 380 kWh in the battery; therefore, ideally, it has about 35 min to recharge the consumed 94 kWh and, hence, reach 100% SOC. With a charging power of 350 kW, to fill the missing energy, about 16 min are necessary, this means that the bus of line M-120 can leave the opportunity charger for the overlapped 5–10 min to the bus of line M-150 without compromising its own operation. Instead, the opportunity charger installed in La Linea does not report any critical overlap.
5. Conclusions
This paper deals with a public transport electrification scenario-based in terms of energy consumption evaluation and, consequently, charging infrastructure design and planning, by considering various operational concerns. The results confirmed the possibility to replace the conventional old buses currently employed in line M-120 between the cities of Algeciras and La Linea in Spain with new electric buses. However, the operation of an electric bus is greatly affected by various factors, such as the outside temperature, the number of stops, the elevation profile of the path, the number of onboard passengers, etc. On this aspect, the findings highlight that the main role is played by the power absorbed by the auxiliaries that, in the worst case, can lead to an increase in energy consumption by 50%.
To correctly electrify the public bus line, both overnight and opportunity charging systems are required. The slow charge during the night could be performed by two AC charging poles of 43 kW installed in Algeciras bus station. Instead, the installation of the opportunity charging system in only one of the two bus stations resulted to not be enough for the proper operation of the service; therefore, two fast chargers must be installed, one in each terminal. Finally, from the installation of this charging infrastructure, the electrification could be easily extended to two other lines of the same company.
The proposed study does not incorporate an economic and environmental analysis coming from the electrification. Therefore, the future steps of research will focus on the computation of a cost and emissions assessment also evaluating a possible integration in the charging infrastructure of renewable energy sources. Moreover, since in this work, the effect of the aging of the battery has not been computed, to assess with a higher precision the impact of this side effect, a more accurate battery model, which comprises not only the electrical sub-model but also the aging and thermal sub-models, can be included in future steps.


