1. Introduction
Nowadays for a young driver approaching professional motorsports, there are many single-seater categories bridging the gap between karting and Formula 1. They are intended to be the ideal proving ground for drivers, and they are designed to be affordable for the teams.
Therefore, to contain costs, many rules have been implemented by the Fédération Internationale de l’Automobile (FIA). The most important is probably related to the car itself as it is mandatory for the teams to use rolling chassis, engine and tires all provided by the same manufacturer, giving also the opportunity to drivers to show their real value. Moreover, test and practice sessions have been limited in time and number as well as the amount of tires to be used (including race weekends). Most non-conventional sensors such as slip angle sensors are forbidden as well during races [
1].
As an example, a Formula 4 race weekend is divided in two free practice sessions, two qualifying sessions, and three races, but only three full sets of new tires are allowed for the entire event (12 tires in total, 6 fronts and 6 rears). The situation is similar in other categories such as Formula Regional Alpine and Euroformula Open.
This forces teams to use worn tires towards the end of the event, and the tire choice is usually made by track-side engineers relying only on their experience, kilometers traveled by each tire or based on the visual shape of the tires themselves, avoiding the use of tires that present signs of graining, blistering, flat-spots, etc.
Moreover, being aware of how a setup change impacts tires can be a breakthrough in tire management, especially in tracks where tire wear is a limiting factor. Tire wear could indeed prevent enduring the full race length with an acceptable level of performance. Most of the time, tire wear depends on track layout and surface/grip, but major setup changes also play a key role in this matter [
2,
3].
As a matter of fact, the real condition of a tire and hence its ability to deliver a good performance is strictly related to the amount of energy such a tire has been subjected to. However, tire sliding energy is far from being simple to measure, especially when the above-mentioned budget cap rules forbid the use of non-conventional sensors such as slip angle sensors, strain gauge on suspension arms or in-wheel temperature and pressure sensors.
This paper provides a simple but effective method to estimate tire sliding energy using a simple set of commonly used sensors such as accelerometers and wheel speed sensors. This estimation method is conceived to be simple, hence requiring a low computational burden which allows track-side engineers to embed the estimation into their data analysis software tools and have prompt answers while working on track. Therefore, a steady-state model will be used, and the method is based on vertical tire load calculation and on the assumption that tire models are available in order to be able to calculate tire and vehicle side-slip angles.
To prove the validity of this method, estimation results have been compared with results coming from a state-of-the-art vehicle dynamics simulation tool, namely VI-CarRealTime, which is normally used by most of the top teams and car manufacturers. Furthermore, a sensitivity analysis to different tracks and major setup changes has been carried out to show their influence on tire sliding energy and ultimately on their final performance. Three tracks have been considered (Spa, Nurburgring GP and Barcelona), as well as three different setup items such as roll stiffness distribution, aero balance and downforce level.
This topic seems to be neglected by authors, and it is difficult to find something related in literature. A lot of studies can be found on tire energy as far as fuel efficiency is concerned [
4,
5,
6,
7] as well as noise reduction/evaluation [
8,
9] and rolling resistance evaluation in general, but this is not the aim of this study. The only articles dealing with tire performance and wear by means of tire energy evaluation are [
10,
11], but one of them uses a more complicated method compared to the proposed one, and both do not refer to racing/motorsports applications. Particularly, [
10] presents an algorithm to optimize torque allocation on a multi-motor electric powertrain including tire sliding energy compensation; therefore, tire energy is not the main topic of the study, and it is only marginally treated. Moreover, the method presented in [
10] relies on non-conventional measurement techniques, usually forbidden in motorsport competitions for budget limitation reasons. On the other hand, [
11] presents a method to reduce tire sliding energy which is mainly based only on longitudinal tire slip, and it is not really focused on increasing performance but more on extending the tire’s lifespan.
The paper is organized as follows:
Section 2 provides a full explanation of the estimation methods including vehicle model equations,
Section 3 reports the model validation performed using a state-of-the-art vehicle dynamics simulation software and the sensitivity analysis to major setup changes, while in
Section 4 and
Section 5, results, discussion and concluding remarks are given.
2. Materials and Methods
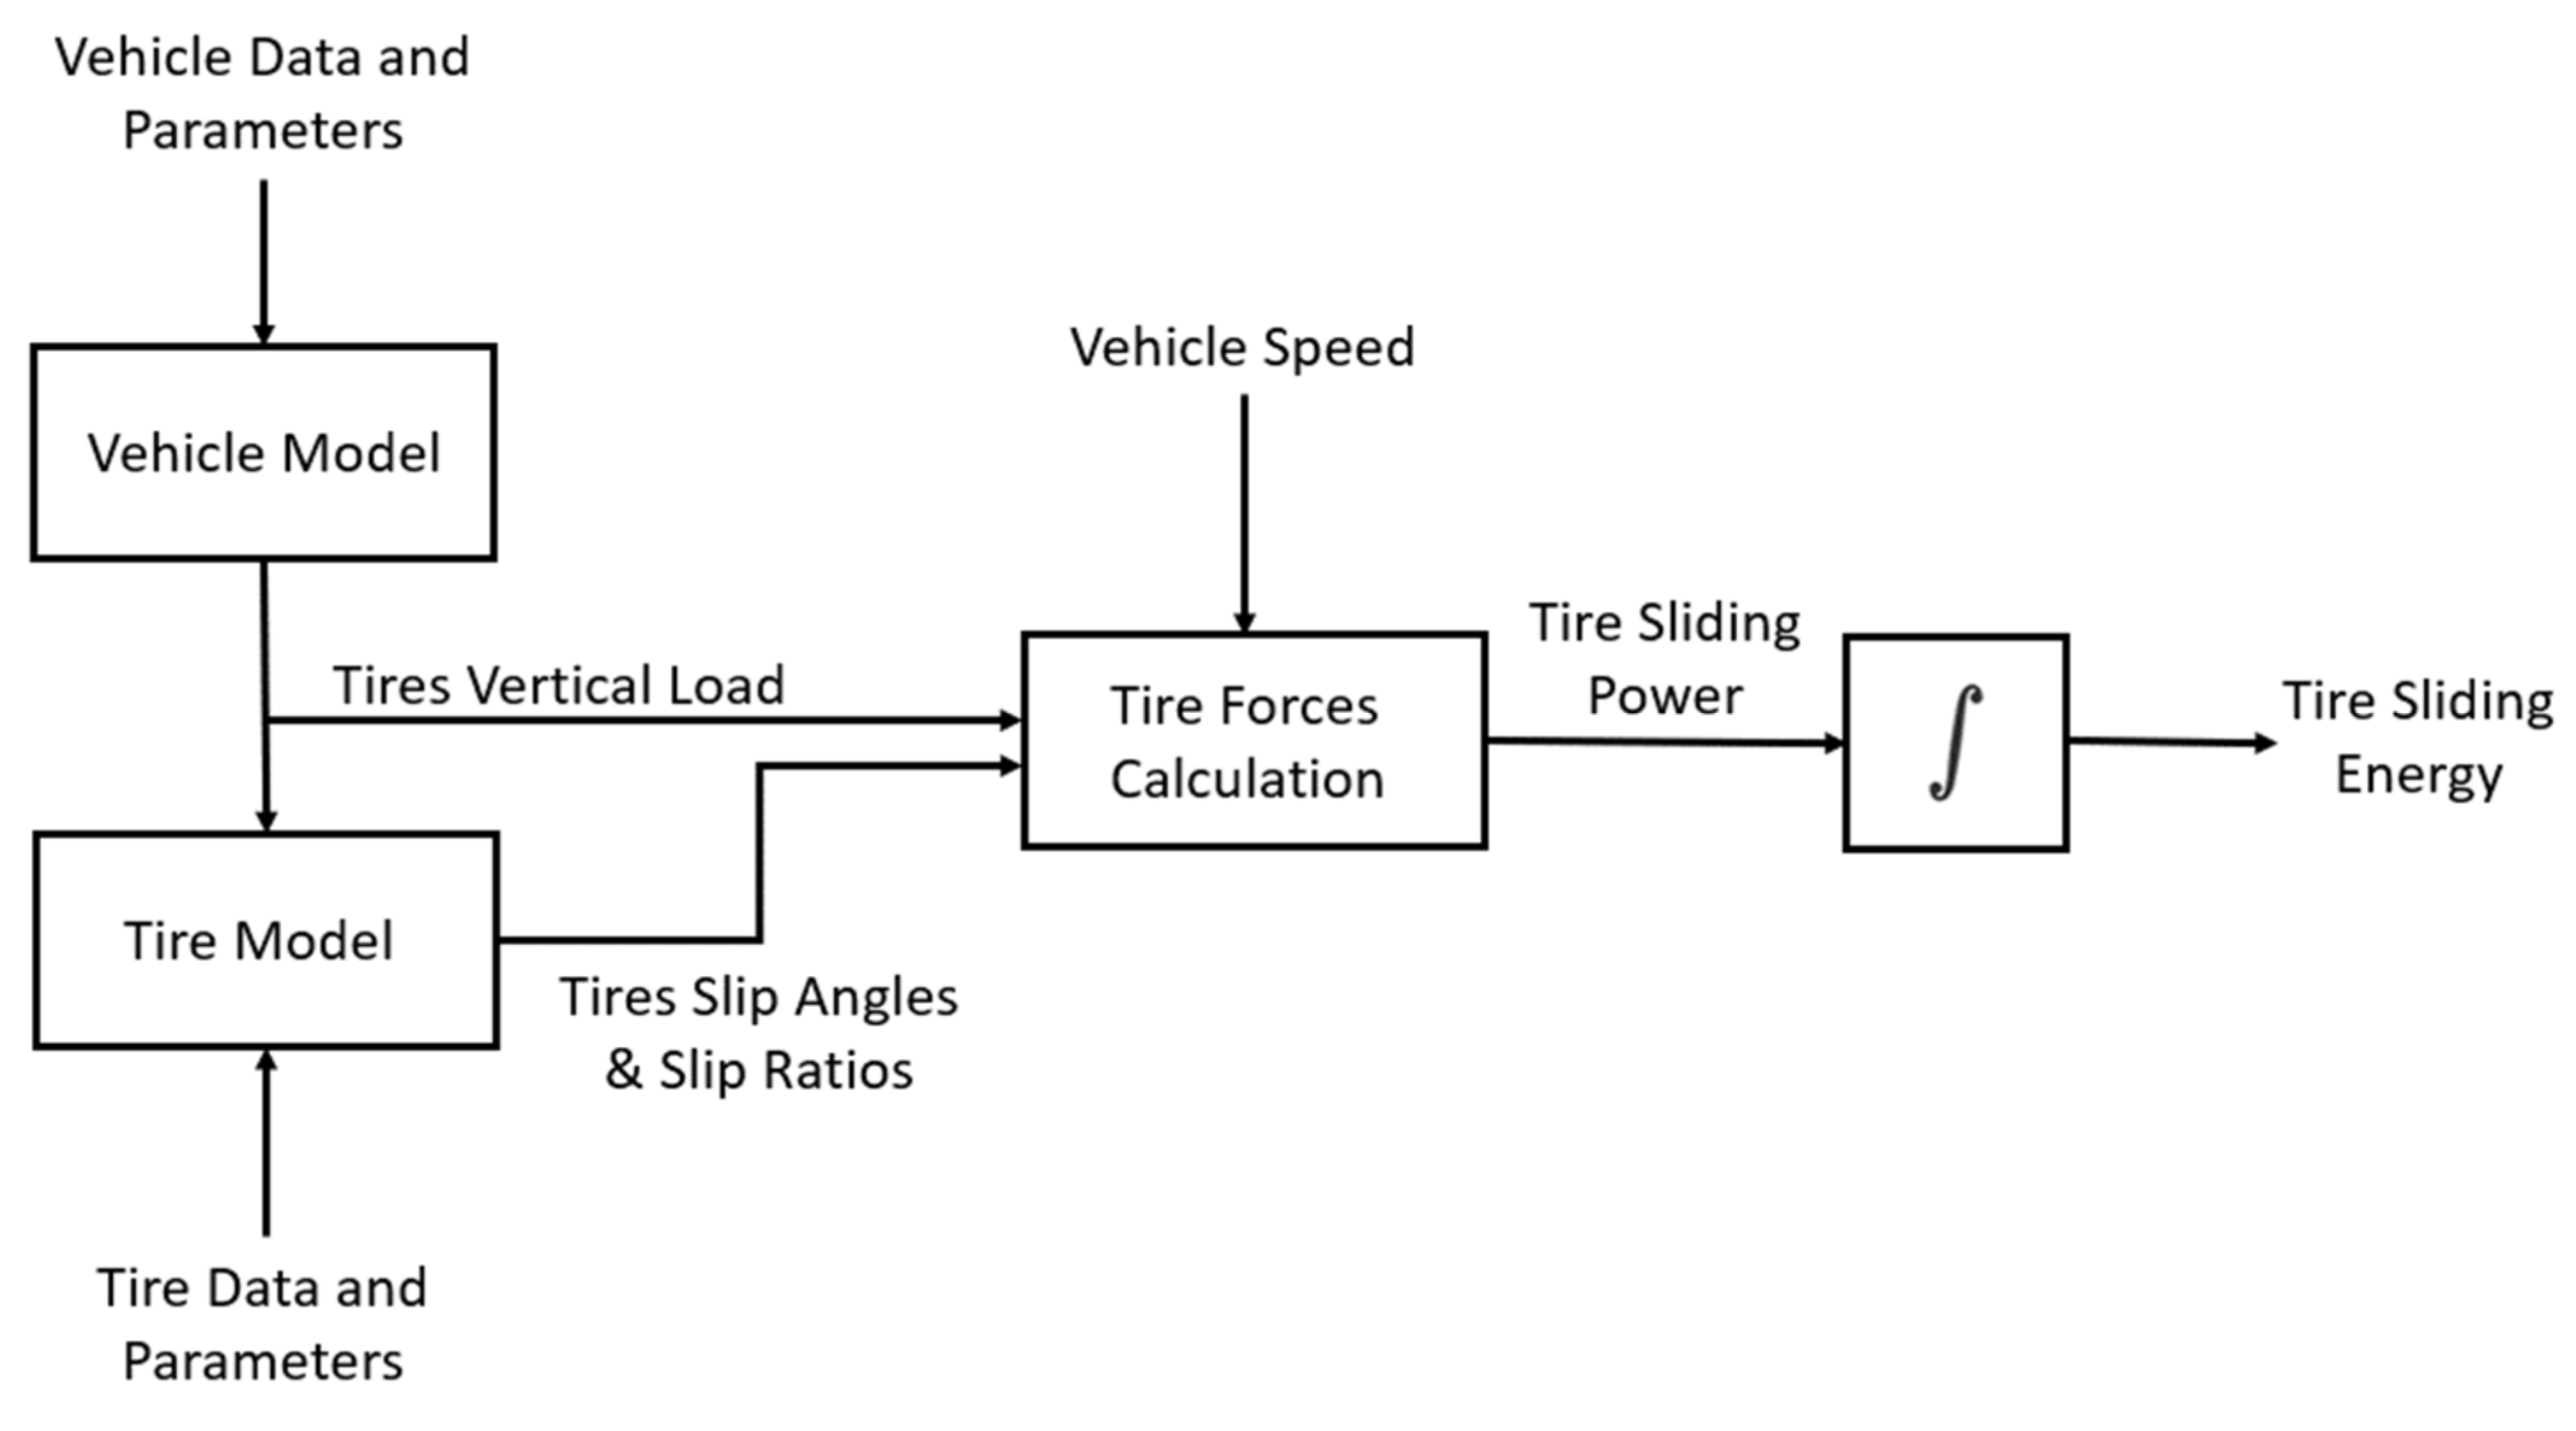
Tire slip power has become a key issue for understanding tire behavior and the performance a vehicle can achieve. The definition and mechanism of tire slip power loss is defined theoretically as the input power dissipated in the sliding region of tire operation; this amount of dissipation is equal to the total mechanical power, including potential energy due to elastic deformation in the adhesion region.
Consequently, the tire energy can be found as the time integral of the tire sliding power, which is simply the total force developed by the tire (longitudinal and lateral combined) multiplied by its sliding speed. The numerical integration is performed using the well-known Riemann method [
12]. However, it implies that an error is made during the integration process itself. This error can be simply minimized by using the smallest possible sample time, which is standard procedure for motorsport applications. For the sake of clarity,
Figure 1 reports a high-level schematic summarizing the modeling process described in this section.
As mentioned in
Section 1, the vertical load acting on each tire is an important part of the whole estimation method. The first step for tire vertical load calculation is to find their static load as:
where
SL_F and
SL_R are, respectively, the static load acting on each front and rear tire;
WD is the static weight distribution (% on front axle); and
Mtot is the vehicle total mass. It is worth highlighting that the
WD is always known on a racecar, and it is very simple to be measured before each session by putting the car on scales.
Load transfer due to vehicle accelerations must then be added to the static loads, and it is calculated as follows:
DFz_LatF and DFz_LatR are the lateral load transfer contributions from the inside wheels to the outside wheels caused by the turning vehicle for the front and rear axle, respectively, while DFz_Long is the total longitudinal load transfer from the rear axle to the front axle (or vice versa) caused by the vehicle braking or accelerating. Msf and Msr are the sprung masses loading each axle, while Muf and Mur are the unsprung masses of each front and rear corner, Hcrf and Hcrr are the two roll center height, θ is the vehicle roll angle (easily measurable from suspension displacement sensors), Krf and Krr are the roll stiffness of each axle, Rw is the wheel radius, HCG is the center of gravity (CG) height, Tf and Tr are front and rear vehicle track, respectively, WB is the vehicle wheelbase and Ax and Ay are the vehicle accelerations measured at the CG. Please note that lateral acceleration is considered positive for right turns and longitudinal acceleration is considered positive when the vehicle accelerates.
The vertical load acting on each tire is therefore calculated by combining static loads and load transfers as follows:
where
FL indicates the front left wheel,
FR the front right,
RL the rear left,
RR the rear right.
Faero represents the aerodynamic force acting on each wheel. For road cars, it can be easily neglected, but for race cars it cannot be neglected and must be included in the vertical load calculation.
Furthermore, to calculate lateral and longitudinal forces developed by the tires, the total force acting on the CG must be found. Again, as only conventional sensors can be used, the total longitudinal and lateral forces acting on the car CG, which must be balanced by tire forces, are calculated using accelerometer readings as follows:
where
Fy_G and
Fx_G are, respectively, the lateral and the longitudinal forces acting on the vehicle CG.
It is worth highlighting that for this simple tire energy estimation, it has been assumed that lateral and longitudinal force distribution on each wheel is proportional to the vertical load acting on each wheel during the vehicle motion. Therefore, the lateral force distribution on each wheel is calculated as:
where
Fz_FL_perc,
Fz_FR_prec,
Fz_RL_perc and
Fz_RR_perc are the percentages of the total vertical load acting on each wheel, calculated as follows:
Similar to the lateral motion, the longitudinal force distribution has been obtained using the following equations:
where
BB is the brake bias (% on the front axle). For the sake of clarity, braking and accelerating contributions have been reported separately. Obviously, the total longitudinal force developed by the tires during the vehicle motion can be obtained adding the two contributions for each wheel. Please note that accelerating contribution has been set to zero for front tires as a RWD vehicle perfectly fits the target vehicle of this work.
Once vertical, longitudinal and lateral forces are known, lateral slip angles (
α) and longitudinal slip ratios (
sr) can be easily found from the Pacejka tire model for each tire. It is worth noting that in racing environments, the tire model is generally known and given to team from the car manufacturer or tire manufacturer directly. Therefore, vehicle side slip angle can be found as reported in [
13], using the following equation:
where
αp is the rear tire slip angle of the single-track model,
b is the distance between rear axle and CG while
R is the corner radius and equal to
V^2/Ay.
Using vehicle side-slip angle, it is now possible to calculate the vehicle’s longitudinal and lateral speeds as follows:
where
Vcomb is the combined speed.
Furthermore, the total force combined developed by the tires can be written as:
the total combined sliding power developed by each wheel can be simply estimated as follows:
while the longitudinal sliding power can be written as:
and the lateral sliding power for each wheel is:
Finally, tire energy can be simply found from the time integral of the total power.
3. Results
As mentioned in
Section 1, simulations have been used in order to test the estimation method proposed. VI-CarRealTime (VI-CRT) has been used for this purpose as it is considered the reference in vehicle dynamics simulation.
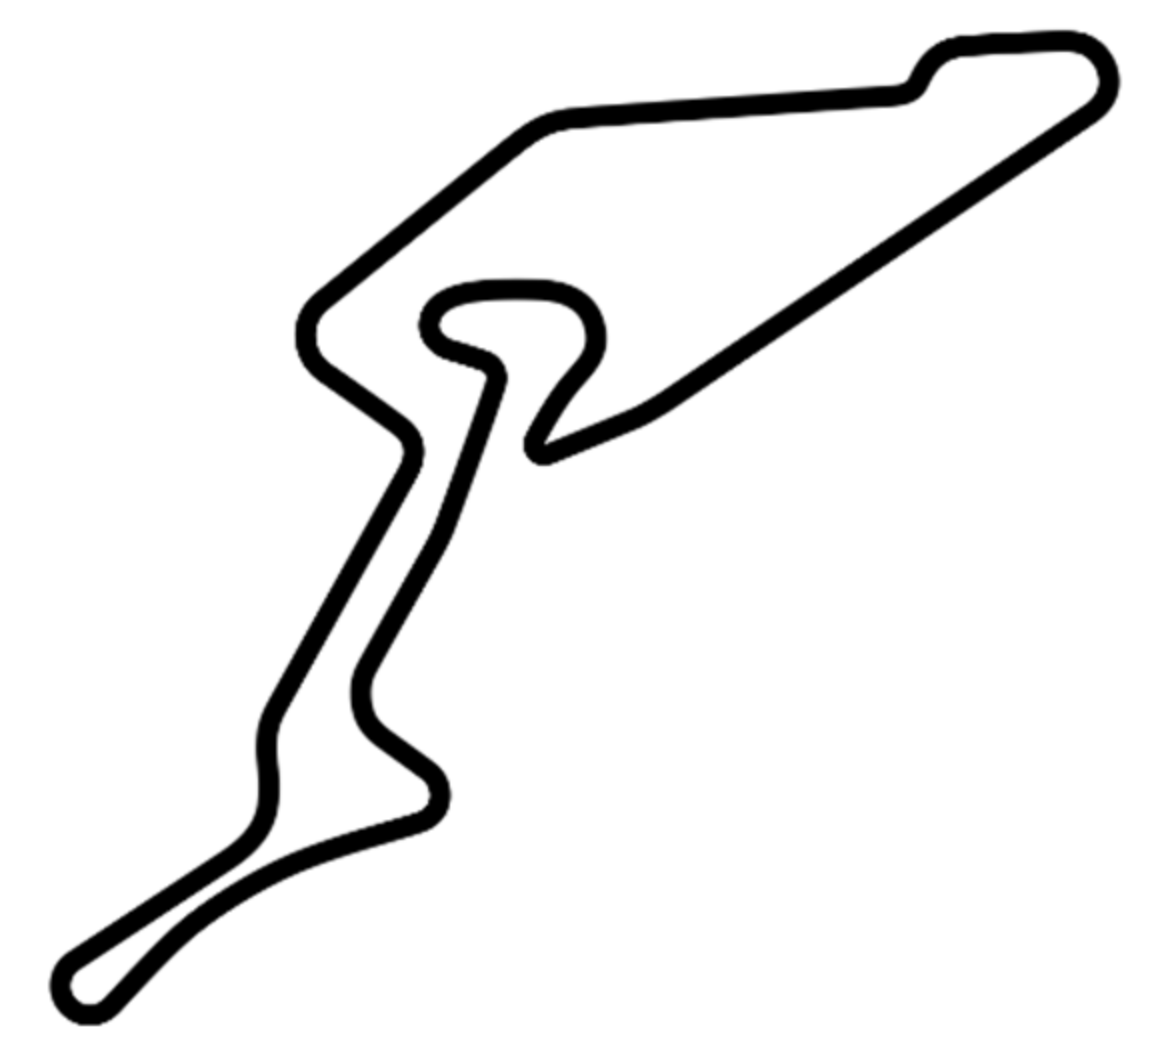
A lap time simulation has been performed over the well-known Nurburgring GP racetrack, shown in
Figure 2. The vehicle used is called ‘RaceCar’ and it comes straight from VI-CRT libraries. It is worth to be highlighted that vehicle models included in VI-CRT libraries are built using real-world data (including the Pacejka tire model) and completely validated, hence they can be considered a reliable reference.
Table 1 reports the most relevant vehicle parameters of the vehicle used.
As mentioned above, a laptime simulation has been carried out and compared to the results coming from the tire energy estimation model.
Figure 3,
Figure 4,
Figure 5 and
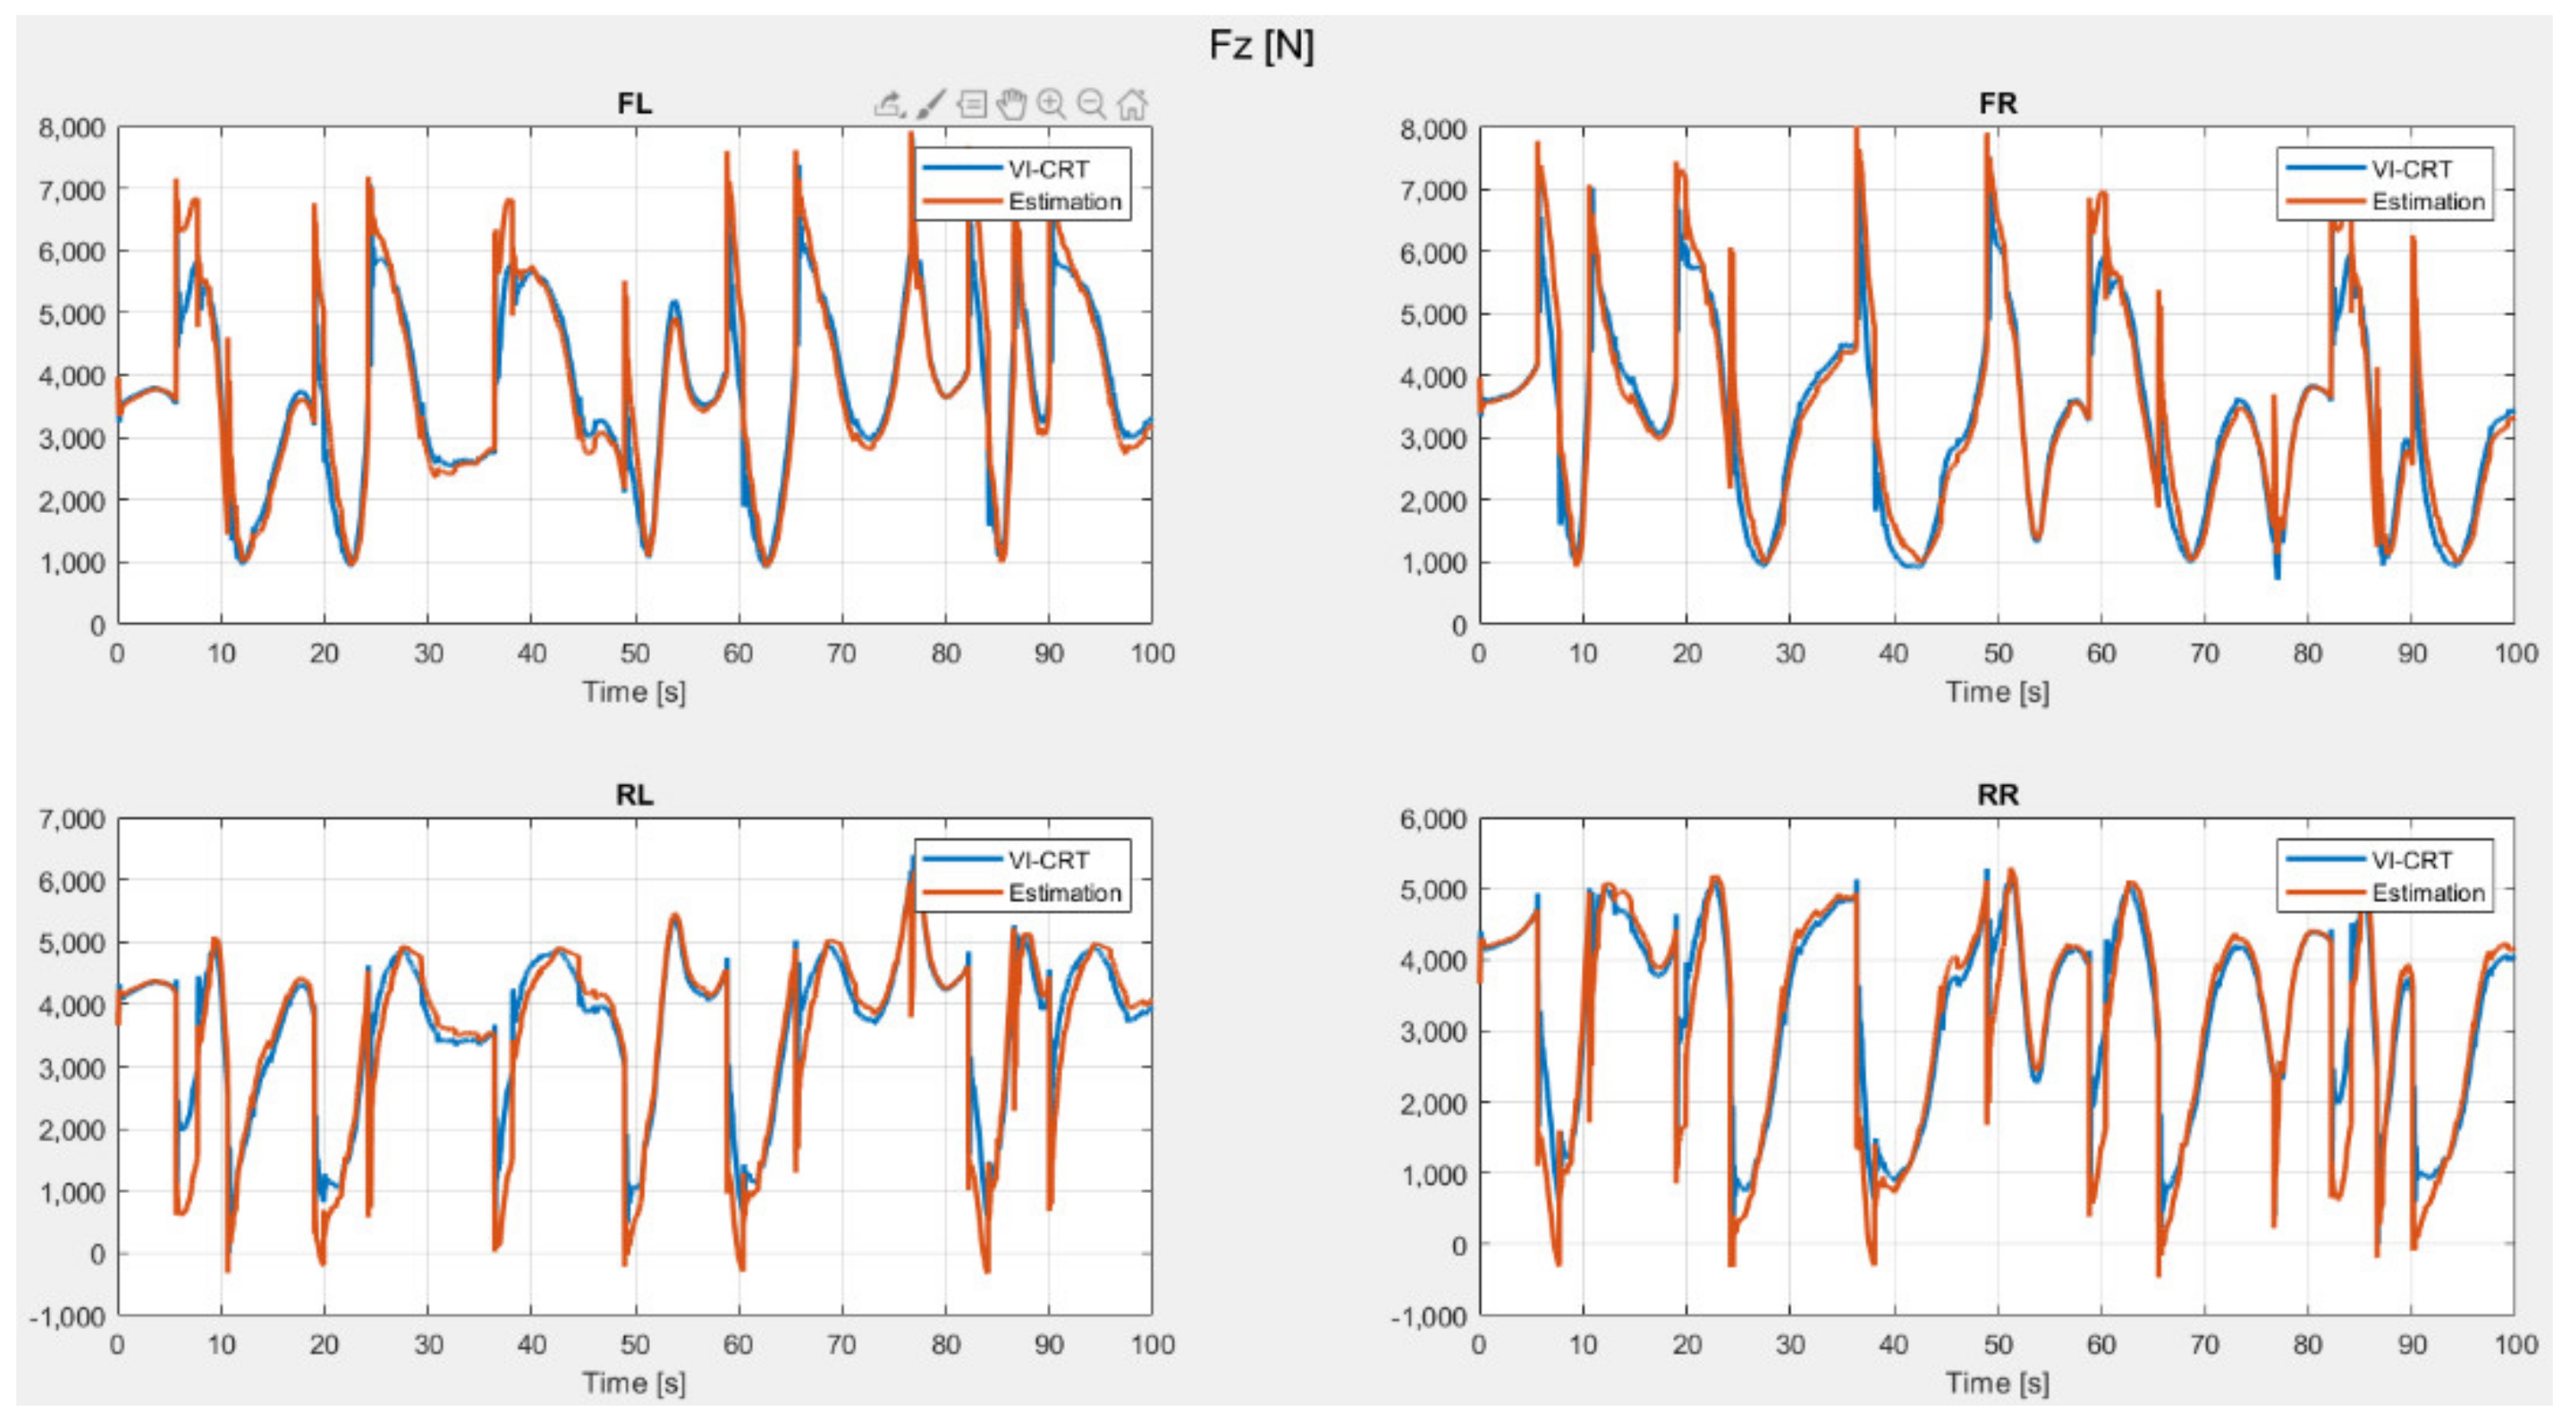
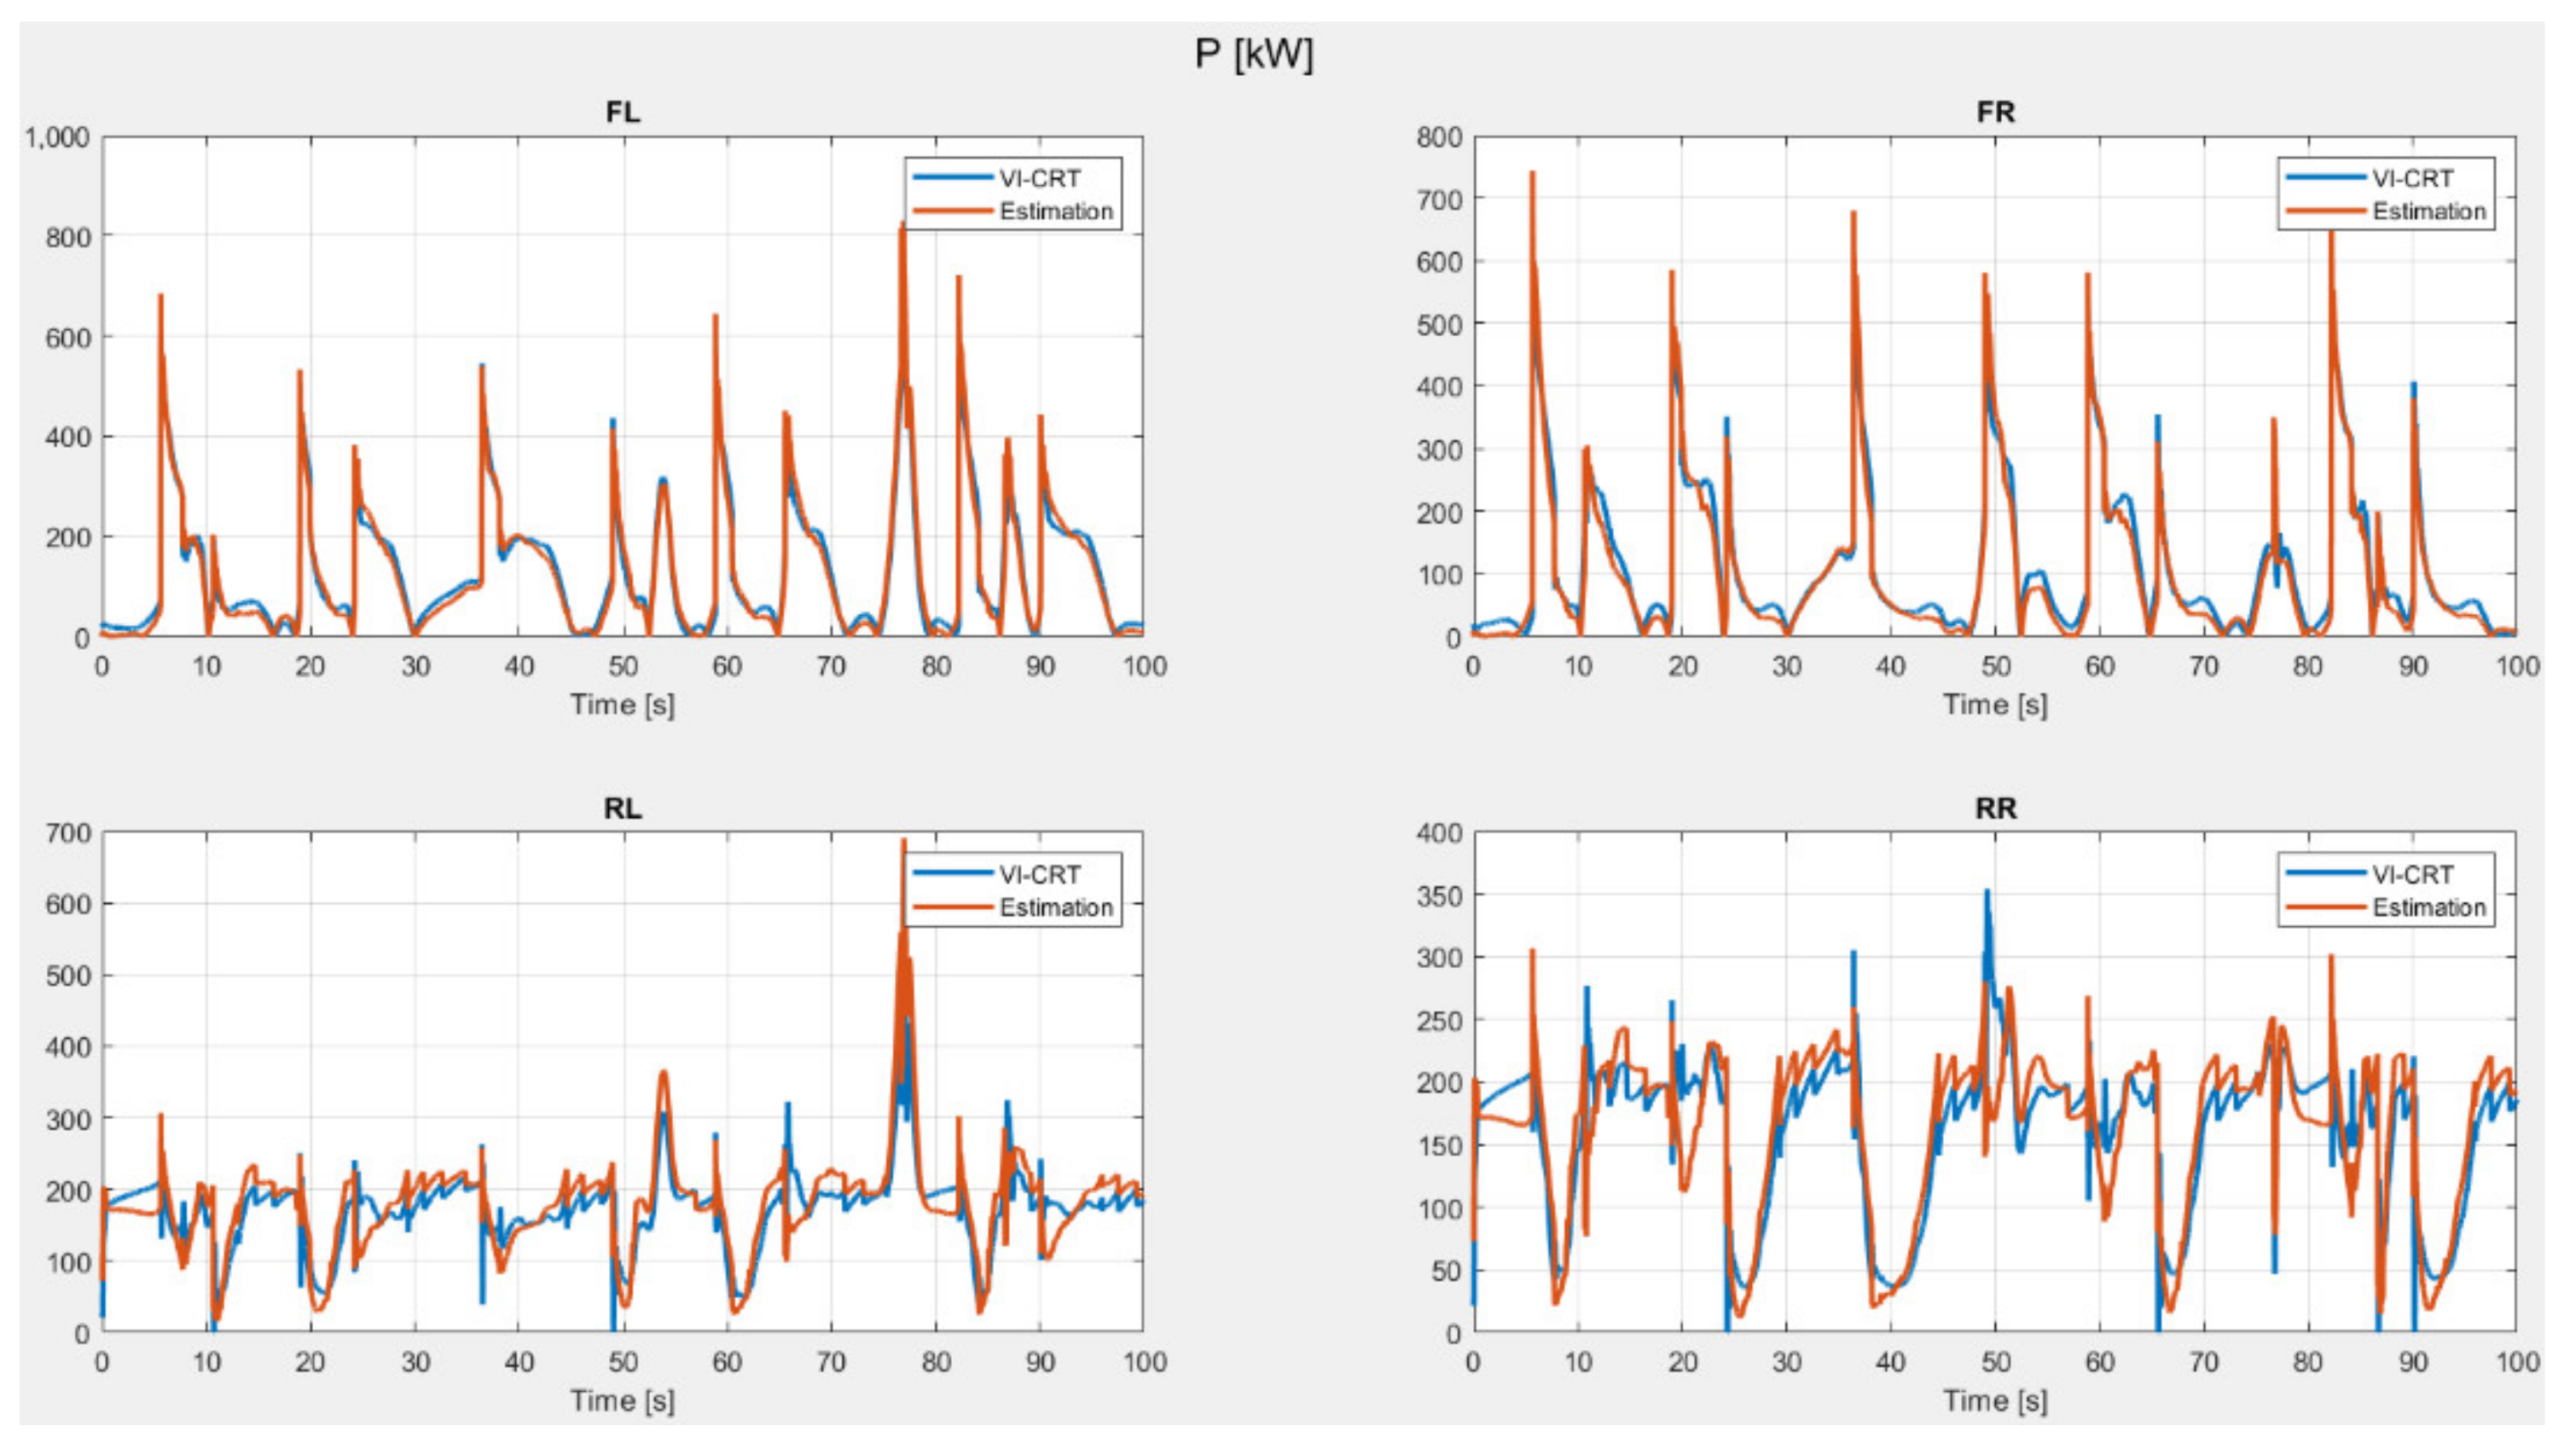
Figure 6 show the results. Particularly,
Figure 3 shows the total vertical force (Fz) acting on each wheel,
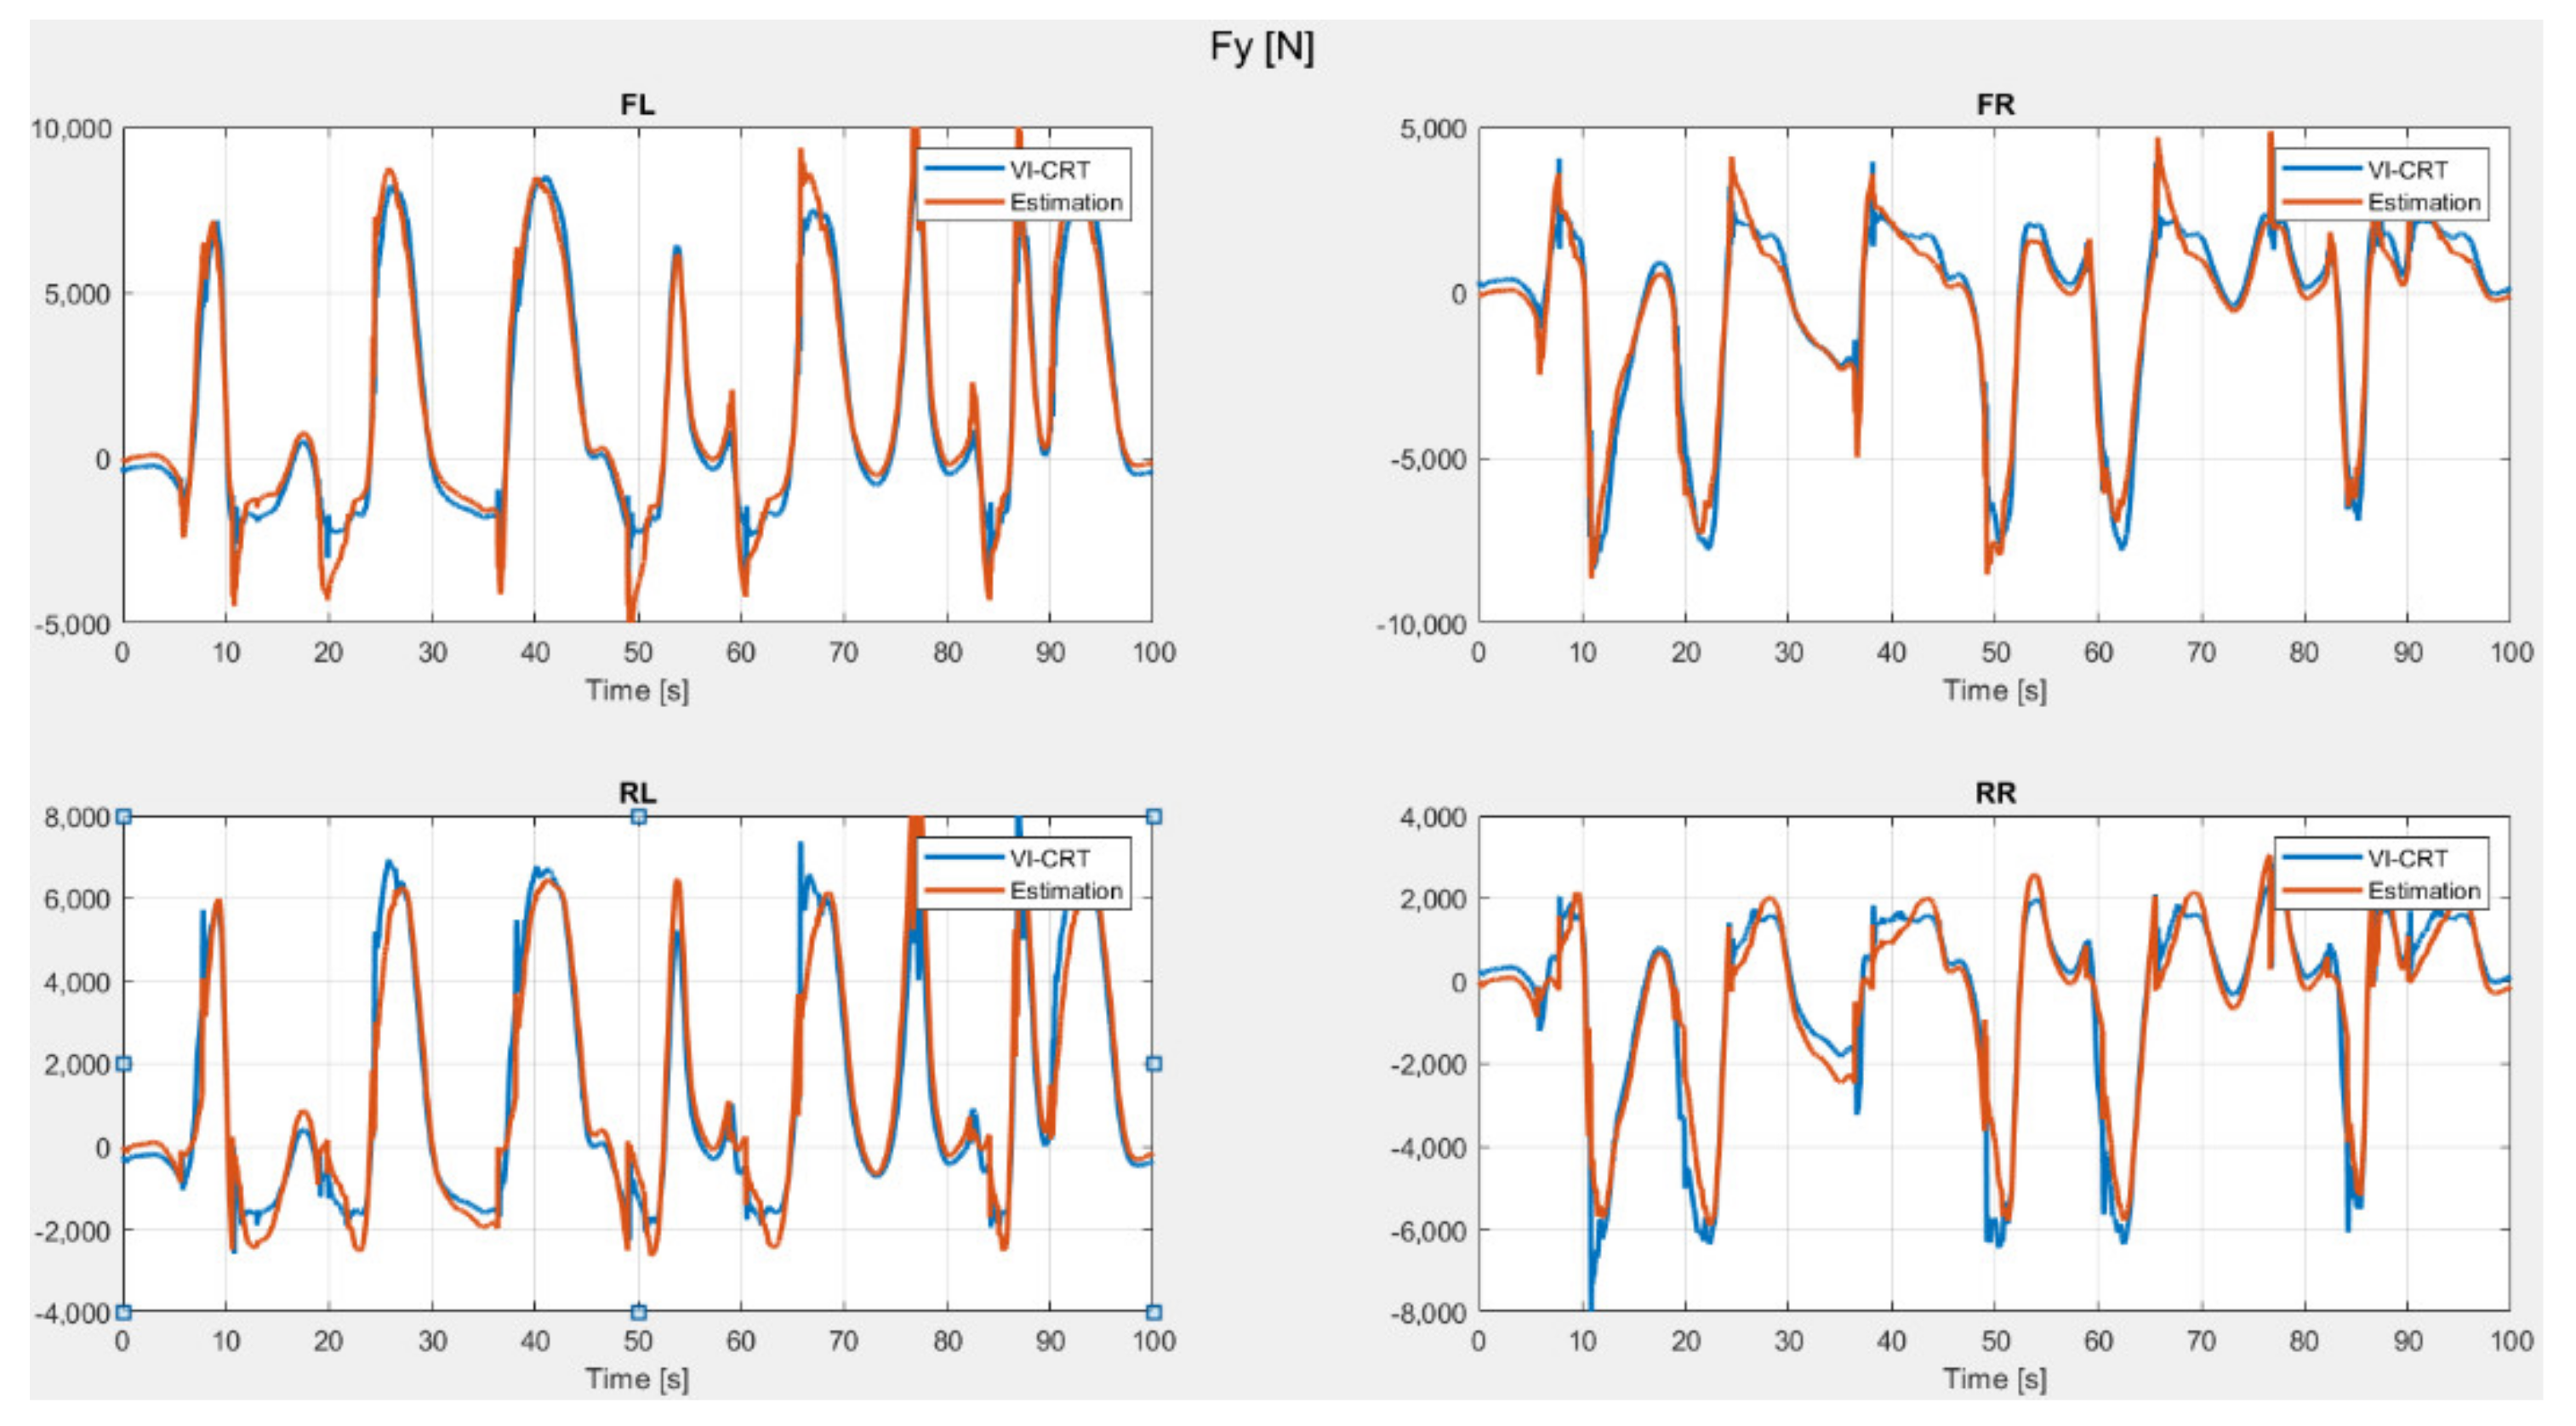
Figure 4 shows the lateral force (Fy) developed by each tire,
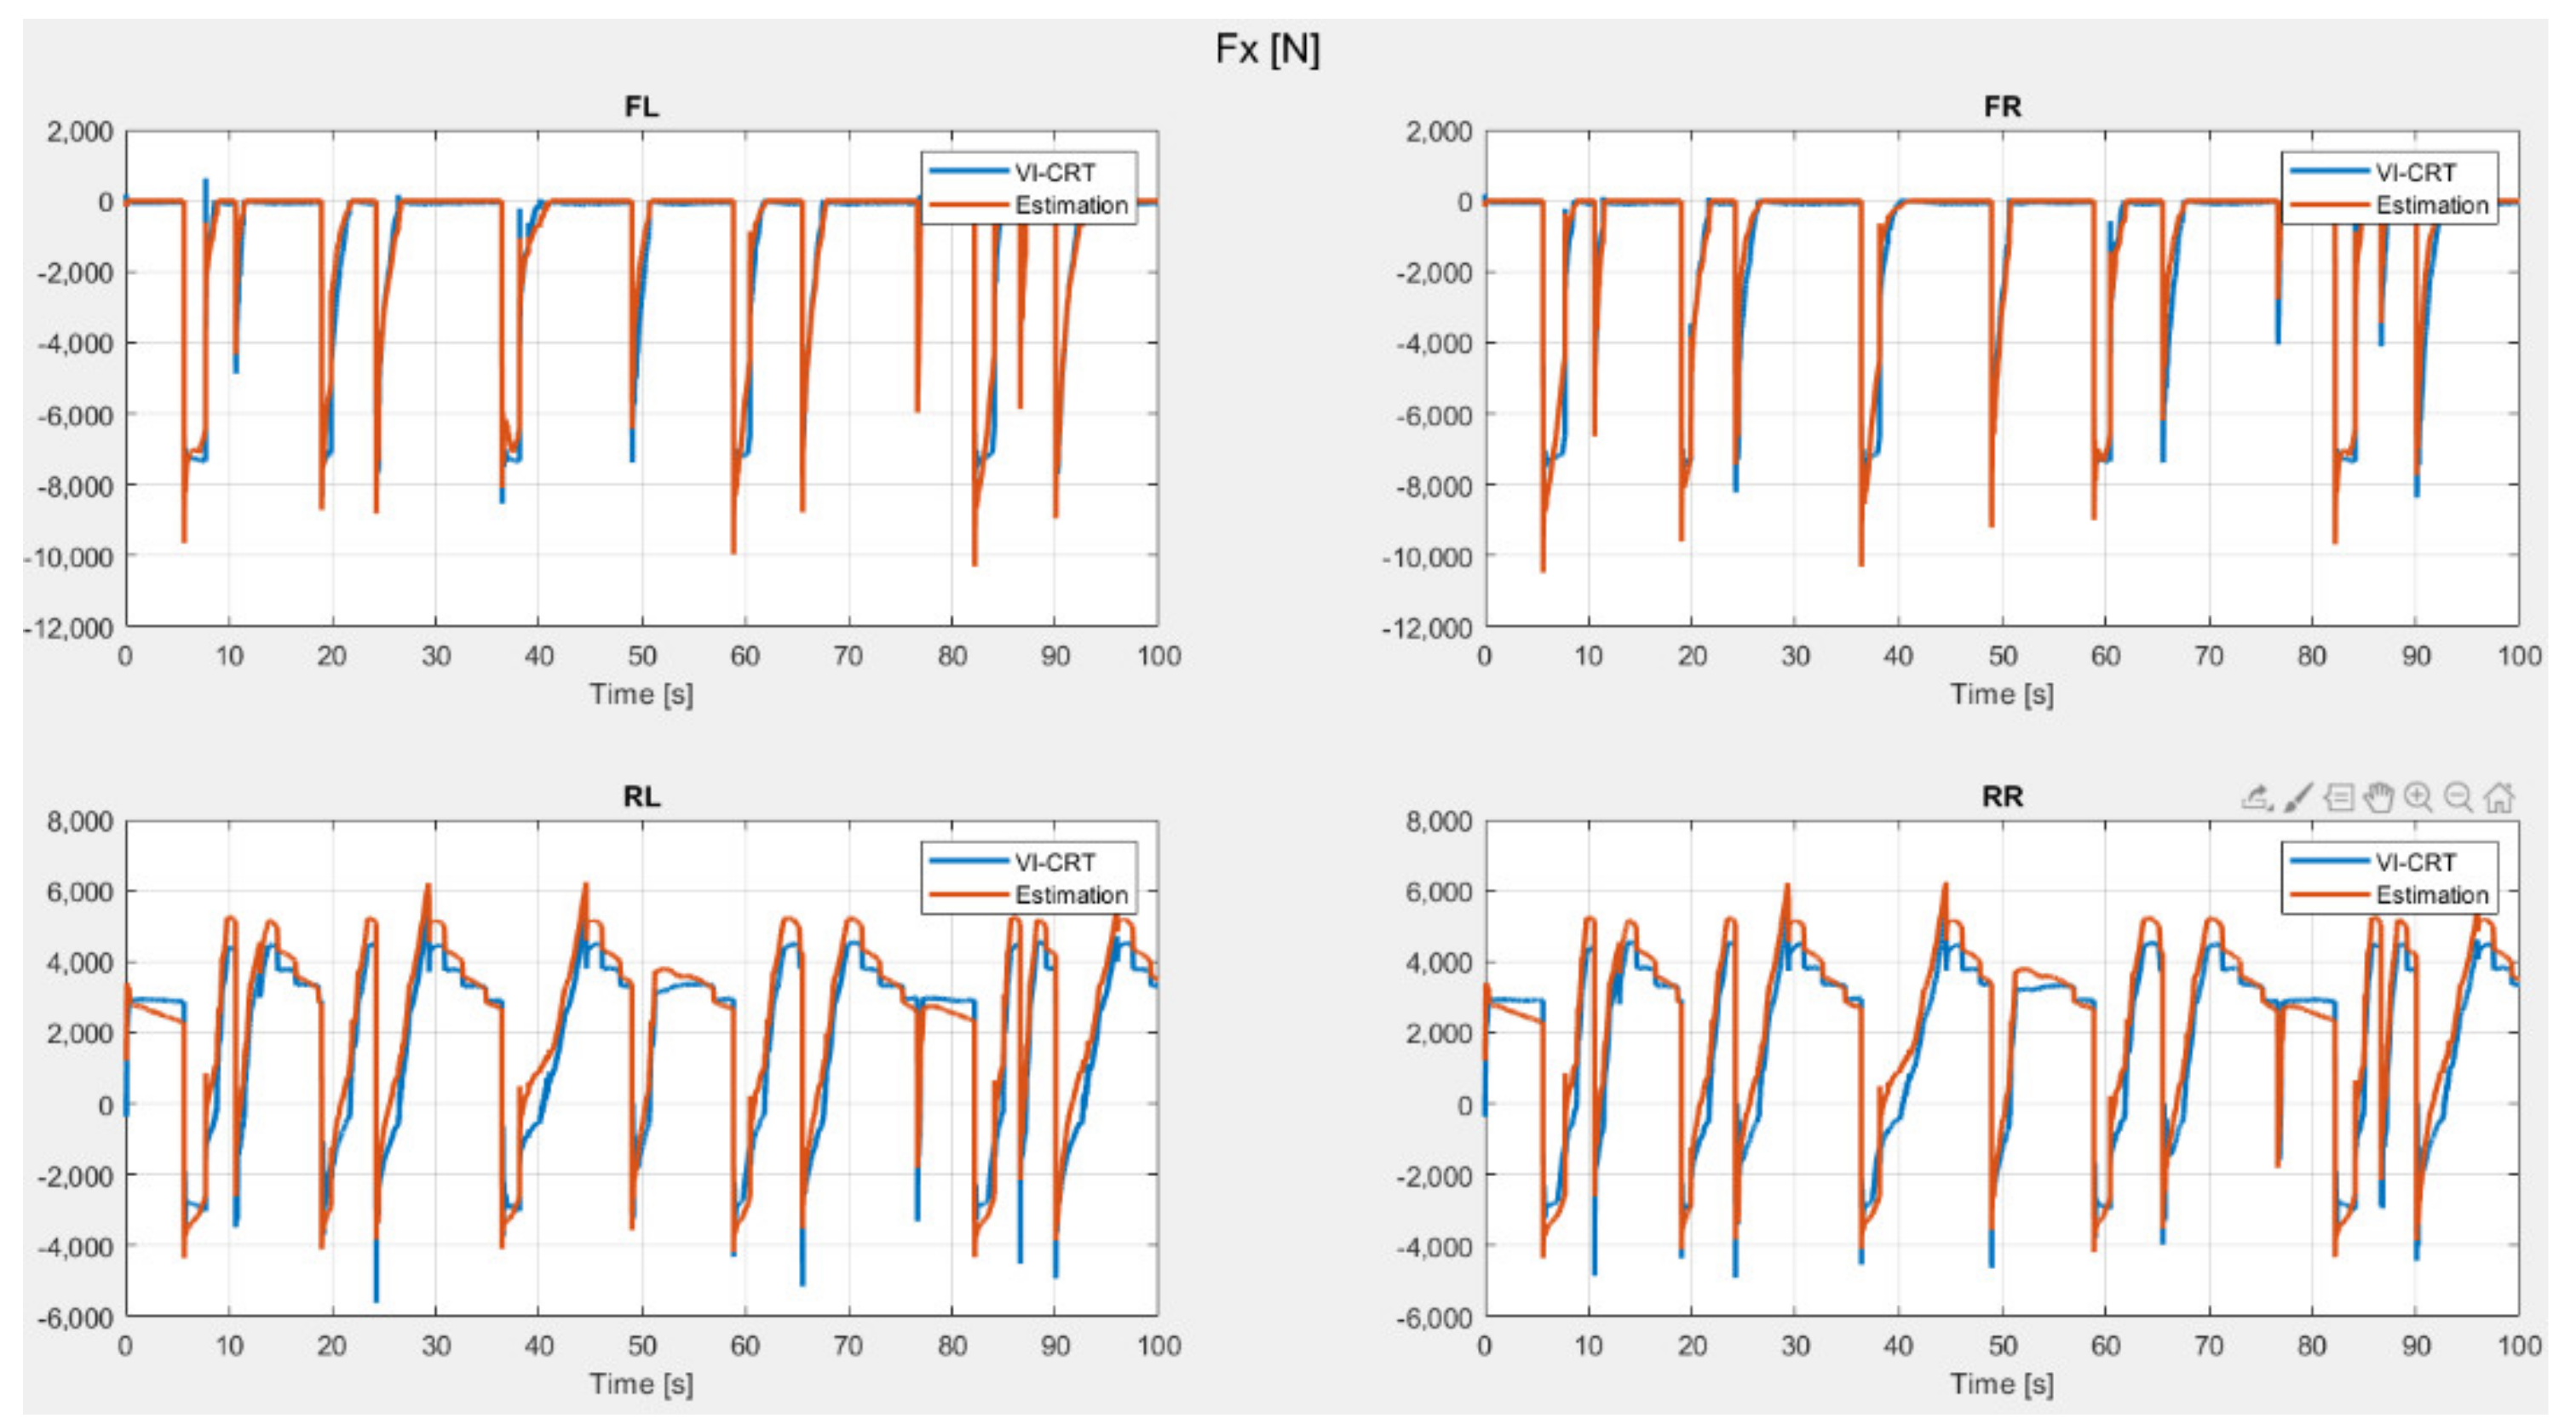
Figure 5 shows the longitudinal force (Fx) developed by each tire, while
Figure 6 show the total sliding power (P) which is strictly related to tire sliding energy as discussed in
Section 2. Each plot reports a blue line for VI-CRT simulation results and a red line for estimation results.
In
Figure 3,
Figure 4,
Figure 5 and
Figure 6, the trend is generally well reproduced; however, some differences can be seen in the signal time history, especially close to the zero line or in correspondence with peaks. It is worth stressing that the model has been intentionally kept simple in order to be light enough to be embedded into the data analysis tools commonly used by track-side engineers.
Figure 3, for example, shows some inaccuracy in the tires’ vertical load peak estimation, which is related to the model itself. As it is a steady-state model, damper forces have been neglected, and the tires’ vertical stiffness has been considered as linear. The model is fed mainly by vehicle longitudinal and lateral acceleration, so impacts on curbs are not considered as well.
As discussed in
Section 2, the tire model is fully known and includes both linear and non-linear behavior. However, some small inaccuracies can be seen in the lateral force estimation (see
Figure 4), but they are strictly related to the vertical load estimation error previously mentioned, while longitudinal force estimation is more accurate. Some small inaccuracies are still visible (see
Figure 5); in this case, they are related to lockups under braking and wheelspin or clutch spin under acceleration.
Finally, the result obtained in the sliding power estimation (see
Figure 6) is the direct consequence of the previous estimations, and the mean absolute percentage error (MAPE) in this case is well below 10%. Therefore, the model can be considered accurate enough for the purpose of this study.
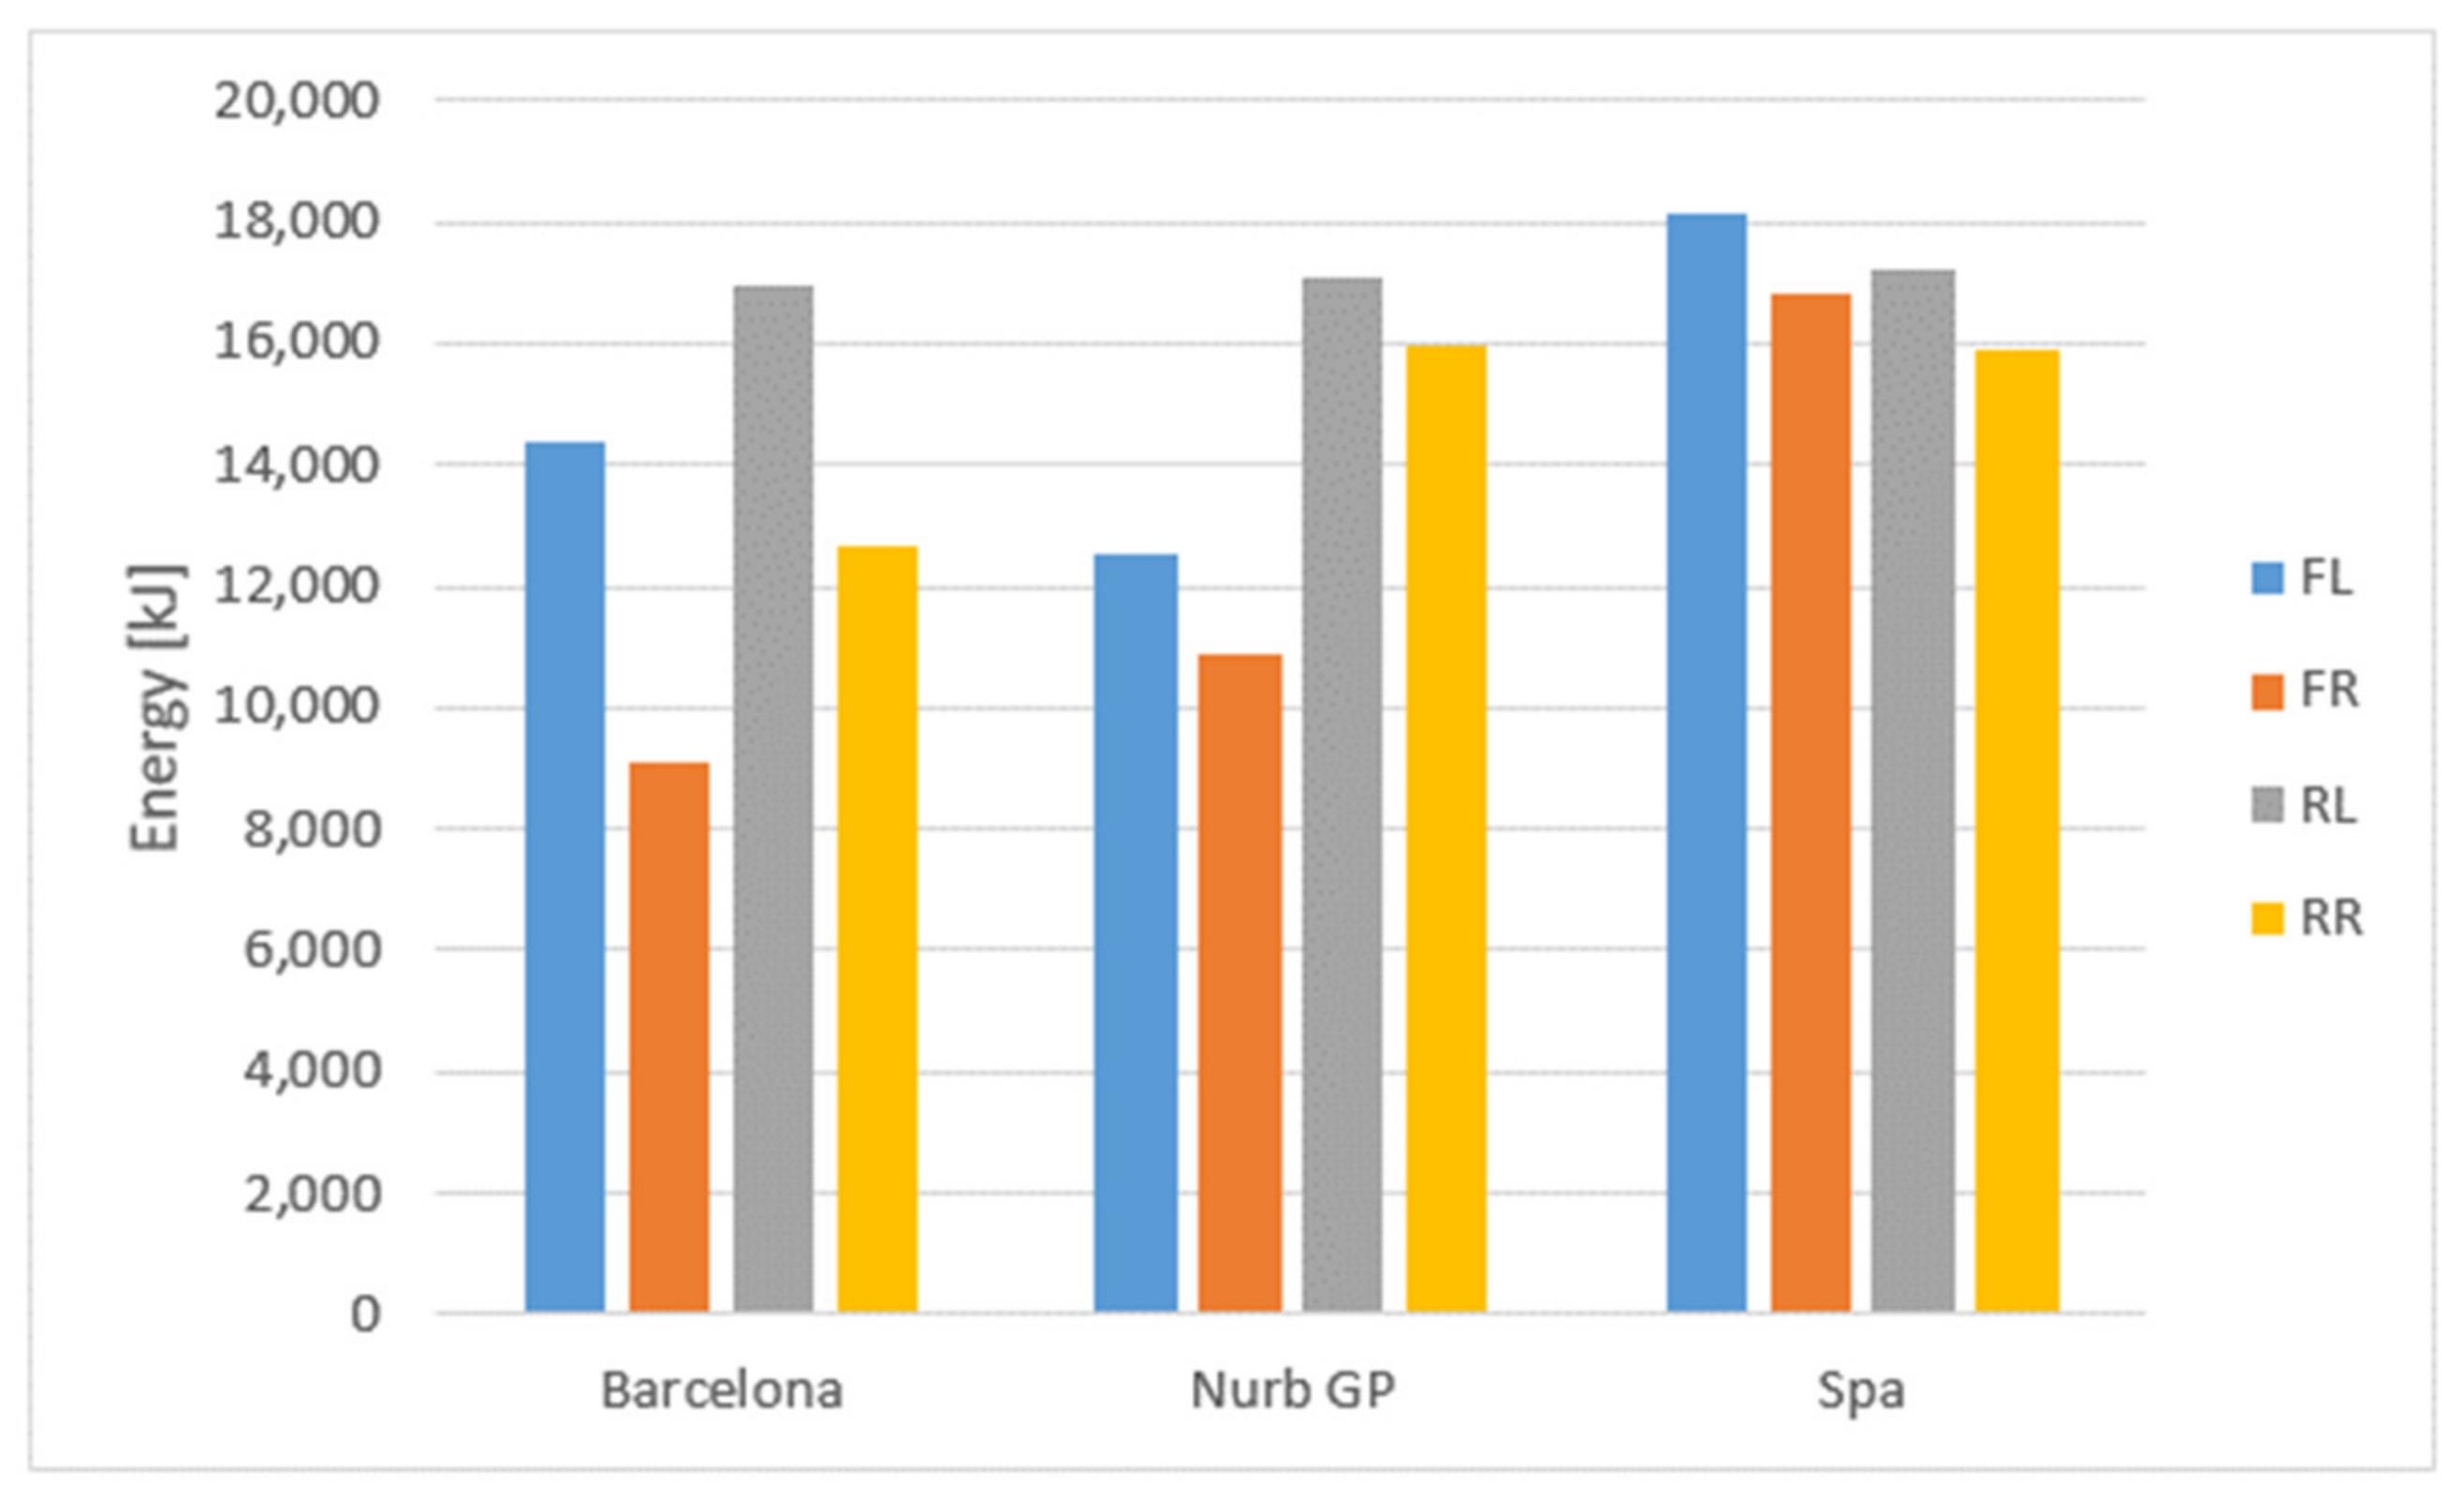
As mentioned above, tire wear depends on track layout and surface/grip, but major setup changes also play a key role. Thus, the figures below show the tire sliding energy sensitivity to these aspects.
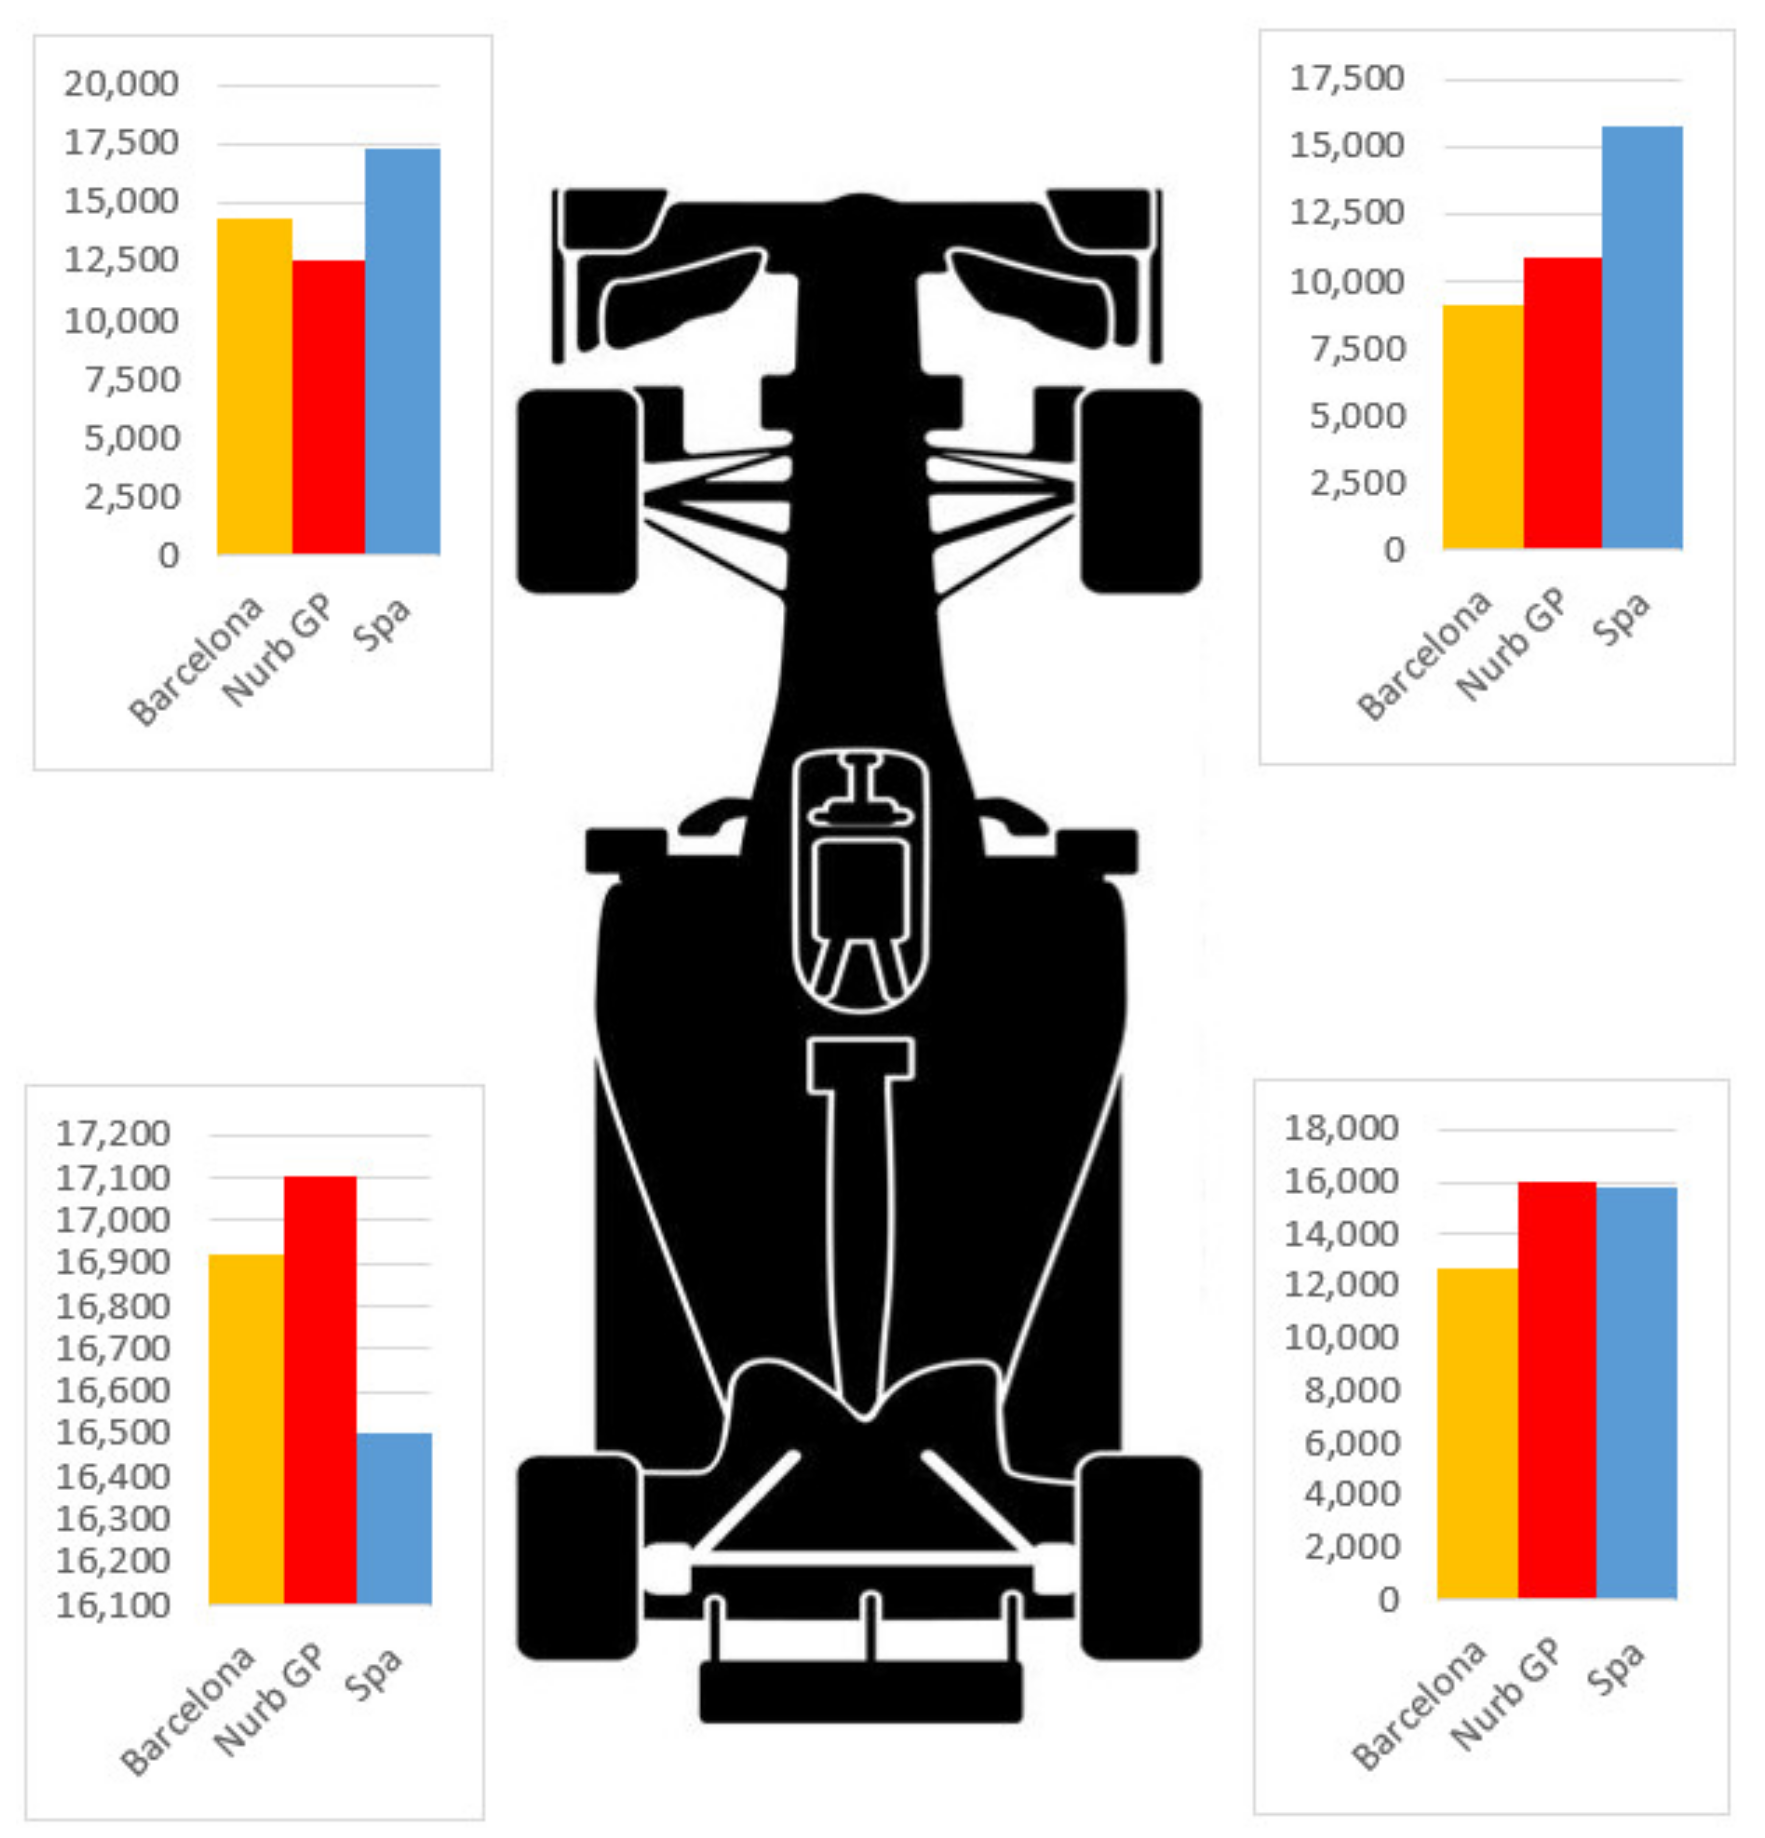
Figure 7,
Figure 8 and
Figure 9 report tire energy sensitivity to three different tracks while
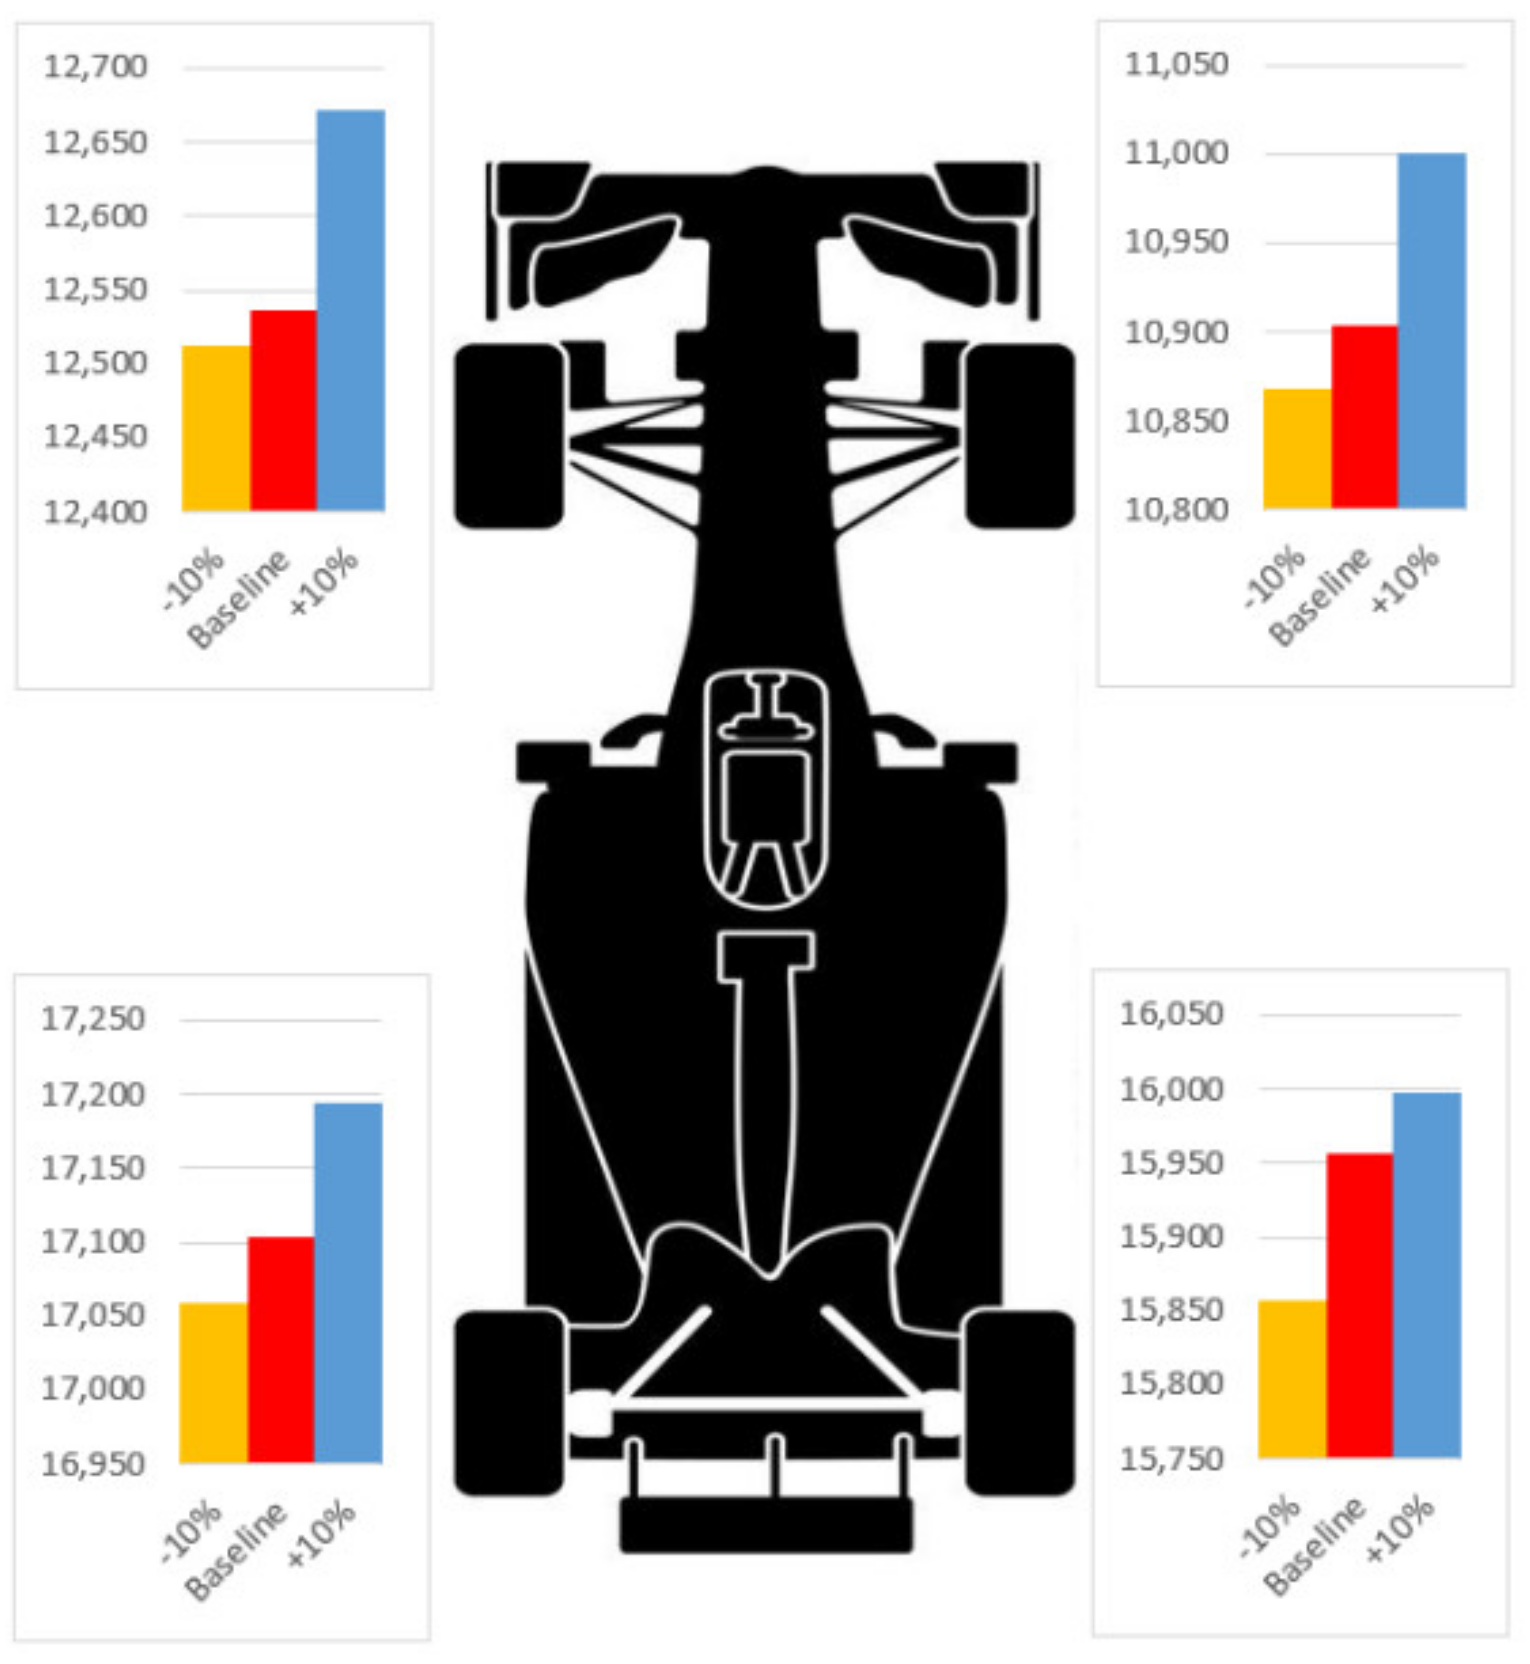
Figure 10,
Figure 11 and
Figure 12 show, respectively, tire energy sensitivity to three major setup changes such as roll stiffness distribution change, aero balance shift and different downforce levels. In each figure, tire energy is shown separately for each wheel.
Tire energy sensitivity represents a very useful tool to choose the baseline setup on each track. For example,
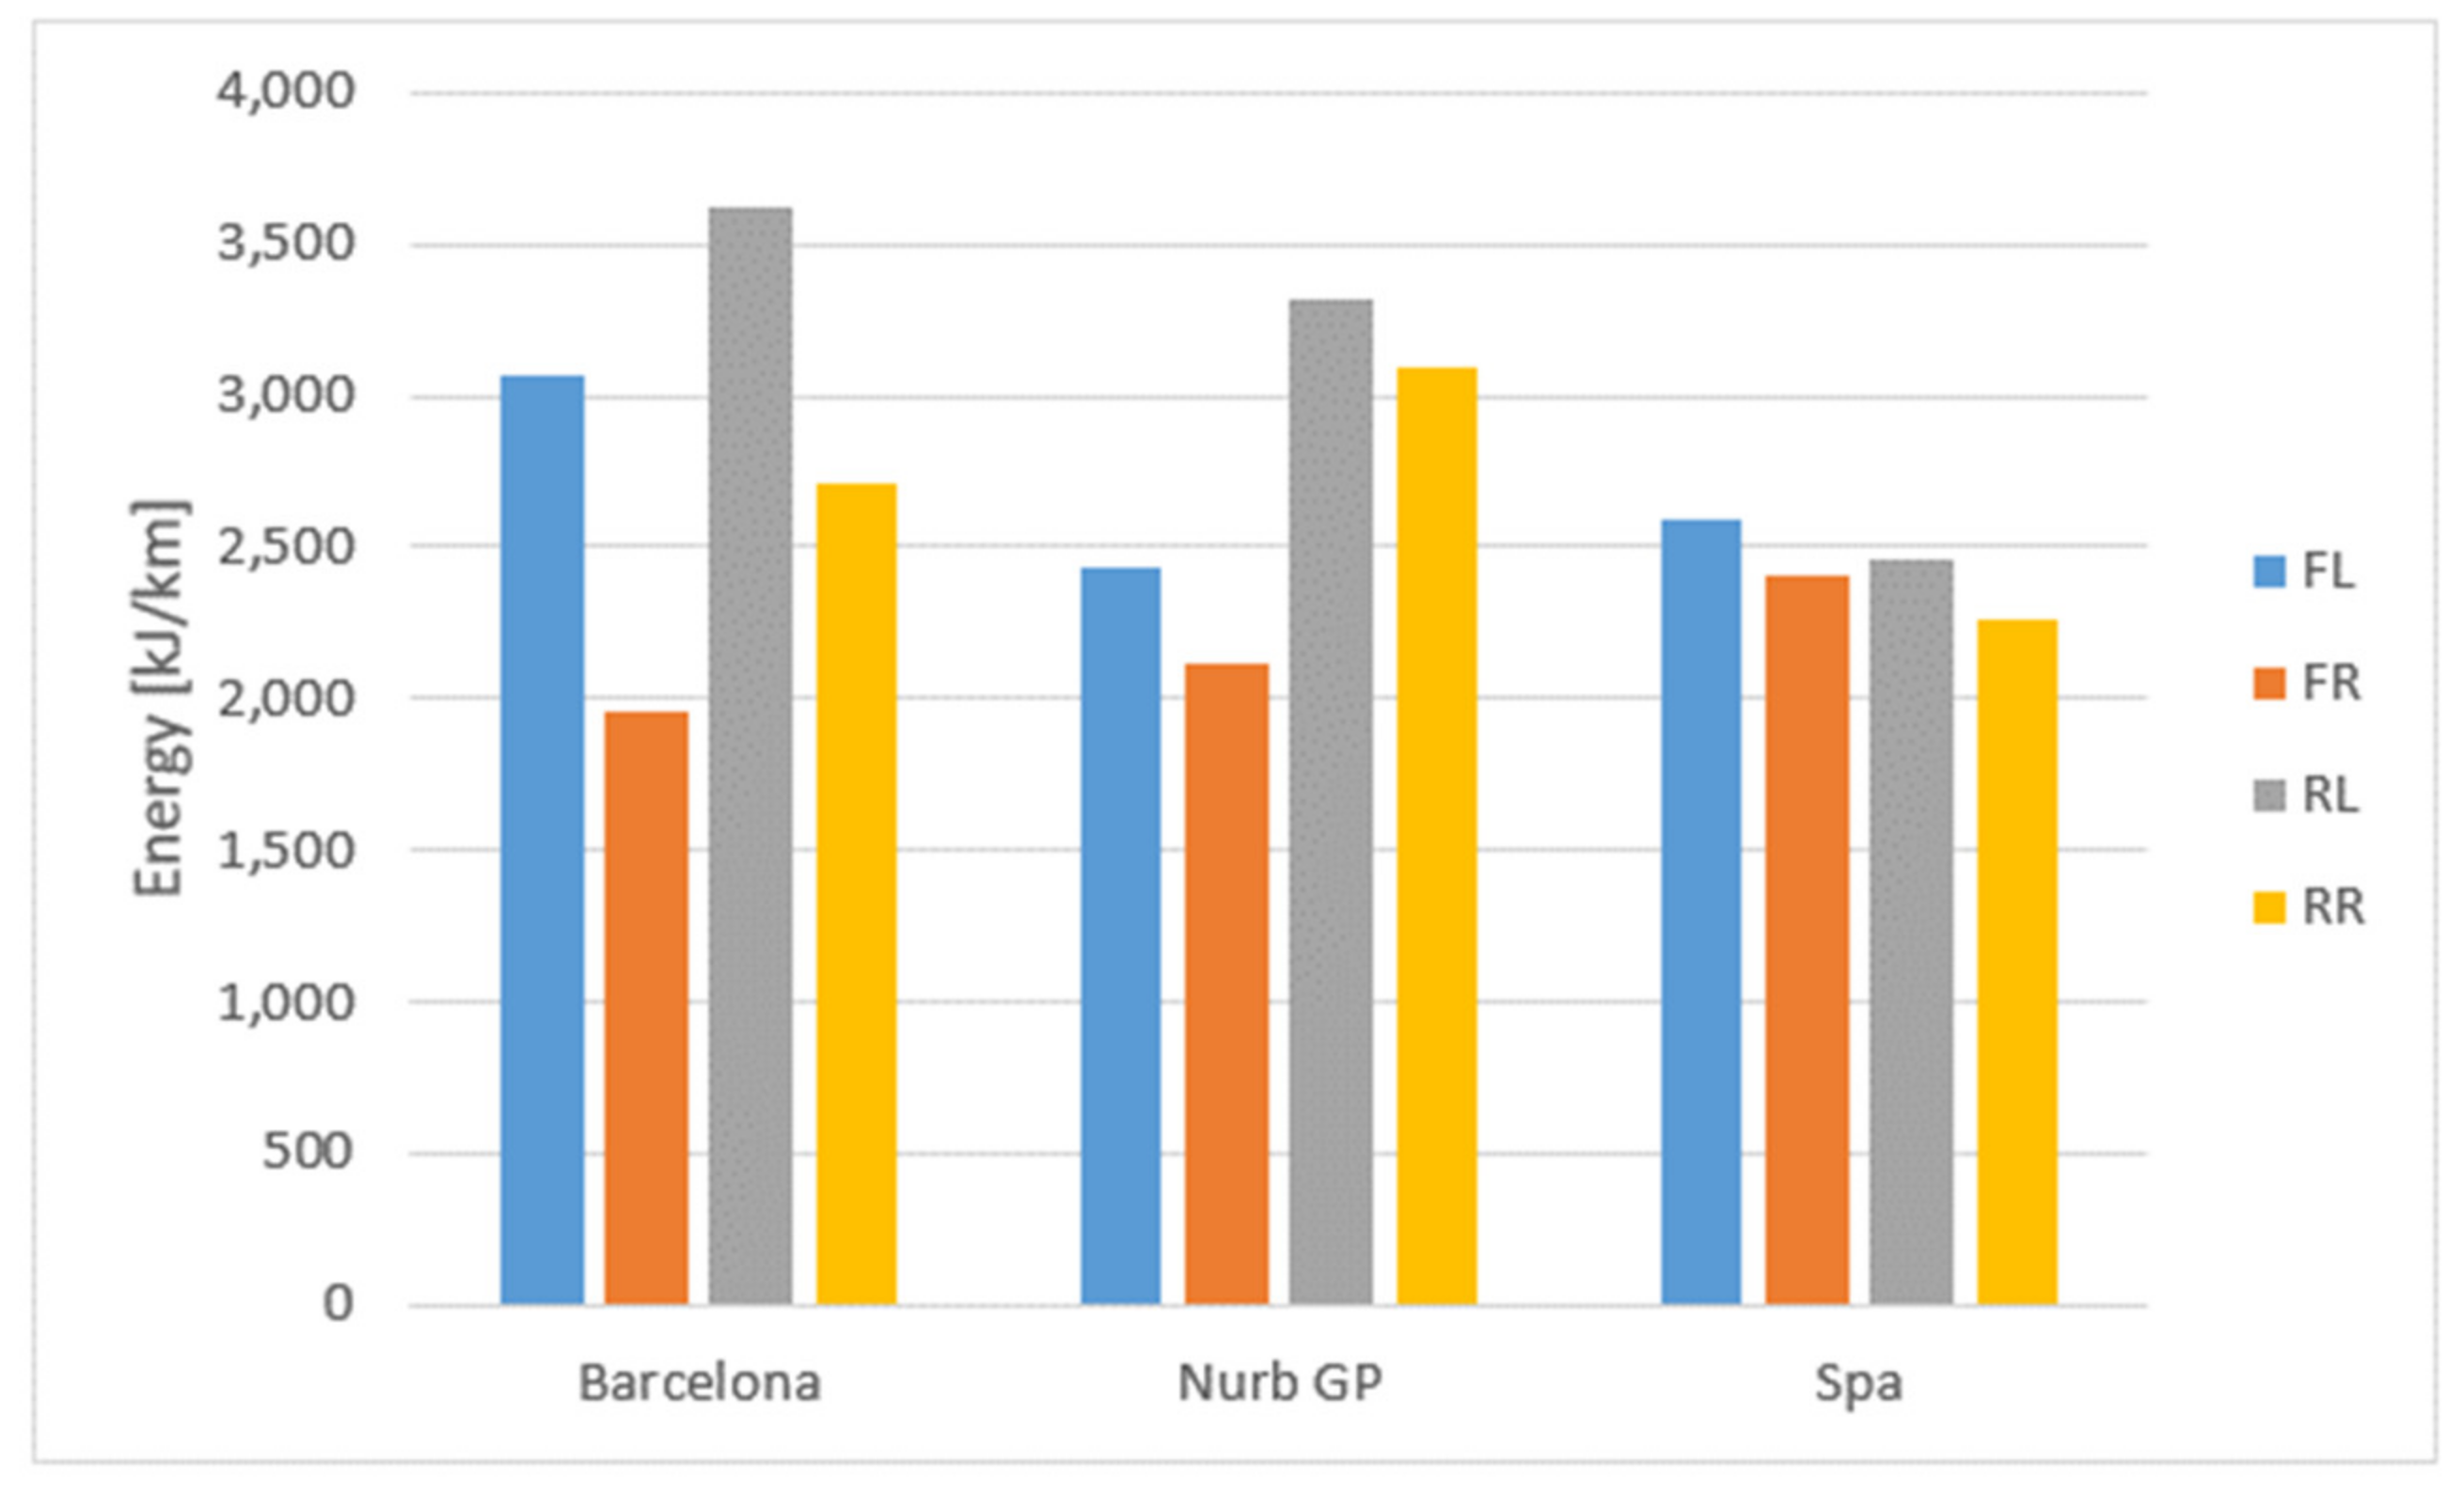
Figure 8 clearly shows that Barcelona requires highly asymmetric tire energy between the left and right side, thus suggesting the need of an asymmetrical setup. On the other hand, Spa seems the most demanding track in terms of energy required, but according to
Figure 9 which shows energy required per kilometer traveled, the most demanding is actually Nürburgring GP, suggesting a softer setup in order to avoid early wear on tires.
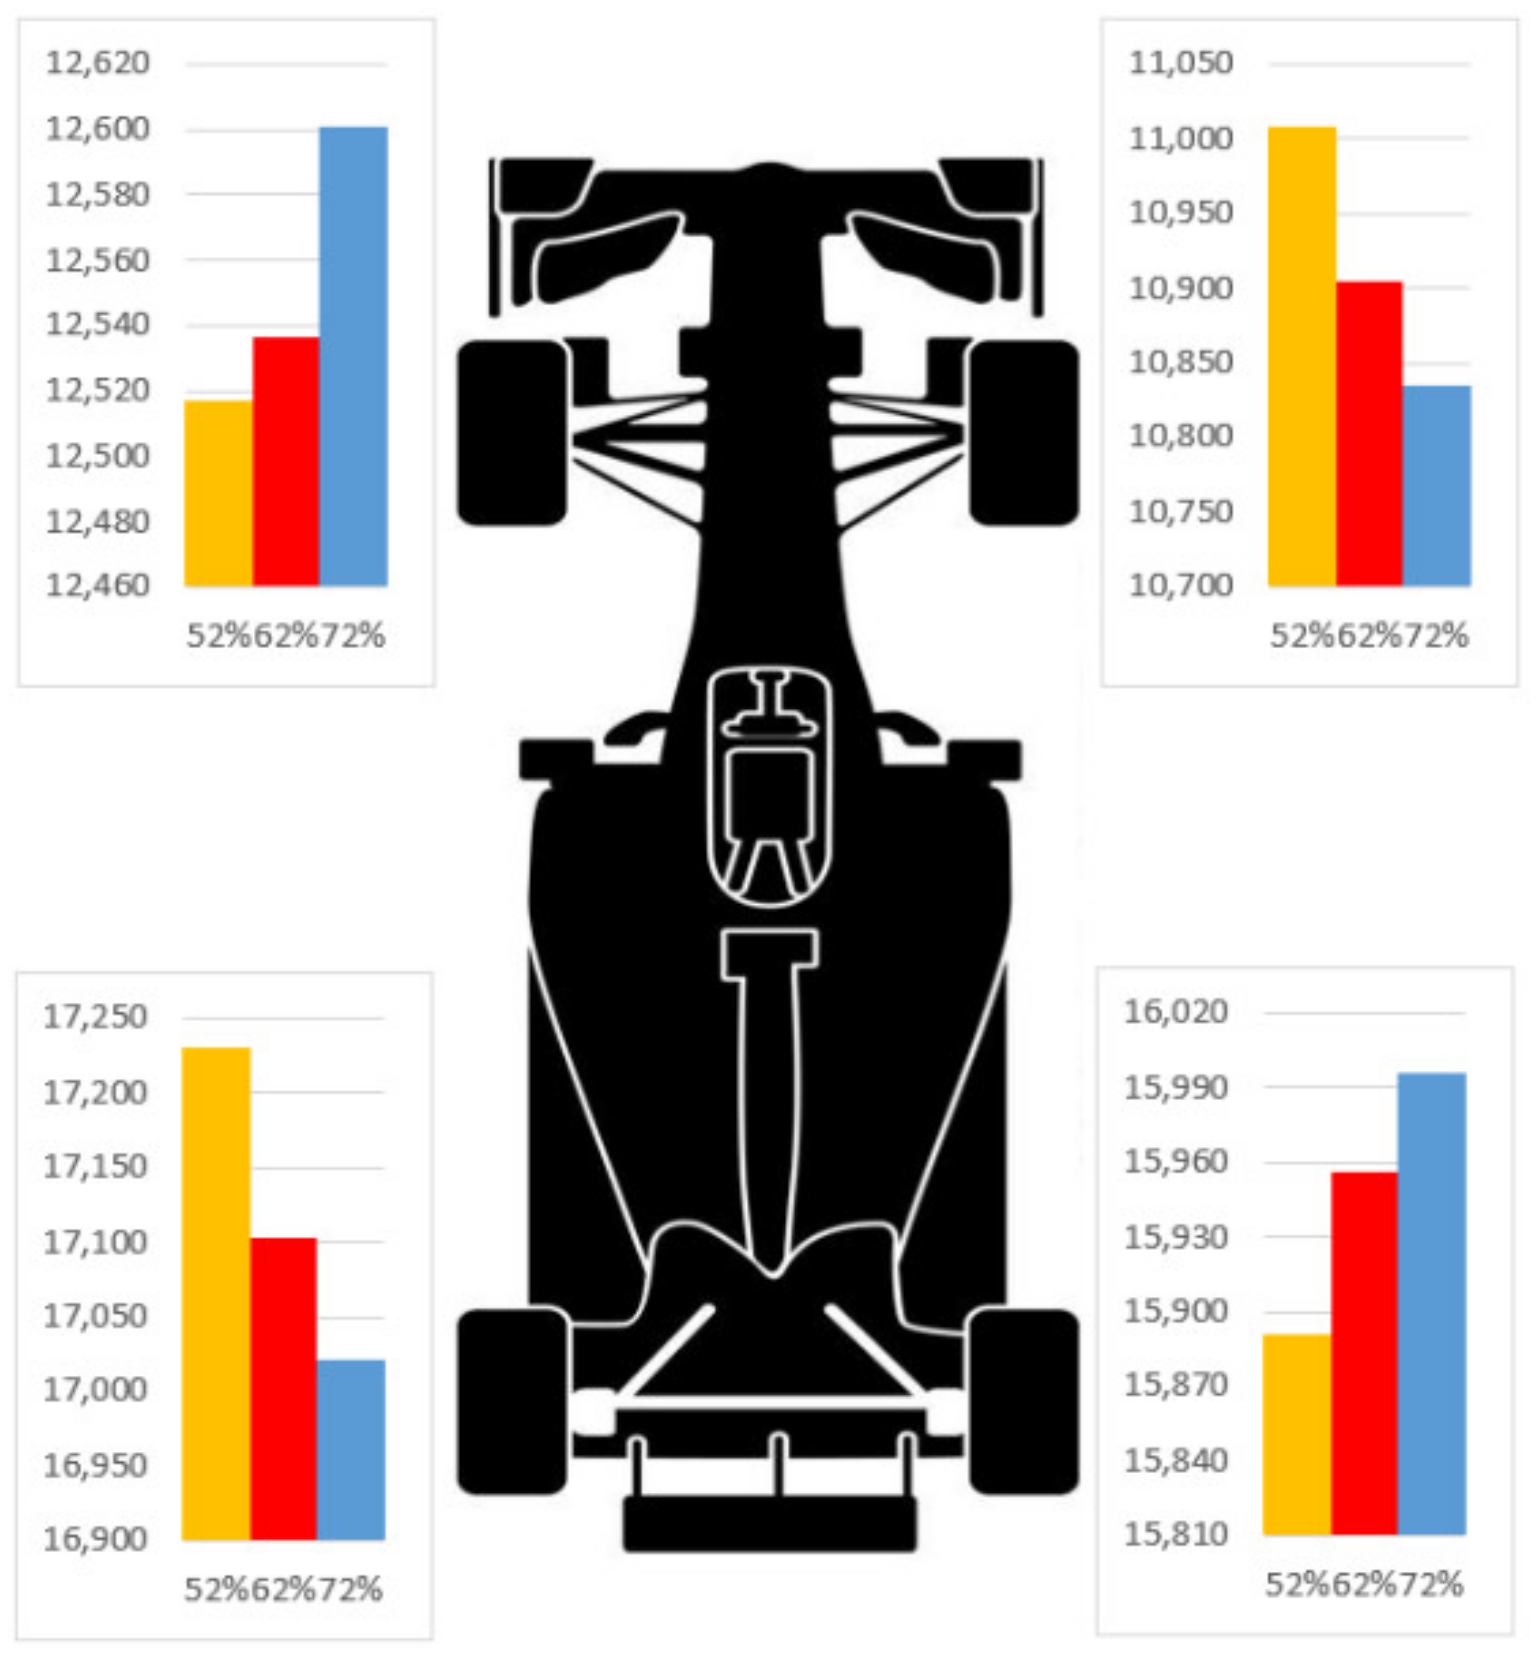
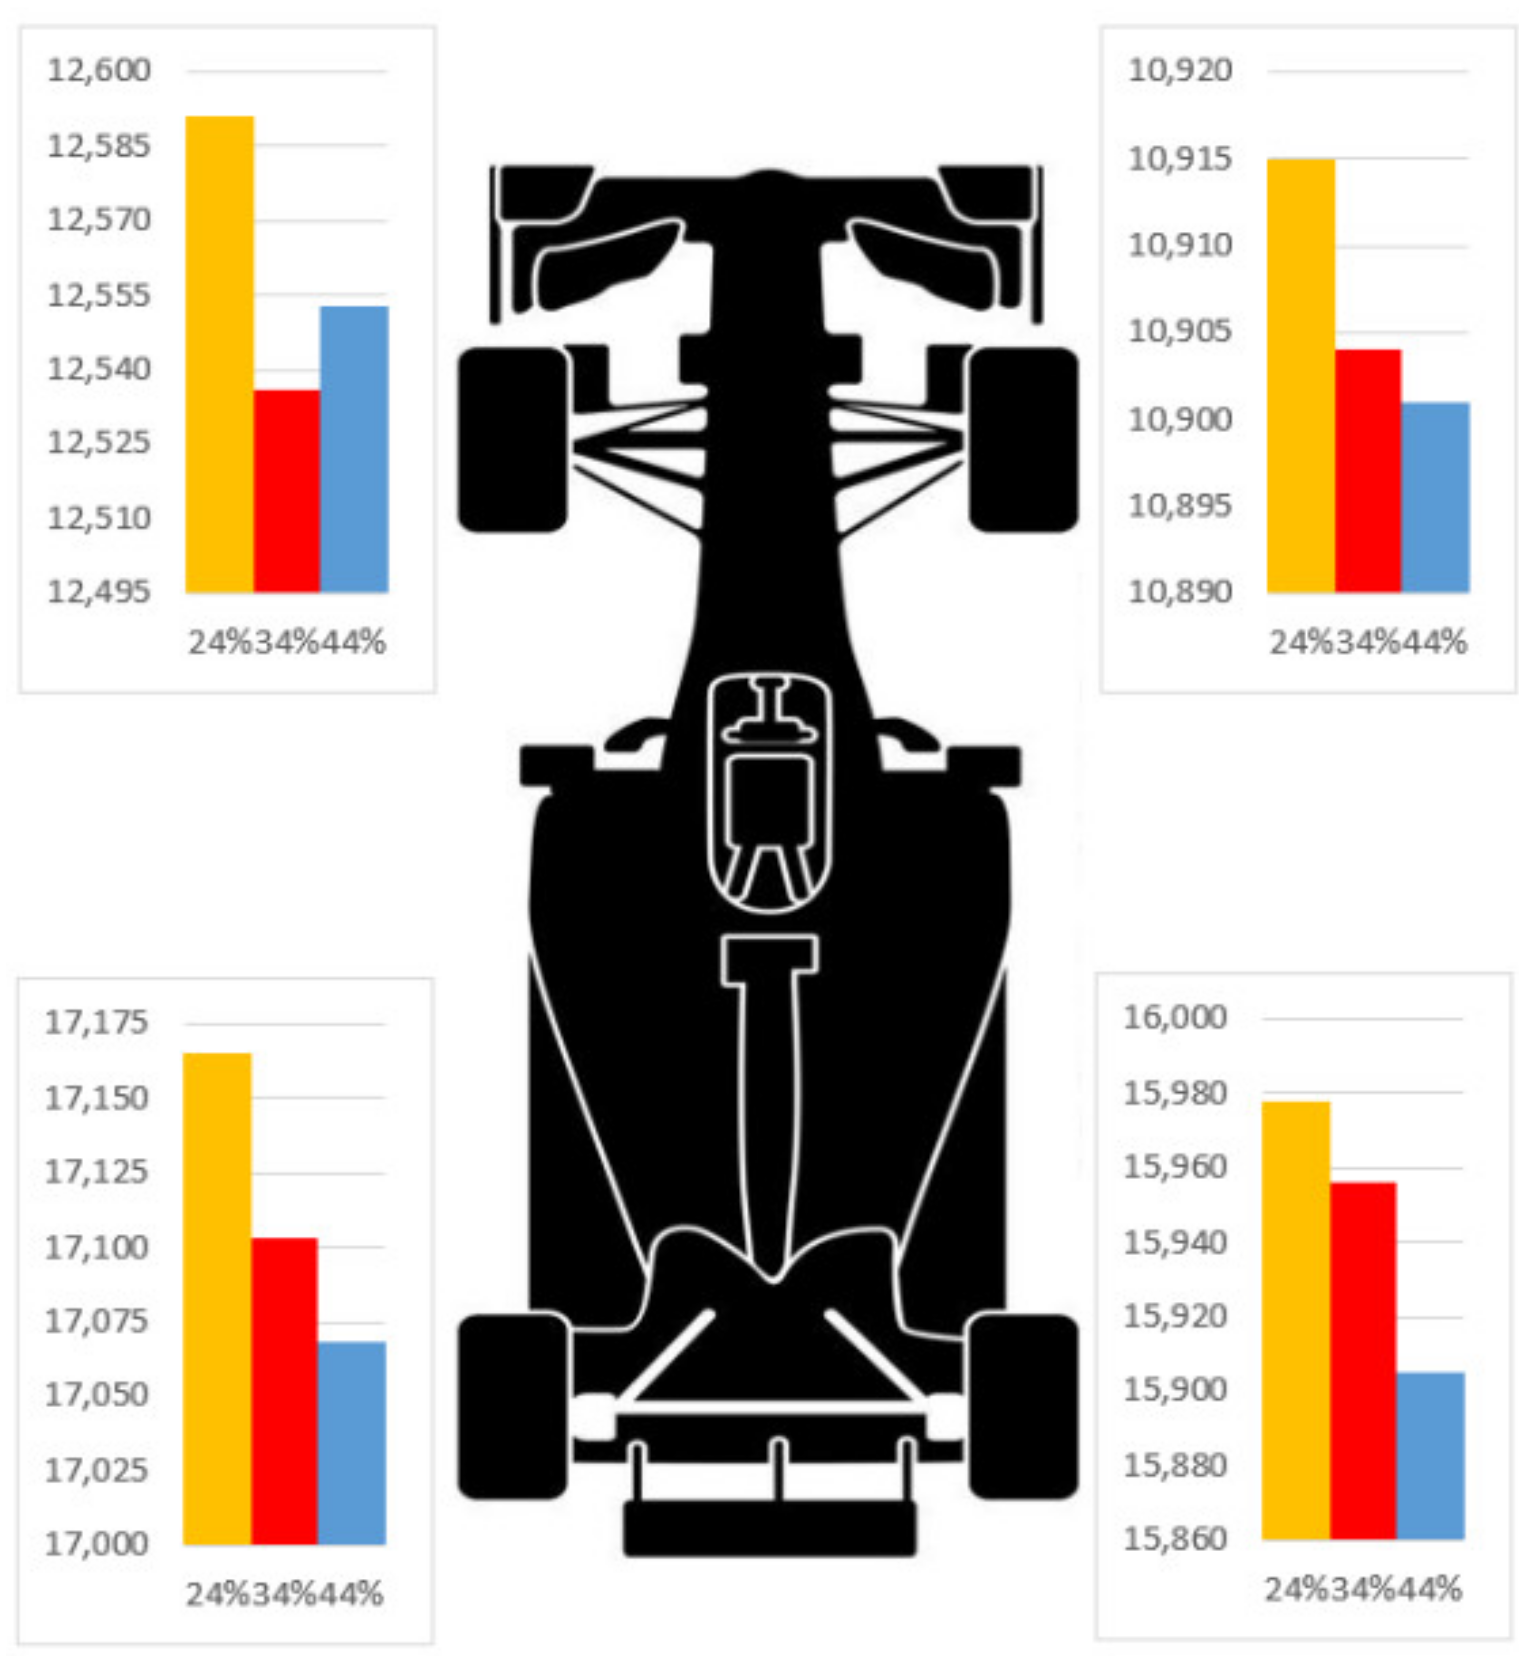
Figure 10,
Figure 11 and
Figure 12 show how a setup change impacts tire energy on the same track (Nürburgring GP). For example, 62% roll stiffness distribution to the front makes the tire energy more balanced over the four wheels (see
Figure 10), while using 24% front aero balance makes the overall tire energy higher, suggesting that the car on this setup is able better exploit his grip envelope (see
Figure 11).
Of course,
Figure 12 reports an increase of tire energy with the increase of the downforce level. The increase is not linear because the aeromaps are not liner as well.
4. Discussion
As discussed in
Section 1, the main target of this work was to provide a simple but effective tire energy estimation to help track-side engineers in managing tires, especially when they are limited in number during a race weekend, and to better understand the impact of a major setup change on tire performance.
The estimation method must be simple in order to keep computational burden low and be able to be embedded in data analysis tools used on track. Moreover, keeping it simple implies avoiding the need of expensive and non-conventional sensors which are most of the time forbidden by racing rules.
However, simplicity often leads to inaccuracy, as can be seen in
Figure 3. It has been chosen to estimate vertical forces using the actual component stiffness and calculate the roll stiffness distribution over the car, but damper effects have been neglected as a simple steady-state model has been used.
Nevertheless, estimation of lateral and longitudinal forces developed by the tires are more accurate and they can be considered acceptable for the purpose of this work, as can be seen in
Figure 4 and
Figure 5. Therefore, a good estimation of tire forces leads to a good estimation of the total sliding power (see Equations (40)–(47)) and hence tire energy. This is also proven by
Figure 6 showing a good correlation between simulated and estimated data.
Besides, the MAPE of the estimation results is always well below 10% if compared with VI-CRT simulation, as shown is
Section 3. However, a higher error would also be considered acceptable as this estimation method is mainly used to perform comparative studies and sensitivity analyses.
The sensitivity analysis to different tracks highlights quite well how the track layout itself impacts each tire. For example, on Nürburgring GP, the rear tires are more stressed than the front ones because of the many accelerations from slow speed needed to exit tight corners, while on Barcelona, the left tires are more stressed because of the many right-hander fast corners, some of them also requiring combined longitudinal and lateral energy. The energy of Spa looks on the other hand more balanced over the four tires with the overall energy level higher than the other two tracks. However, this is not true if we consider the energy per kilometer shown in
Figure 9.
Changing the roll stiffness distribution more to the front, or vice versa, moves the energy from one side to the other on both axles, but the total energy on the axle itself remains basically the same, as shown in
Figure 10. This can be expected as changing the roll stiffness distribution changes the load transfer distribution, but the overall load transfer remains the same.
Finally, increasing the overall downforce level increases the energy on all four tires as the vehicle gains more grip and hence is able to develop higher longitudinal and lateral accelerations.
As mentioned in
Section 1, this method is meant also to give quick answers to track-side engineers while working on track. Therefore, computational burden must be taken into account, and the model/method has to be light enough to be embedded in all the commonly used data analysis tools. It is well known that higher model complexity leads to higher computational burden; thus, the proposed the model has been kept as simple as possible in order to maintain acceptable results and low computational time at the same time.
Another limitation of this method can be seen in the sensor measurements. Even though only a simple set of sensors can be used to feed the proposed algorithm, such as accelerometers and wheel speed sensors, their accuracy and repeatability are key for the final result. In case tire energy is used to perform comparative analyses between different setups or different laps on the same car, sensor accuracy is not an issue as we can assume the same error occurs during all tests. On the other hand, a good repeatability in the measurements must always be guaranteed to ensure effectiveness of the proposed method.
5. Conclusions
This paper provides a simple and quick but effective estimation of the amount of energy a tire is subjected to, which is a neglected topic in the literature so far. This method has been conceived to be fed only by commonly used sensors such as accelerometers and wheel speed sensors while avoiding the need of complex vehicle modeling. A simple model leads to a low computational burden required, allowing this method to be embedded in all the commonly used data analysis tools during track-side operations.
Results have been compared to simulations performed using a state-of-the-art vehicle dynamics simulation software (namely VI-CarRealTime), proving the effectiveness of the estimation method proposed. Even though the simple steady-state model leads to some inaccuracies, they are mainly concerned with vertical load estimation as damper forces are neglected, and tire stiffness is considered linear. However, this is worth keeping the complexity low, and the mean absolute percentage error of the estimation results is in any case well below 10% (for all four tires) which is fully acceptable for the purpose of this work. Therefore, this estimation method can be considered appropriate as far as concerned for its purpose mentioned in
Section 1.
In order to further highlight the effectiveness of this method, sensitivity analyses have been carried out as well, showing that a different track layout stresses the tires in a different way, helping engineers to properly choose the appropriate car setup. As an example, on Nürburgring GP, rear tires are more stressed than fronts, while in Barcelona, left tires are subjected to much more energy than the right tires, suggesting in this case to consider an asymmetric setup. Moreover, playing on major setup items affects both the tire energy distribution over the four wheels and the overall level of energy, as this is the case when increasing or decreasing the downforce level of the vehicle. This is important information as higher overall energy impacts the tires’ capabilities to last longer and therefore to keep performance higher for longer.


