
Total System Performance Ratio—A Systems Based Approach for Evaluating HVAC System Efficiency †

Abstract
:1. Introduction
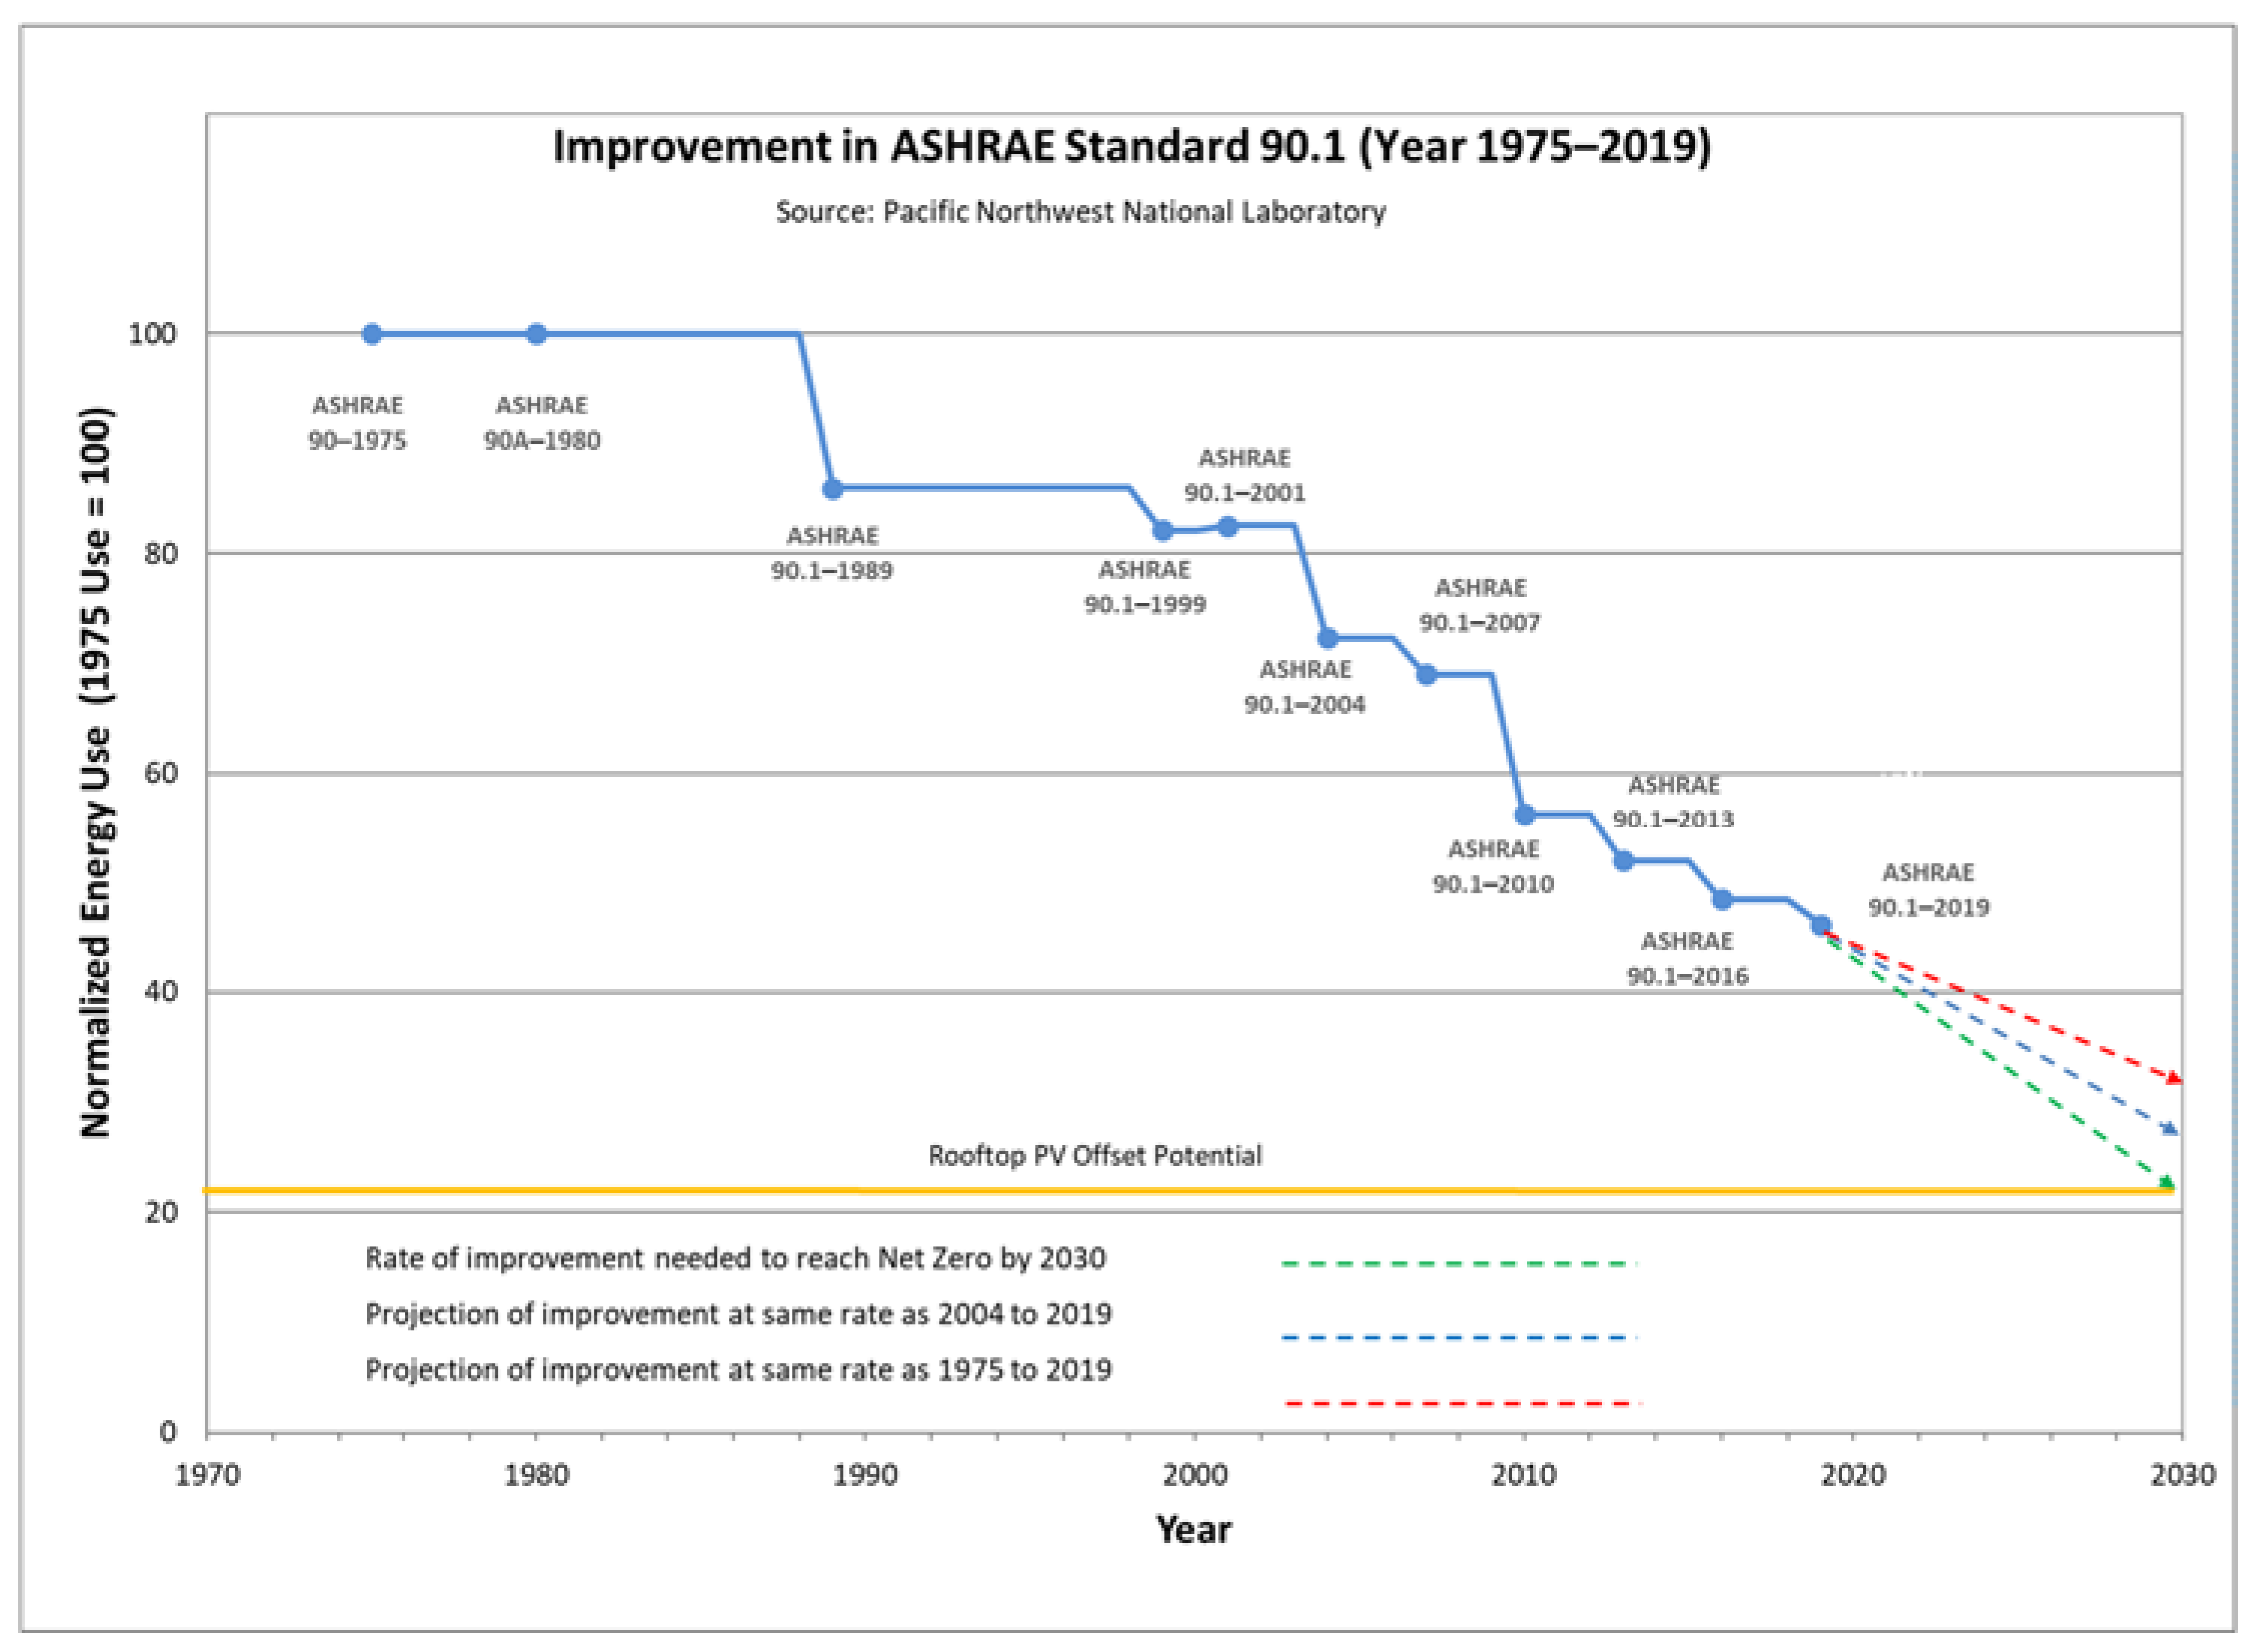
2. The Case for Performance
3. Total System Performance Ratio
3.1. Overview of Whole Building and System Performance Metrics
3.2. Definition and Calculation
- EHeating-Elec = heating electric energy consumption (kWh)
- ECooling = cooling electric energy consumption (kWh)
- EFan = fan electric energy consumption (kWh)
- EPump = pump electric energy consumption (kWh)
- EHeat-Rejection = heat rejection energy consumption (kWh)
- EHeat-Recovery = heat recovery energy consumption (kWh)
- EHeating-gas = heating gas energy consumption (therm)
4. HVAC System Performance Approach in the Washington State Energy Code
4.1. Modeling the Proposed Building Design
4.2. Establishing a Baseline Building Design HVAC System
- System configurations should include efficient, proven approaches that have been successfully installed in these building types in Washington State.
- Heating should be provided by heat pump technology.
- Space conditioning systems should include a fan that cycles on and off to meet loads and a separate dedicated outdoor air system (DOAS) that includes sensible energy recovery.
- All system parameters should at least meet prescriptive code requirements and exceed those requirements where standard practice dictates. For example, fan power and sensible recovery effectiveness are better than required prescriptively.
5. HVAC System Performance Implementation in the Building Energy Asset Score Tool
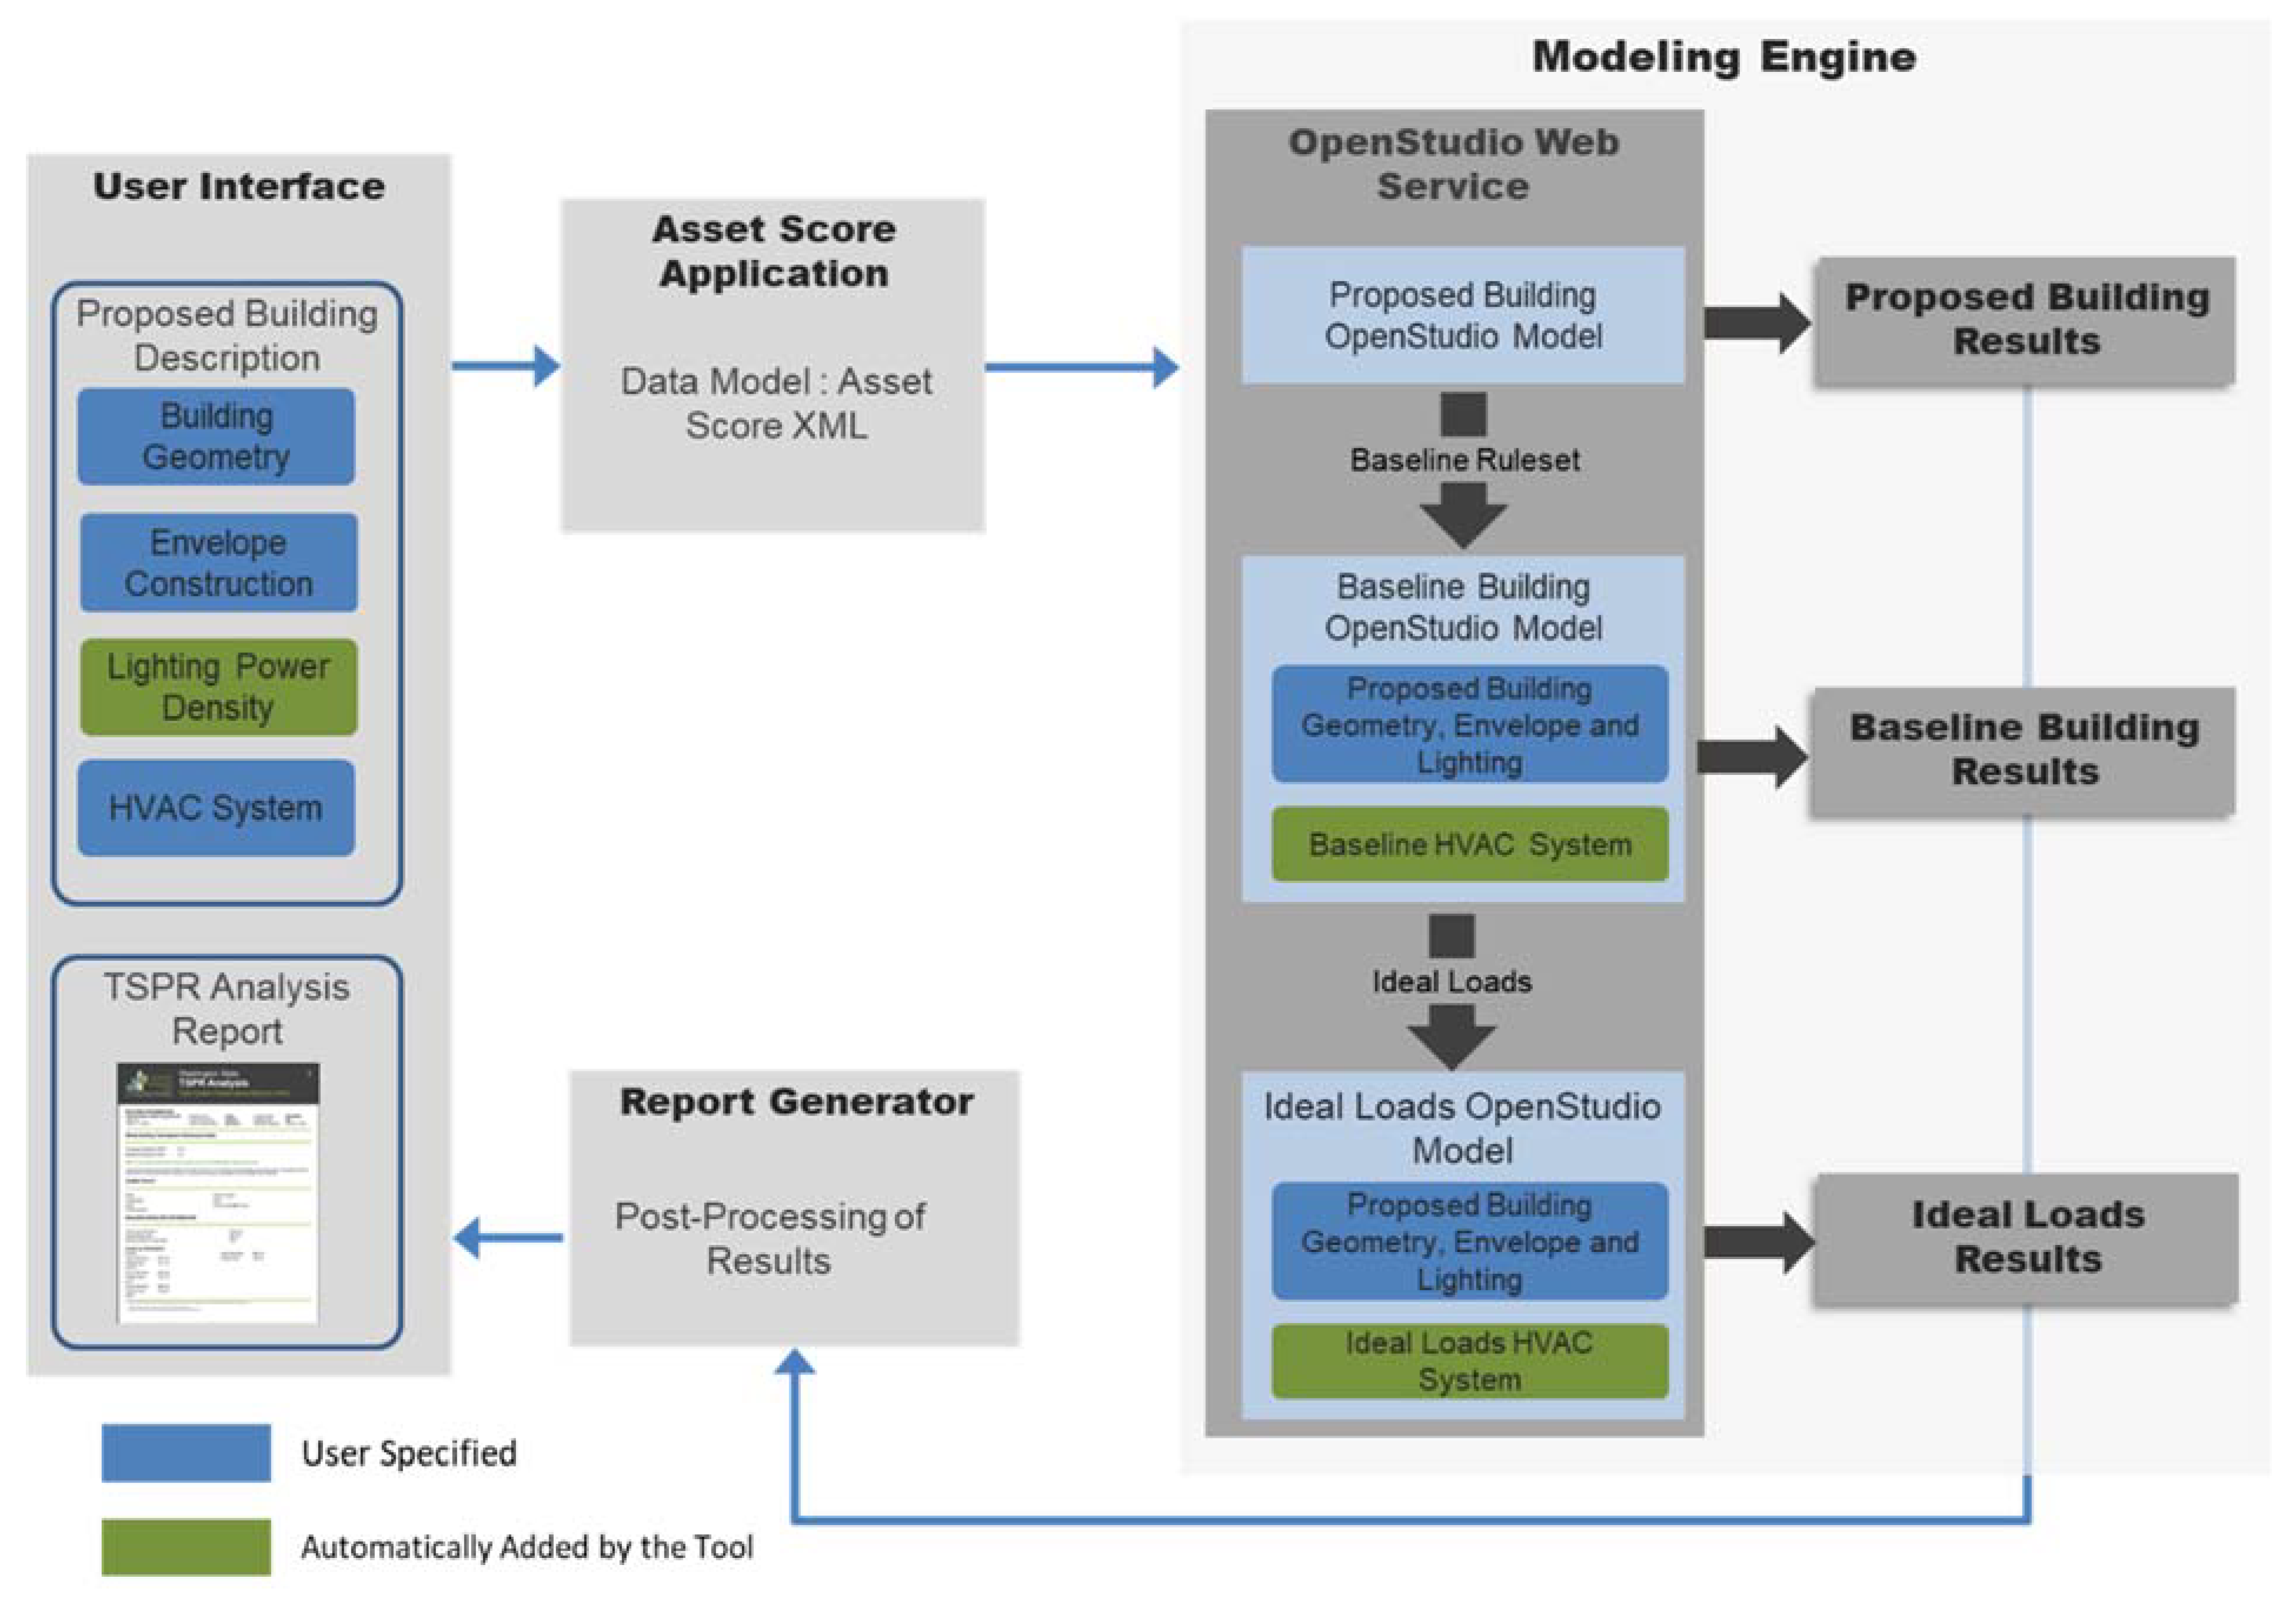
5.1. Asset Score Tool Architecture
5.2. HVAC System Performance Analysis Workflow
6. Validation of the HVAC System Performance Approach and the Simplified Analysis Tool
6.1. Validation of the Simplified Energy Modeling Approach
6.1.1. Model Geometry and Thermal Zoning Simplifications
6.1.2. Schedules
6.1.3. Internal Loads
6.1.4. HVAC
6.2. Validation of the TSPR Approach
7. Conclusions
Author Contributions
Funding
Institutional Review Board Statement
Informed Consent Statement
Data Availability Statement
Conflicts of Interest
Abbreviations
| AEO | Annual Energy Outlook |
| AFUE | Annual Fuel Utilization Efficiency |
| AIA | American Institute of Architects |
| ASHRAE | American Society of Heating, Refrigeration, and Air-Conditioning Engineers |
| CAV | Constant Air Volume |
| CFM | Cubic Feet per Minute |
| CHW | Chilled Water |
| COP | Coefficient of Performance |
| COPnf | Coefficient of Performance No Fan |
| DCV | Demand Control Ventilation |
| DOAS | Dedicated Outdoor Air System |
| DX | Direct Expansion |
| EER | Energy Efficiency Ratio |
| EIA | U.S. Energy Information Administration |
| ERV | Energy Recovery Ventilation |
| Et | Thermal Efficiency |
| FCU | Fan Coil Unit |
| GPM | Gallons per Minute |
| HP | Horsepower |
| HSPF | Heating Seasonal Performance Factor |
| HVAC | Heating, Ventilation, and Air-Conditioning |
| HvacPD | Heating, Ventilation, and Air-Conditioning Power Density |
| HW | Hot Water |
| ICC | International Energy Conservation Code |
| IPLV | Integrated Part Load Value |
| kWh | Kilowatt Hour |
| MDP | Minimum Damper Position |
| PNNL | Pacific Northwest National Laboratory |
| PSZ HP | Packaged Single Zone Heat Pump |
| SAT | Supply Air Temperature |
| SEER | Season Energy Efficiency Ratio |
| TSPR | Total System Performance Ratio |
| VAV | Variable Air Volume |
| VRF | Variable Refrigerant Flow |
| VSD | Variable Speed Drive |
| WLHP | Water-loop Heat Pump |
| WSEC | Washington State Energy Code |
| WSHP | Water-source Heat Pump |
References
- ASHRAE (American Society of Heating, Refrigeration and Air-Conditioning Engineers). ASHRAE Standard 90-75, Energy Conservation in New Building Design; American Society of Heating, Refrigerating and Air-Conditioning Engineers: Atlanta, GA, USA, 1975. [Google Scholar]
- Jonlin, D.; Thornton, B.; Rosenberg, M.I. Can high performance equipment lead to a low-performing building? In Proceedings of the 2016 ACEEE Summer Study on Energy Efficiency in Buildings, Washington, DC, USA, 21–26 August 2016. [Google Scholar]
- ASHRAE. ANSI/ASHRAE/IESNA Standard 90.1-2019—Energy Efficient Design of New Low-Rise Residential Buildings; American Society of Heating, Refrigerating and Air-Conditioning Engineers: Atlanta, GA, USA, 2019. [Google Scholar]
- ICC. 2018 International Energy Conservation Code; International Code Council: Washington, DC, USA, 2018. [Google Scholar]
- WSEC. Washington State Energy Code, 2018. Washington State Building Code Council, 2018. Available online: https://sbcc.wa.gov/sites/default/files/2020-04/2018%20WSEC_C%202nd%20print.pdf (accessed on 20 November 2020).
- AIA (American Institute of Architects). “The 2030 Challenge” 2030 Inc. 2011. Available online: http://www.architecture2030.org/2030_challenge/the_2030_challenge (accessed on 21 March 2021).
- ASHRAE (American Society of Heating, Refrigerating and Air-Conditioning Engineers). ASHRAE Vision 2020: Providing Tools by 2020 that Enable the Building Community to Produce Market-Viable NZEBs by 2030; American Society of Heating, Refrigerating and Air-Conditioning Engineers: Atlanta, GA, USA, 2008. [Google Scholar]
- Franconi, E.; Lerond, J.; Nambiar, C.; Kim, D.; Winiarski, D.; Rosenberg, M. Filling the Efficiency Gap to Achieve Zero Energy Buildings with Energy Codes (PNNL-30547); Pacific Northwest National Laboratory: Richland, WA, USA, 2021; publication pending. [Google Scholar]
- Rosenberg, M.; Hart, R.; Zhang, J.; Athalye, R. Roadmap for the Future of Commercial Energy Codes; Pacific Northwest National Lab.: Richland, WA, USA, 2015. [Google Scholar]
- Li, H.; Hong, T.; Lee, S.H.; Sofos, M. System Level Key Performance Indicators for Building Performance Evaluation; Lawrence Berkely National Laboratory: Berkely, CA, USA, 2020. Available online: https://eta-publications.lbl.gov/sites/default/files/system-level_key_performance_indicators.pdf. (accessed on 20 June 2021).
- CGBC 2017. Zero Carbon Building Energy Modeling Guidelines. Canadian Green Building Council, 2017. Available online: https://www.cagbc.org/cagbcdocs/zerocarbon/CaGBC_EMG_for_ZCB_v01.pdf (accessed on 20 June 2021).
- Rosenberg, M.; Goel, S.; Tillou, M. Paving the way for net zero energy codes through performance based approaches. In Proceedings of the 2020 ACEEE Summer Study on Energy Efficiency in Buildings, Asilomar, CA, USA, 17–21 August 2020. [Google Scholar]
- Kavanaugh, S.P.; Lambert, S.; Devin, N. HVAC power density an alternate path to efficiency. ASHRAE J. 2006, 48, 40. [Google Scholar]
- Jonlin, D.; Rosenberg, M.I.; Goel, S. TSPR: The Total System Performance Ratio as a metric for HVAC system efficiency. In Proceedings of the 2018 ACEEE Summer Study on Energy Efficiency in Buildings, Asilomar, CA, USA, 12–17 August 2018. [Google Scholar]
- Goel, S.; Wang, N.; Rosenberg, M.; Mendon, V. Performance-based building system evaluation for DOE energy asset score. In Proceedings of the ASHRAE Annual Conference, Atlanta, GA, USA, 28 June–2 July 2014. [Google Scholar]
- Pérez-Lombard, L.; Ortiz, J.; Maestre, I.R.; Coronel, J.F. Constructing HVAC energy efficiency indicators. Energy Build. 2012, 47, 619–629. [Google Scholar] [CrossRef]
- Wang, L. Measuring Whole Building HVAC System Energy Efficiency. Master’s Thesis, Texas A&M University, College Station, TX, USA, 2015. Available online: https://oaktrust.library.tamu.edu/bitstream/handle/1969.1/155683/WANG-THESIS-2015.pdf?sequence=1 (accessed on 20 June 2021).
- Liao, J.; Claridge, D.E. Analysis of whole-building HVAC system energy efficiency. ASHRAE Trans. 2018, 124, 72–87. [Google Scholar]
- Kreider, J.F.; Rabl, A. Heating and Cooling of Buildings: Design for Efficiency; McGrawHill: New York, NY, USA, 1994. [Google Scholar]
- U.S. Energy Information Administration. Annual Energy Outlook 2020; Energy Information Administration of U.S. Department of Energy: Washington, DC, USA, 2020. Available online: https://www.eia.gov/outlooks/aeo (accessed on 20 June 2021).
- EnergyPlus. 2018. Available online: https://energyplus.net/ (accessed on 20 March 2018).
- WSEC. Washington State Energy Code; International Code Council: Country Club Hills, IL, USA, 2015. [Google Scholar]
- Lei, X.; Butzbaugh, J.B.; Chen, Y.; Zhang, J.; Rosenberg, M.I. Development of National New Construction Weighting Factors for the Commercial Building Prototype Analyses (2003–2018), PNNL-29787; Pacific Northwest National Laboratory: Richland, WA, USA, 2020. Available online: https://www.osti.gov/servlets/purl/1660807 (accessed on 20 June 2021).
- DOE. Building Energy Asset Score; U.S. Department of Energy: Washington, DC, USA, 2018. Available online: https://www.energy.gov/eere/buildings/building-energy-asset-score (accessed on 21 March 2018).
- Wang, N.; Goel, S.; Makhmalbaf, A.; Long, N. Development of building energy asset rating using stock modeling in the USA. J. Build. Perform. Simul. 2016, 11, 4–18. [Google Scholar] [CrossRef]
- OpenStudio. 2018. Available online: https://openstudio.net (accessed on 20 March 2018).
- Thornton, B.A.; Sullivan, G.P.; Rosenberg, M.I.; Baechler, M.C. Preserving Envelope Efficiency in Performance Based Code Compliance; Pacific Northwest National Laboratory: Richland, WA, USA, 2015. Available online: http://www.pnnl.gov/main/publications/external/technical_reports/PNNL-24359.pdf (accessed on 20 June 2021).
- PNNL. 2021. Available online: https://www.energycodes.gov/development/commercial/prototype_models (accessed on 21 March 2021).


| (a) | ||
| Type | CO2e (lb/Unit) | Unit |
| Electricity | 0.70 | kWh |
| Natural Gas | 11.70 | Therm |
| Oil | 19.2 | Gallon |
| Propane | 10.5 | Gallon |
| (b) | ||
| Type | CO2e (kg/Unit) | Unit |
| Electricity | 0.09 | MJ |
| Natural Gas | 0.05 | MJ |
| Oil | 2301 | m3 |
| Propane | 1258 | m3 |
| Building Type Parameter | Large Office | Small Office | Retail | School |
|---|---|---|---|---|
| System Type | Water-source heat pump | Packaged air-source heat pump | Packaged air-source heat pump | Packaged air-source heat pump |
| Primary Heating and Cooling System | ||||
| Fan Control | Cycle on load | Cycle on load | Cycle on load | Cycle on load |
| Space Condition Fan Power | 0.528 W/CFM (1119 W per m3/s) | 0.528 W/CFM (1119 W per m3/s) | 0.522 W/CFM (1106 W per m3/s) | 0.528 W/CFM (1119 W per m3/s) |
| Fan Total Static Pressure | 2.5″ in w.g. (622.7 Pa) | 2.5″ in w.g. (622.7 Pa) | 2.5″ in w.g. (622.7 Pa) | 2.5″ in w.g. (622.7 Pa) |
| Fan/Motor Efficiency | 65%/85.5% | 65%/85.5% | 65%/86.5% | 65%/85.5% |
| Supplemental Heating Availability | NA | <40 °F (<4.4 °C) | <40 °F (<4.4 °C) | <40 °F (<4.4 °C) |
| Unit Size as Basis for Efficiency (Cooling) | 17–65 MBh (4982–19,050 W) | <65 MBh (19,050 W) | 65–135 MBh (19,050–39,565 W) | <65 MBh (19,050 W) |
| Cooling COP (Net of fan) a | 4.46 | 3.83 | 4.25 | 3.83 |
| Heating COP (Net of fan) a | 4.61 | 3.81 | 3.57 | 3.81 |
| Cooling Source | DX (heat pump) | DX (heat pump) | DX (heat pump) | DX (heat pump) |
| Heat Source | Heat Pump | Heat Pump | Heat Pump | Heat Pump |
| Cooling Tower Efficiency | 40.2 GPM/HP (3.401 m3/s per MW) | NA | NA | NA |
| WSHP Loop Heat Source, Efficiency | Gas Boiler, 80% Et | NA | NA | NA |
| WSHP Loop Heat Rejection c | Cooling Tower | NA | NA | NA |
| WSHP Loop Temperature Control | 50 °F to 70 °F (10 °C to 21.1 °C) | |||
| WSHP Cooling Tower Efficiency | 40.2 GPM/HP (3.401 m3/MJ) | NA | NA | NA |
| WSHP Pump Power (W/GPM) | 16.1 W/GPM (353,605 W per m3/s) | NA | NA | NA |
| Pump Head | 60 ft (179.3 kPa) | NA | NA | NA |
| Pump Efficiency/Motor Efficiency | 78%/90% | NA | NA | NA |
| WSHP Loop Pumping Control | VSD Pump | NA | NA | NA |
| Outside Air Economizer b | No | No | Yes | Yes |
| ERV (Yes/No/NA) | NA | NA | NA | NA |
| DCV (Yes/No) | No | No | No | No |
| Ventilation System | ||||
| Occupied Ventilation Source | DOAS | DOAS | DOAS | DOAS |
| Total DOAS Fan Power (W/CFM) | 0.819 W/CFM (1735 W per m3/s) | 0.819 W/CFM (1735 W per m3/s) | 0.730 W/CFM (1547 W per m3/s) | 0.742 W/CFM (1572 W per m3/s) |
| DOAS Fan Total Static Pressure, in. w.g. (Each Air Stream) | 1.84″ (458.3 Pa) | 1.84″ (458.3 Pa) | 1.84″ (458.3 Pa) | 1.84″ (458.3 Pa) |
| DOAS or Ventilation Fan/Motor Efficiency | 65.0%/81.1% | 65.0%/81.1% | 65.0%/91.0% | 65.0%/89.5% |
| DOAS Sensible Effectiveness | 70% | 70% | 70% | 70% |
| DOAS Supplemental heat/cool | No | No | No | No |
| DOAS Supply Temperature Control d | Bypass | Wild | Bypass | Bypass |
| DOAS ERV Economize Lockout | Yes | No | Yes | Yes |
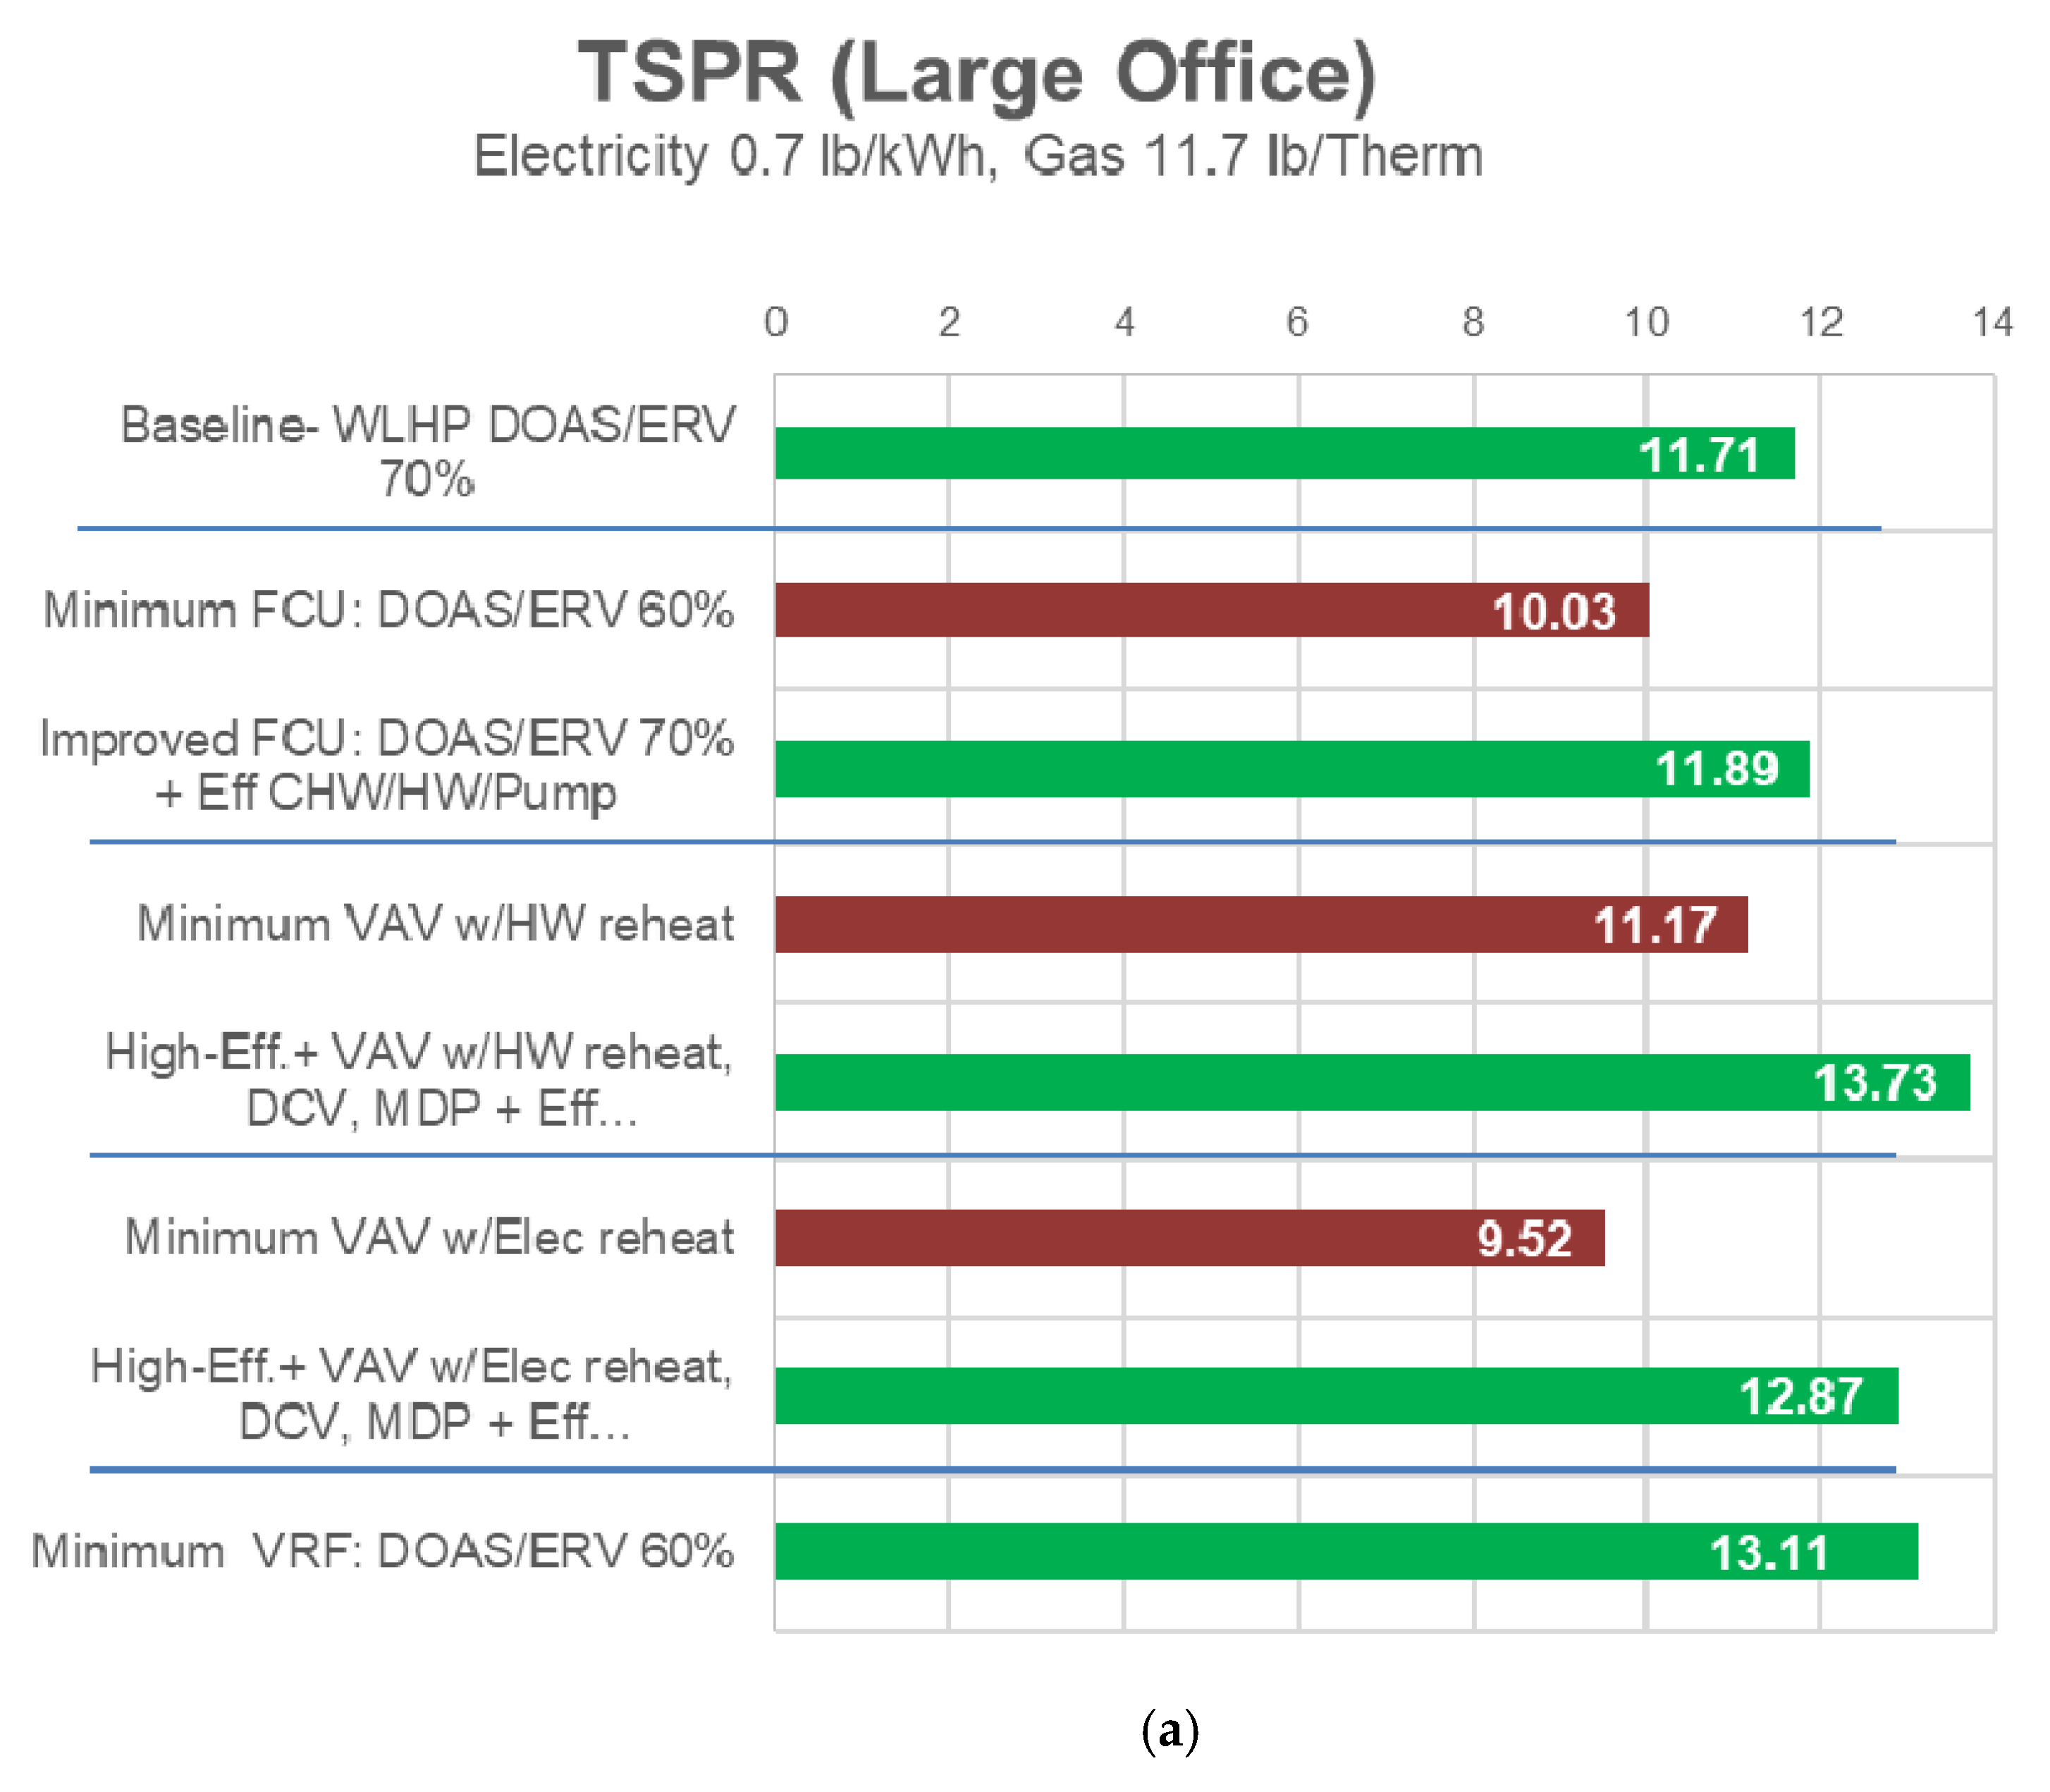
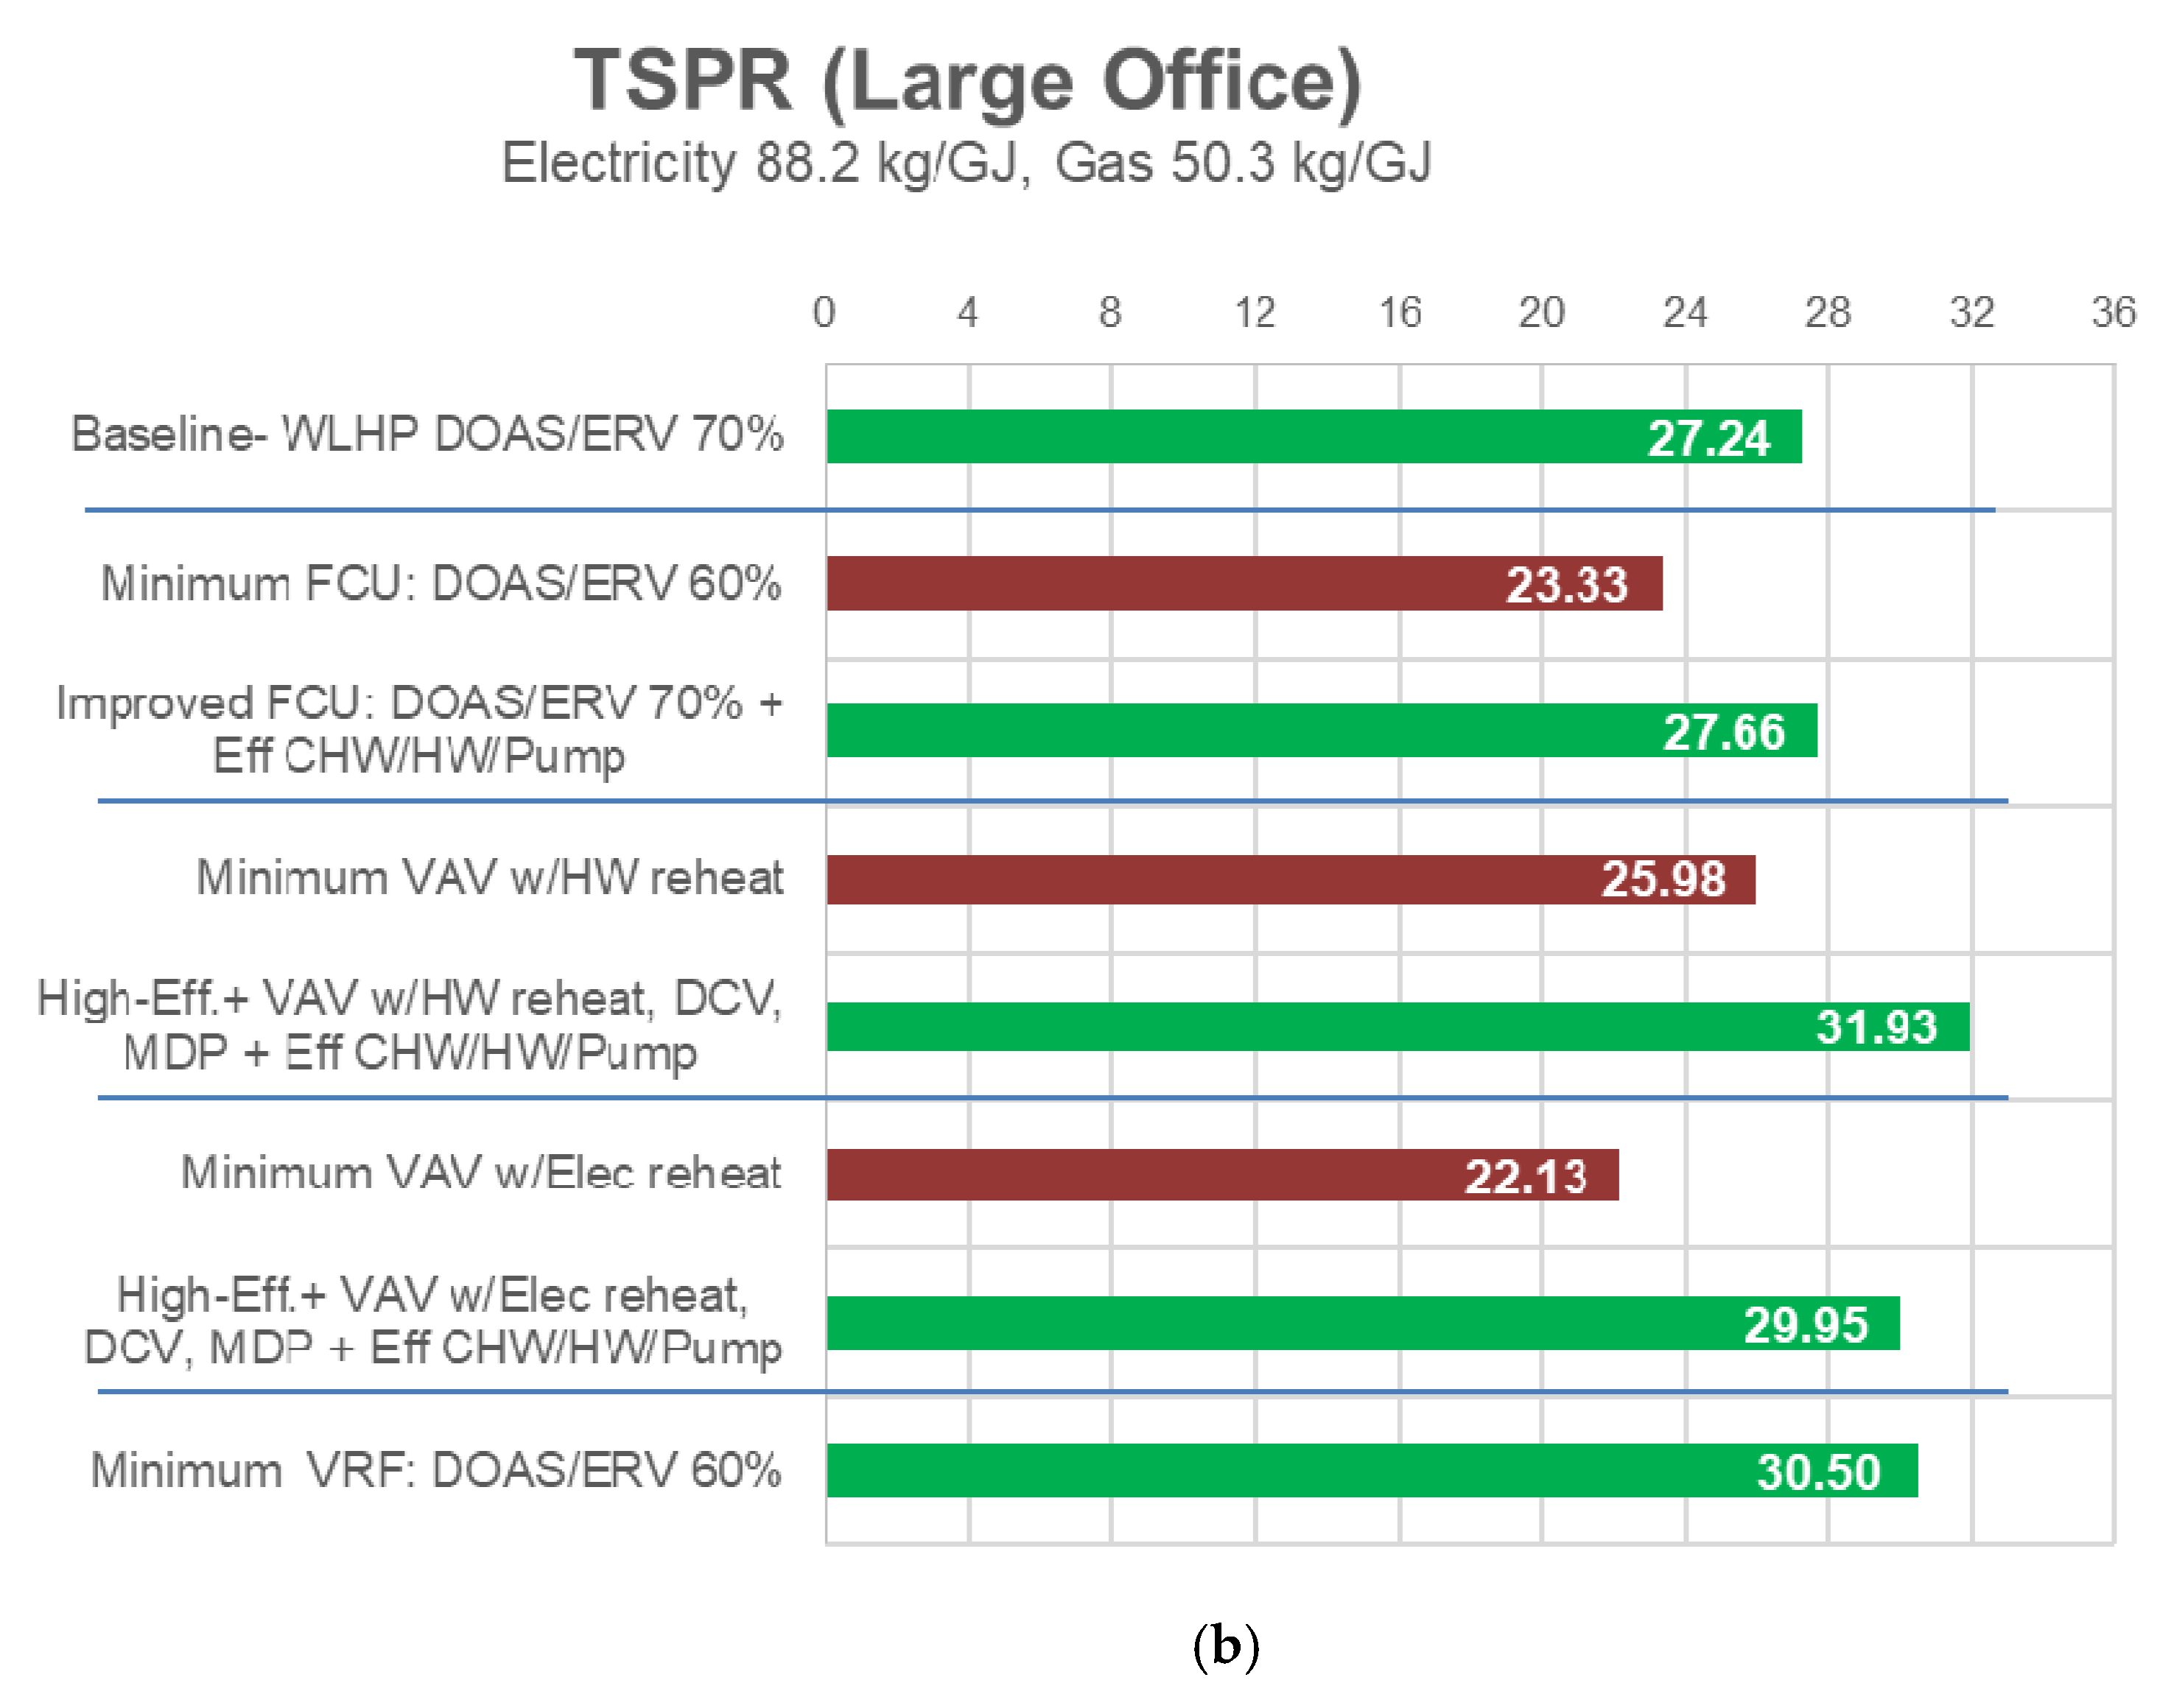
| System Type | Baseline: DOAS + WLHP | DOAS + FCU | VAV with HW Reheat | VAV with Electric Reheat | |||
|---|---|---|---|---|---|---|---|
| TSPR Results (kBtu/lb-CO2) | 11.71 | 10.03 | 11.89 | 11.17 | 13.73 | 9.52 | 12.87 |
| Heating Source, Efficiency | Heat Pump, 4.61 COP | Boiler, 80% | Boiler, 96% | Boiler, 80% Et | Boiler, 93%, Et | Electric Resistance Furnace, 100% Et | Electric Resistance Furnace, 100% Et |
| Boiler Pump Power | NA | 16 W/GPM (253,605 W per m3/s) | 12.8 W/GPM (202,900 W per m3/s) | 16 W/GPM (253,605 W per m3/s) | 16 W/GPM (253,605 W per m3/s) | NA | NA |
| Cooling Source, Efficiency | DX, 4.46 COP | Air Cooled Chiller, 2.843 COP | Air Cooled Chiller, 3.077 COP | Water Cooled Chiller, 6.1 COP | Water Cooled Chiller, 6.1 COP | Water Cooled Chiller, 6.1 COP | Water Cooled Chiller, 6.1 COP |
| Primary Chiller Pump Control, Pump Power | NA | Constant Primary, 4 W/GPM (63, 401 W per m3/s) | Constant Primary, 3.2 W/GPM (50,700 W per m3/s) | Constant Primary, 4 W/GPM (63, 401 W per m3/s) | Constant Primary, 3.2 W/GPM (50,700 W per m3/s) | Constant Primary, 4 W/GPM (63,401 W per m3/s) | Constant Primary, 3.2 W/GPM (50,700 W per m3/s) |
| Secondary Chiller Pump Control, Pump Power | Variable Secondary, 12 W/GPM (190,204 W per m3/s) | Variable Secondary, 10.8 W/GPM (171,200 W per m3/s) | Variable Secondary, 12 W/GPM (190,204 W per m3/s) | Variable Secondary, 10.8 W/GPM (171,200 W per m3/s) | Variable Secondary, 12 W/GPM (190,204 W per m3/s) | Variable Secondary, 10.8 W/GPM (171,200 W per m3/s) | |
| Cooling Tower Efficiency | NA | NA | 40.2 GPM/HP (3.401 m3/s per MW) | 40.2 GPM/HP (3.401 m3/s per MW) | 40.2 GPM/HP (3.401 m3/s per MW) | 40.2 GPM/HP (3.401 m3/s per MW) | |
| Fan Control, Fan Power (W/CFM) | On-Off, 0.528 W/CFM | On-Off, 0.25 W/CFM | On-Off, 0.16 W/CFM | VAV, 1.135 W/CFM | VAV, 1.021 W/CFM | VAV, 1.135 W/CFM | VAV, 0.9825 W/CFM |
| Reheat Source | NA | NA | NA | HW Reheat | HW Reheat | Electric Reheat | Electric Reheat |
| Minimum Airflow Fraction | NA | NA | NA | 0.3 | 0.2 | 0.3 | 0.2 |
| Economizer Control | NA | No | No | Yes (90% Effectiveness) | Yes (90% Effectiveness) | Yes (90% Effectiveness) | Yes (90% Effectiveness) |
| ERV (Y/N) | NA | NA | NA | No | Yes | No | Yes |
| ERV Sensible, Latent Effectiveness | NA | NA | NA | NA | 0.70, 0.0 | NA | 0.80, 0.60 |
| DCV Control | No | No | Yes | Yes (10% of Area) | Yes (10% of Area) | Yes (10% of Area) | Yes (10% of Area) |
| SAT Reset | NA | NA | NA | Yes (Warmest Zone) | Yes (Warmest Zone) | Yes (Warmest Zone) | Yes (Warmest Zone) |
| WLHP Cooling Tower Efficiency | 40.2 GPM/HP (3.401 m3/s per MW) | NA | NA | NA | NA | NA | NA |
| WLHP Boiler Efficiency | 80% Et | NA | NA | NA | NA | NA | NA |
| Coupled with DOAS System? | Yes | Yes | Yes | No | No | No | No |
| DOAS Cooling Source, Efficiency | No Cooling | No Cooling | No Cooling | NA | NA | NA | NA |
| DOAS Heating Source, Efficiency | No Heating | No Heating | No Heating | NA | NA | NA | NA |
| DOAS Fan Control, Fan Power | CAV, 0.819 W/CFM (1735 W per m3/s) | CAV, 0.819 W/CFM (1735 W per m3/s) | CAV, 0.737 W/CFM (1562 W per m3/s) | NA | NA | NA | NA |
| ERV (Y/N) | Yes | Yes | Yes | NA | NA | NA | NA |
| ERV SAT Control | Yes | Yes | Yes | NA | NA | NA | NA |
| ERV Sensible, Latent Effectiveness | 0.7, 0.0 | 0.6, 0 | 0.70, 0.65 | NA | NA | NA | NA |
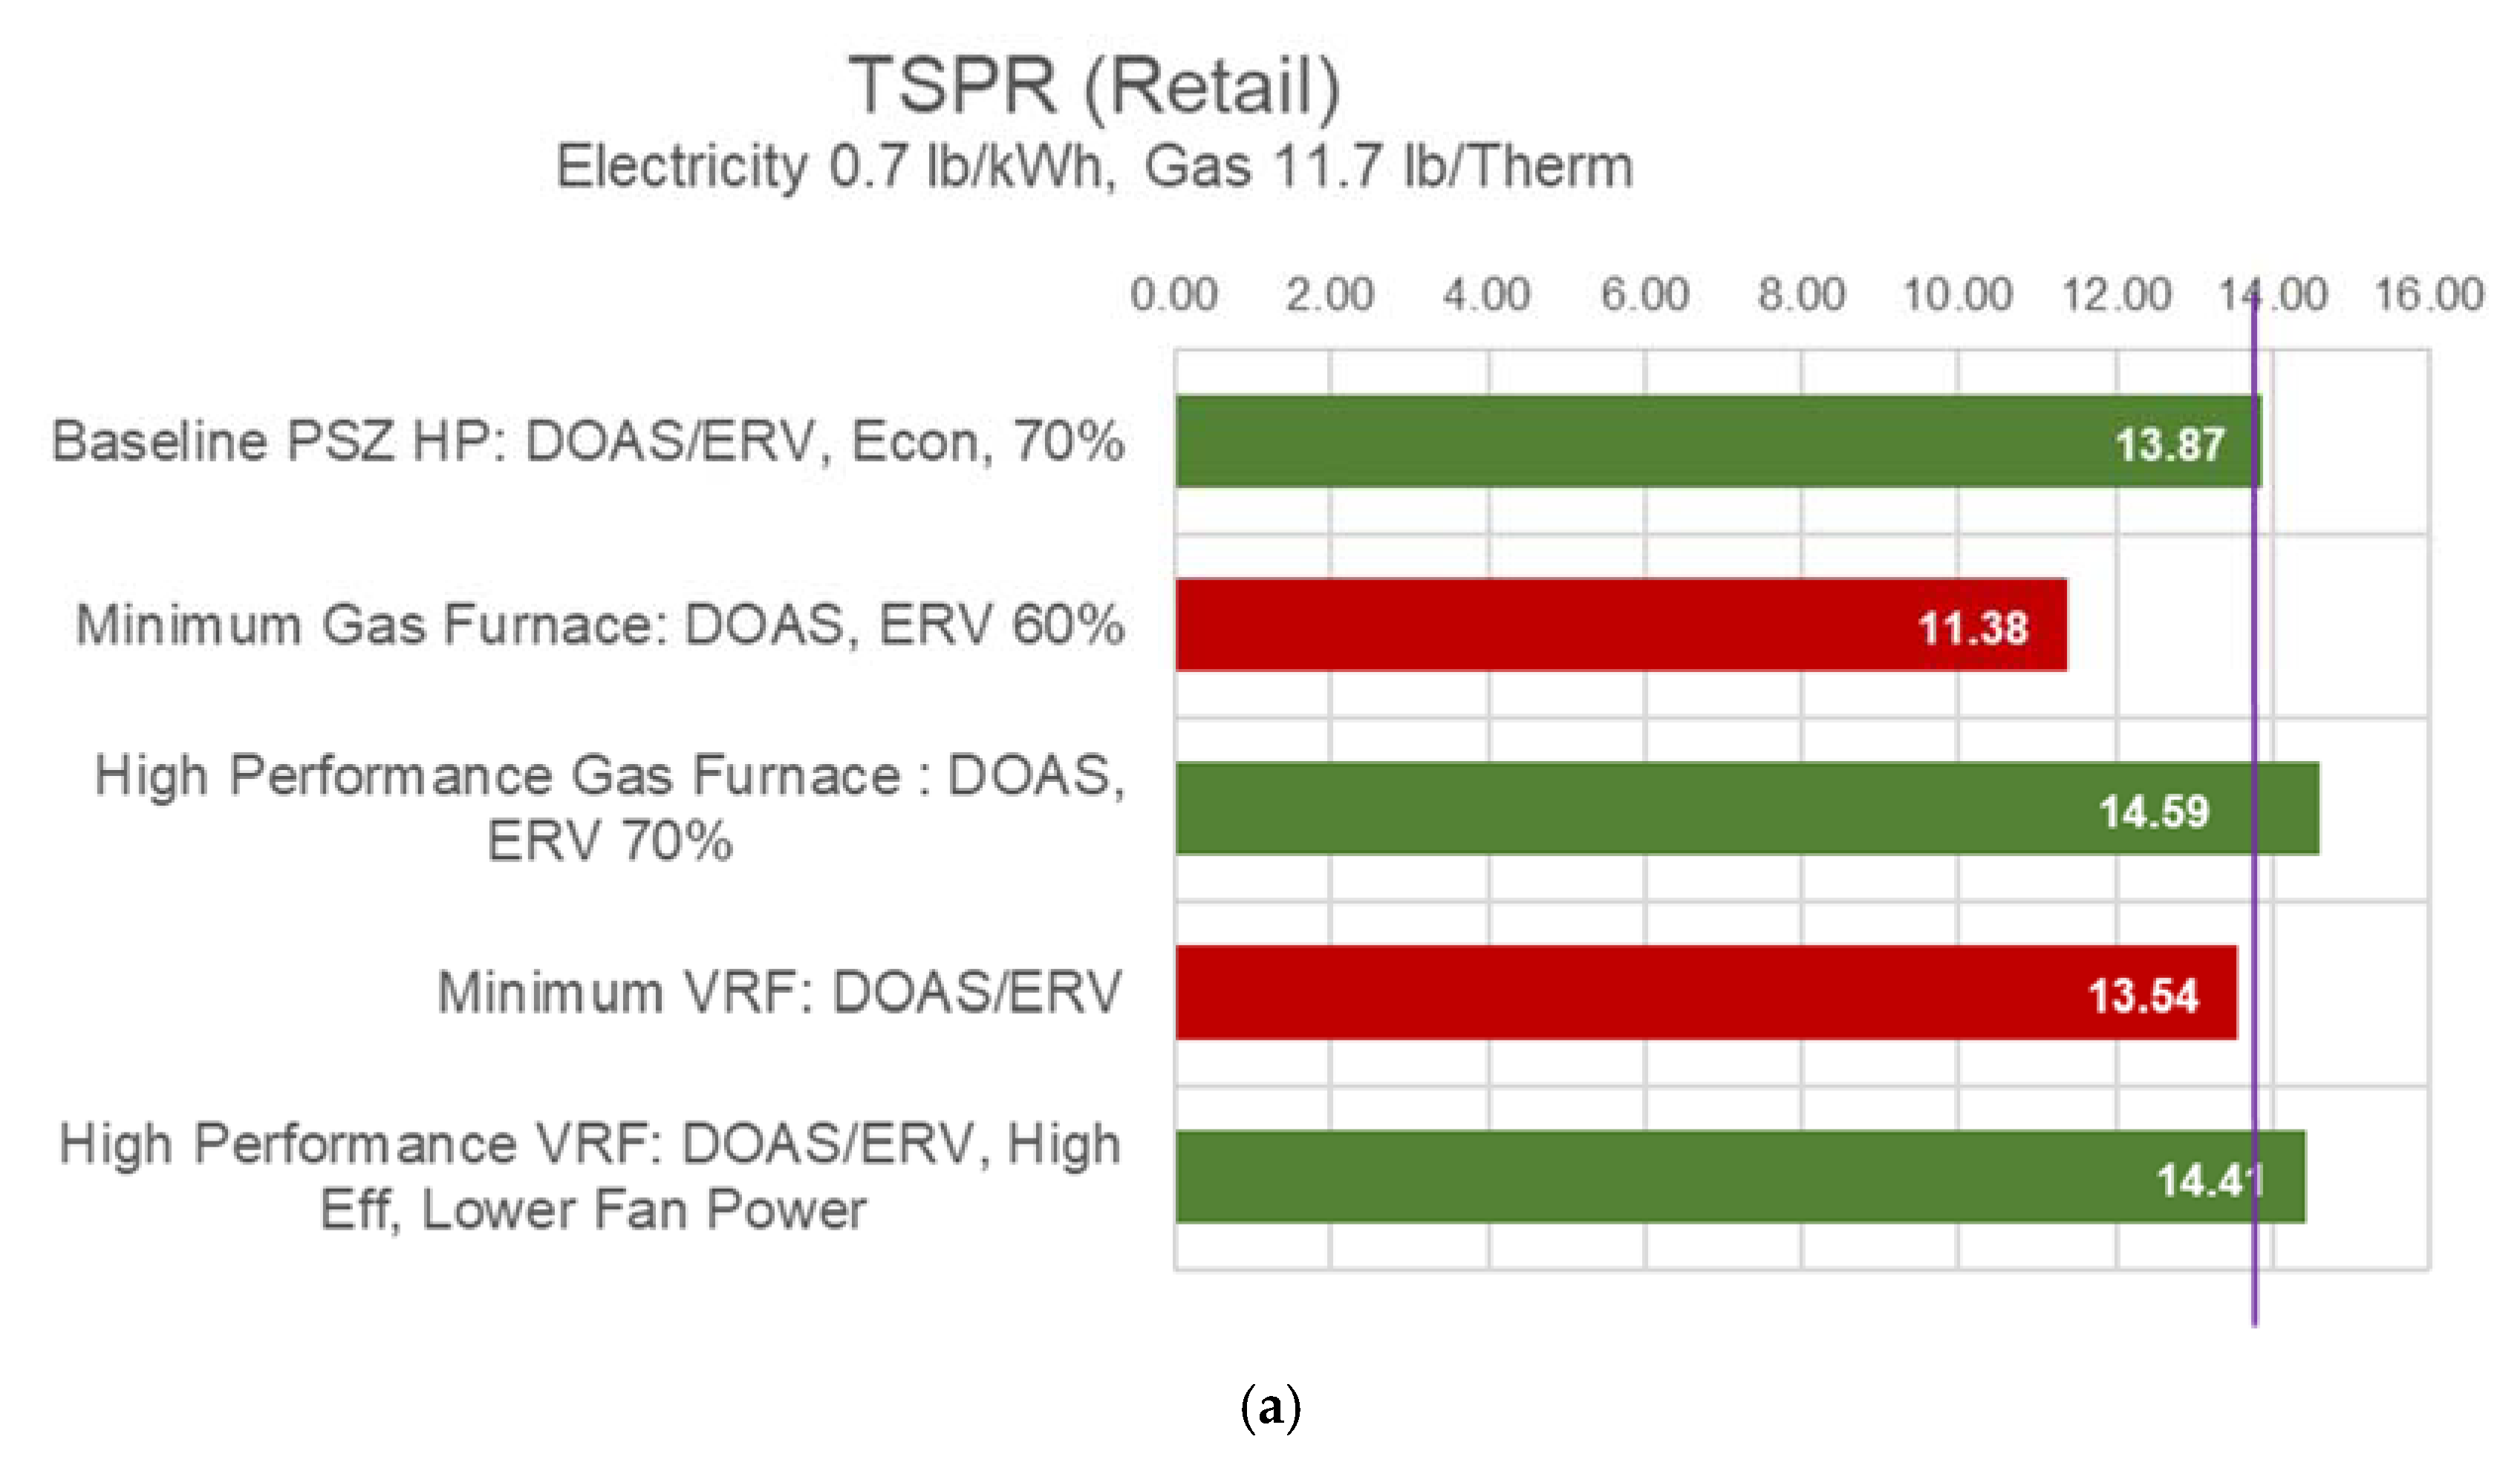
| System Type | Baseline: PSZ Heat Pump + DOAS | Gas Furnace + DOAS | DOAS-VRF | ||
|---|---|---|---|---|---|
| Minimum Requirement | High Performance | Minimum Requirement | High Performance | ||
| TSPR ((kBtu/lb-CO2) | 13.87 | 11.38 | 14.59 | 13.54 | 14.41 |
| Primary Heating and Cooling System | |||||
| Heating Source, Efficiency | Heat Pump, 4.25 COP | Gas Furnace, 80% Et | Gas Furnace, 93% Et | VRF, 3.48 COPnf | VRF, 4.27 COPnf |
| Boiler Pump Power | NA | NA | NA | NA | NA |
| Cooling Source, Efficiency | DX, 3.57 COP | DX, 4.183 COP | DX, 4.74 COP | VRF, 3.33 COPnf | VRF, 4.06COPnf |
| Chiller Pump Control, Pump Power | NA | NA | NA | NA | NA |
| Cooling Tower Efficiency, Condenser Pump Power | NA | NA | NA | NA | |
| Fan Control, Fan Power (W/CFM) | On-Off, 0.528 W/CFM (1119 W per m3/s) | On-Off, 0.528 W/CFM (1119 W per m3/s) | VAV, 0.422 W/CFM (894 W per m3/s) | CAV, 0.25 W/CFM (530 W per m3/s) | CAV, 0.25 W/CFM (530 W per m3/s) |
| Reheat Source | NA | NA | NA | NA | NA |
| Minimum Airflow Fraction | NA | NA | NA | NA | NA |
| Economizer Control | Yes | No | Yes | No | No |
| ERV (Y/N) | NA | No | No | No | No |
| ERV Sensible, Latent Effectiveness | NA | NA | NA | NA | NA |
| DCV Control | No | No | No | No | No |
| DOAS Details | |||||
| Coupled with DOAS System? | Yes | Yes | Yes | Yes | Yes |
| DOAS Cooling Source, Efficiency | No Cooling | No Cooling | No Cooling | No Cooling | No Cooling |
| DOAS Heating Source, Efficiency | No Heating | No Heating | No Heating | No Heating | No Heating |
| DOAS Fan Control, Total DOAS Fan Power | CAV, 0.730 W/CFM (1550 W per m3/s) | CAV, 0.730 W/CFM (1550 W per m3/s) | CAV, 0.620 W/CFM (1310 W per m3/s) | CAV, 0.730 W/CFM (1550 W per m3/s) | CAV, 0.730 W/CFM (1550 W per m3/s) |
| ERV (Y/N) | Yes | Yes | Yes | Yes | Yes |
| ERV SAT Control | Yes | Yes | Yes | Yes | Yes |
| ERV Sensible, Latent Effectiveness | 0.7, 0.0 | 0.6, 0.0 | 0.7, 0.0 | 0.6, 0.0 | 0.6, 0.0 |
Publisher’s Note: MDPI stays neutral with regard to jurisdictional claims in published maps and institutional affiliations. |
© 2021 by the authors. Licensee MDPI, Basel, Switzerland. This article is an open access article distributed under the terms and conditions of the Creative Commons Attribution (CC BY) license (https://creativecommons.org/licenses/by/4.0/).
Share and Cite
Goel, S.; Rosenberg, M.; Gonzalez, J.; Lerond, J. Total System Performance Ratio—A Systems Based Approach for Evaluating HVAC System Efficiency. Energies 2021, 14, 5108. https://doi.org/10.3390/en14165108
Goel S, Rosenberg M, Gonzalez J, Lerond J. Total System Performance Ratio—A Systems Based Approach for Evaluating HVAC System Efficiency. Energies. 2021; 14(16):5108. https://doi.org/10.3390/en14165108
Chicago/Turabian StyleGoel, Supriya, Michael Rosenberg, Juan Gonzalez, and Jérémy Lerond. 2021. "Total System Performance Ratio—A Systems Based Approach for Evaluating HVAC System Efficiency" Energies 14, no. 16: 5108. https://doi.org/10.3390/en14165108
APA StyleGoel, S., Rosenberg, M., Gonzalez, J., & Lerond, J. (2021). Total System Performance Ratio—A Systems Based Approach for Evaluating HVAC System Efficiency. Energies, 14(16), 5108. https://doi.org/10.3390/en14165108