
Ukrainian Market of Electrical Energy: Reforming, Financing, Innovative Investment, Efficiency Analysis, and Audit

 ,
,  ,
,  ,
, 

Abstract
:1. Introduction
2. Materials and Methods
3. Methodology
4. Results
4.1. Analysis of Energy Efficiency of Economy of Ukraine as the Environment of Reforming the Electrical Energy Market
- Differentiation of retail, wholesale markets, the market of universal and auxiliary services;
- Creation of organized areas of the electricity market; the “day ahead” market and intraday market (SC “Market Operator”), balancing market (PJSC “NPC “Ukrenergo”), the market of electrical energy generated from alternative sources (SC “Guaranteed Buyer”);
- Free choice and replacement of electricity suppliers by consumers, concluding bilateral agreements with them;
- Functional and legal separation of operators of electricity distribution and transmission systems, non-discriminatory access of users to them; emergence of institutions of suppliers of universal services, “last hope” suppliers, and traders.
4.2. Assessment of Market Capacity and Electrical Energy Prices in Areas under Liberalization Conditions
4.3. Concentration and Competition of Economic Entities That Are Involved in Electric Power Generation, Transmission, and Distribution
4.4. Financing and Innovative Investment in the Market of Electrical Energy in Ukraine: Problems and Prospects
4.5. Standards of Audit of Integrated Reporting of Ukrainian Energy Holdings and Their Role in Ensuring Sustainable Development
5. Discussion
Author Contributions
Funding
Institutional Review Board Statement
Informed Consent Statement
Data Availability Statement
Conflicts of Interest
References
- Cyrek, M.; Cyrek, P. Does Economic Structure Differentiate the Achievements towards Energy SDG in the EU? Energies 2021, 14, 2229. [Google Scholar] [CrossRef]
- Energy Community Secretariat. Annual Implementation Report 2020. Available online: https://www.energy-community.org/implementation/IR2020.html (accessed on 18 May 2021).
- Milojević, M.; Urbański, M.; Terzić, I.; Prasolov, V. Impact of Non-Financial Factors on the Effectiveness of Audits in Energy Companies. Energies 2020, 13, 6212. [Google Scholar] [CrossRef]
- Piesiewicz, M.; Ciechan-Kujawa, M.; Kufel, P. Differences in Disclosure of Integrated Reports at Energy and Non-Energy Companies. Energies 2021, 14, 1253. [Google Scholar] [CrossRef]
- Balsalobre-Lorente, D.; Leitão, N.C.; Bekun, F.V. Fresh Validation of the Low Carbon Development Hypothesis under the EKC Scheme in Portugal, Italy, Greece and Spain. Energies 2021, 14, 250. [Google Scholar] [CrossRef]
- Walczak, D.; Dziawgo, L.; Dziawgo, D.; Buszko, M.; Pawłowski, J.; Żołądkiewicz-Kuzioła, A.; Krupa, D. Attitudes and Behaviors Regarding Environmental Protection in the Financial Decisions of Individual Consumers. Energies 2021, 14, 1934. [Google Scholar] [CrossRef]
- Standar, A.; Kozera, A.; Satoła, Ł. The Importance of Local Investments Co-Financed by the European Union in the Field of Renewable Energy Sources in Rural Areas of Poland. Energies 2021, 14, 450. [Google Scholar] [CrossRef]
- On the Electricity Market (2017): Law of Ukraine No 2019-VIII [Pro Rynok Elektrychnoi Enerhii: Zakon Ukrainy vid 13.04.2017 No 2019-VIII]. Available online: https://zakon.rada.gov.ua/laws/show/2019-19?find=1&text=%D1%80%D0%B8%D0%BD%D0%BE%D0%BA#w1_10 (accessed on 14 May 2021).
- National Classification of Economic Activities (NCEA-2010) [Klasyfikatsiia Vydiv Ekonomichnoi Diialnosti (KVED-2010)]. Available online: http://kved.ukrstat.gov.ua/KVED2010/kv10_i.html (accessed on 14 May 2021).
- Levinson, A. Energy intensity: Deindustrialization, composition, prices, and policies in U.S. states. Resour. Energy Econ. 2021, 65, 101243. [Google Scholar] [CrossRef]
- Shkodina, I.; Melnychenko, O.; Babenko, M. Quantitative easing policy and its impact on the global economy. Financ. Crédit Act. Probl. Theory Pract. 2020, 2, 513–521. [Google Scholar] [CrossRef]
- Streimikiene, D.; Bruneckiene, J.; Cibinskiene, A. The Review of Electricity Market Liberalization Impacts on Electricity Prices. Transform. Bus. Econ. 2013, 12, 40–60. [Google Scholar]
- Bajo-Buenestado, R. Consumer Welfare Implications of Capacity Markets in Liberalized Electricity Sectors. Electr. J. 2015, 28, 113–119. [Google Scholar] [CrossRef]
- Barrett, E. Market liberalization: Five seductively simple steps to making it work. Electr. J. 2017, 30, 51–55. [Google Scholar] [CrossRef]
- Algarvio, H.; Lopes, F.; Sousa, J.A.M.; Lagarto, J. Multi-agent electricity markets: Retailer portfolio optimization using Markowitz theory. Electr. Power Syst. Res. 2017, 148, 282–294. [Google Scholar] [CrossRef]
- Cifter, A. Forecasting electricity price volatility with the Markov-switching GARCH model: Evidence from the Nordic electric power market. Electr. Power Syst. Res. 2013, 102, 61–67. [Google Scholar] [CrossRef]
- Owen, A.D. Do Liberalized Electricity Markets Discourage Investment in Renewable Energy Technologies? Electr. J. 2014, 27, 53–59. [Google Scholar] [CrossRef]
- Kim, J.; Lee, J.-S. Greening Energy Finance of Multilateral Development Banks: Review of the World Bank’s Energy Project Investment (1985–2019). Energies 2021, 14, 2648. [Google Scholar] [CrossRef]
- Melnychenko, O.; Kwiliński, A. Energy management: Analysis of the retrospective in the perspective context for economic development. Eur. Coop. 2017, 7, 66–80. [Google Scholar]
- GRI Standards. Overview of GRI Standards. Available online: https://standards.sinzer.org/gri/sector#103 (accessed on 2 June 2021).
- AA1000 AccountAbility Principles. Available online: https://www.accountability.org/standards/ (accessed on 26 May 2021).
- Petera, P.; Wagner, J. Global Reporting Initiative (GRI) and its Reflections in the Literature. Eur. Financ. Account. J. 2015, 10, 13–32. [Google Scholar] [CrossRef]
- Romolini, A.; Fissi, S.; Gori, E. Exploring Integrated Reporting Research: Results and Perspectives. Int. J. Account. Financ. Rep. 2017, 7, 32–59. [Google Scholar] [CrossRef] [Green Version]
- Havlová, K. What Integrated Reporting Changed: The Case Study of Early Adopters. Procedia Econ. Financ. 2015, 34, 231–237. [Google Scholar] [CrossRef] [Green Version]
- Bochulia, T.; Melnychenko, O. Accounting and analytical provision of management in the times of information thinking. Eur. Coop. 2019, 1, 52–64. [Google Scholar] [CrossRef]
- Melnychenko, O. Is Artificial Intelligence Ready to Assess an Enterprise’s Financial Security? J. Risk Financ. Manag. 2020, 13, 191. [Google Scholar] [CrossRef]
- Ioana, D.; Adriana, T.-T. Research Agenda on Integrated Reporting: New Emergent Theory and Practice. Procedia Econ. Financ. 2014, 15, 221–227. [Google Scholar] [CrossRef] [Green Version]
- Argento, D.; Culasso, F.; Truant, E. From Sustainability to Integrated Reporting: The Legitimizing Role of the CSR Manager. Organ. Environ. 2018, 32, 484–507. [Google Scholar] [CrossRef]
- Simnett, R.; Huggins, A. Integrated reporting and assurance: Where can research add value? Sustain. Account. Manag. Policy J. 2015, 6, 29–53. [Google Scholar] [CrossRef] [Green Version]
- Energy Intensity for 2007–2019 [Enerhoiemnist za 2007-2019 Roky]. Available online: http://www.ukrstat.gov.ua/operativ/operativ2020/energ/energoemn/enem_ue.xls (accessed on 14 May 2021).
- Chang, M.-C. Energy intensity, target level of energy intensity, and room for improvement in energy intensity: An application to the study of regions in the EU. Energy Policy 2014, 67, 648–655. [Google Scholar] [CrossRef]
- Aydin, C.; Esen, Ö. Does the level of energy intensity matter in the effect of energy consumption on the growth of transition economies? Evidence from dynamic panel threshold analysis. Energy Econ. 2018, 69, 185–195. [Google Scholar] [CrossRef]
- Report on the Results of the Activities of the National Commission for State Regulation of Energy and Utilities in 2020 (Resolution No 893) [Zvit pro Rezultaty Diialnosti Natsionalnoi Komisii, Shcho Zdiisniuie Derzhavne Rehuliuvannia u Sferakh Enerhetyky ta Komunalnykh Posluh, u 2020 Rotsi: Zatverdzheno Postanovoiu Natsionalnoi Komisii, Shcho Zdiisniuie Derzhavne Rehuliuvannia u Sferakh Enerhetyky ta Komunalnykh Posluh 26 Travnia 2021 Roku № 893]. Available online: https://www.nerc.gov.ua/data/filearch/Catalog3/Richnyi_zvit_NKREKP_2020.pdf (accessed on 22 May 2021).
- Report on the Results of the Activities of the National Commission for State Regulation of Energy and Utilities in 2020 (Resolution No 975) [Zvit pro Rezultaty Diialnosti Natsionalnoi Komisii, Shcho Zdiisniuie Derzhavne Rehuliuvannia u Sferakh Enerhetyky ta Komunalnykh Posluh, u 2019 Rotsi: Zatverdzheno Postanovoiu Natsionalnoi Komisii, Shcho Zdiisniuie Derzhavne Rehuliuvannia u Sferakh Enerhetyky ta Komunalnykh Posluh 27 Travnia 2020 Roku No 975]. Available online: https://www.nerc.gov.ua/data/filearch/Catalog3/Richnyi_zvit_NKREKP_2019.pdf (accessed on 24 May 2021).
- Price of Electricity for Consumers [Tsiny na Elektroenerhiiu Dlia Spozhyvachiv]. Available online: http://www.ukrstat.gov.ua/operativ/operativ2020/energ/cin_el_energ/c_elen_20_ue.xlsx (accessed on 22 May 2021).
- Johansson, I.; Mardan, N.; Cornelis, E.; Kimura, O.; Thollander, P. Designing Policies and Programmes for Improved Energy Efficiency in Industrial SMEs. Energies 2019, 12, 1338. [Google Scholar] [CrossRef] [Green Version]
- Milojević, M.; Nowodziński, P.; Terzić, I.; Danshina, S. Households’ Energy Autonomy: Risks or Benefits for a State? Energies 2021, 14, 2026. [Google Scholar] [CrossRef]
- Domanico, F. Concentration in the European electricity industry: The internal market as solution? Energy Policy 2007, 35, 5064–5076. [Google Scholar] [CrossRef]
- Indicators of Balance Sheet of Enterprises by Type of Economic Activity with a Breakdown on Large, Medium, Small and Microenterprises in 2013–2019 [Pokaznyky Balansu Pidpryiemstv za Vydamy Ekonomichnoi Diialnosti z Rozpodilom na Velyki, Seredni, Mali ta Mikropidpryiemstva (2013–2019)]. Available online: http://www.ukrstat.gov.ua/operativ/operativ2018/fin/fin_new/fin_new_u/pbp_ek_vsmm_2013_2019_ue.xlsx (accessed on 20 May 2021).
- Jagtap, K.; Khatod, D.K. Novel approach for loss allocation of distribution networks with DGs. Electr. Power Syst. Res. 2017, 143, 303–311. [Google Scholar] [CrossRef]
- Steriotis, K.; Smpoukis, K.; Efthymiopoulos, N.; Tsaousoglou, G.; Makris, P.; Varvarigos, E. (Manos) Strategic and network-aware bidding policy for electric utilities through the optimal orchestration of a virtual and heterogeneous flexibility assets’ portfolio. Electr. Power Syst. Res. 2020, 184, 106302. [Google Scholar] [CrossRef]
- Tómasson, E.; Hesamzadeh, M.R.; Söder, L.; Biggar, D.R. An incentive mechanism for generation capacity investment in a price-capped wholesale power market. Electr. Power Syst. Res. 2020, 189, 106708. [Google Scholar] [CrossRef]
- Jenčová, S.; Štefko, R.; Vašaničová, P. Scoring Model of the Financial Health of the Electrical Engineering Industry’s Non-Financial Corporations. Energies 2020, 13, 4364. [Google Scholar] [CrossRef]
- Vimpari, J. Financing Energy Transition with Real Estate Wealth. Energies 2020, 13, 4289. [Google Scholar] [CrossRef]
- Net Profit (Loss) of Enterprises by Type of Economic Activity with a Breakdown on Large, Medium, Small and Microenterprises in 2010–2019 [Chystyi Prybutok (Zbytok) Pidpryiemstv za Vydamy Ekonomichnoi Diialnosti z Rozpodilom na Velyki, Seredni, Mali ta Mikropidpryiemstva (2010–2019)]. Available online: http://www.ukrstat.gov.ua/operativ/operativ2018/fin/fin_new/fin_new_u/chpr_ek_vsmm_2010_2019_ue.xlsx (accessed on 3 June 2021).
- Energy Consumption from Renewable Sources for 2007–2019 [Enerhospozhyvannia na Osnovi Vidnovliuvanykh Dzherel za 2007–2019 Roky]. Available online: http://www.ukrstat.gov.ua/operativ/operativ2020/energ/energospog/esp_vg_ue.xls (accessed on 6 May 2021).
- On Alternative Energy Sources (2003): Law of Ukraine No 555-IV [Pro Alternatyvni Dzherela Enerhii: Zakon Ukrainy vid 20.02.2003 No 555-IV]. Available online: https://zakon.rada.gov.ua/laws/show/555-15#Text (accessed on 3 June 2021).
- Vatamanyuk-Zelinska, U.Z.; Melnychenko, O.V. The effectiveness of financial and economic regulation of land relations in the context of stimulating entrepreneurial activity in the regions of Ukraine. Probl. Perspect. Manag. 2020, 18, 11–27. [Google Scholar] [CrossRef]
- ISAE 3000 (Revised), Assurance Engagements Others than Audits or Reviews of Historical Financial Information. Available online: https://www.iaasb.org/publications/isae-3000-revised-assurance-engagements-other-audits-or-reviews-historical-financial-information (accessed on 27 May 2021).
- “NNEGC Energoatom”. Clean Energy for Sustainable Future. Non-Financial Report—2019. GRI Content Index. Available online: http://nfr2019.energoatom.kiev.ua/en/dodatky.php#chapter-3 (accessed on 7 May 2021).
- DTEK. Integrated Report 2019. Financial and Non-Financial Results. Available online: https://dtek.com/content/announces/1003-dtek_annual-report-2019_pdf_s226_t3112.pdf (accessed on 5 May 2021).
- IIA: The Role of Internal Audit in Non-Financial and Integrated Reporting. Available online: https://integratedreporting.org/resource/the-role-of-internal-audit-in-non-financial-and-integrated-reporting/ (accessed on 7 June 2021).

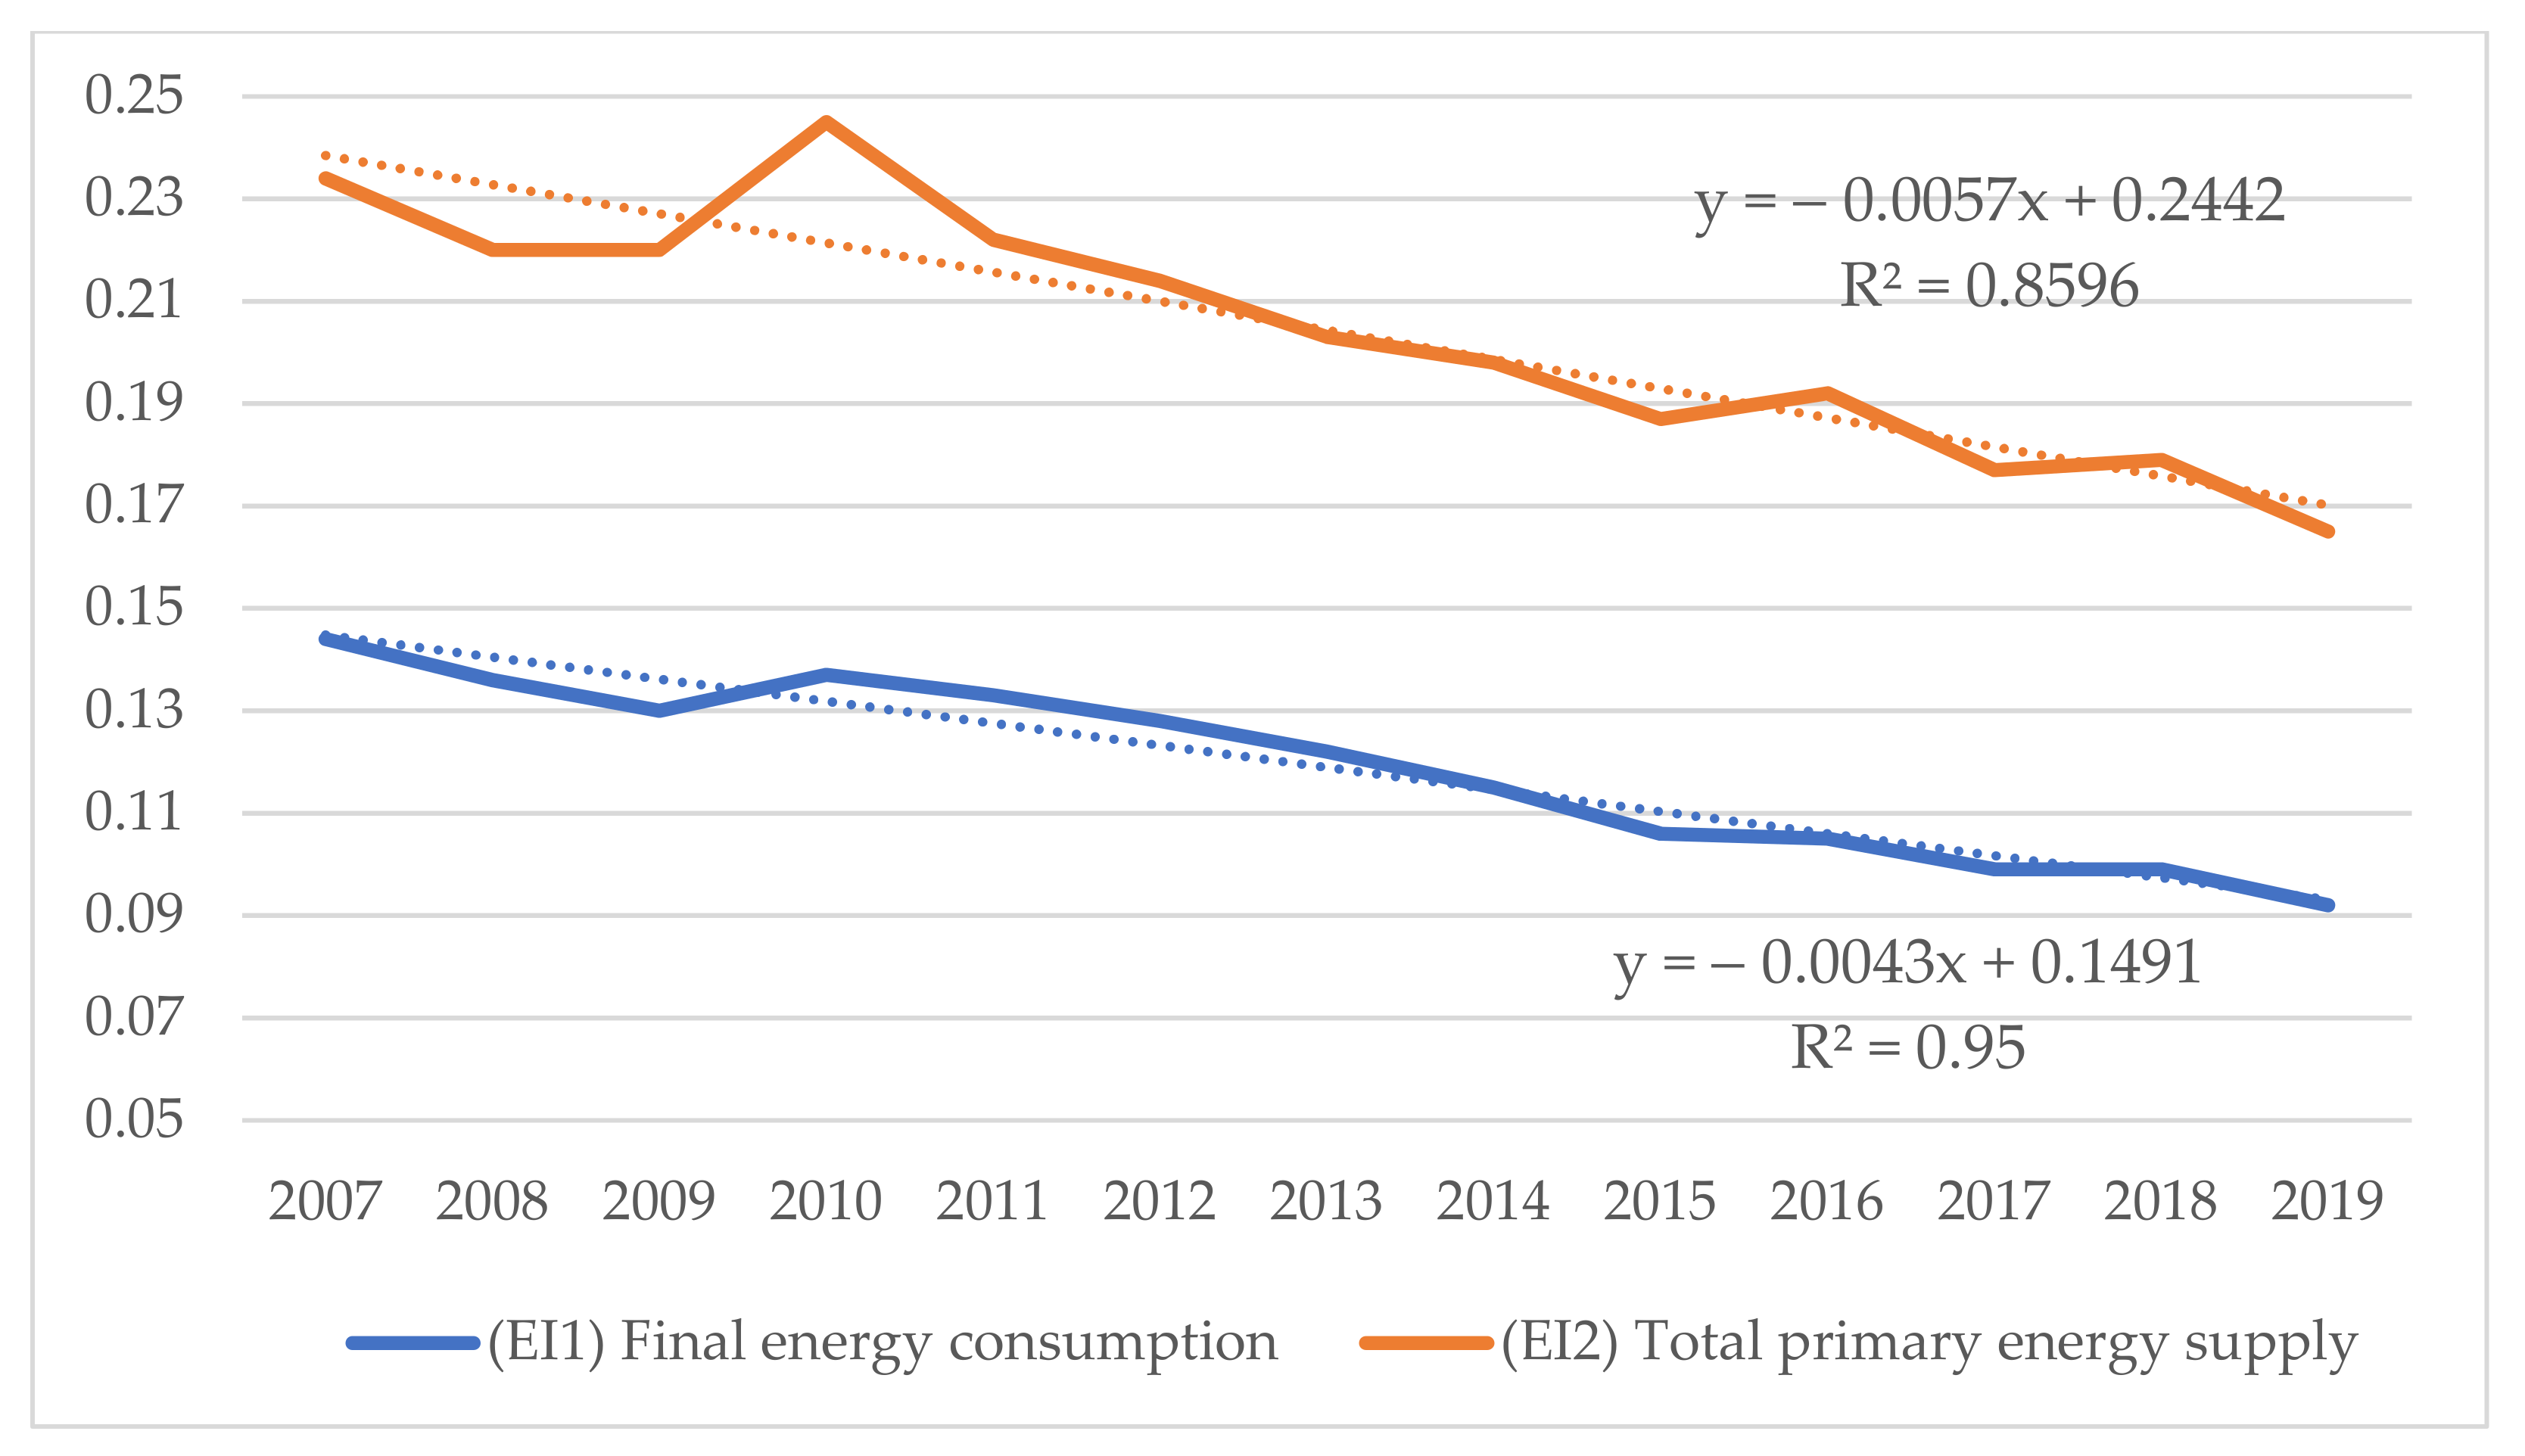
| Indicator | Unit | 2007 | 2008 | 2009 | 2010 | 2011 | 2012 | 2013 | 2014 | 2015 | 2016 | 2017 | 2018 | 2019 |
|---|---|---|---|---|---|---|---|---|---|---|---|---|---|---|
| GDP, PPP 2017 | Int’l$ BLN | 596.7 | 610.4 | 520.3 | 540.3 | 569.8 | 571.2 | 571 | 533.6 | 481.5 | 492.2 | 504.4 | 521.5 | 538.4 |
| Final energy consumption | toe BLN | 86.0 | 83.3 | 67.6 | 74.0 | 75.9 | 73.1 | 69.6 | 61.5 | 50.8 | 51.6 | 49.9 | 51.5 | 49.4 |
| Total primary energy supply | toe BLN | 139.3 | 134.6 | 114.4 | 132.3 | 126.4 | 122.5 | 115.9 | 105.7 | 90.1 | 94.4 | 89.5 | 93.5 | 89.1 |
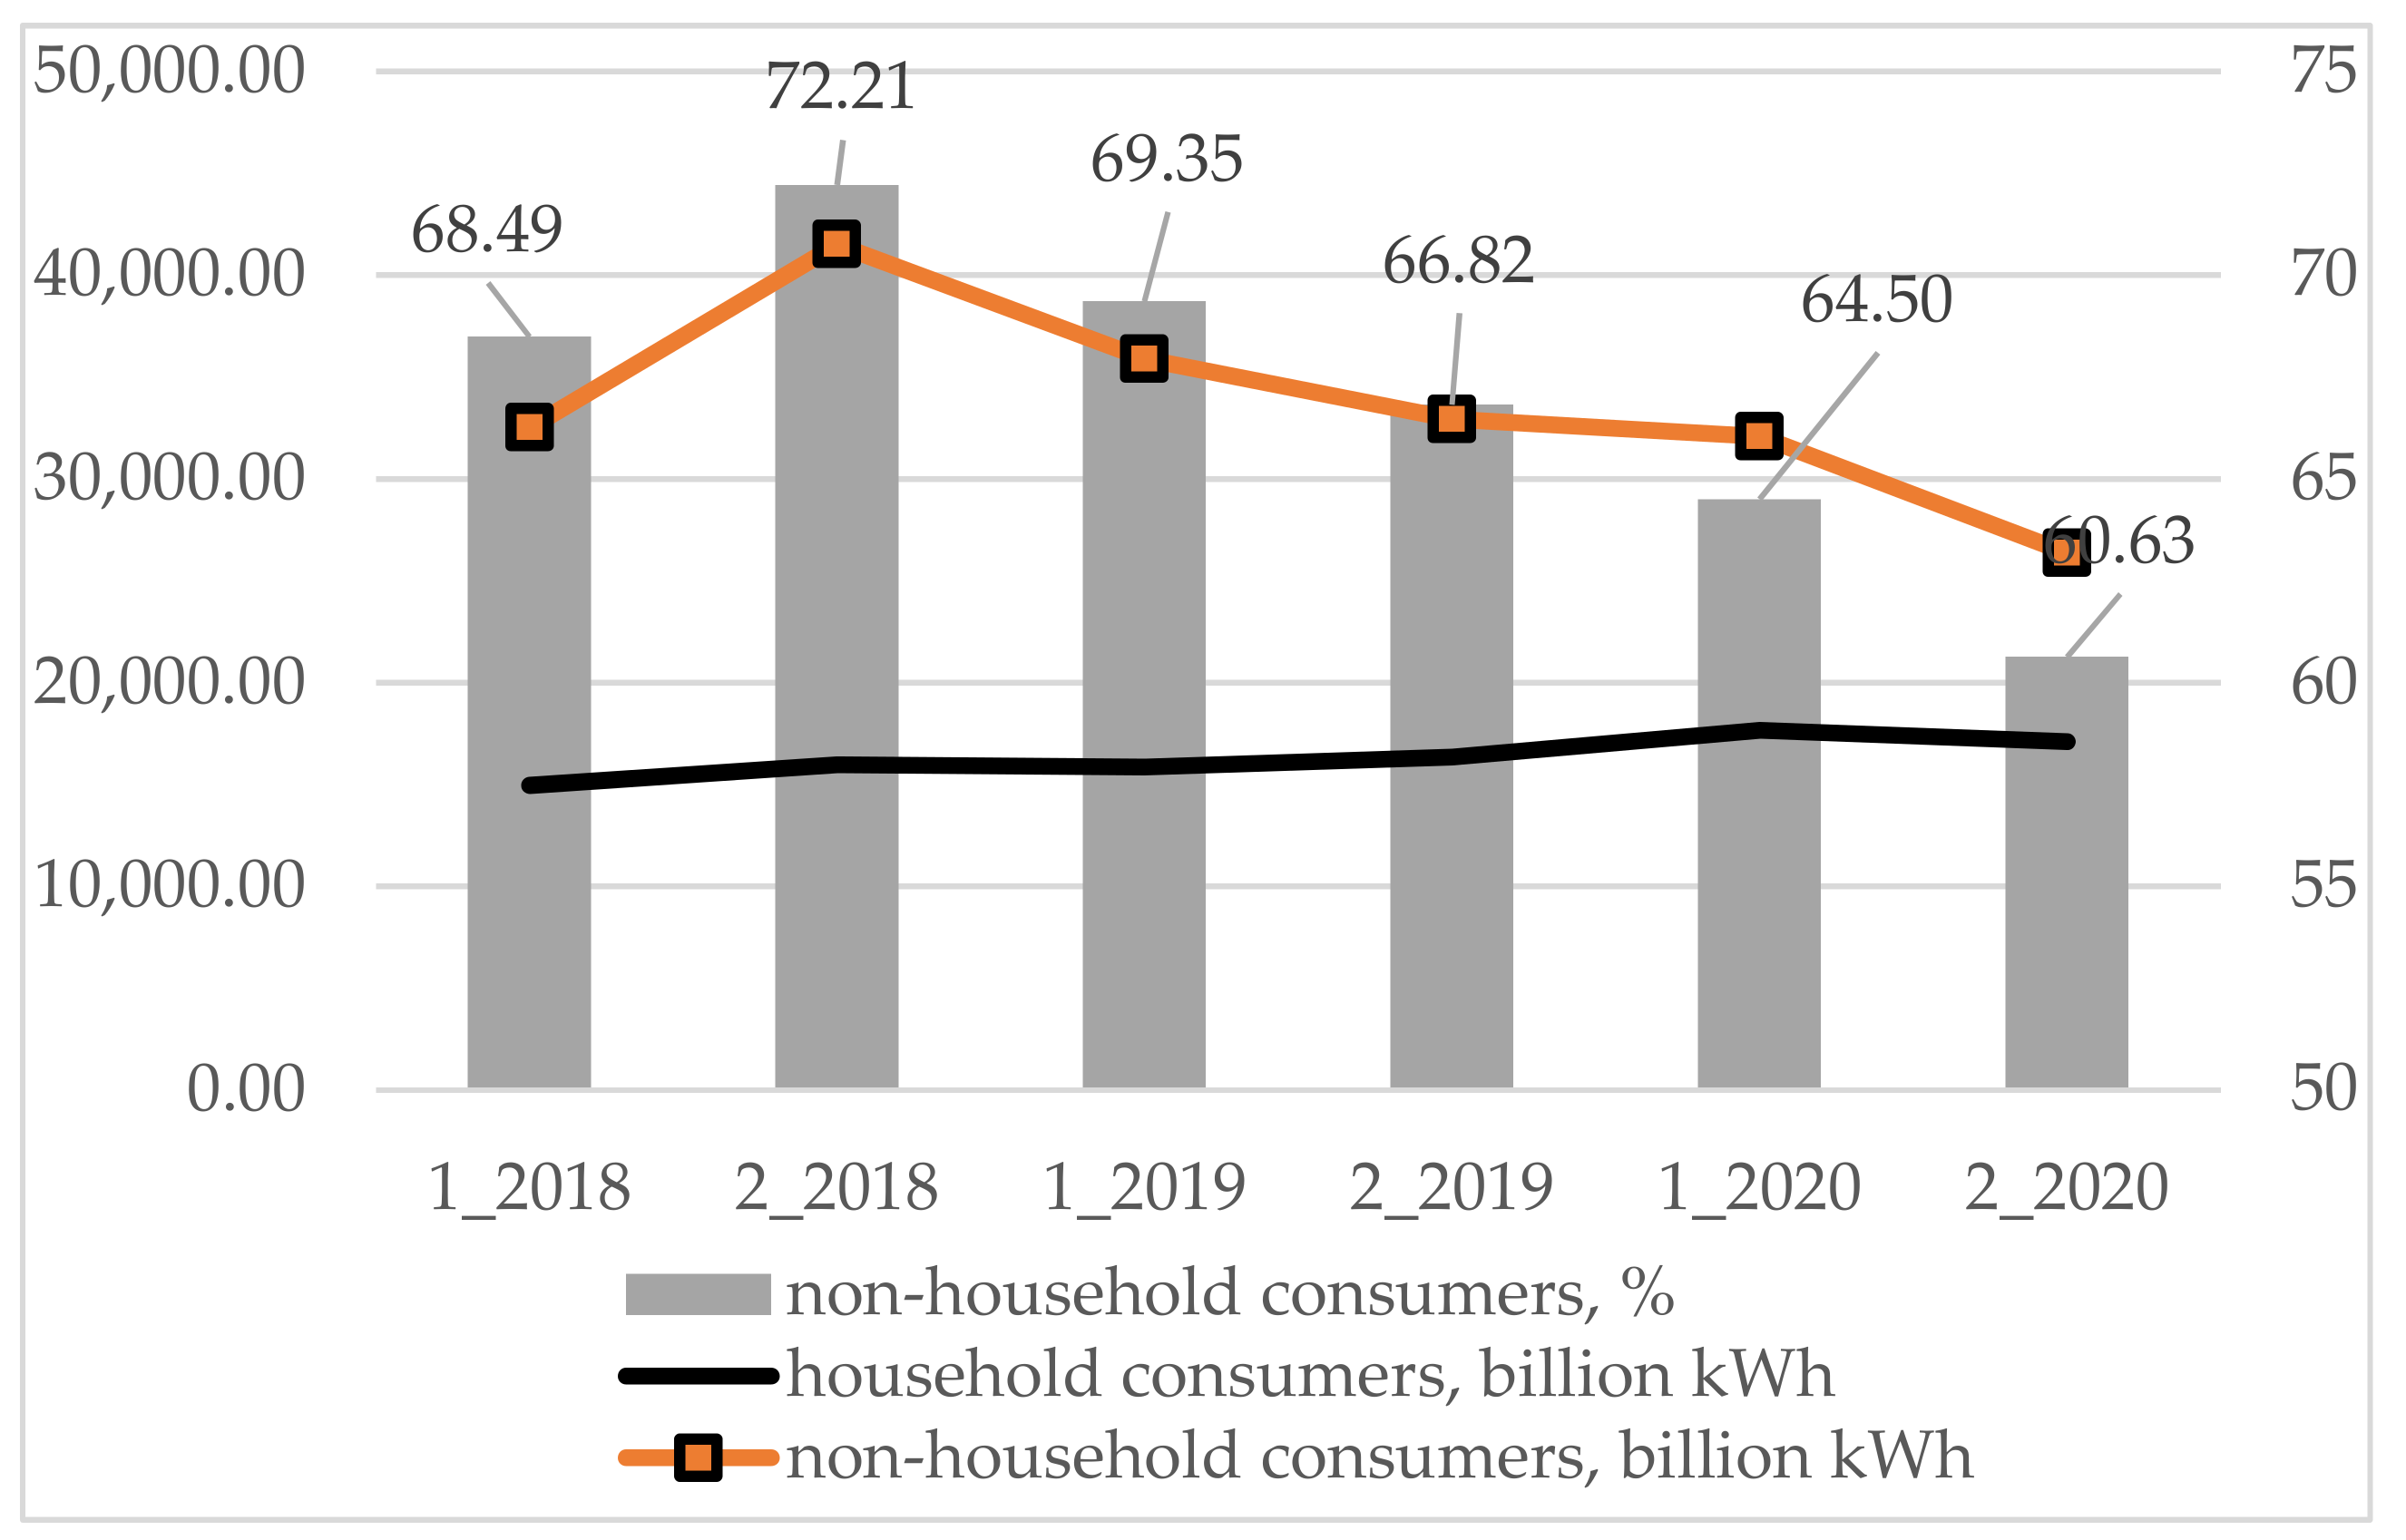
| 1_2018 | 2_2018 | 1_2019 | 2_2019 | 1_2020 | 2_2020 | Index 2_2020/ 1_2018 | |
|---|---|---|---|---|---|---|---|
| Electricity Supply to Household Consumers—Total | 1.01 | 1.00 | 1.05 | 1.03 | 1.04 | 1.01 | 1.00 |
| including in bands with annual consumption, kWh: | |||||||
| <1000 | 0.84 | 0.90 | 0.86 | 0.89 | 0.82 | 0.80 | 0.95 |
| ≥1000 < 2500 | 0.96 | 0.95 | 0.98 | 0.97 | 1.00 | 0.93 | 0.96 |
| ≥2500 < 5000 | 1.11 | 1.09 | 1.12 | 1.12 | 1.11 | 1.09 | 0.98 |
| ≥5000 < 15,000 | 1.08 | 1.07 | 1.14 | 1.12 | 1.09 | 1.09 | 1.01 |
| ≥15,000 | 0.95 | 0.98 | 1.21 | 1.14 | 1.05 | 1.06 | 1.12 |
| Electricity Supply to Non-Household Consumers—Total | 1.83 | 1.82 | 1.86 | 1.85 | 1.58 | 1.74 | 0.95 |
| including in bands with annual consumption, thsd.kWh: | |||||||
| <20 | 2.05 | 2.05 | 2.20 | 2.11 | 1.86 | 1.97 | 0.96 |
| ≥20 < 500 | 2.03 | 2.07 | 2.08 | 2.05 | 1.81 | 1.89 | 0.93 |
| ≥500 < 2000 | 1.93 | 1.97 | 2.00 | 1.95 | 1.70 | 1.84 | 0.95 |
| ≥2000 < 20,000 | 1.88 | 1.92 | 1.93 | 1.90 | 1.64 | 1.77 | 0.94 |
| ≥20,000 < 70,000 | 1.75 | 1.74 | 1.89 | 1.81 | 1.47 | 1.64 | 0.94 |
| ≥70,000 < 150,000 | 1.72 | 1.74 | 1.89 | 1.67 | 1.35 | 1.48 | 0.86 |
| ≥150,000 | 1.60 | 1.61 | 1.63 | 1.61 | 1.40 | 1.60 | 1.00 |
| Years | Total, bln. UAH | Structure by Enterprises, % | |||
|---|---|---|---|---|---|
| Total | Large | Medium | Small | ||
| electric power generation, transmission and distribution | |||||
| 2013 | 410,682 | 100 | 82.86 | 13.01 | 4.13 |
| 2014 | 423,613.6 | 100 | 85.32 | 12.31 | 2.36 |
| 2015 | 463,854.4 | 100 | 82.20 | 15.35 | 2.44 |
| 2016 | 521,717.8 | 100 | 81.37 | 14.71 | 3.92 |
| 2017 | 568,503.1 | 100 | С | с | 6.16 |
| 2018 | 664,787 | 100 | С | с | 11.68 |
| 2019 | 797,604.2 | 100 | 66,10 | 19.65 | 14.25 |
| production of electricity | |||||
| 2013 | 311,625.5 | 100 | 85.37 | 9.67 | 4.96 |
| 2014 | 301,482.2 | 100 | 89.85 | 7.47 | 2.68 |
| 2015 | 319,365 | 100 | 88.58 | 8.85 | 2.57 |
| 2016 | 342,608.3 | 100 | 87.06 | 7.52 | 5.42 |
| 2017 | 369,383.7 | 100 | 86.41 | 5.06 | 8.53 |
| 2018 | 422,771.3 | 100 | 75.64 | 7.50 | 16.86 |
| 2019 | 503,665.9 | 100 | 63.47 | 15.27 | 21.26 |
| transmission of electricity | |||||
| 2013 | 15,144.97 | 100 | 98.27 | 1.19 | 0.55 |
| distribution of electricity | |||||
| 2013 | 57,160.98 | 100 | 95.25 | 3.14 | 1.60 |
| 2014 | 68,903.77 | 100 | 96.90 | 1.71 | 1.39 |
| 2015 | 78,071.69 | 100 | 94.06 | 4.20 | 1.75 |
| 2016 | 101,047.2 | 100 | 95.25 | 3.70 | 1.05 |
| 2017 | 114,623.8 | 100 | 96.03 | 2.34 | 1.63 |
| 2018 | 141,747.9 | 100 | 96.56 | 2.56 | 0.88 |
| trade of electricity | |||||
| 2013 | 26,750.57 | 100 | 18.49 | 79.70 | 1.81 |
| 2019 | 65,407.13 | 100 | 15.78 | 77.02 | 7.21 |
| Years | Structure by Enterprises, % | |||
|---|---|---|---|---|
| Total | Large | Medium | Small | |
| electric power generation, transmission, and distribution | ||||
| 2013 | 61.47 | 70.35 | 22.68 | 5.45 |
| 2014 | 51.36 | 61.69 | −4.69 | −29.31 |
| 2015 | 41.74 | 55.93 | −26.43 | −7.27 |
| 2016 | 38.46 | 53.21 | −29.23 | −13.81 |
| 2017 | 39.61 | С | с | −27.30 |
| 2018 | 34.48 | С | с | −3.67 |
| 2019 | 33.82 | 51.27 | −5.27 | 6.78 |
| production of electricity | ||||
| 2013 | 67.93 | 75.55 | 32.52 | 5.77 |
| 2014 | 59.11 | 68.60 | −20.54 | −37.04 |
| 2015 | 52.99 | 65.80 | −56.90 | −10.10 |
| 2016 | 50.90 | 64.65 | −61.31 | −14.36 |
| 2017 | 52.06 | 63.68 | −11.26 | −28.05 |
| 2018 | 39.92 | 54.21 | −9.85 | −2.10 |
| 2019 | 36.19 | 54.30 | −3.49 | 10.61 |
| transmission of electricity | ||||
| 2013 | 64.32 | 65.61 | 16.01 | −62.03 |
| 2014 | с | С | с | −36.11 |
| 2015 | с | С | с | −12.95 |
| 2016 | с | С | с | 13.33 |
| 2017 | с | С | с | 7.58 |
| 2018 | с | С | с | 16.52 |
| 2019 | с | С | с | 39.55 |
| distribution of electricity | ||||
| 2013 | 45.00 | 46.08 | 38.26 | −5.91 |
| 2014 | 37.21 | 37.59 | 53.88 | −9.95 |
| 2015 | 24.78 | 23.57 | 65.25 | −7.46 |
| 2016 | 19.58 | 22.52 | −40.79 | −34.93 |
| 2017 | 20.21 | 22.23 | −15.47 | −47.20 |
| 2018 | 29.66 | 32.21 | −12.25 | −127.96 |
| 2019 | с | С | с | −204.39 |
| trade of electricity | ||||
| 2013 | 19.79 | 71.85 | 7.52 | 28.10 |
| 2014 | с | С | с | 24.37 |
| 2015 | с | С | с | 8.21 |
| 2016 | с | С | с | 28.75 |
| 2017 | с | С | с | 9.64 |
| 2018 | с | 58.48 | с | 3.99 |
| 2019 | −17.65 | 8.57 | −23.82 | −9.06 |
| Years | Electric Power Generation, Transmission, and Distribution (35.1) | Production of Electricity (35.11) | Transmission of Electricity (35.12) | Distribution of Electricity (35.13) | Trade of Electricity (35.14) | ||||||||||
|---|---|---|---|---|---|---|---|---|---|---|---|---|---|---|---|
| bln. UAH | Structure, % | Profitable Enterprises, % of the Total | bln. UAH | Structure, % | Profitable Enterprises, % of the Total | bln. UAH | Structure, % | Profitable Enterprises, % of the Total | bln. UAH | Structure, % | Profitable Enterprises, % of the Total | bln. UAH | Structure, % | Profitable Enterprises, % of the Total | |
| 2010 | 4363.9 | 100 | 51.5 | 2684.8 | 61.52 | 42.7 | 615.7 | 14.11 | 61.5 | 611.3 | 14.01 | 53.8 | 452.1 | 10.4 | 62.1 |
| 2011 | 9809.5 | 100 | 53.6 | 5886.8 | 60.01 | 41.8 | 951.9 | 9.70 | 50 | 1631.8 | 16.63 | 62.3 | 1339 | 13.6 | 67.1 |
| 2012 | 3765.1 | 100 | 48.9 | 1254.5 | 33.32 | 39.2 | 1230 | 32.1 | 60.9 | 960.1 | 25.50 | 56.5 | 311.5 | 8.3 | 66.7 |
| 2013 | 4445.2 | 100 | 45.1 | 2799.1 | 62.97 | 35.7 | 861.8 | 19.39 | 78.6 | 486.8 | 10.95 | 57.2 | 297.5 | 6.7 | 66.7 |
| 2014 | −22.231 | 100 | 43.9 | −20,039 | 90.14 | 34.9 | c | c | C | −1207.3 | 5.43 | 53.4 | C | c | c |
| 2015 | −26,760 | 100 | 52.2 | −18,523 | 69.22 | 44.6 | c | c | C | −7513.2 | 28.08 | 59.2 | C | c | c |
| 2016 | 1595.7 | 100 | 54.8 | 1266 | 79.33 | 48.2 | c | c | C | −2728.3 | −171.0 | 66.9 | C | c | c |
| 2017 | 1221.9 | 100 | 50.6 | −1991 | −162.9 | 43.5 | c | c | C | 439.1 | 35.94 | 64.9 | C | c | c |
| 2018 | 15,404 | 100 | 45.9 | 9351.1 | 60.70 | 41.2 | c | c | C | 876.4 | 5.69 | 65.7 | C | c | c |
| 2019 | 13,093 | 100 | 53.1 | 10,454 | 79.84 | 49.1 | c | c | C | c | c | c | 2353 | 18.0 | 67.3 |
| Indicators | Units | 2007 | 2008 | 2009 | 2010 | 2011 | 2012 | 2013 | 2014 | 2015 | 2016 | 2017 | 2018 | 2019 |
|---|---|---|---|---|---|---|---|---|---|---|---|---|---|---|
| Total primary energy supply, of which | bln. Toe | 139 | 135 | 114 | 132 | 126 | 123 | 116 | 106 | 90.1 | 94.4 | 89.5 | 93.5 | 89.1 |
| Hydroenergy | thsd. Toe | 872 | 990 | 1026 | 1131 | 941 | 901 | 1187 | 729 | 464 | 660 | 769 | 897 | 560 |
| % of total | 0.6 | 0.7 | 0.9 | 0.9 | 0.7 | 0.7 | 1,0 | 0.7 | 0.5 | 0.7 | 0.9 | 0.9 | 0.6 | |
| Energy of biofuels and wastes | thsd. Toe | 1508 | 1610 | 1433 | 1476 | 1563 | 1522 | 1875 | 1934 | 2102 | 2832 | 2989 | 3208 | 3362 |
| % of total | 1.1 | 1.2 | 1.3 | 1.1 | 1.2 | 1.2 | 1.6 | 1.8 | 2.3 | 3.0 | 3.3 | 3.4 | 3.8 | |
| Wind and solar energy | thsd. Toe | 4 | 4 | 4 | 4 | 10 | 53 | 104 | 134 | 134 | 124 | 149 | 197 | 426 |
| % of total | 0.0 | 0.0 | 0.0 | 0.0 | 0.0 | 0.0 | 0.1 | 0.1 | 0.1 | 0.1 | 0.2 | 0.2 | 0.5 | |
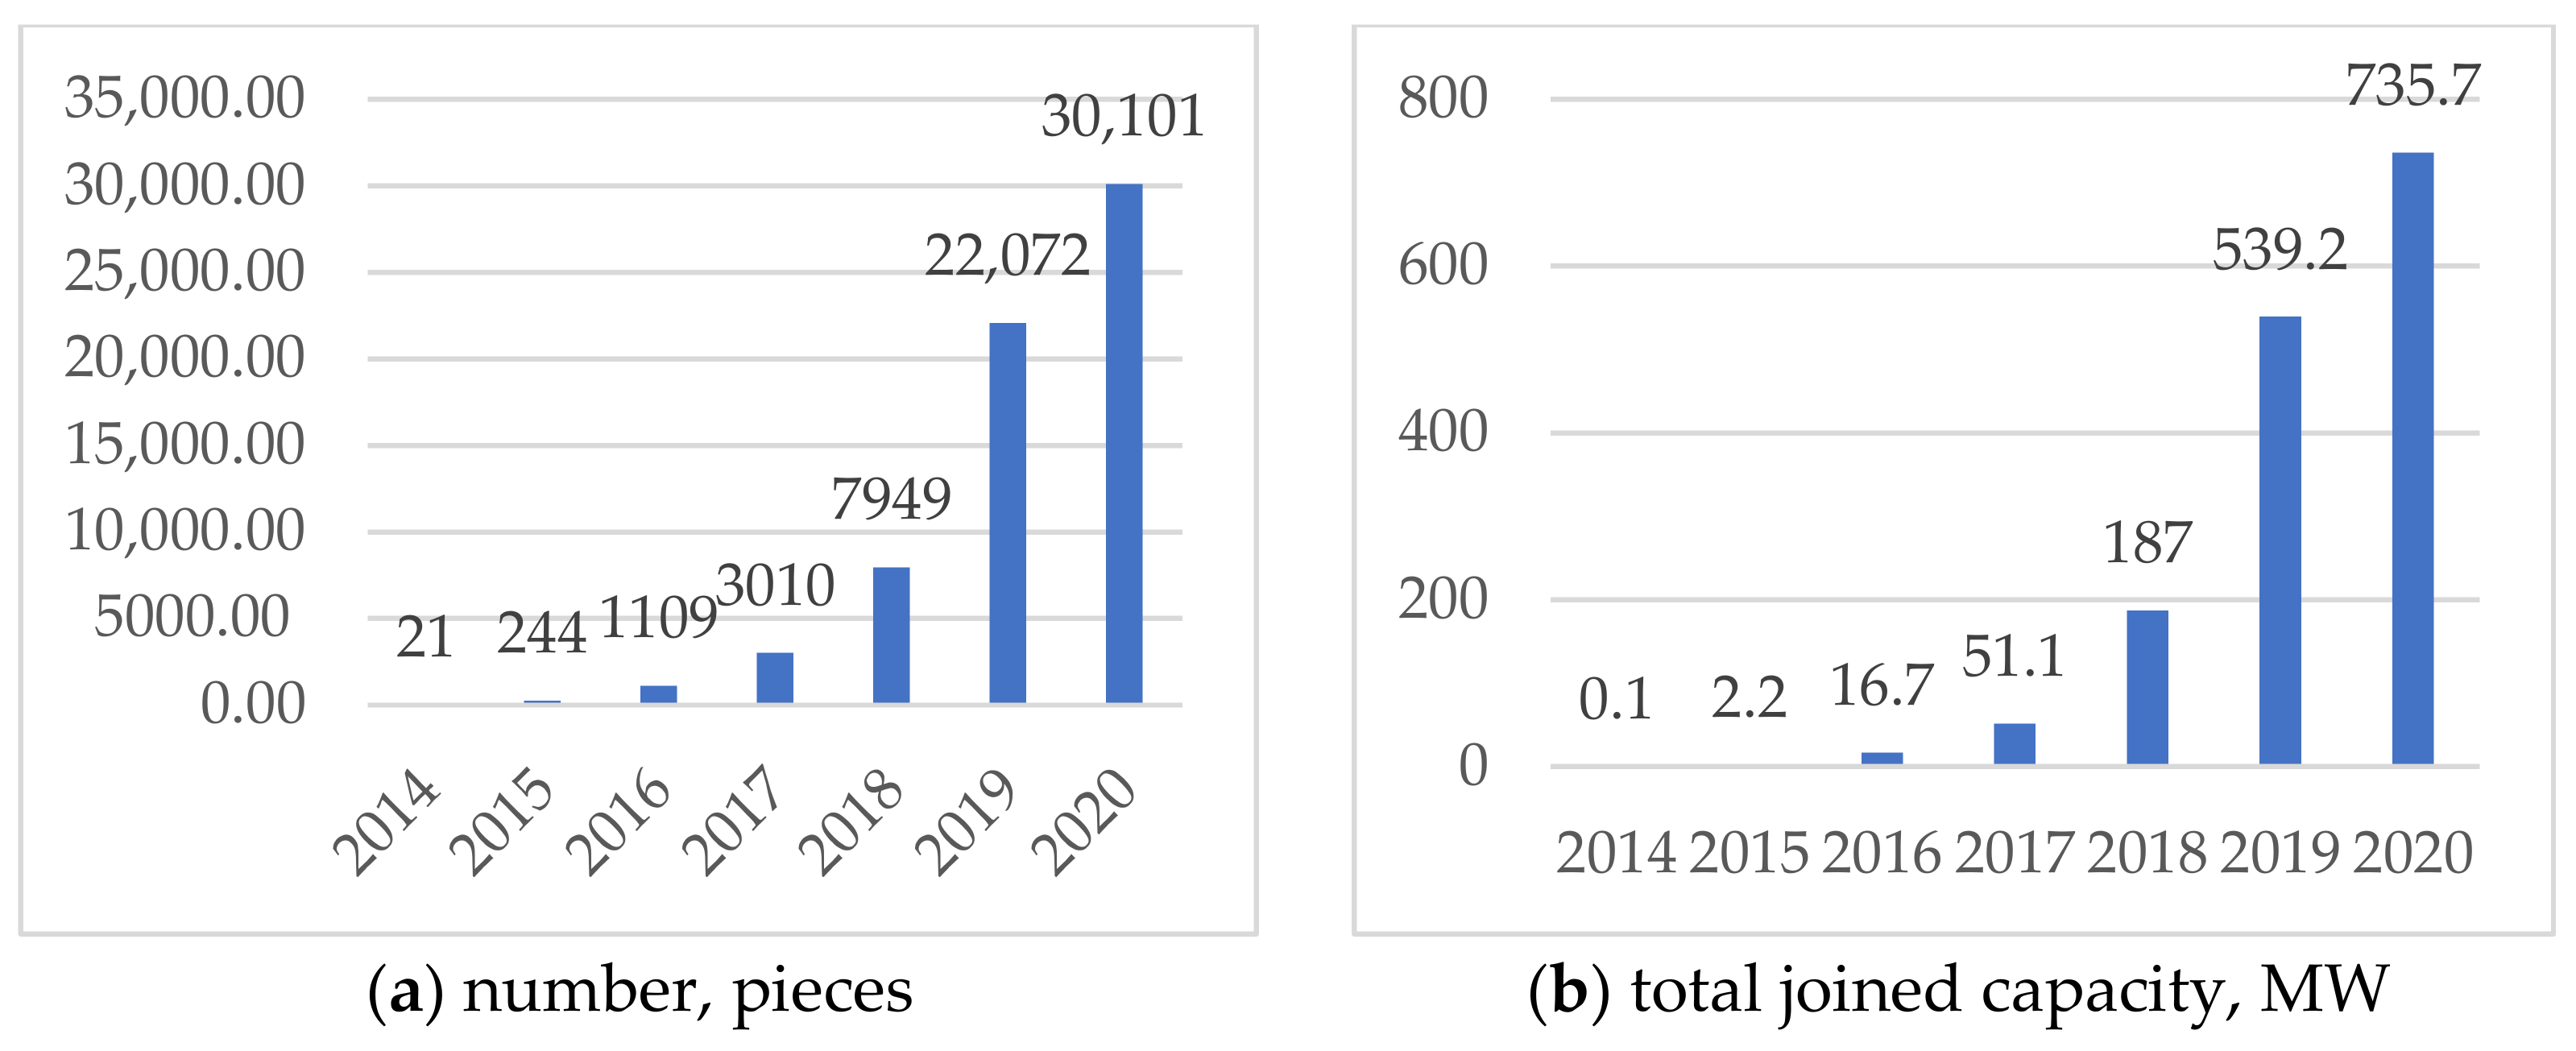
| Total energy from renewable sources | thsd. Toe | 2384 | 2604 | 2463 | 2611 | 2514 | 2476 | 3166 | 2797 | 2700 | 3616 | 3907 | 4302 | 4348 |
| share of energy supply, % | 1.7 | 1.9 | 2.2 | 2.0 | 2.0 | 2.0 | 2.7 | 2.6 | 3.0 | 3.8 | 4.4 | 4.6 | 4.9 |
| GRI Standards | SE “NNEGC “Energoatom” | DTEK |
|---|---|---|
| General Disclosures | ||
| Organizational profile | 102-1:102-13 | 102-1:102-13 |
| Strategy | 102-14 | 102-14 |
| Key impacts, risks, and opportunities | 102-15 | |
| Ethics and integrity | 102-16 | 102-16, 102-17 |
| Corporate governance | 102-18, 102-20:102:23 | 102-18:102-39 |
| Stakeholder engagement | 102-40:102-43 | 102-40:102-44 |
| Reporting practice | 102-45:102-56 | 102-45:102-56 |
| Management approach | 103-1:103-3 | |
| Specific Disclosures | ||
| Economic | ||
| Economic performance | 201-1 | 201-1:201-4 |
| Market presence | 202-1, 202-2 | |
| Indirect economic impacts | 103-2, 203-1, 203-2 | 203-1, 203-2 |
| Procurement practices | 103-1, 103-2, 204-1 | 204-1 |
| Anti-corruption | 205-1:205-3 | |
| Anti-competitive behavior | 206-1 | |
| Environment | ||
| Materials | 301-1, 301-2 | |
| Energy | 103-1, 103-2, 302-1, 302-4 | 302-2, 302-4, 302-5 |
| Water | 303-3, 303-4, 303-5 | 303-1:303-3 |
| Biodiversity | 103-1, 103-2, 304-2, 304-4 | 304-1:304-4 |
| Emissions | 103-1, 103-2, 305-1, 305-6, 305-7 | 305-1:305-7 |
| Effluents and waste | 103-1, 103-2, 306-1, 306-2 | 306-1:306-5 |
| Environmental compliance | 307-1 | |
| Supplier environmental assessment | 308-1 | |
| Social | ||
| Employment | 401-2 | 401-2 |
| Labor management relations | 103-1, 103-2, 402-1 | 402-1 |
| Occupational health and safety | 403-2, 403-5, 403-6, 403-9 | 403-1:403-4 |
| Training and education | 103-2, 404-1, 404-2 | 404-1:404-3 |
| Diversity and equal opportunity | 405-1 | 405-1 |
| Non discrimination | 406-1 | 406-1 |
| Freedom of association and collective bargaining | 407-1 | |
| Child labor | 408-1 | 408-1 |
| Forced or compulsory labor | 409-1 | 409-1 |
| Local communities | 103-2, 413-1, 413-2 | 413-1 |
| Customer health and safety | 416-1, 416-2 | |
| Marketing and labeling | 417-1, 417-2 | |
| Socioeconomic Compliance | 419-1 | 419-1 |
Publisher’s Note: MDPI stays neutral with regard to jurisdictional claims in published maps and institutional affiliations. |
© 2021 by the authors. Licensee MDPI, Basel, Switzerland. This article is an open access article distributed under the terms and conditions of the Creative Commons Attribution (CC BY) license (https://creativecommons.org/licenses/by/4.0/).
Share and Cite
Kostyrko, R.; Kosova, T.; Kostyrko, L.; Zaitseva, L.; Melnychenko, O. Ukrainian Market of Electrical Energy: Reforming, Financing, Innovative Investment, Efficiency Analysis, and Audit. Energies 2021, 14, 5080. https://doi.org/10.3390/en14165080
Kostyrko R, Kosova T, Kostyrko L, Zaitseva L, Melnychenko O. Ukrainian Market of Electrical Energy: Reforming, Financing, Innovative Investment, Efficiency Analysis, and Audit. Energies. 2021; 14(16):5080. https://doi.org/10.3390/en14165080
Chicago/Turabian StyleKostyrko, Ruslan, Tetiana Kosova, Lidiia Kostyrko, Liudmyla Zaitseva, and Oleksandr Melnychenko. 2021. "Ukrainian Market of Electrical Energy: Reforming, Financing, Innovative Investment, Efficiency Analysis, and Audit" Energies 14, no. 16: 5080. https://doi.org/10.3390/en14165080
APA StyleKostyrko, R., Kosova, T., Kostyrko, L., Zaitseva, L., & Melnychenko, O. (2021). Ukrainian Market of Electrical Energy: Reforming, Financing, Innovative Investment, Efficiency Analysis, and Audit. Energies, 14(16), 5080. https://doi.org/10.3390/en14165080