Article

Effect of Concrete Micro-Mechanical Properties under the Coupled Corrosion of Sulfate and High Water Head

1
School of Civil Architecture and Environment, Hubei University of Technology, Wuhan 430068, China
2
College of Engineering, Shantou University, Shantou 515063, China
3
Institute of Rock and Soil Mechanics, Chinese Academy of Sciences, Wuhan 430071, China
*
Author to whom correspondence should be addressed.
Energies 2021, 14(16), 5039; https://doi.org/10.3390/en14165039
Submission received: 11 July 2021 / Revised: 4 August 2021 / Accepted: 10 August 2021 / Published: 17 August 2021

Abstract

:
Large-scale water infrastructure such as immersed tunnels remain in a seawater environment for a long time, and gradually deteriorate under the action of high water head, soil pressure and corrosive ions in seawater solution. In order to simulate the corrosion damage and deterioration of concrete in seawater environment, 10% Na2SO4 solution was used to conduct indoor corrosion tests on concrete samples under different water heads and for different durations. The corrosion damage and micro-mechanical properties of concrete under the coupled action of high water head and sulfate are studied by micro-indentation tests. The effect of sulfate ion corrosion and complex mechanical loading was studied. The effect of micro-mechanical properties of concrete is studied on time and space. Numerical simulation and test results show that the results of micro-indentation are in good agreement with the fitting curves. The chemical damage rate and the corrosion depth increase with the increase of water head; the numerical simulation analysis shows that the sulfate concentration is high in the area where the mechanical damage variable is large, which indicates that the two kinds of corrosion occur in concrete and interact with each other.

1. Introduction

Large-scale water infrastructure is a key project for national economic development and public security. With the rapid development of social economy, there are more and more large water infrastructure construction projects, and various engineering problems associated with them become increasingly prominent. As an important type of large water infrastructure, the operational environment of immersed tunnels is quite different from that of common tunnels. The concrete of immersed tunnels is continuously exposed to sea water. Under the joint action of high water head, large soil pressure and corrosive ions ( S O 4 2 , Cl, H C O 3 , H+) in seawater, the performance of immersed tunnels gradually deteriorates. The complex environment of hydro-mechanical-chemistry (HMC) coupling corrosion seriously threatens the durability of immersed concrete structures. Therefore, it is of great significance to study the coupling mechanism of sulfate ion and mechanical load for evaluating the long-term stability of immersed concrete structures in complex environments.
Many HMC coupling studies have been carried out. Idiart et al. [1] proposed a hydrochemical mechanical (HCM) model to study the effect of reactive transport on the long-term evolution of swelling pressure of bentonite under confined and partially saturated conditions. Yue et al. [2] solved the chloride ion transport in the coupled and diffusion regions by using the variable separation method and variable substitution method. Tan [3] established the chloride ion transmission equation of concrete under multi-salt and multi-field coupling effects. Liu [4] systematically studied the deterioration law of concrete materials using the method of design simulation test and theoretical analysis. Liu [5] systematically studied the basic physical, mechanical properties and microfracture mechanism and damage evolution law of sulfate corroded concrete under high strain rate through split Hopkinson pressure bar (SHPB) test system. Zhao [6] proposed a chemical mechanical coupling model to predict the effect of seepage corrosion on the aging deformation of concrete dams. Li [7] analyzed the plastic damage evolution of soil based on Coulomb stress–strain coupling theory. Khanzaei [8] analyzed the interaction between seepage field and stress field of an RCC dam based on coupled and uncoupled models.
Many scholars use the traditional indoor mechanical tests to study the overall macro-mechanical properties of the cement. The mechanical properties of the specimens at different erosion depths are different, especially the mechanical properties of the specimen surface and the shallower erosion depth. The damage and elastic evolution of the microstructure of cement-based materials are reflected in the microscopic tests. Gu et al. [9] obtained the basic information of deformation and fracture behavior of brittle materials during precision and ultra-precision grinding by micro-indentation test. Karine et al. [10] obtained the elastic modulus damage and hardness value of cement clinker by nano-indentation test. Constantinides et al. [11] introduced some nano indentation tools for cement materials. Ramachandra et al. [12] studied the characterization and micro-mechanical properties of ultra-high strength concrete by micro-indentation test.
In this paper, we use micro-indentation technology to test the elastic modulus of concrete in multiple layers and points under the coupled corrosion of sulfate and high water head. The mechanical damage variable caused by crack propagation is deduced in the finite element model by using the meso-mechanics theory. The deterioration model of concrete under complex stress state and HMC coupling corrosion is established, and the corrosion damage depth under different compressive stress states is compared to explore the damage. This paper provides scientific basis for understanding the deterioration law of underground concrete structure under complex marine corrosion environment.

2. Materials and Methods

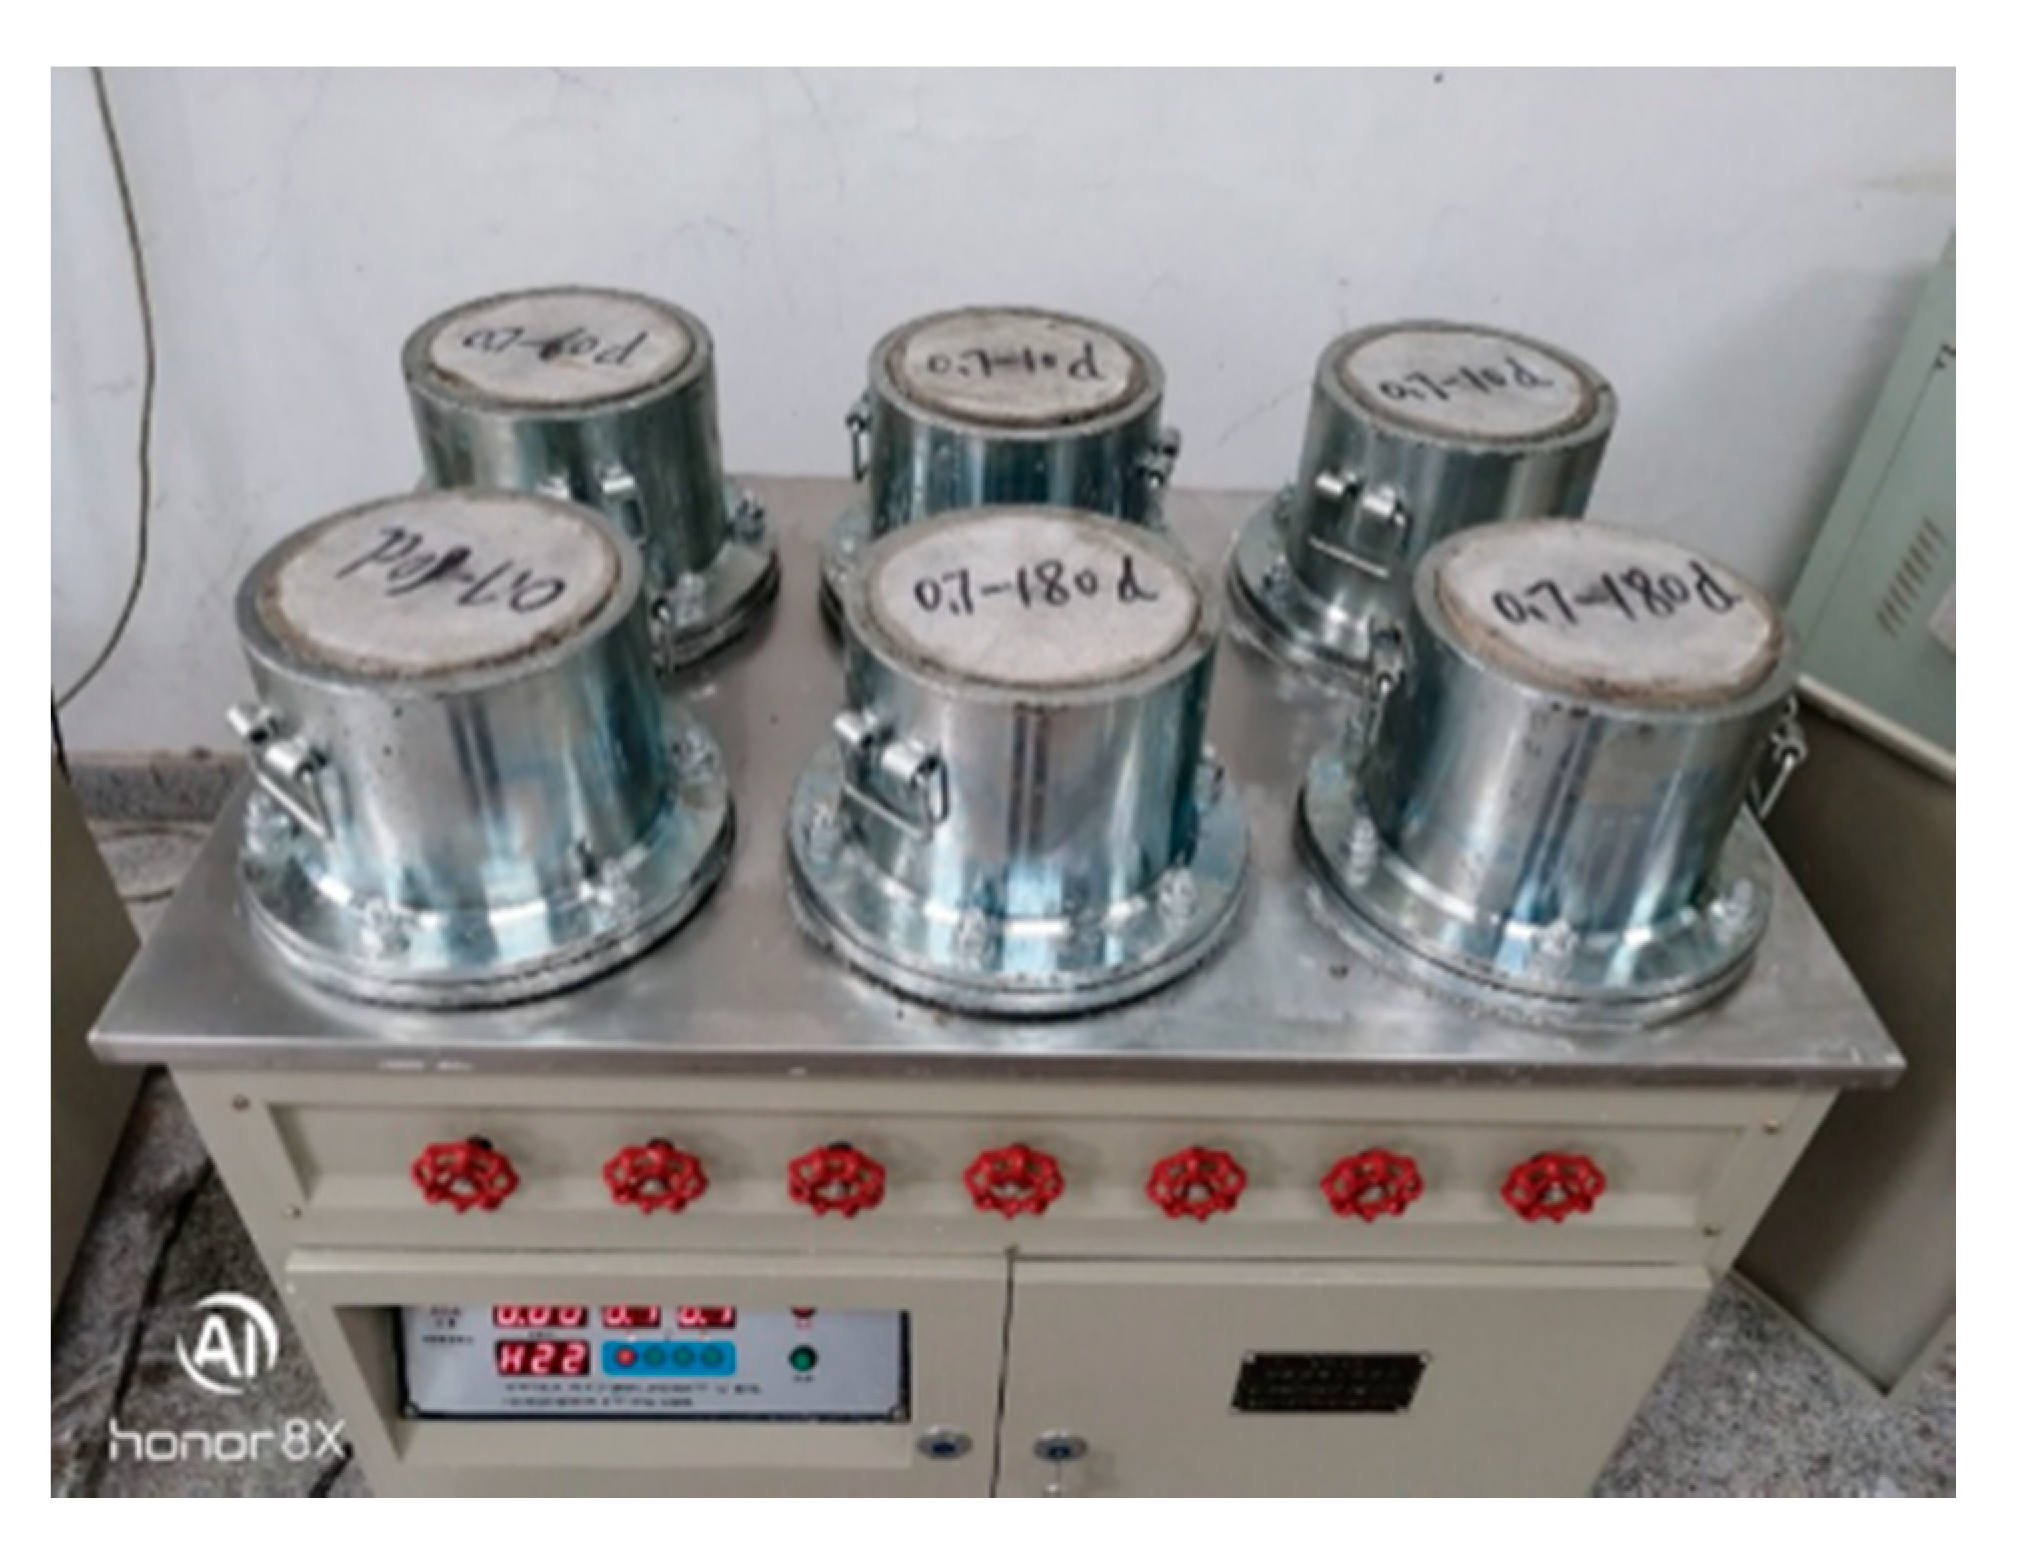
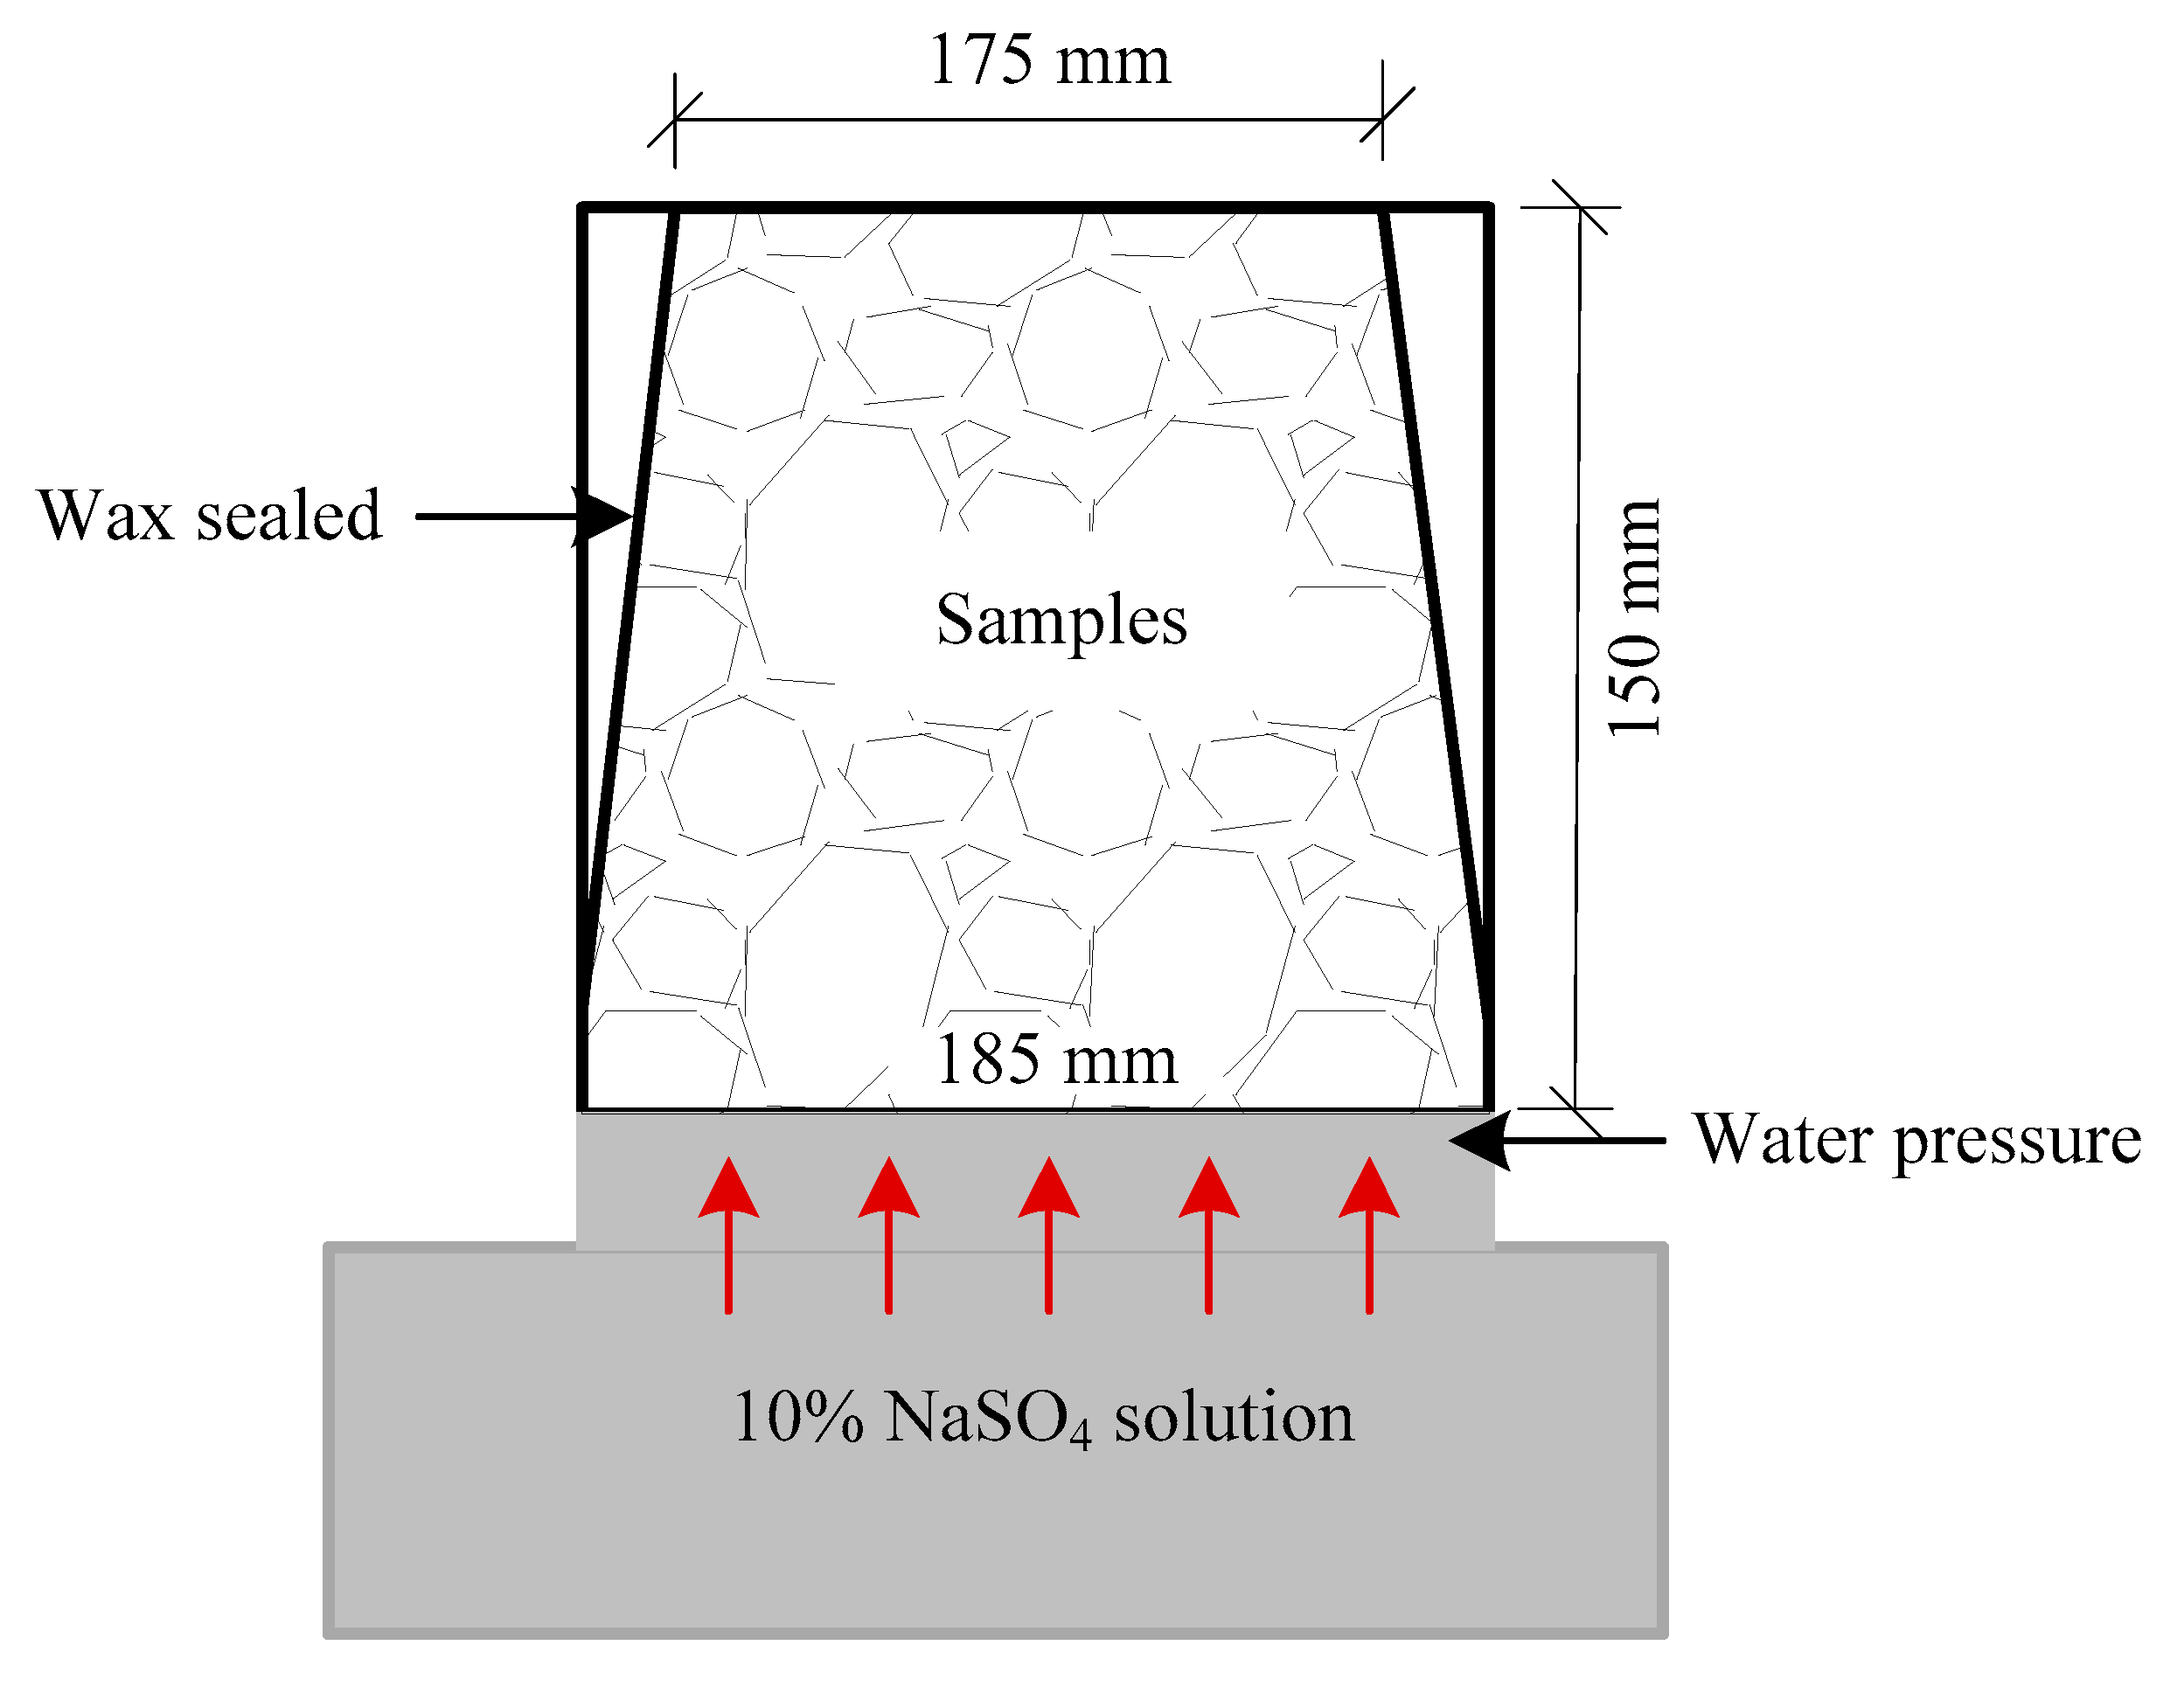
2.1. Preparation of Test Materials

An immersed tube tunnel is a mass concrete structure which is more than 30 m under water and bears high water pressure. It has strict requirements on the chloride ion permeability, water pressure permeability and crack resistance of its concrete. The concrete used in the test is C50, made of gravel, sand, cement and water, and its strength grade is not less than 42.5 MPa. The cement quality meets the standard “general Portland cement” (GB 175-2007) types I and II low alkali Portland cement [13], and the fly ash meets class F class I and quasi grade I fly ash specified in “fly ash for cement and concrete” (GB/T 1596-2005) [14]. The specific surface area of slag powder is controlled at 400–500 m2/kg, which meets the requirements of S95 slag powder in standard “ground blast furnace slag powder for cement and concrete” (GB/T 18046-2008) [15]. Fine aggregate was clean natural medium coarse river sand with reasonable gradation, uniform and firm texture, low water absorption and small porosity. In order to ensure that the concrete was filled and to obtain good durability, the continuous graded crushed stone with the maximum particle size no more than 10 mm was selected for the test. The other indexes conformed to the standard “pebbles and gravel for construction” (GB/T 14685-2011) [16]. The optimized concrete parameters are shown in Table 1. The specific size of the specimen is 185 mm in down-diameter, 175 mm in up-diameter and 150 mm in height. After hardening and molding, the specimens were placed in the standard curing room, and the curing age was 28 days. Before the test, the sides of the samples were sealed with wax according to the standard for test methods of long-term performance and durability of ordinary concrete (GB/T 50082-2009) [17].
The high water head–sulfate attack concrete tests were conducted after the specimens were taken from the curing room. The concrete sulfate attacked instrument used was the digital concrete impermeability instrument from Institute of Architectural Design (Beijing, China). The corrosion duration in the experiments was 0, 5, 10, 60 and 180 days. The corrosion solution was 10% Na2SO4, and the water head was 0, 0.7 and 1.4 MPa respectively. The results are the average values of the test results of two test blocks. In Table 2 p represents water pressure, units MPa; t represents curing time, units days. The concrete penetration instrument for the test meets the requirements of GB/T 50082-2009 [17]. The test instrument is shown in Figure 1 and Figure 2. Take the label 1.4–60 d on the upper surface of the specimen in the Figure 1 as an example, 1.4 represents the applied water pressure (MPa), and 60 d is the number of days the concrete has been corroded (d). After the samples reach the specified time and water pressure, a part of the samples was cored, cut and ground to prepare a cube sample with the size of 50 × 50 × 30 mm for micro-indentation tests. The other samples were cored and cut into cylinder samples with φ 25 × 30 mm.

2.2. Principle and Test Method of Micro-Indentation

The prepared cube samples were dehydrated by ethanol. Then, the samples were ground and polished on an automatic polishing machine. The samples were ground with silicon carbide paper (P80 grain) with 100% ethanol as lubricant. The corrosion tests were conducted once for each grinding depth of 1 mm. The samples were polished with metadi single crystal diamond suspension (the particle size is 9 μm, 3 μm and 1 μm in order) and then polished by alumina slurry (0.05 μm particle size). In each polishing step, the material equivalent to three times of the previous abrasive particle size was removed. The samples were stored in a dryer for micro-indentation tests as shown in Figure 3. In order to ensure that the indentation test results were not affected by the surface roughness, the roughness of the samples was tested by a three-dimensional non-contact surface topography instrument of NANOVEA company (Irvine, CA, USA) after polishing. We referred to the international standard “metallic materials—Instrumental indentation test for hardness and material parameters” (ISO 14577-1-2015) [18]. The samples were polished until the roughness inspection was qualified. Ultrasonic cleaning was used.
The 3D non-contact surface topography instrument of NANOVEA is shown in Figure 4. A diamond pyramid Vickers indenter was used to obtain the load displacement data by controlling the maximum load and loading speed. The experimental load range is 1–200.00 N, the loading accuracy is 0.01 N, the loading rate is 5–100 N/min, and the displacement measurement range is 0.5–400 μm. The load and displacement of the instrument have a self-calibration module, and the system contact error is less than 1 μm.
The concrete samples after corrosion have a three-phase structure composed of hydration products produced by calcium hydroxide, fine aggregate and coarse aggregate. The analysis of corrosion damage and deterioration performance of samples was mainly aimed at hydration products. The indentation points were selected artificially by optical microscope, so that all indentation tests were carried out on hydration products. According to industrial experiences and international standard ISO 14577-1-2015 [18], the maximum test force of the indentation tests was determined to be 15 N. The load control mode was adopted in the test. When the indenter contacts the surface of the sample, the pressure is linearly loaded to 15 N at 30 N/min, and the pressure is linearly unloaded at 30 N/min after 10 s of dead load. Based on the above test principles, the micro-indentation tests were carried out in the range of 0–3 mm corrosion depth (two samples were selected for each test, each sample was subjected to 100 micro-indentation tests, so that 200 data points were tested in each group). The test temperature was maintained at 24 ± 2 °C.
The principle of micro-indentation is to press a small indenter into the material to obtain the load–displacement curve. Figure 5 and Figure 6 show the typical indentation cross-section diagram and the typical loading and unloading load–displacement curve, respectively, where the horizontal axis h is the indenter penetration depth, the vertical axis is the load F, hmax is the maximum indentation depth in the test, hp is the depth of residual indentation after unloading, hr is the intersection point of tangent line and horizontal axis at the maximum load of unloading curve, and Fmax is the maximum test load. Based on the principle of Oliver-Pharry [19], the elastic modulus E can be calculated by Equations (1)–(4)
E r = π 2 β S A ( h c )
S = ( d F d h ) h = h max
h c = h max ε F m S
1 E r = 1 ν 2 E + 1 ν i 2 E i
where Er is the indentation modulus, Ei is the elastic modulus of the indenter, and νi is the Poisson’s ratio of the indenter. For a diamond indenter, Ei = 1141 GPa, νi = 0.07. For each phase 0.2–0.3 of cement-based material hardening paste, this paper takes 0.25. S is the contact stiffness, hc is the contact depth between the indenter and the specimen, and A(hc) is the projected contact area between the indenter and the specimen, which is related to the contact depth of hc. β is the constant related to the geometry of the indenter, ε is the constant related to the shape of the indenter, and for the Vickers indenter, β = 1.012, ε = 0.75.

3. Establishment of Numerical Method

3.1. Elastoplastic Damage Model

In order to describe the mechanical properties of concrete, an elastic-plastic mechanical model is used in this paper. The creep mechanism caused by chemical damage is very complicated, and the plastic strain caused by chemical damage plays a dominant role in the deformation of concrete. Therefore, creep is not considered in this paper.
The elastic constitutive model of concrete is: σ = C ( d m , d c ) : ( ε ε p ) .
Where C ( d m , d c ) is the stiffness tensor of concrete. dm is the mechanical damage variable, dc is the chemical damage variable and εp is the plastic strain.
It is assumed that concrete is an isotropic material, and the elastic stiffness tensor of concrete can be expressed as [20]
C ijkl ( d m , d c ) = λ ( d m , d c ) δ i j δ k l + μ ( d m , d c ) ( δ i k δ j l + δ i l δ j k )
λ ( d m , d c ) = E ( d m , d c ) ν ( d m , d c ) ( 1 + ν ( d m , d c ) ) ( 1 2 ν ( d m , d c ) )
μ ( d m , d c ) = E ( d m , d c ) 2 ( 1 + ν ( d m , d c ) )
where λ ( d m , d c ) and μ ( d m , d c ) are the Lamé constants, E ( d m , d c ) and ν ( d m , d c ) are elastic modulus and Poisson’s ratio, δ i j is the Kronecker delta function.
The mechanical damage (dc) and mechanical damage (dm) are considered in the constitutive model, a modified Drucker–Prager elastoplastic damage model is used. The yield function of concrete is as follows [21,22]:
f = β ( d c ) I 1 + 3 J 2 η ( d c ) · α p ( γ p , d m )
I 1 = σ k k   , J 2 = 1 2 s i j s i j , s i j = σ i j σ k k 3 δ i j
where, I1 is the first stress invariant, J2 is the second deviatoric stress invariant, respectively; sij is the deviatoric stress; α p ( γ p , d m ) is the plastic hardening function; σ k k = σ 11 + σ 22 + σ 33 , σkk is the sum of the diagonal elements of the effective stress tensor; β and η are two material parameters, respectively:
β = R c ( d c ) R t ( d c ) R c ( d c ) + R t ( d c ) ,   η = 2 R t ( d c ) R c ( d c ) + R t ( d c ) R c ( d c )
The two material parameters of Rt and Rc are obtained by uniaxial tension and uniaxial compression tests. The specific calculation method is shown in Equations (17) and (18).
In Equation (8), α p ( γ p , d m ) is a function of the mechanical damage variable (dm) and the internal plastic hardening variable ( γ p ) . The compression curve of concrete is linear rise, nonlinear rise and strain softening [23]. α p ( γ p , d m ) is the increasing function of ( γ p ) and the decreasing function of (dm). The plastic hardening function is [24]
α p ( γ p , d m ) = ( 1 d m ) [ α min p + ( α max p α min p ) γ p b p + γ p ]
where α max p and α min p represent the maximum and minimum values of plastic hardening, respectively. bp is the evolution rate of the plastic hardening function. In this paper, the associated flow rule is adopted and the equivalent plastic strain is taken as the internal variable of plastic hardening
d γ p = 2 3 d ε i j p d ε i j p ,   d ε i j p = d λ f σ i j
where d ε i j p is the plastic strain increment. Referring to the research of Hu et al. [22], the generation and development of microcracks are related to the macroscopic plastic strain of concrete. Relationship between mechanical damage variable and equivalent plastic strain:
d m = d m c [ 1 exp ( b d γ p ) ]
where dmc is the maximum value of mechanical damage variable, parameter bd is the evolution rate of mechanical damage, and the internal variable of plastic hardening γ p is determined by Equation (8). The relationship between elastic stiffness tensor C ( d m , d c ) and mechanical damage variable dm is expressed as follows:
C ( d m , d c ) = C ( d c ) ( 1 L 1 d m )
where C(dc) is the equivalent elastic strain tensor of concrete under a certain degree of chemical attack. L1 is a meso-mechanical parameter, which indicates the influence of microcracks on the macro mechanical properties of concrete. The evolution and development of microcracks in concrete will affect the evolution of mechanical damage variables (dm), and the chemical damage variables (dc) also affect the elastic stiffness tensor of concrete. According to the research results of Hu [25], the elastic stiffness tensor of concrete is expressed as follows:
C ( d m , d c ) = ( 1 L 1 ) ( 1 L 2 ) C 0
where C0 is the initial elastic stiffness tensor of concrete and L2 is the influence degree of chemical damage on concrete stiffness tensor. Budiansky et al. [26] solved the expression of parameter L1 by using micro-mechanical method and sparse homogenization theory
L 1 = 32 15 1 - ν 0 2 - ν 0 L
where ν 0 is the Poisson’s ratio of concrete, the value range is [0.15, 0.22], thus the values of parameters L1 and L2 can be determined. Similarly, both the uniaxial compressive strength and the uniaxial tensile strength of concrete are related to the damage variable. β ( d c ) and η ( d c ) can be expressed as:
β ( d c ) = 2 ( 1 d c ) R c 0 R c 0 ( 1 d c ) + R t 0 ( 1 d c ) 1 = 2 R c 0 R c 0 + R t 0 1
η ( d c ) = 2 ( 1 d c ) R t 0 ( 1 d c ) R c 0 R c 0 ( 1 d c ) + R t 0 ( 1 d c ) = 2 ( 1 d c ) R t 0 R c 0 R c 0 + R t 0
where R c 0 and R t 0 are the initial uniaxial compressive strength and the initial uniaxial tensile strength of the concrete.

3.2. Sulfate Corrosion Model

It is assumed that ettringite produced by corrosion is the only factor causing expansion cracking of concrete. The chemical reaction mechanism of ettringite formation is [27]:
N a 2 S O 4 + C H + 2 H C S ¯ H 2 + 2 N a O H
C 4 A H 13 + 3 C S ¯ H 2 + 14 H C 6 A S ¯ 3 H 32 + C H
C 4 A S ¯ H 13 + 2 C S ¯ H 2 + 16 H C 6 A S ¯ 3 H 32
C 3 A + 3 C S ¯ H 2 + 26 H C 6 A S ¯ 3 H 32
where the chemical symbols of cement are H: H2O, S ¯ : SO3, A: Al2O, S: SiO2, C: CaO. If the infiltrated sulfate ion reacts with calcium hydroxide to form gypsum, gypsum reacts with aluminate to form ettringite. The chemical reaction equation is simplified as [27,28]
C A + q C S ¯ H 2 C 6 A S ¯ 3 H 32
C A = γ 1 C 3 A + γ 2 C 4 A H 13 + γ 3 C 4 A S ¯ H 12
q = 3 γ 1 + 3 γ 2 + 3 γ 3
where CA is the equivalent aluminate term (including C3A, C4AH13, C 4 A S ¯ H 12 ), q is the equivalent stoichiometric number of sulfate and γ i is the stoichiometric number of aluminate term. The concentration of sulfate ions in the concrete pore solution can be determined by the diffusion reaction equation. Sun et al. [29] obtained the partial differential equation of sulfate ion diffusion reaction in pore solution based on the mass conservation equation of sulfate ions in the pore solution
( φ U S O 4 ) t = · ( D ( φ U S O 4 ) ) k ( φ U S O 4 ) ( U C A )
where U S O 4 is the molar concentration of sulfate ions in the pore solution, U C A is the molar concentration of aluminate in concrete, φ is the porosity of concrete, D is the diffusion coefficient of sulfate ions in porous media, and k ( φ U S O 4 ) ( U C A ) is the chemical second-order reaction term representing the consumption rate of sulfate ions in pore solution. According to the chemical reaction formula, the consumption rate of sulfate ions and aluminate in pore solution is:
d ( φ U S O 4 ) d t = k ( φ U S O 4 ) ( U C A ) ,   d ( φ U C A ) d t = k q ( φ U S O 4 ) ( U C A )
It is assumed that the distribution of aluminate in concrete is uniform and not diffuse. The mass conservation equation of the aluminate term can be obtained as:
( φ U C A ) t = k q ( φ U S O 4 ) ( U C A )
Bentz et al. [30] found that the total concentration of sulfate in concrete can be used as the driving force of chemical damage. In order to determine the chemical damage variable, the total concentration distribution of sulfate in concrete is defined
C ^ = φ U S O 4 + q U C A R
where U C A R is the concentration of aluminate consumed in the reaction. According to the chemical reaction equations, so
( φ U C A R ) t = k q ( φ U S O 4 ) ( U C A )
C ^ t = D 2 ( C ^ q U C A R )
The aluminate term in concrete is fixed, non-diffusion and uniformly distributed, so 2 U C A R = 0 . Therefore, the evolution and distribution of total sulfate concentration in concrete meet the following requirements:
C ^ t = D 2 C ^
where D is the diffusion coefficient. Sun et al. [29] used the phenomenological method to determine the diffusion coefficient of sulfate ions.
D = ( φ + d c ) D s
where Ds is a constant and represents the diffusion coefficient of sulfate ions in concrete. φ is the porosity of concrete and dc is the chemical damage variable caused by sulfate:
d c = 1 E E 0
where E0 is the initial elastic modulus of the concrete. Since the concrete structure will not be damaged in the early stage of corrosion, it is assumed that the chemical damage variable of the early growth of the elastic modulus of concrete is 0 and the chemical damage variable is [29]
d c = { 0 0 < t < t 1 ( 1 φ 0 ) ( 1 exp ( a D t t 1 t 0 ) ) t 1 t < t max
where aD is the fitting parameter, t is the immersion duration of concrete samples in sulfate, tmax is the time of complete failure of concrete, and t1 is the time when chemical damage begins to appear. The degree of chemical damage of concrete varies with the concentration of sulfate [30,31,32]. Assuming that the concentration of sulfate in the concrete sample is proportional to the immersion time, the chemical damage variable becomes:
d c = { 0 0 < C ^ < C ^ 1 ( 1 φ 0 ) ( 1 exp ( a D t t 1 t 0 ) )   C ^ 1   C ^ < C ^ max
  C ^ max = φ U 0 + q U C A ,   C ^ 1 = t 1 t 0   C ^ max
where   C ^ max is the maximum concentration of sulfate in concrete, U0 is the concentration of sulfate solution immersed in concrete, C1 is the concentration of sulfate in concrete when chemical damage just occurs, and φ 0 represents the initial porosity of concrete.
Triaxial compressive stress usually compacts concrete, reduces its porosity, and then reduces the diffusion coefficient of sulfate ions in concrete. According to the theory of pore medium mechanics, the variation of concrete porosity under triaxial stress state is obtained
φ = φ 0 σ k k K
where K is the bulk modulus of concrete and σ k k K is the volumetric strain caused by triaxial compressive stress. The diffusion coefficient of sulfate is obtained as follows:
D = ( φ 0 σ k k 3 K + d c ) D s
When the applied load of concrete structure exceeds the elastic strength of concrete, the microcracks in the concrete expand and form the transport channel for sulfate ions, which will accelerate the sulfate corrosion rate. Therefore, the acceleration effect of mechanical damage by sulfate ions must be considered in the process of sulfate transport
  C ^ t = · ( ( 1 + α m d m ) D C ^ )
where ( 1 + α m d m ) is the acceleration effect of mechanical damage on sulfate, and parameter α m is determined by sulfate diffusion test.

3.3. Seepage Diffusion Model

The flow of fluid in concrete obeys the law of conservation of mass:
( ρ f ϕ ) t + · ( ρ f u ) = 0
where ρ f is the density of the fluid, ϕ is the porosity, and u is the velocity of the fluid. As the velocity of fluid in concrete is very slow, we use Darcy’s law to calculate its velocity:
u = κ μ p
where p is the pore water pressure; κ is the inherent porosity; μ is the dynamic viscosity coefficient of the fluid. The temperature changed slightly, μ is the hydrodynamic viscosity coefficient at room temperature. The inherent permeability of porous media is related to its porosity, so the inherent permeability of concrete changes with the evolution of porosity. In this paper, the formula proposed by Kozeny Carman to calculate the inherent permeability was used [33].
κ = κ 0 ϕ 3 1 ϕ 2 1 ϕ 0 2 ϕ 0 3
where κ is the initial intrinsic permeability of concrete. The generation and evolution of damage affect the inherent permeability. It is found that the pore water pressure of concrete is very sensitive to the change of permeability, so it is necessary to consider the evolution of permeability with damage. The following equations are used to describe the change of fluid mass per unit volume [34,35,36]
d m f ρ f = b d θ + d p M
1 M = ϕ K f + ( b ϕ ) 1 b K
m f = ϕ ρ f
where M is Biot’s modulus, representing the volume change of water in porous media under the action of unit pore pressure; K f is the bulk modulus of water; θ is the volumetric strain, and θ = ε i i . The governing equation of seepage field is obtained by substituting Equations (45) and (43) into the mass conservation Equation (41)
b θ t + 1 M p t = κ μ 2 p
The differential Equation (47) is the governing equation of porous media coupled with strain and damage. The coupling parameters M and b will evolve with the development of damage.

4. Result

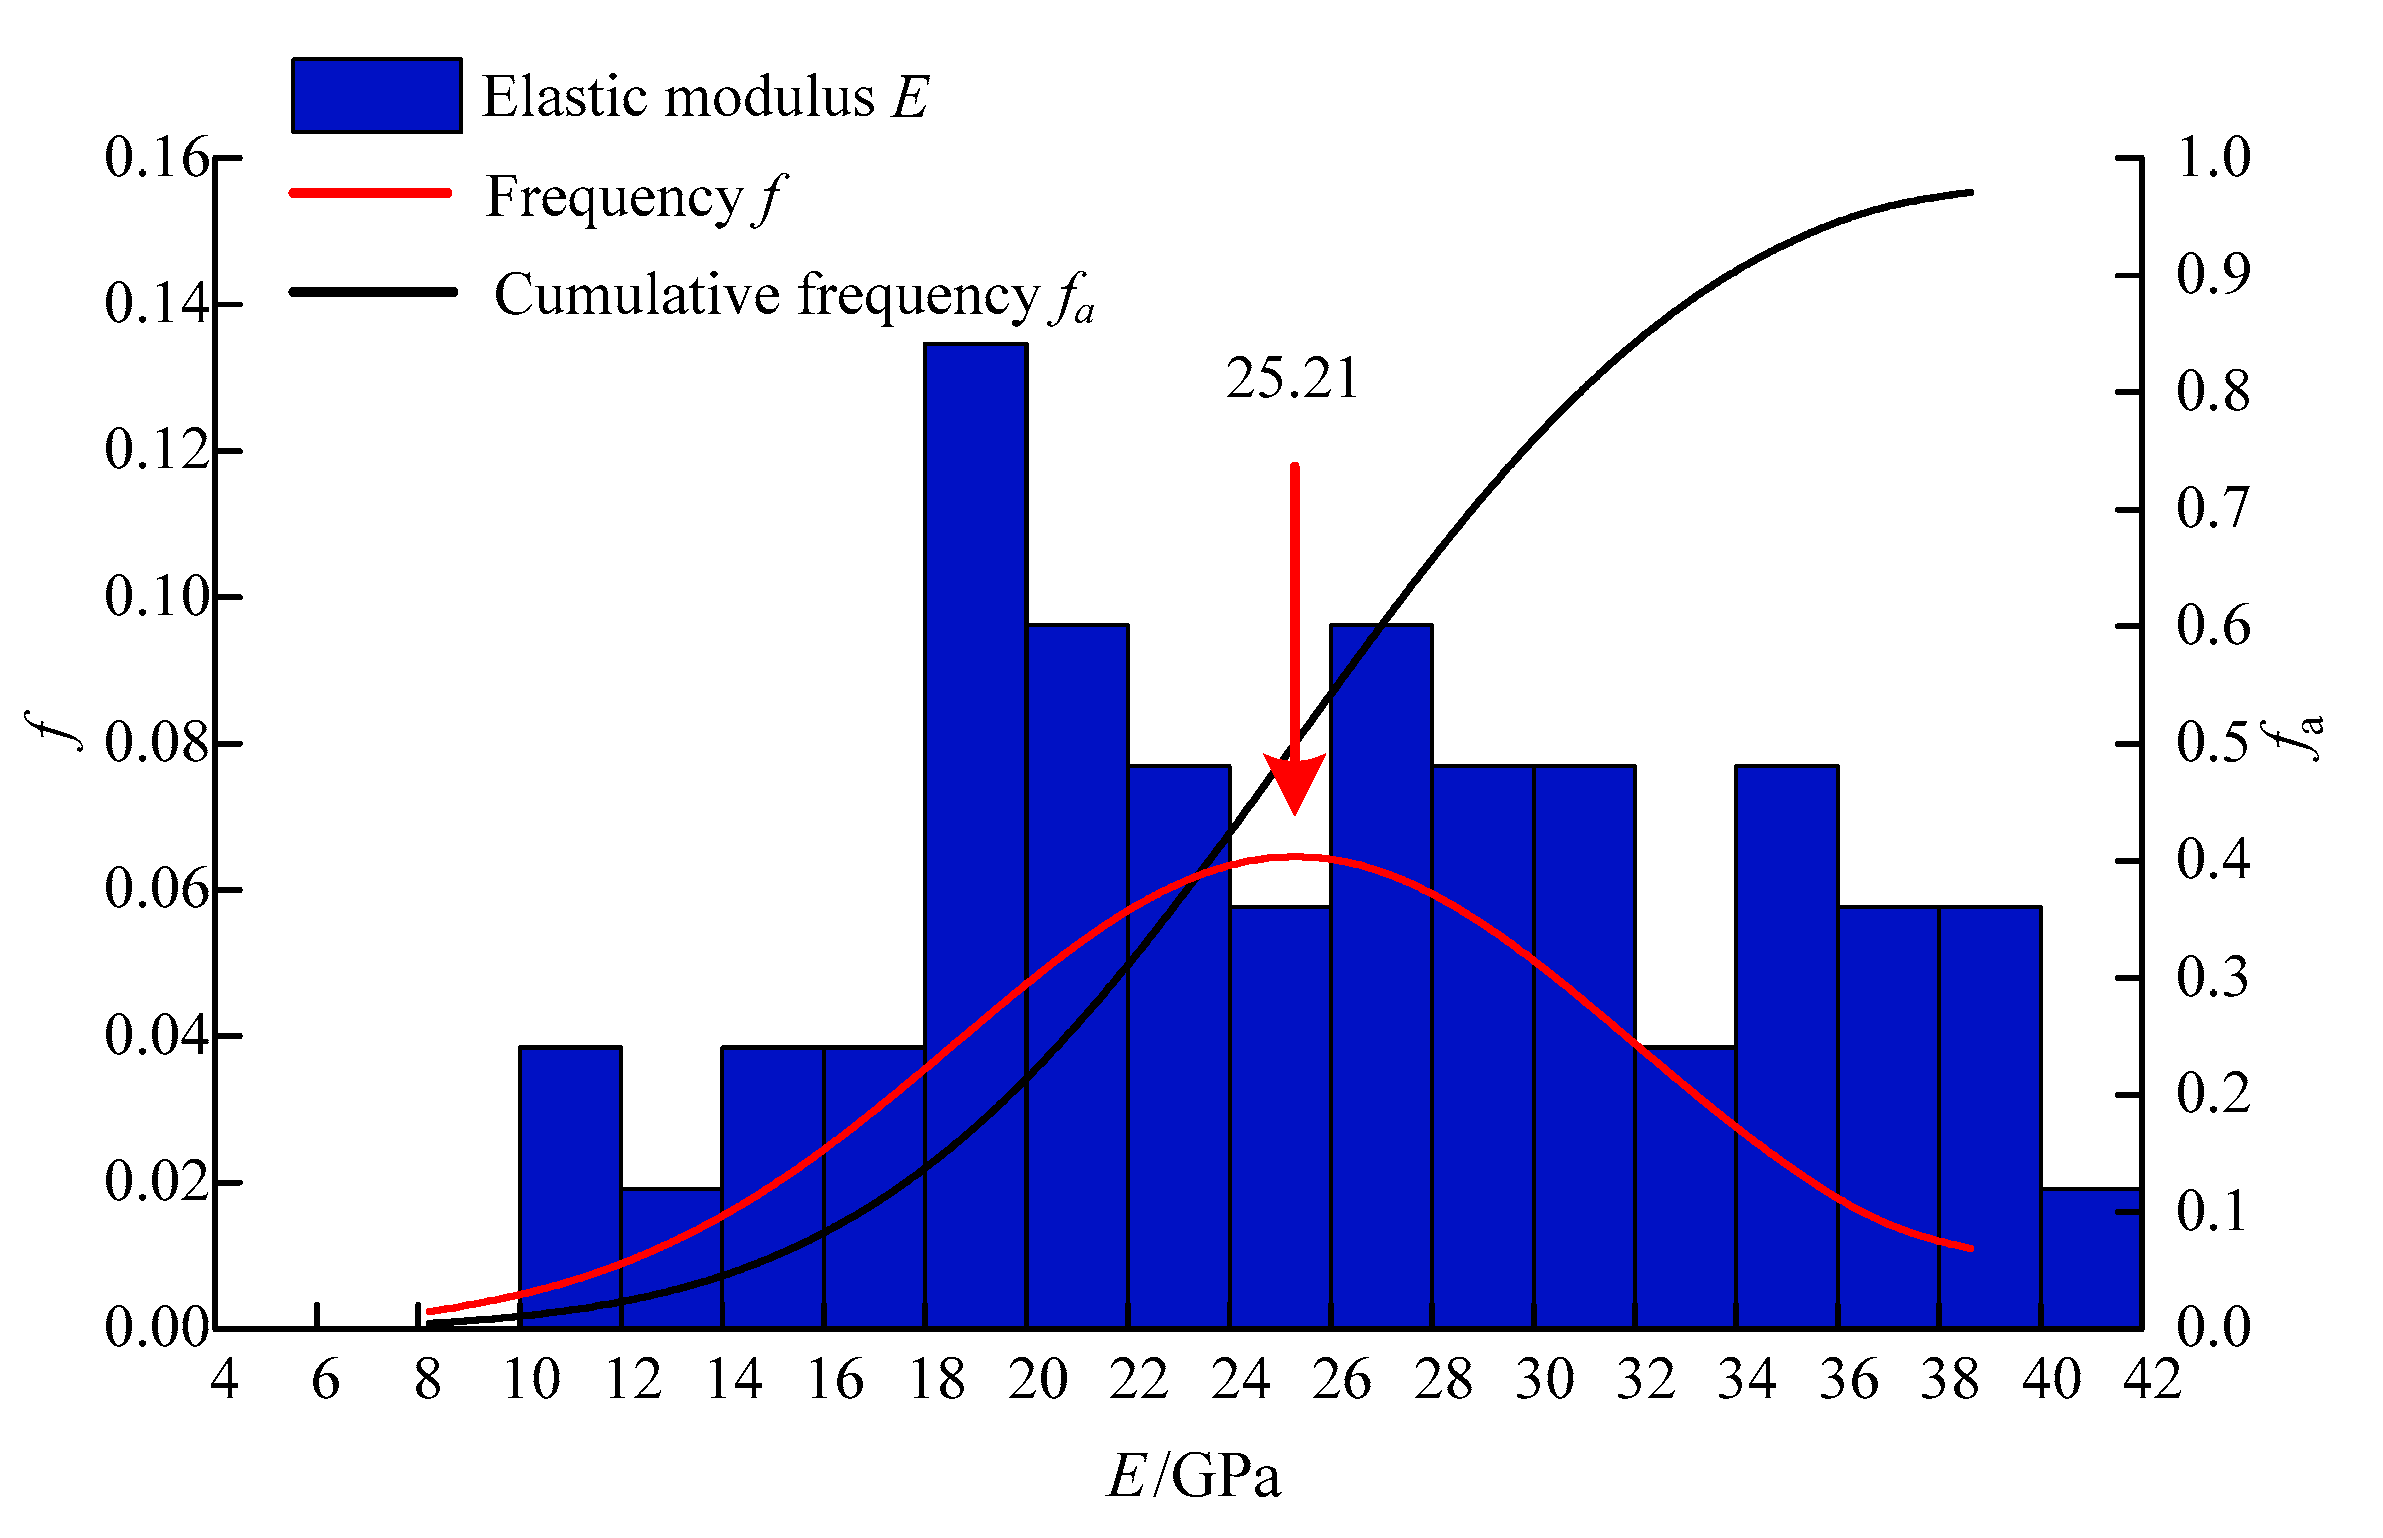
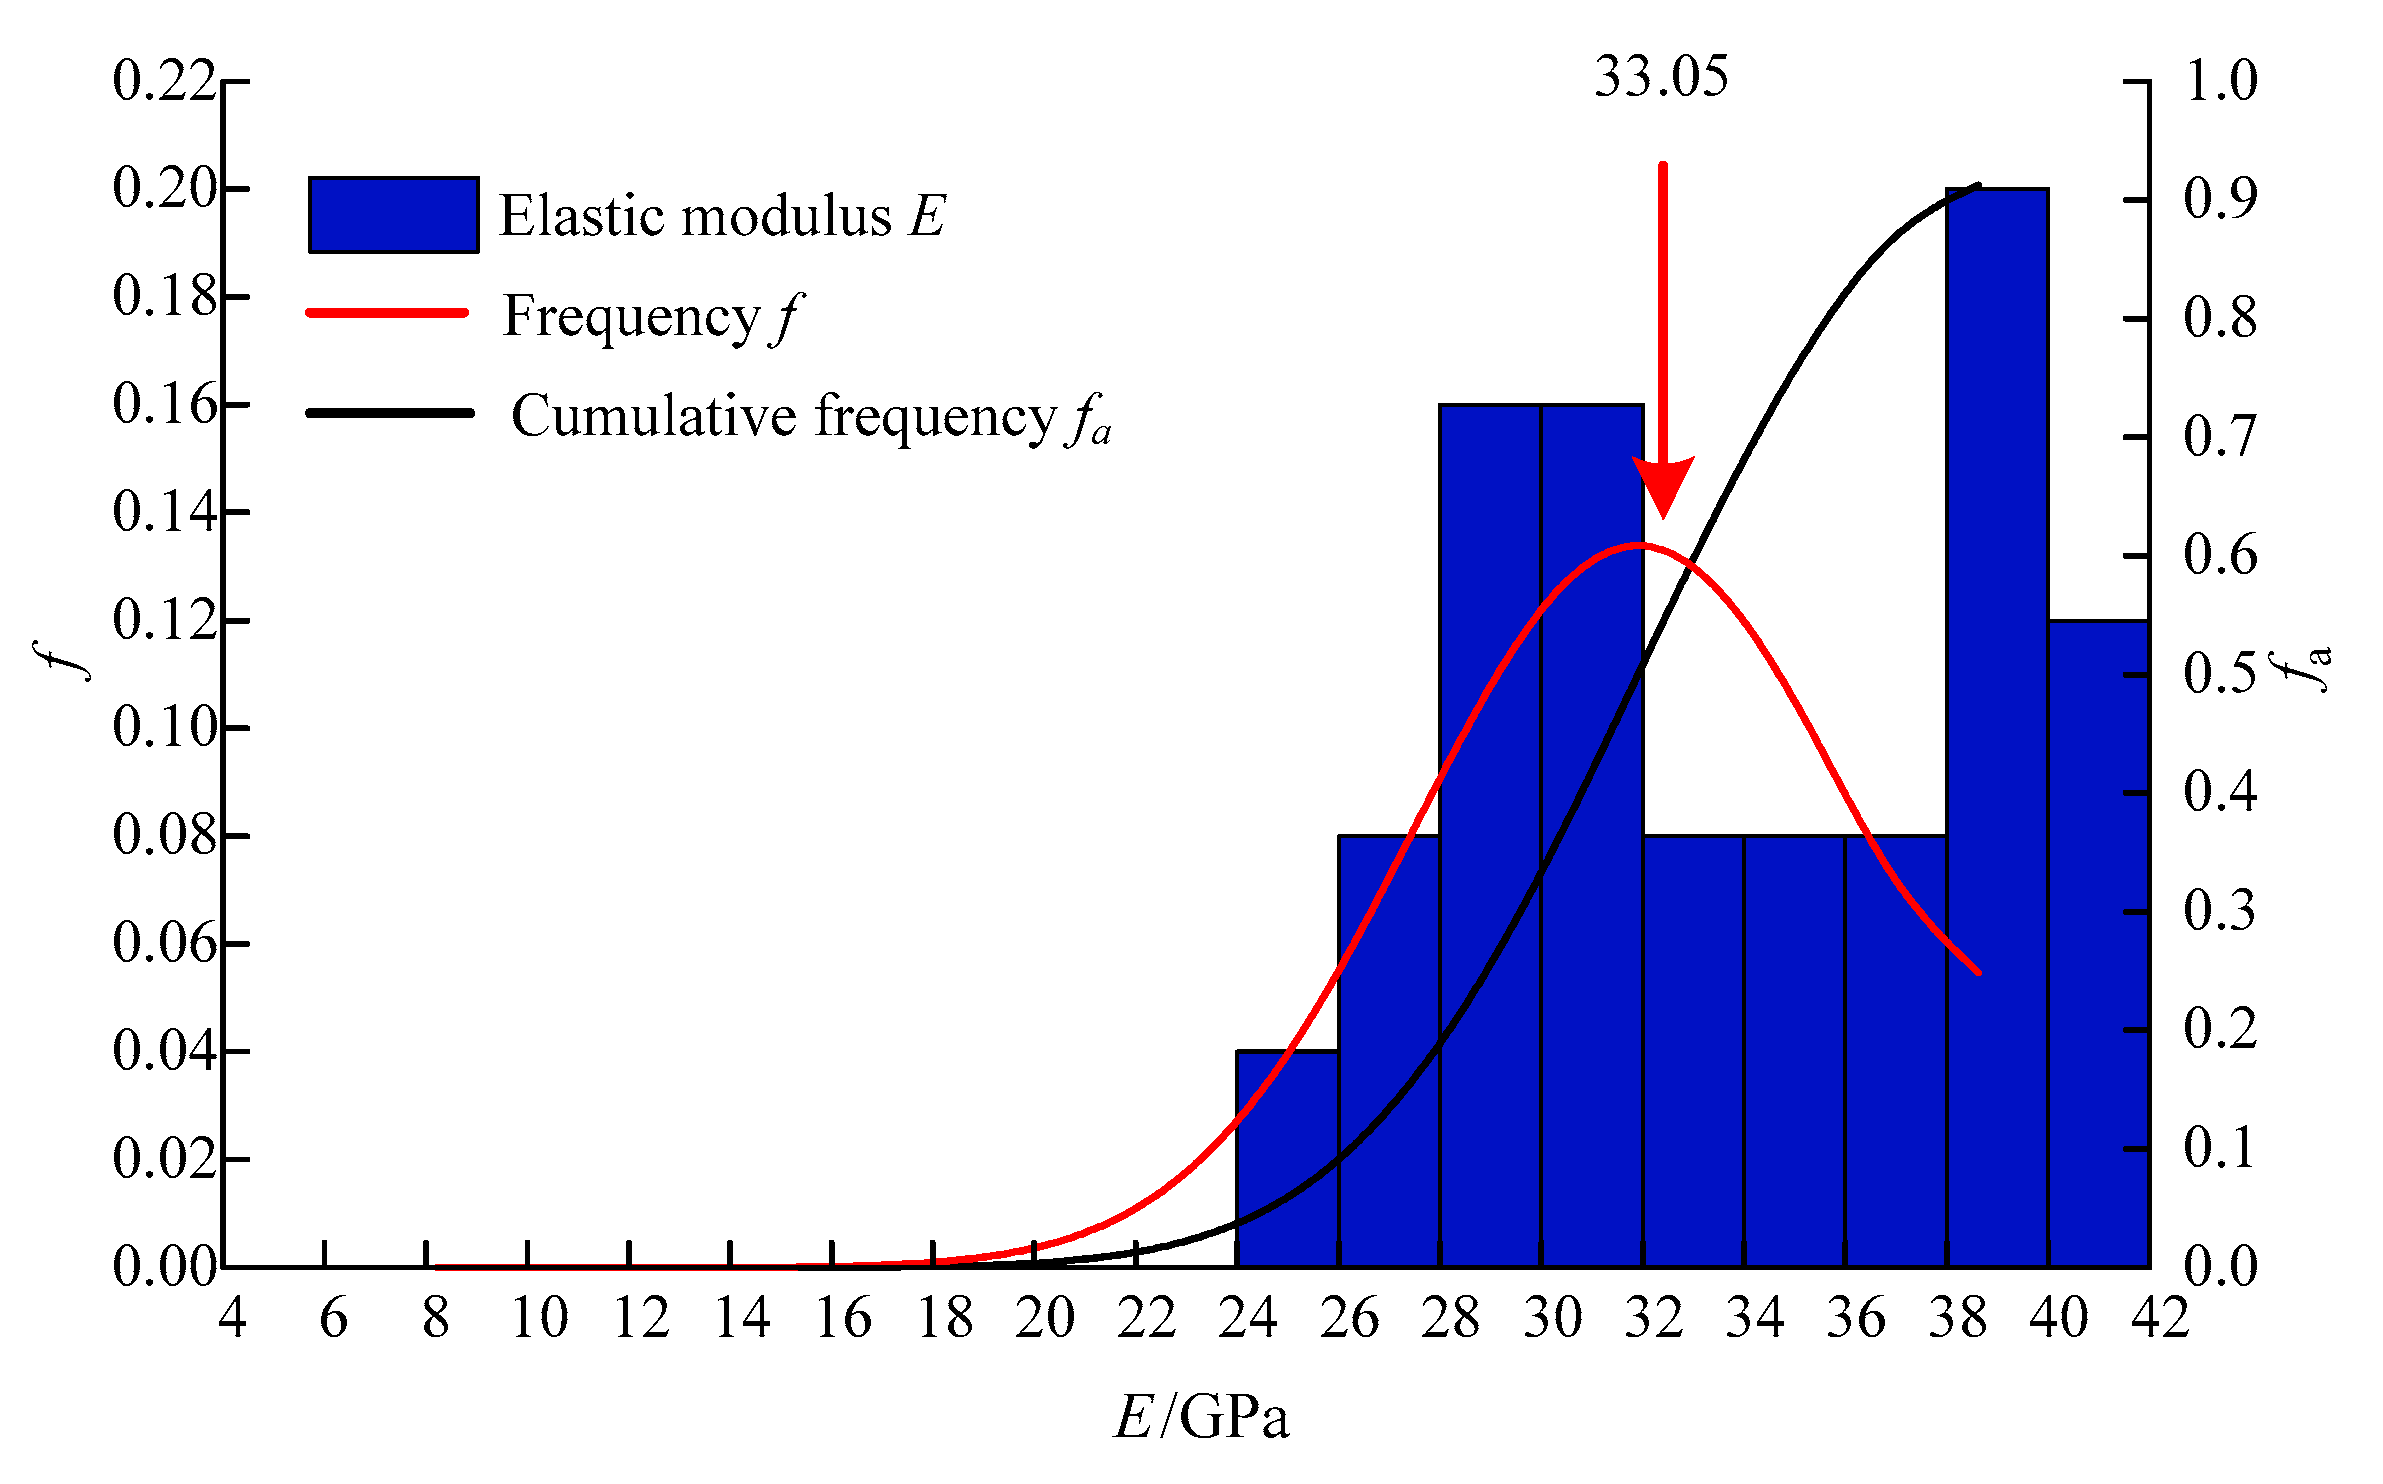
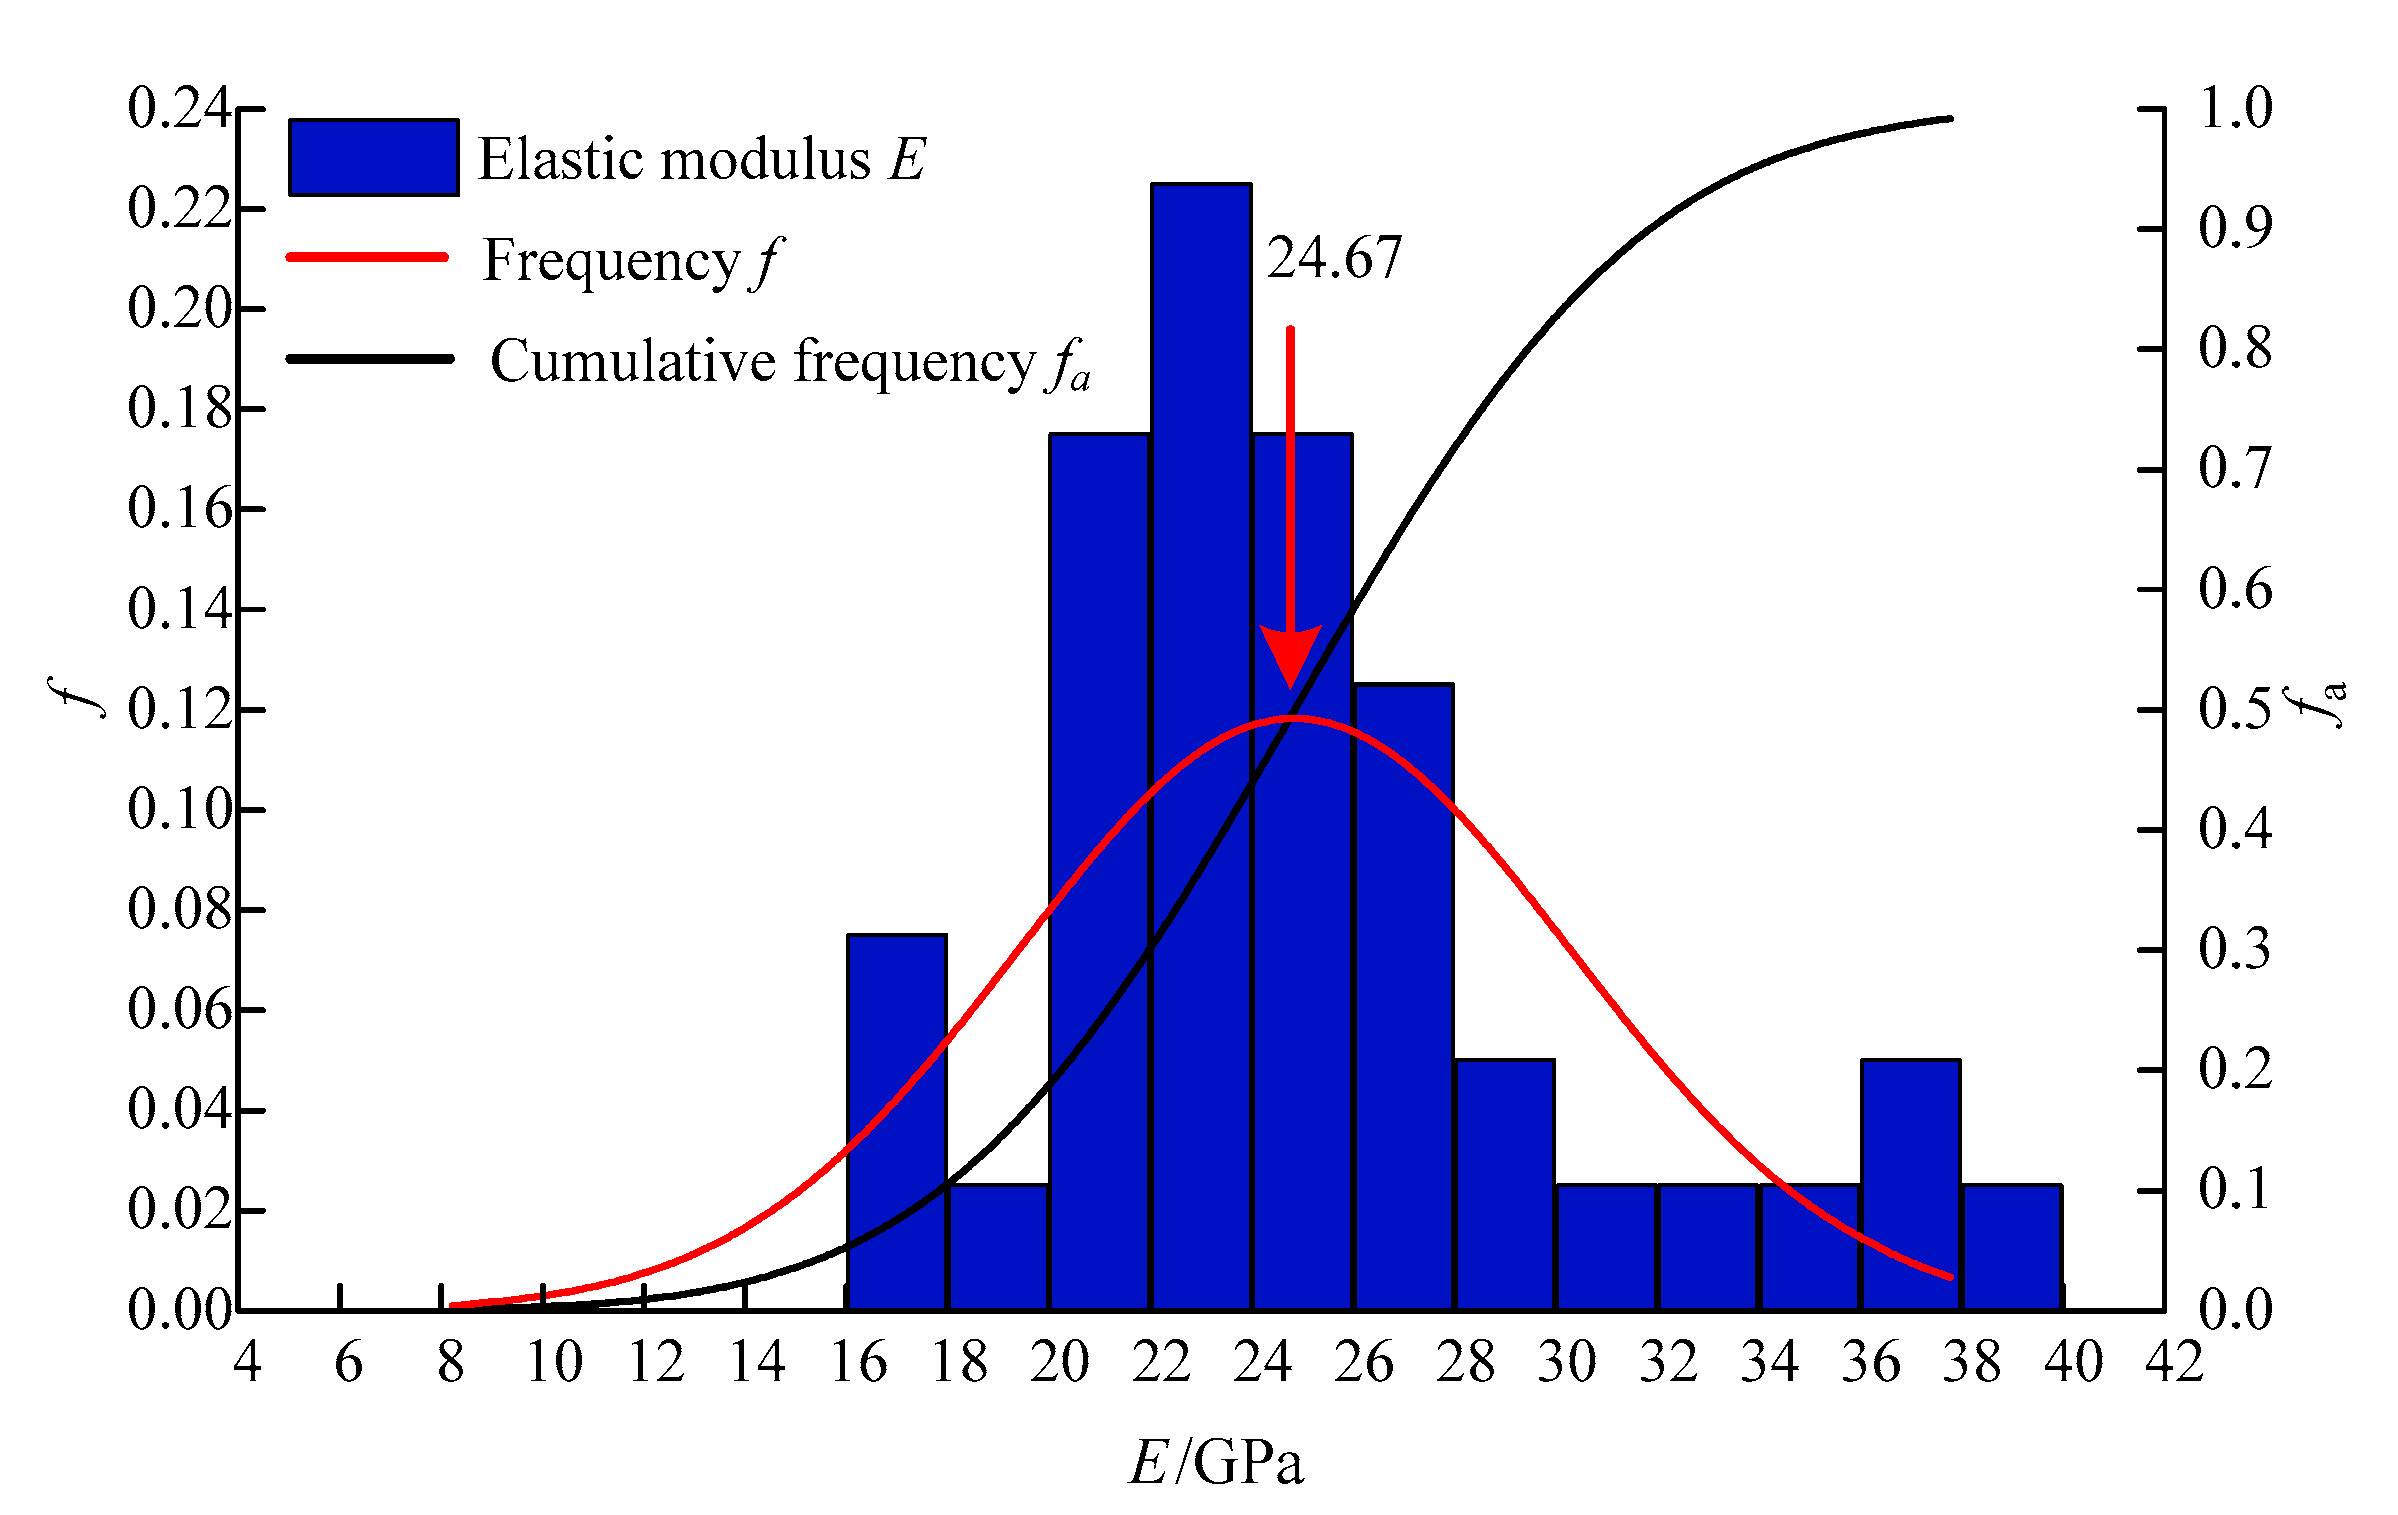
4.1. Micro-Indentation Test Results

In order to study the corrosion damage and deterioration of concrete under the coupled effect of stress and sulfate seepage over time and space, this paper studied the change of the elastic modulus of concrete at the same corrosion depth and at different corrosion depths under different corrosion exposure durations and different water heads using micro-indentation tests.

4.1.1. Micro-Indentation Test Results at the Same Corrosion Depth (0–3 mm Corrosion Area)

Due to the complexity of hydration products and corrosion products of concrete, the test data results reflect strong heterogeneity. In order to obtain the distribution law of the meso-mechanical degradation parameters of the samples, 200 test points obtained from each group of tests were calculated and statistically analyzed, and the histogram, normal distribution curve and cumulative distribution curve of elastic modulus were fitted. As shown in Figure 7, Figure 8, Figure 9, Figure 10 and Figure 11, E represents elastic modulus, f represents frequency and fa represents cumulative frequency.
As shown in Figure 7, Figure 8, Figure 9, Figure 10 and Figure 11, the average value of elastic modulus of the sample without corrosion is 29.88 GPa. After corrosion in 0.7 MPa water head, the average elastic modulus of the samples after 5, 10, 60, and 180 days of sulfate exposure is 26.62, 25.21, 33.05, 24.67 GPa, respectively. Compared with the control group, the average value of the elastic modulus at 0.7–5, 0.7–10 and 0.7–180 d decreased by 10.91%, 15.63% and 17.44%, respectively, while the average value of elastic modulus at 0.7–60 d increased by 10.61%. The overall change trend of elastic modulus is slightly decrease, then gradually increase and then decrease again.
Similarly, as shown in Figure 12, Figure 13, Figure 14, Figure 15 and Figure 16, after corrosion exposure under 1.4 MPa water head, the average value of elastic modulus at 1.4–5, 1.4–10, 1.4–60 and 1.4–180 d was 28.91, 20.83, 32.22 and 24.08 GPa, respectively. The average elastic modulus at 1.4–5, 1.4–10 and 1.4–180 d decreased by 3.25%, 30.29% and 19.41%, respectively. At 1.4–60 d, the average value of elastic modulus increased by 7.83% compared with the control group.

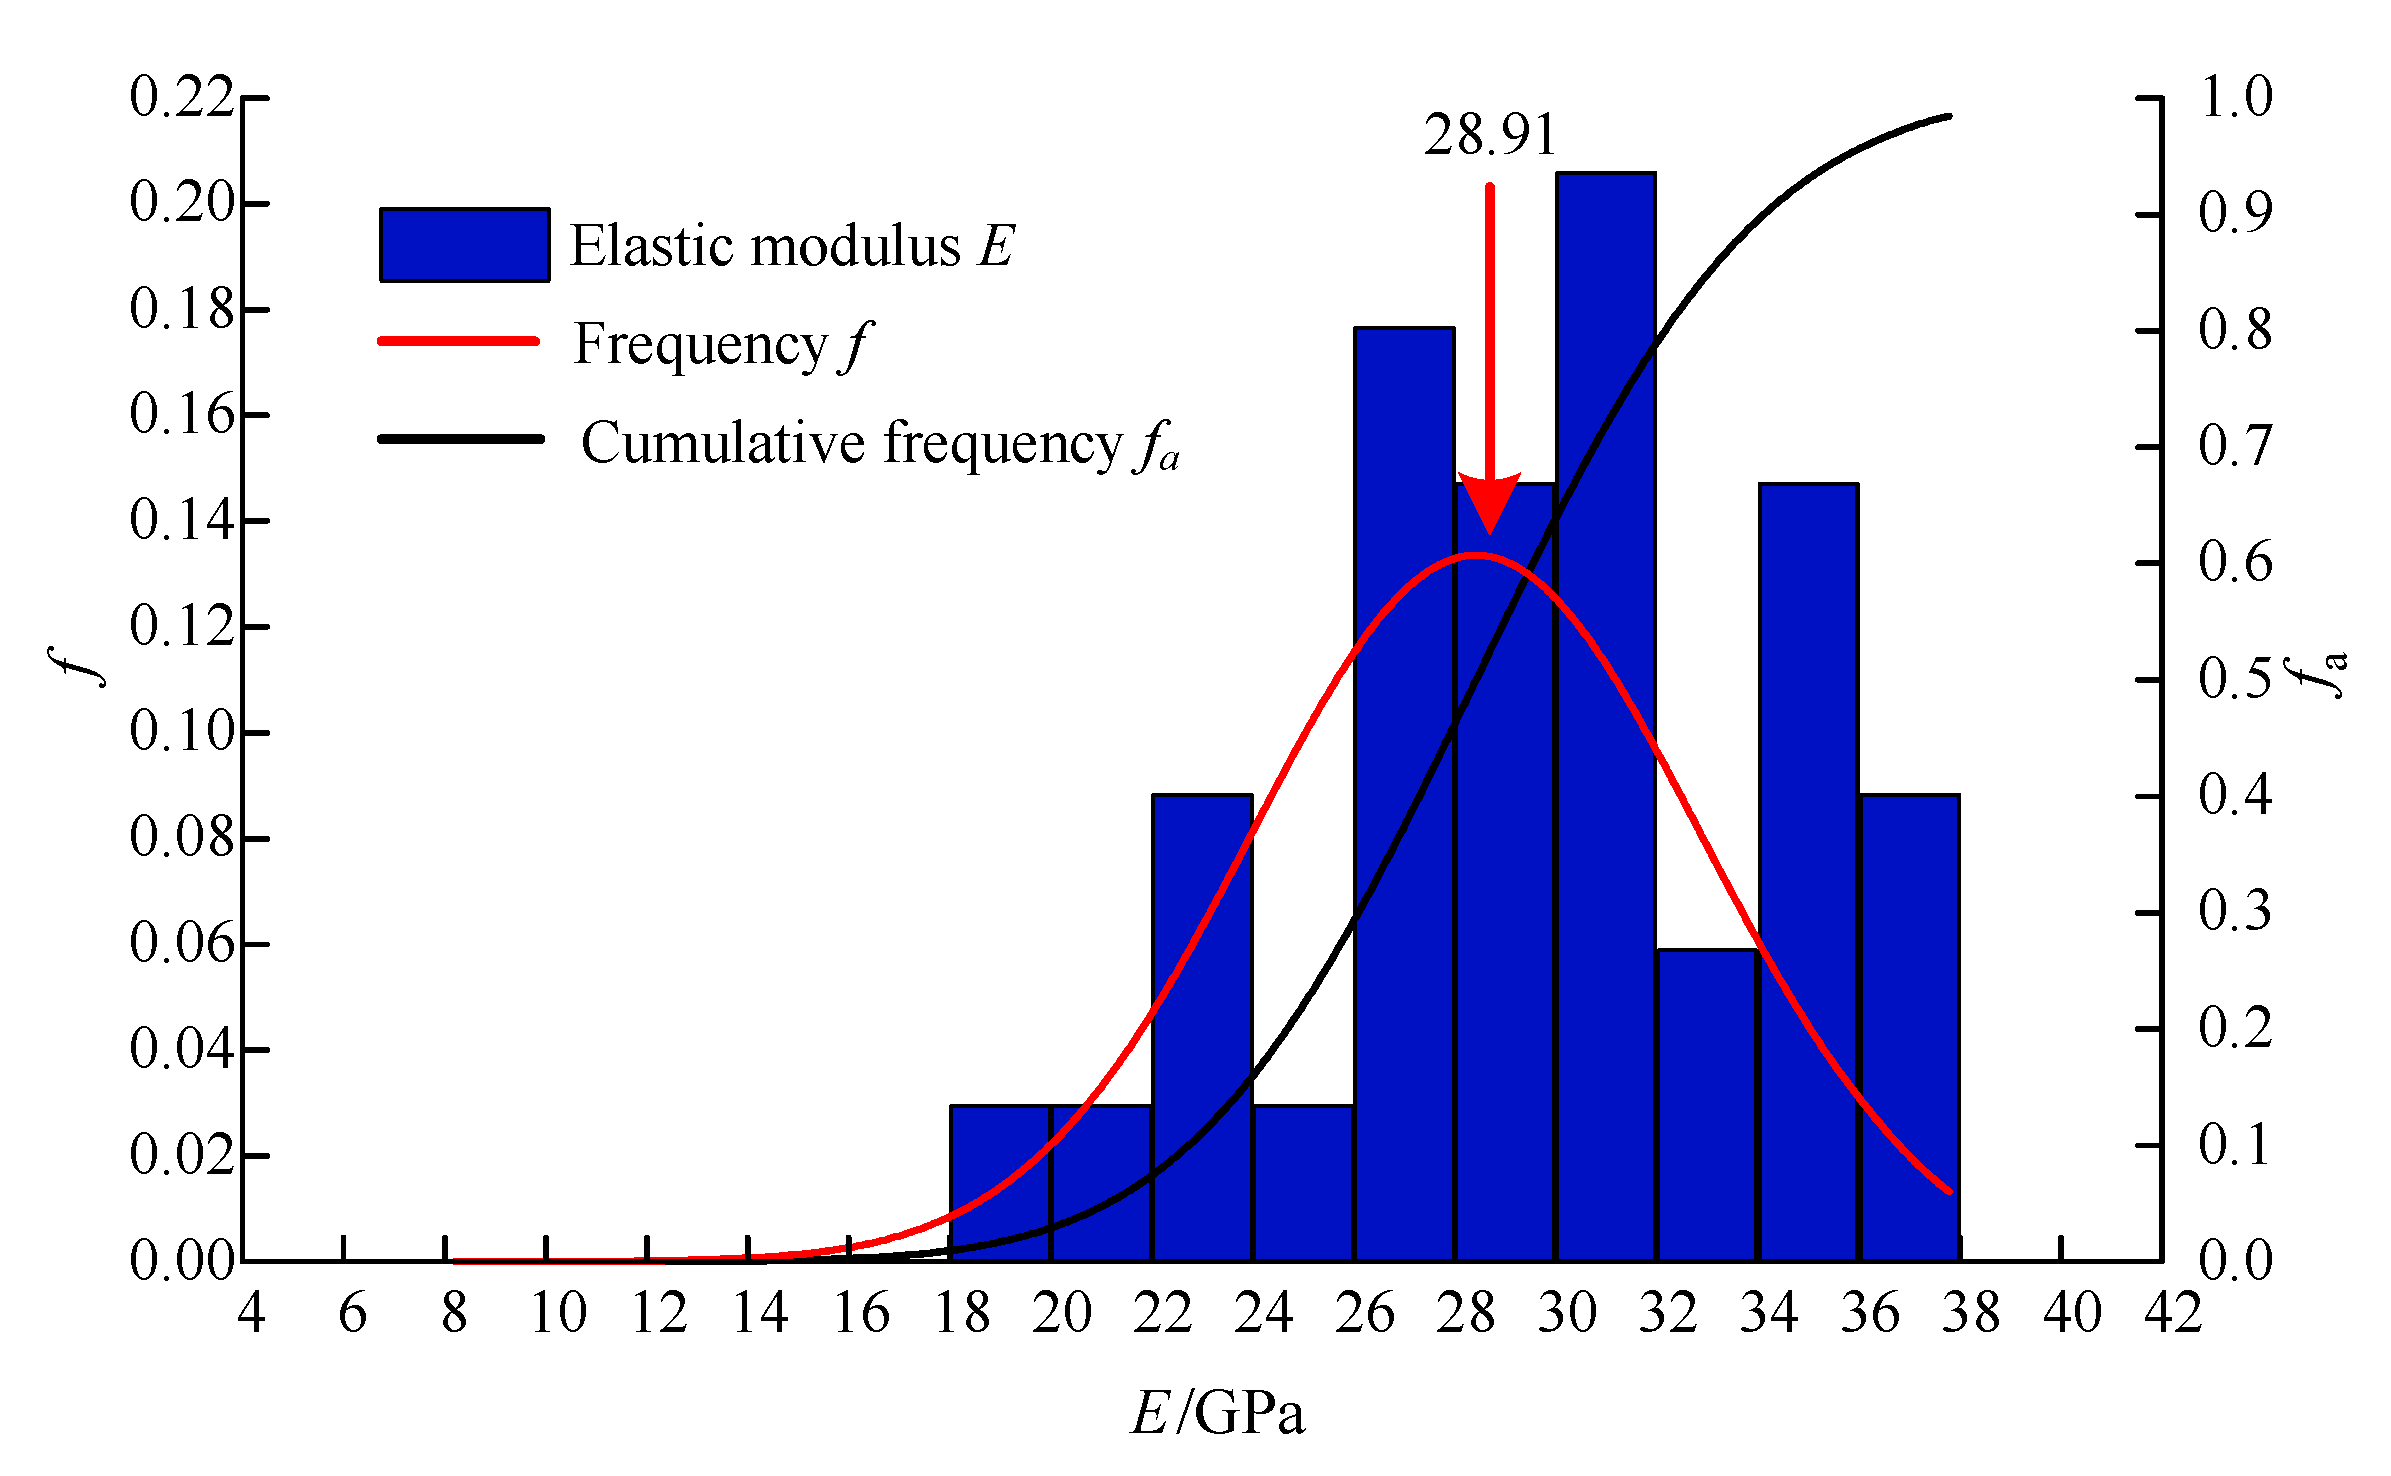
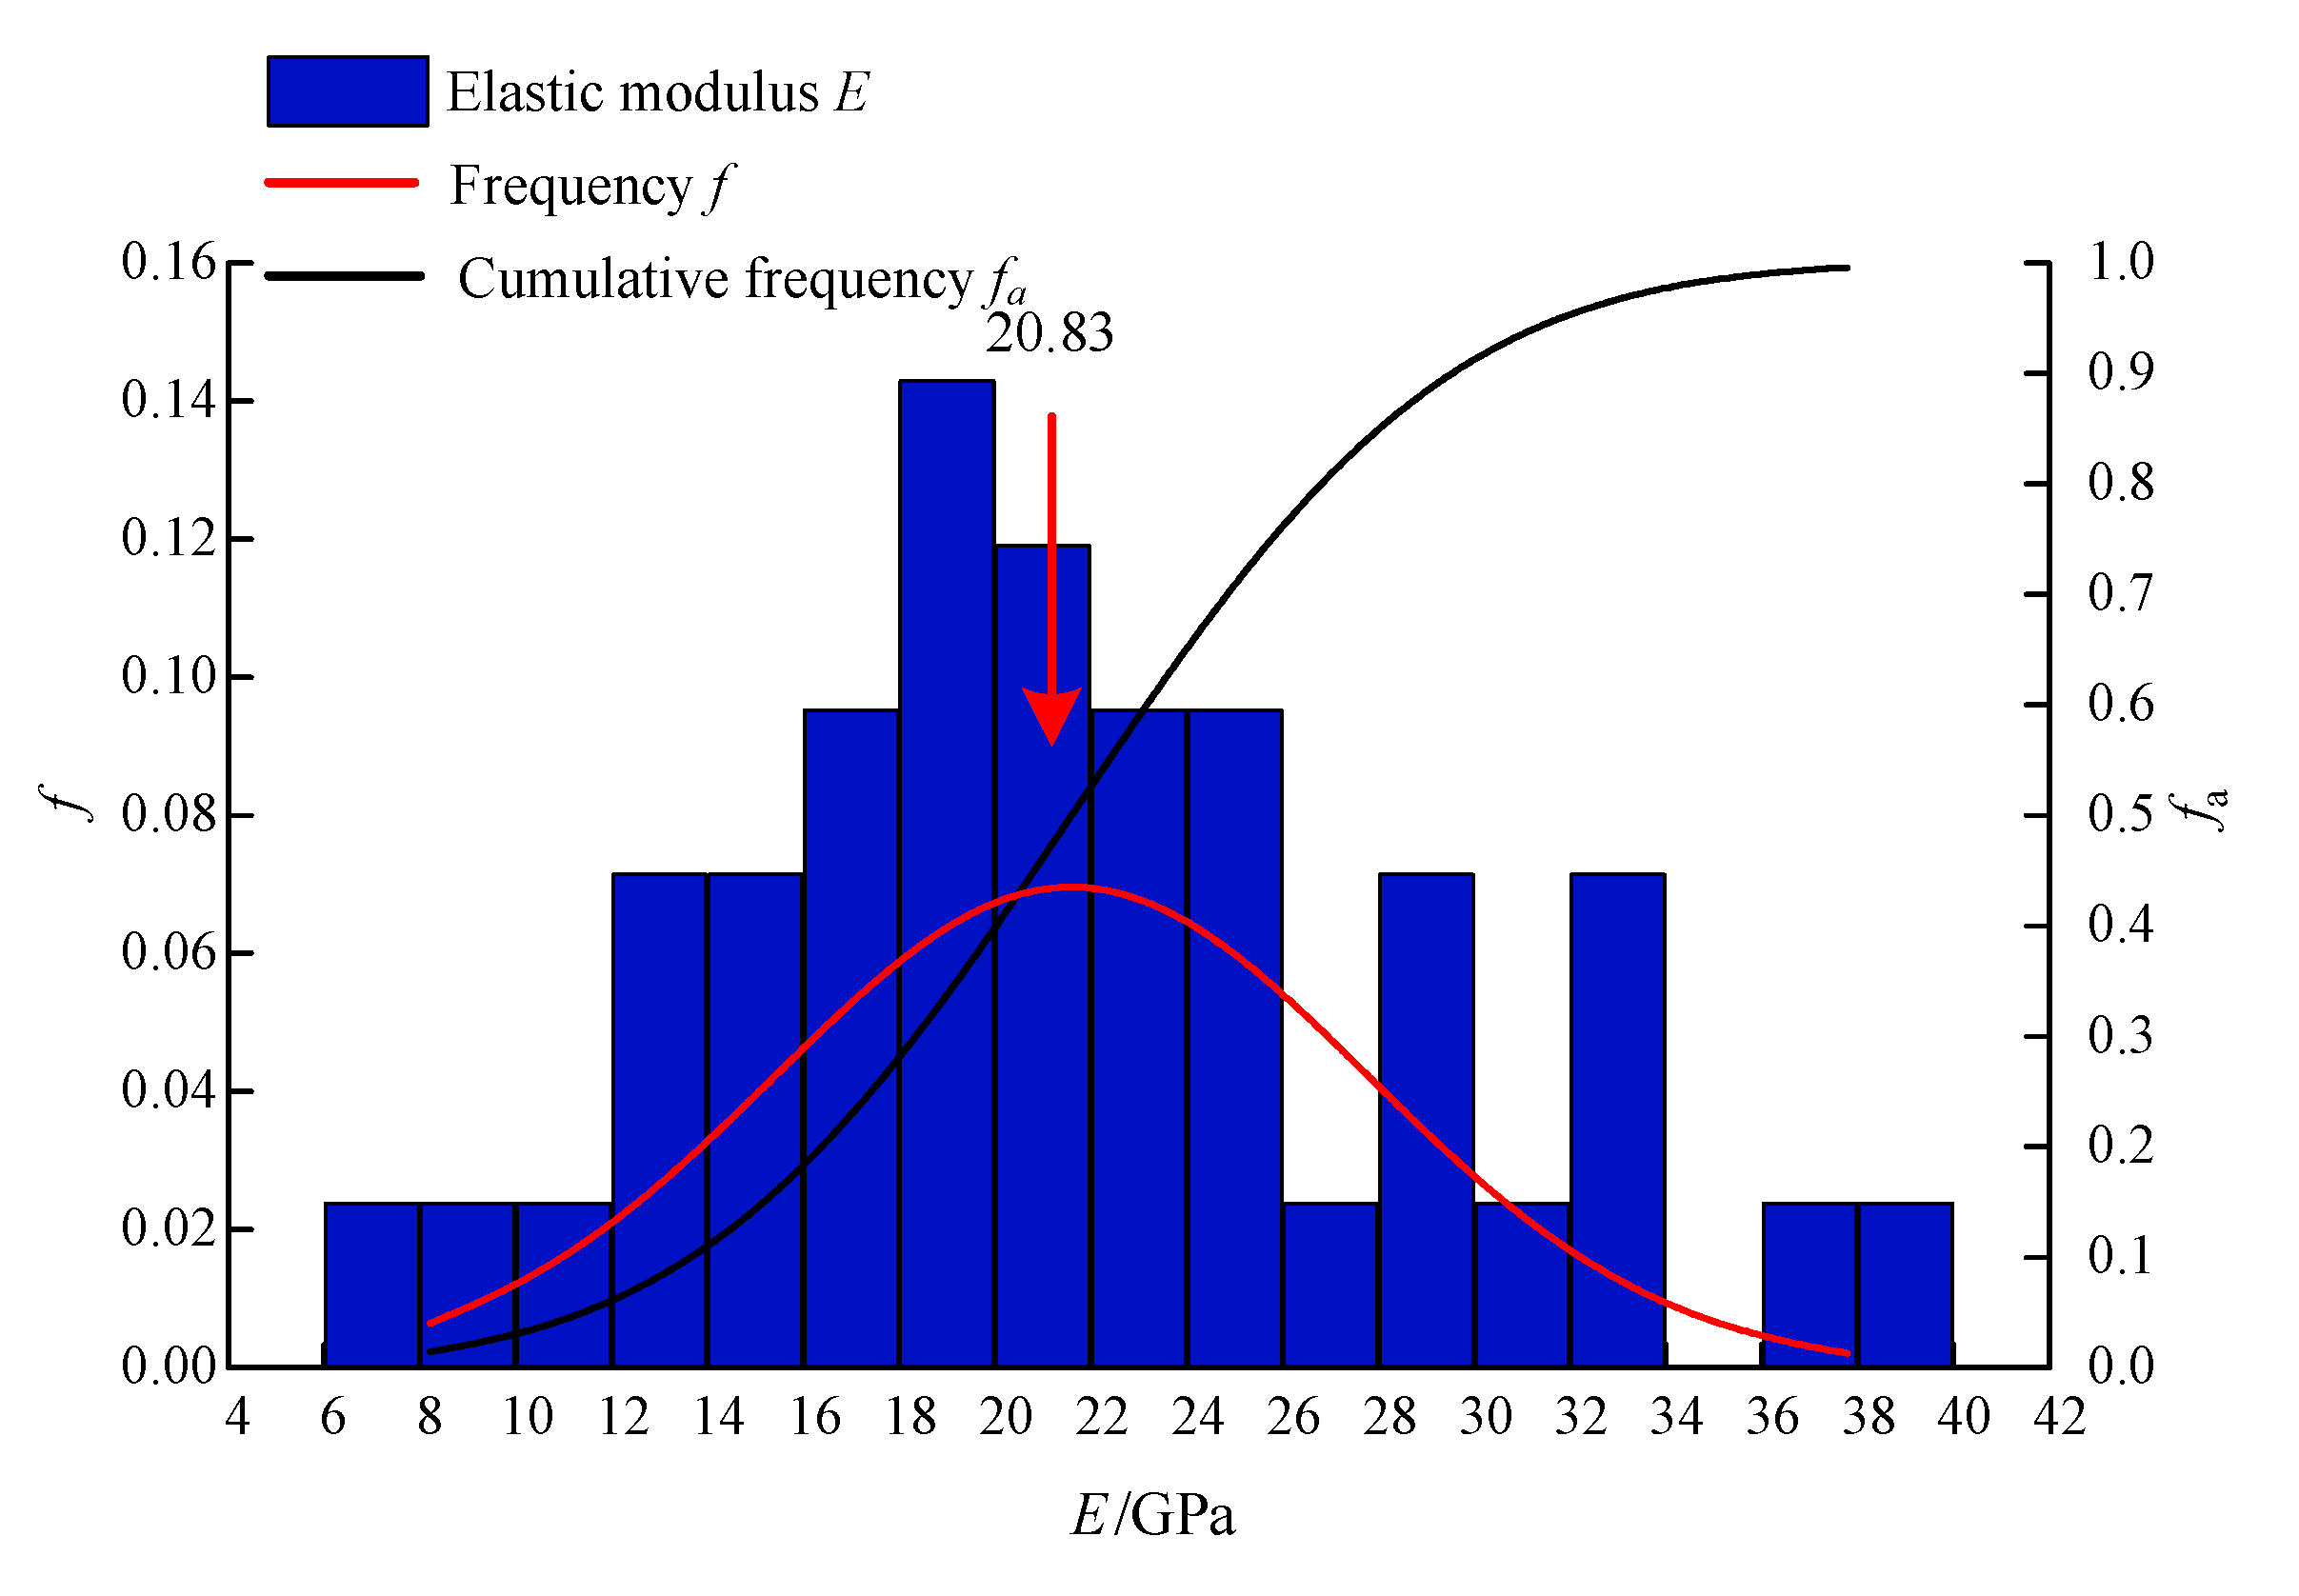
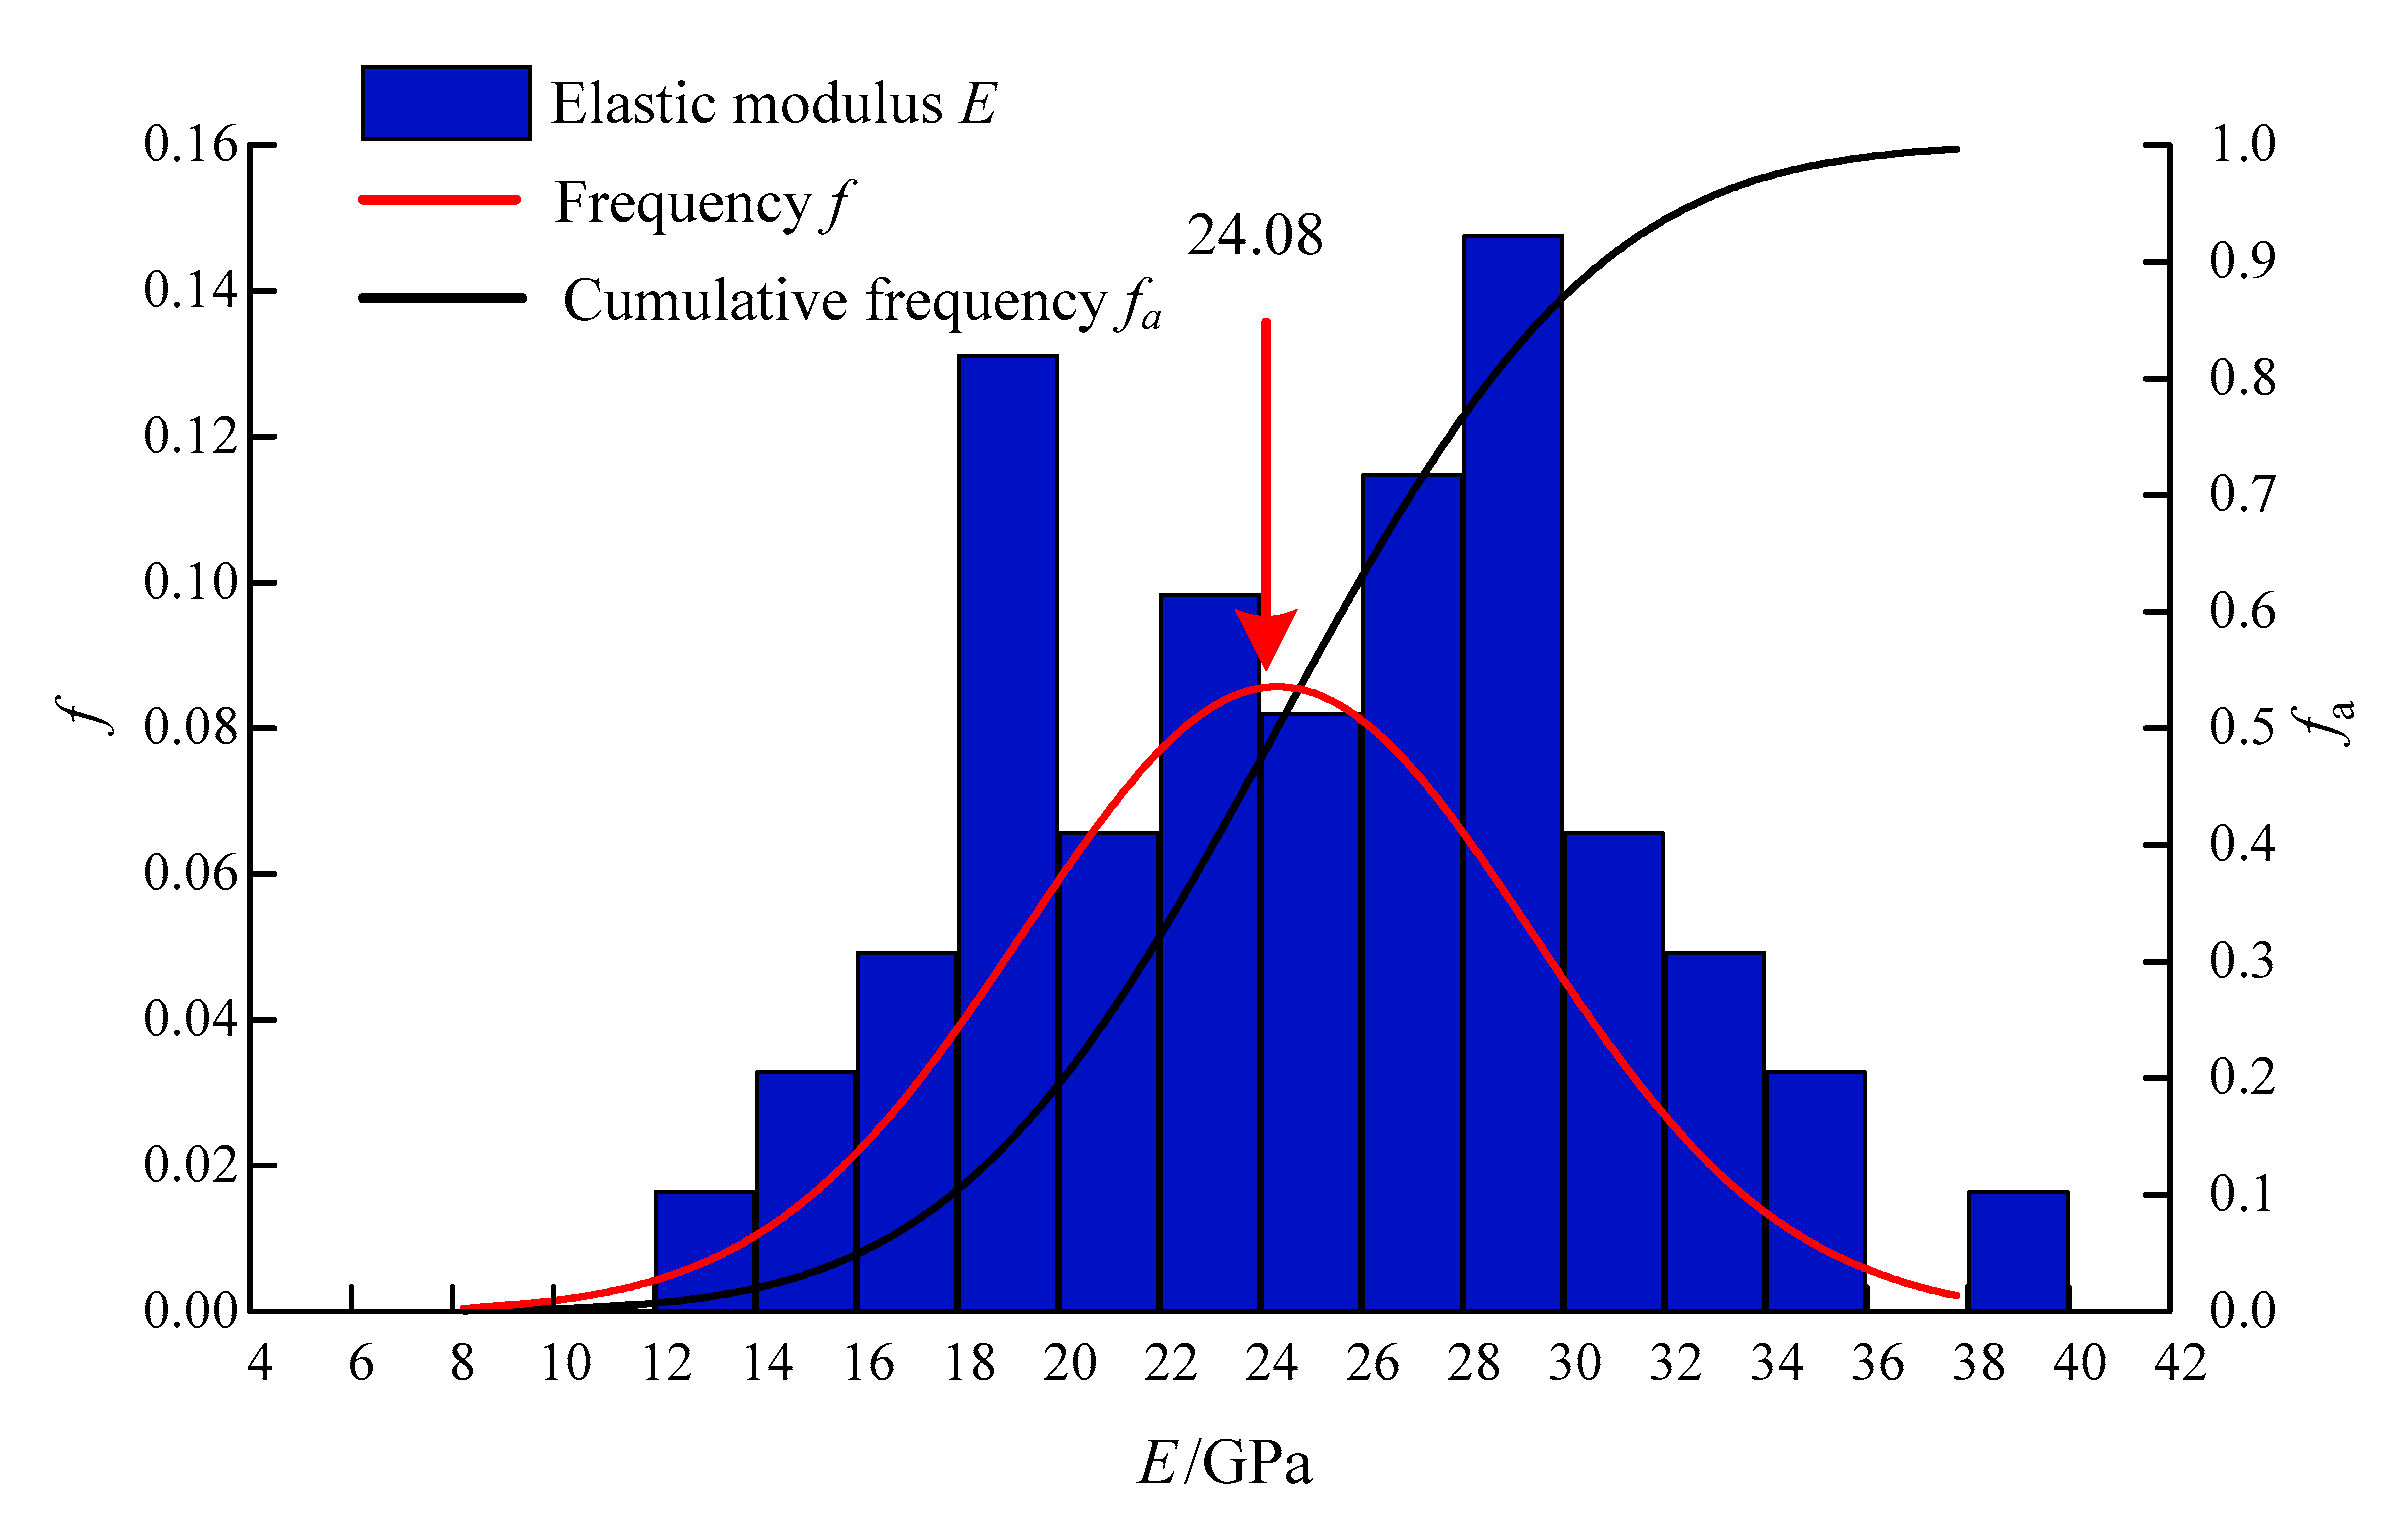
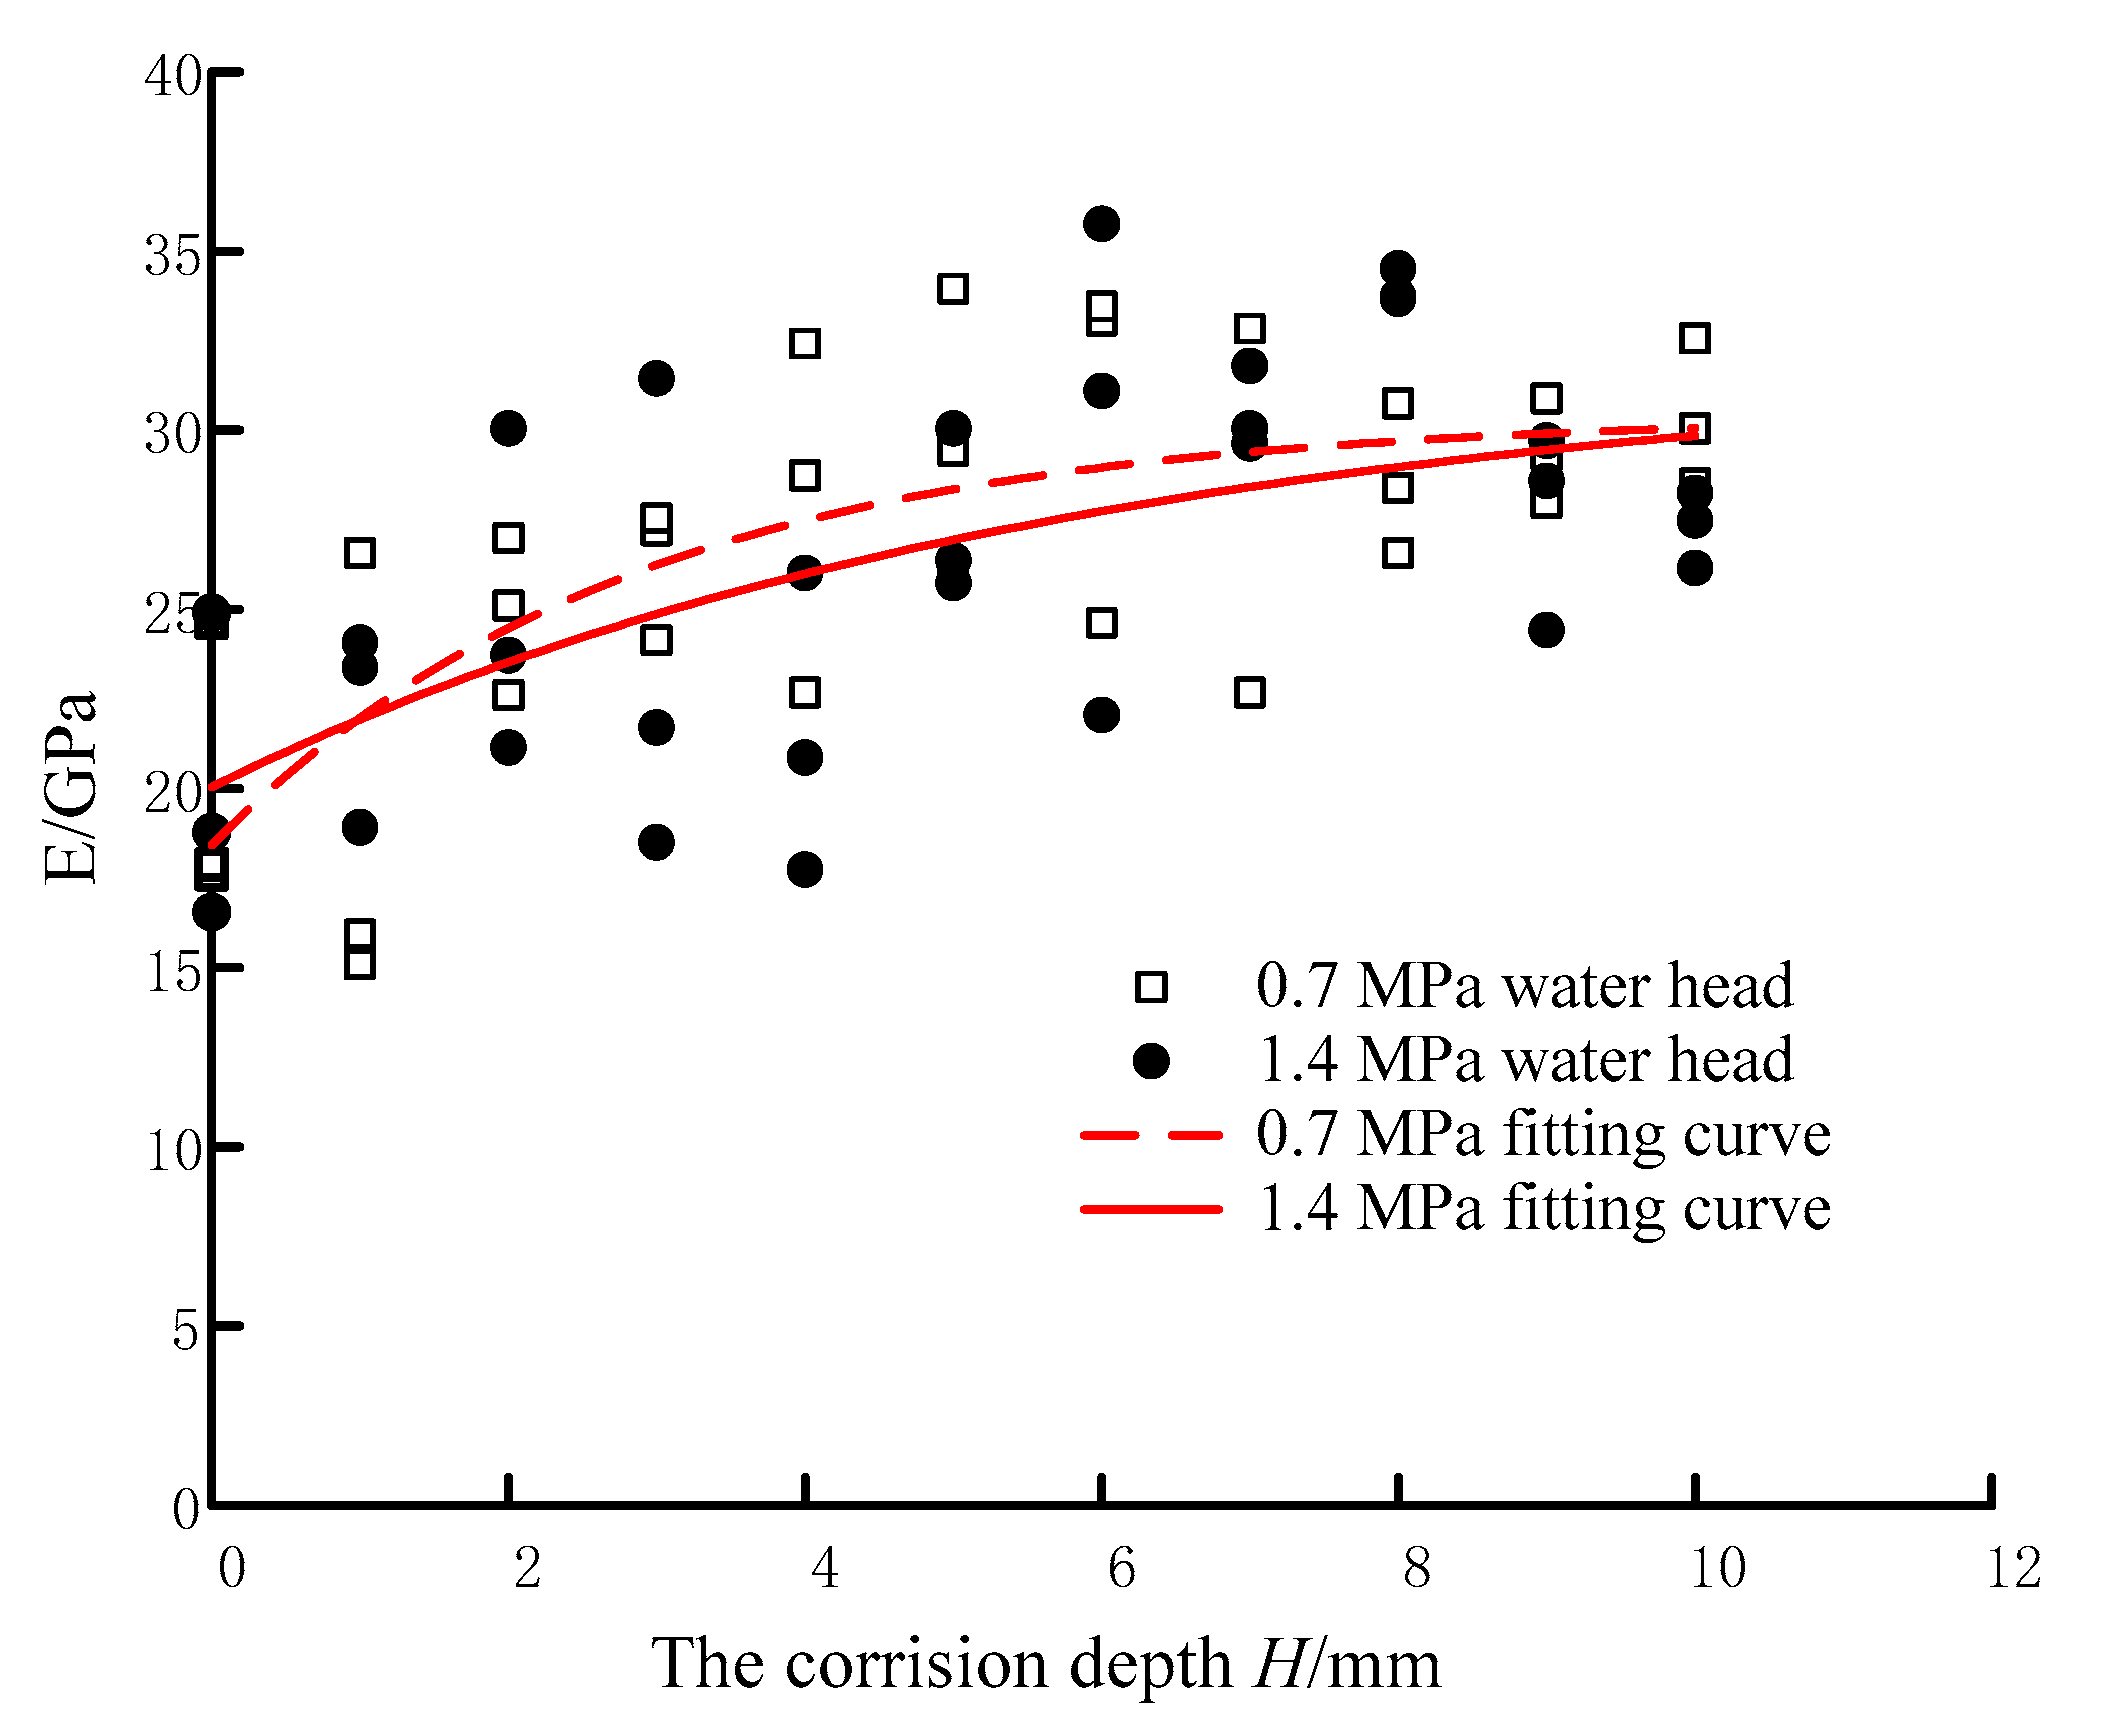
4.1.2. Micro-Indentation Test Results at Different Corrosion Depths

With the increase of corrosion duration, the depth of corrosion increases gradually. The increase of corrosion depth and the deterioration of concrete corrosion part will reduce the bearing capacity of the whole concrete structure. Therefore, it is necessary to discuss the change of elastic modulus of concrete after coupling corrosion.
In Figure 17, H is the depth of corrosion, (in mm), E is the modulus of elasticity (GPa). With the increase of corrosion depth, the elastic modulus of corroded concrete increases gradually. At the corrosion depth of 5–7 mm, the average elastic modulus is slightly higher than that of concrete without corrosion. With the increase of corrosion exposure duration sulfate enters the concrete along the cracks and reacts with calcium hydroxide to generate expansive hydration products, and the expansive ettringite and gypsum are accompanied with a large amount of bound water, which has a compaction effect. The elastic modulus of concrete increases in the early stage of corrosion. With the extension of corrosion time, the expansion hydration products increase, which increases the cracks in the sample, so that more sulfate solution enters the concrete to react, which aggravates the deterioration of the material.
Through comparative analysis, there is a correlation between the elastic modulus of the corroded part of concrete and the corrosion depth of concrete under different water heads. The fitting curves of the two are shown in Figure 17 and the relationship is shown in Equations (48) and (49).
E = 30 . 414 - 11 . 989 e - 0 . 352 H
E = 31 . 962 - 11 . 920 e - 0 . 173 H

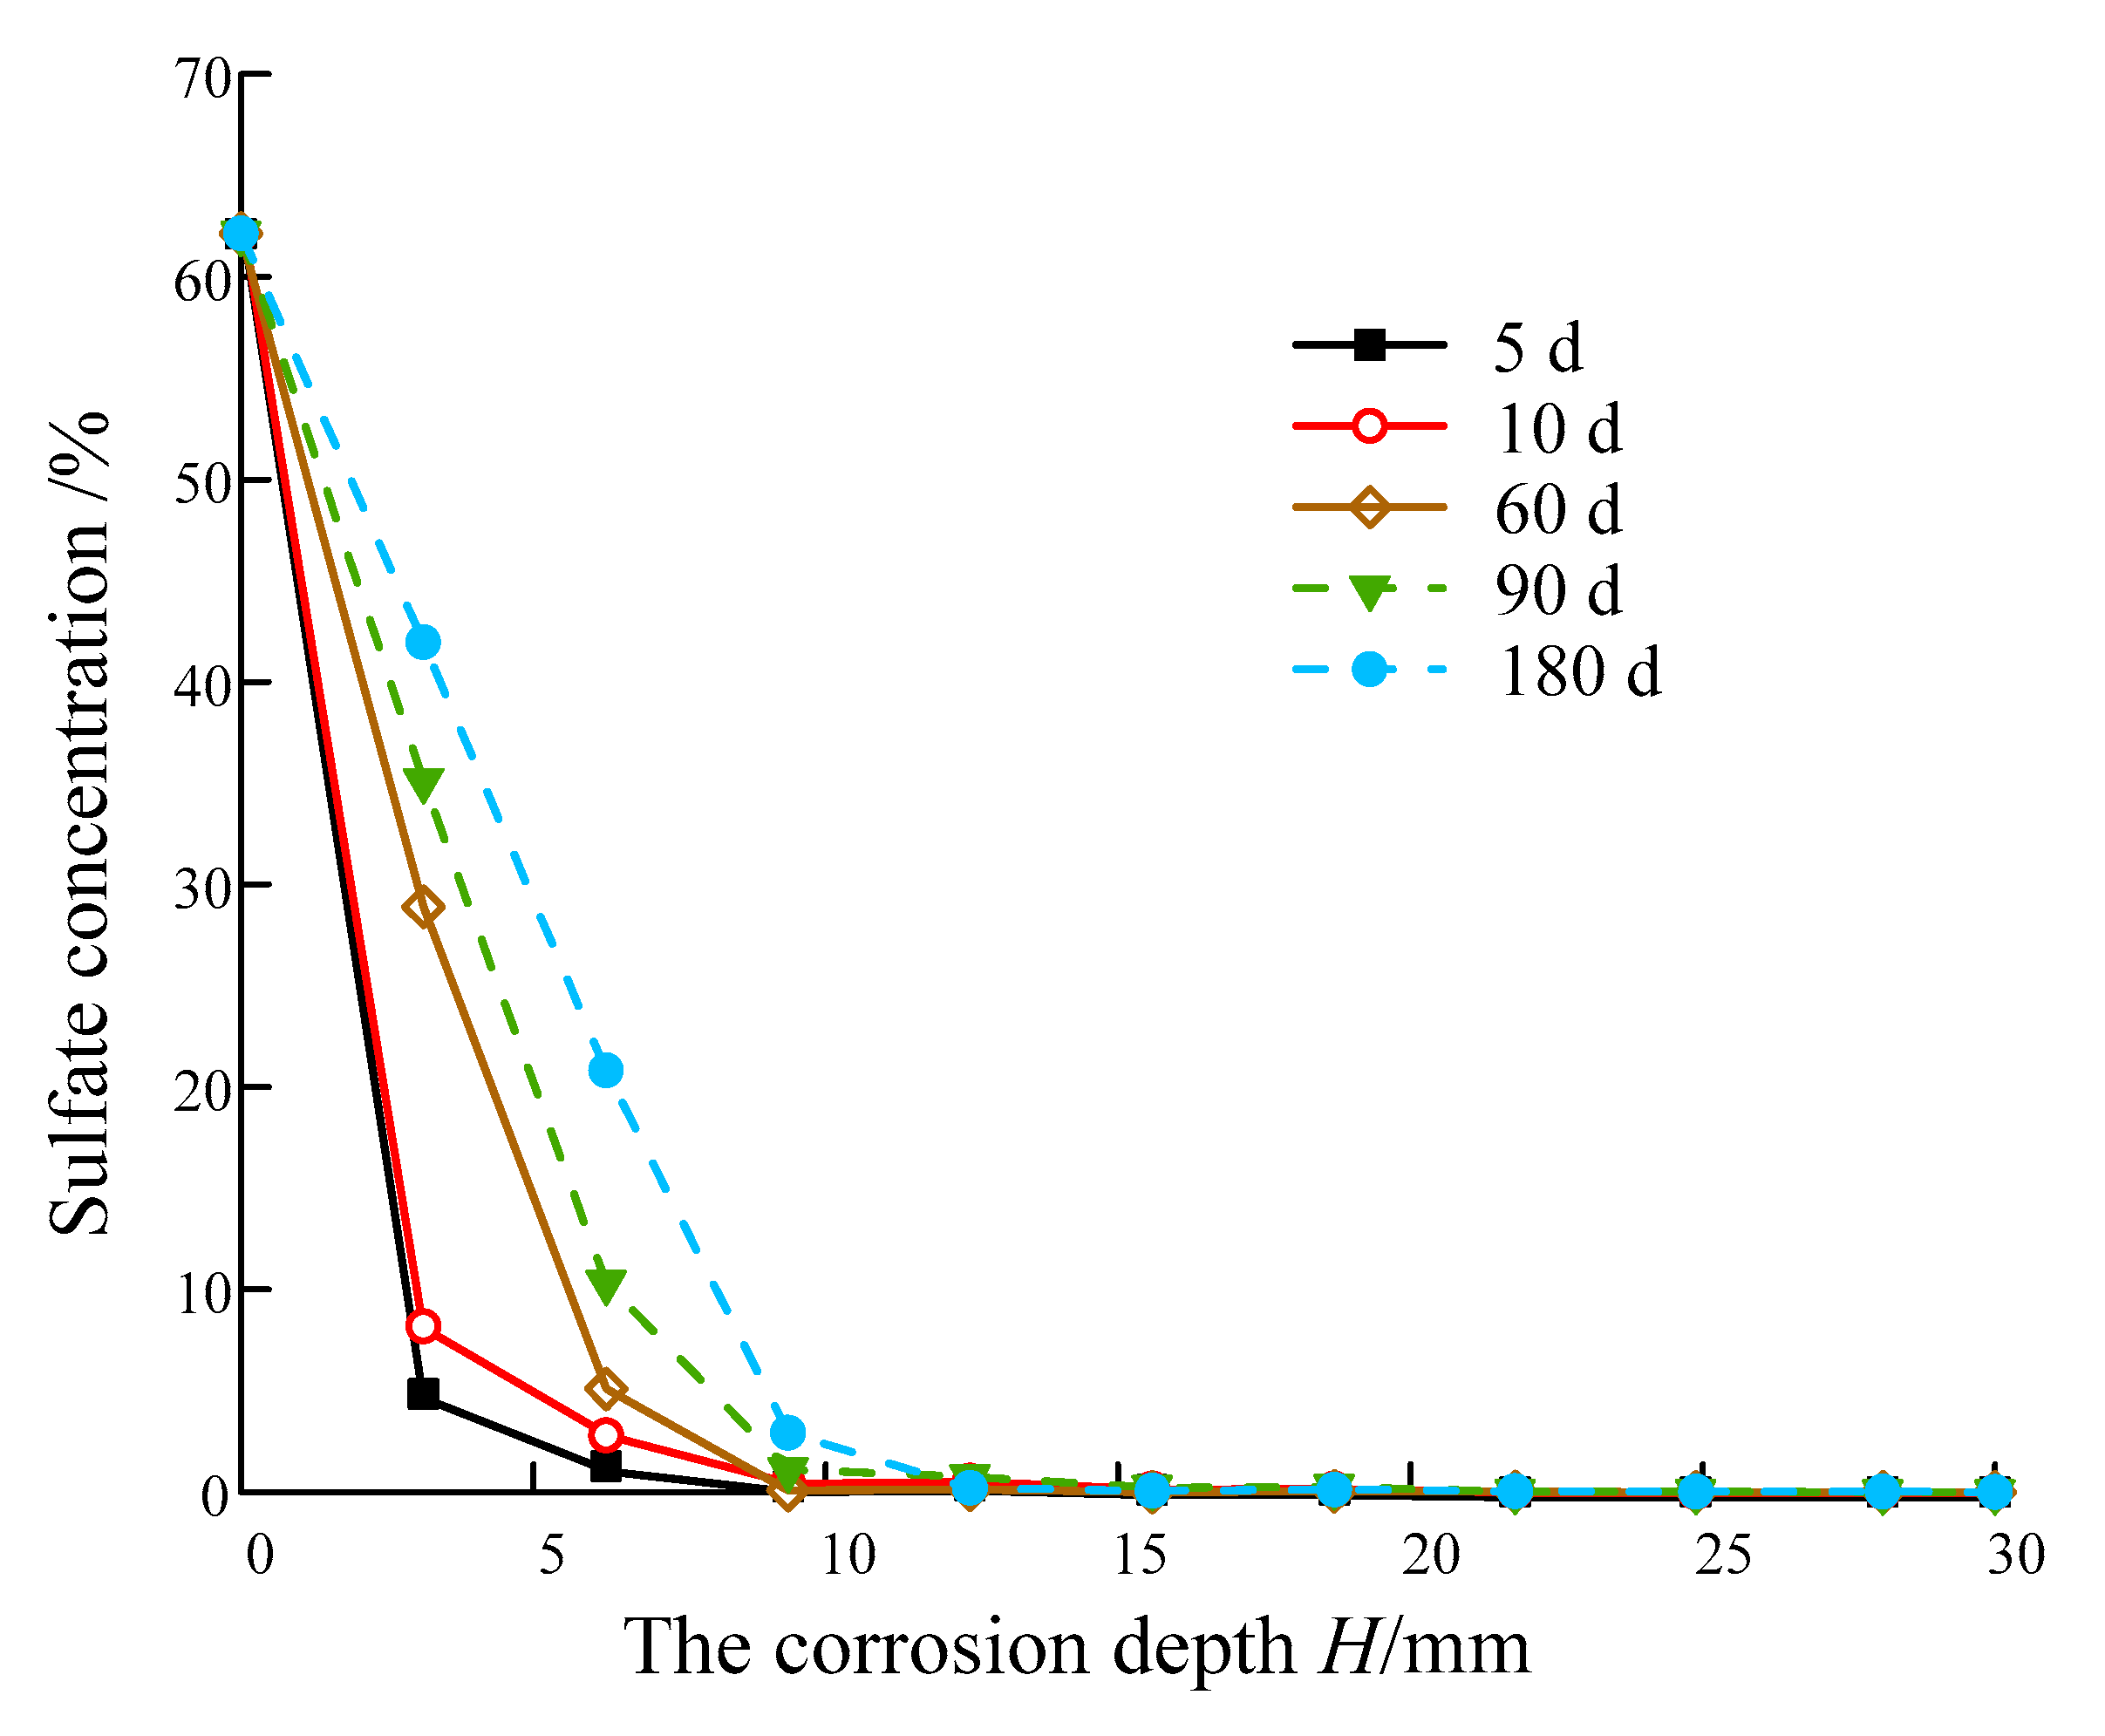
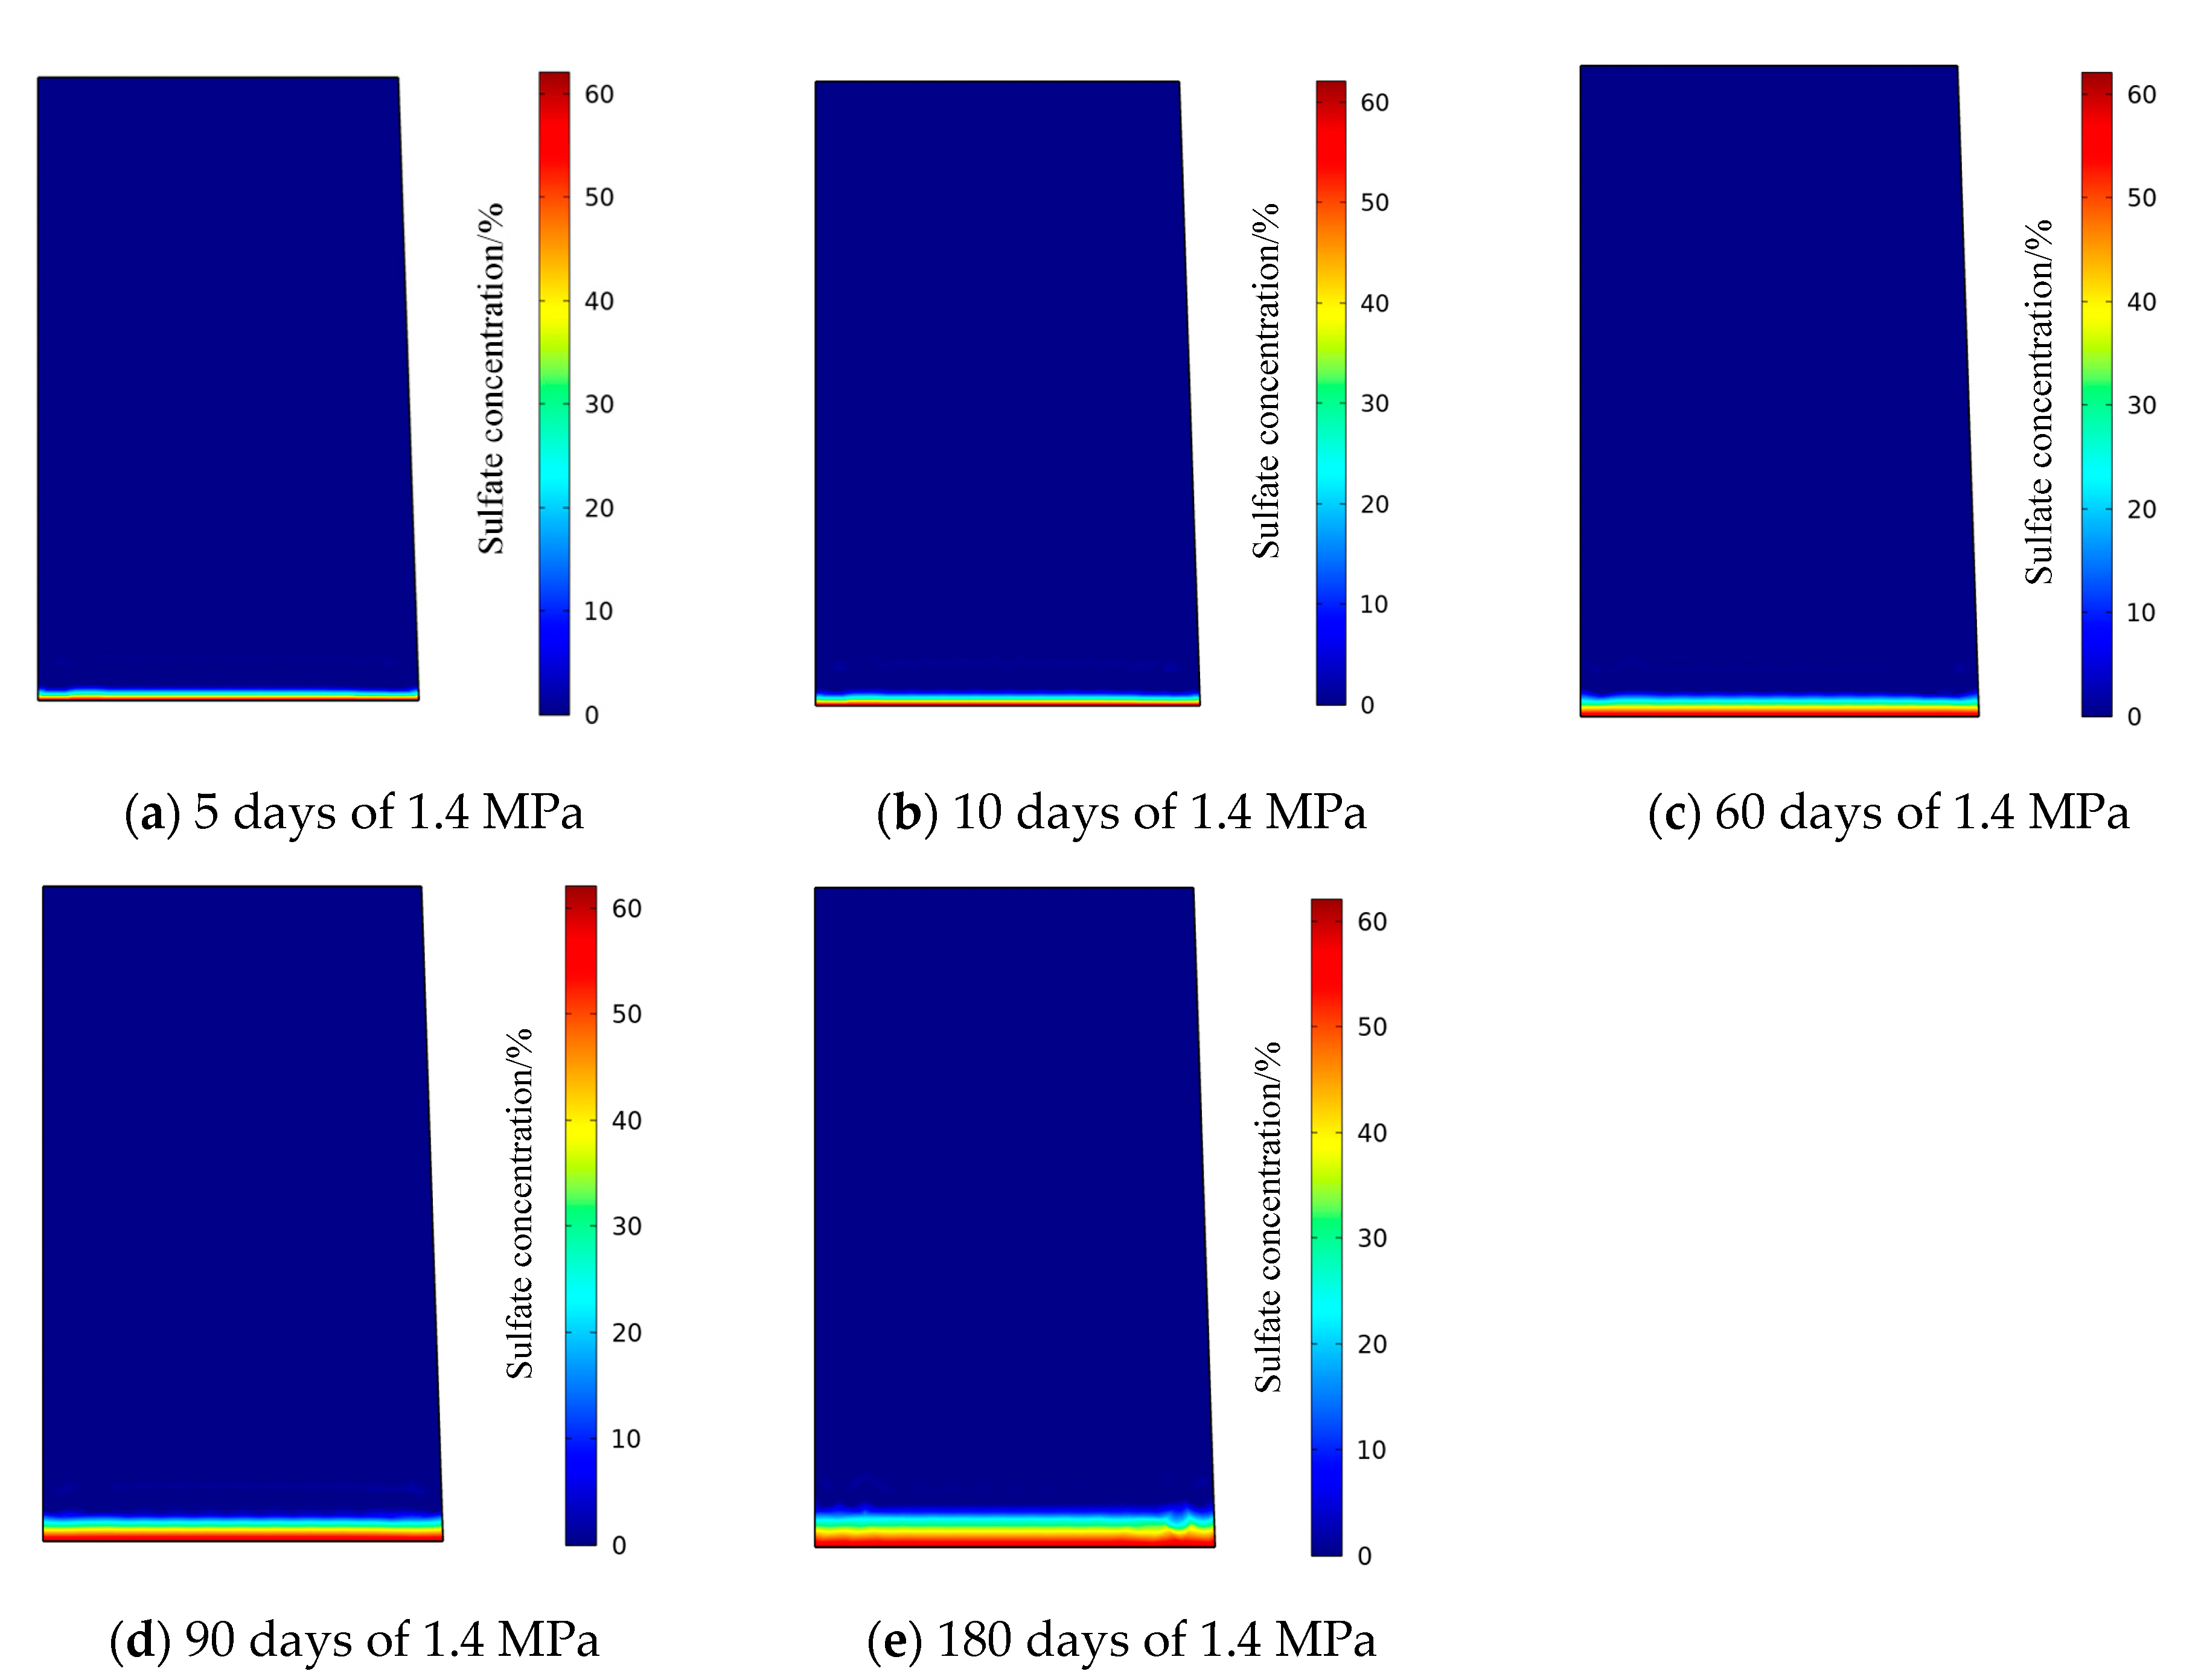
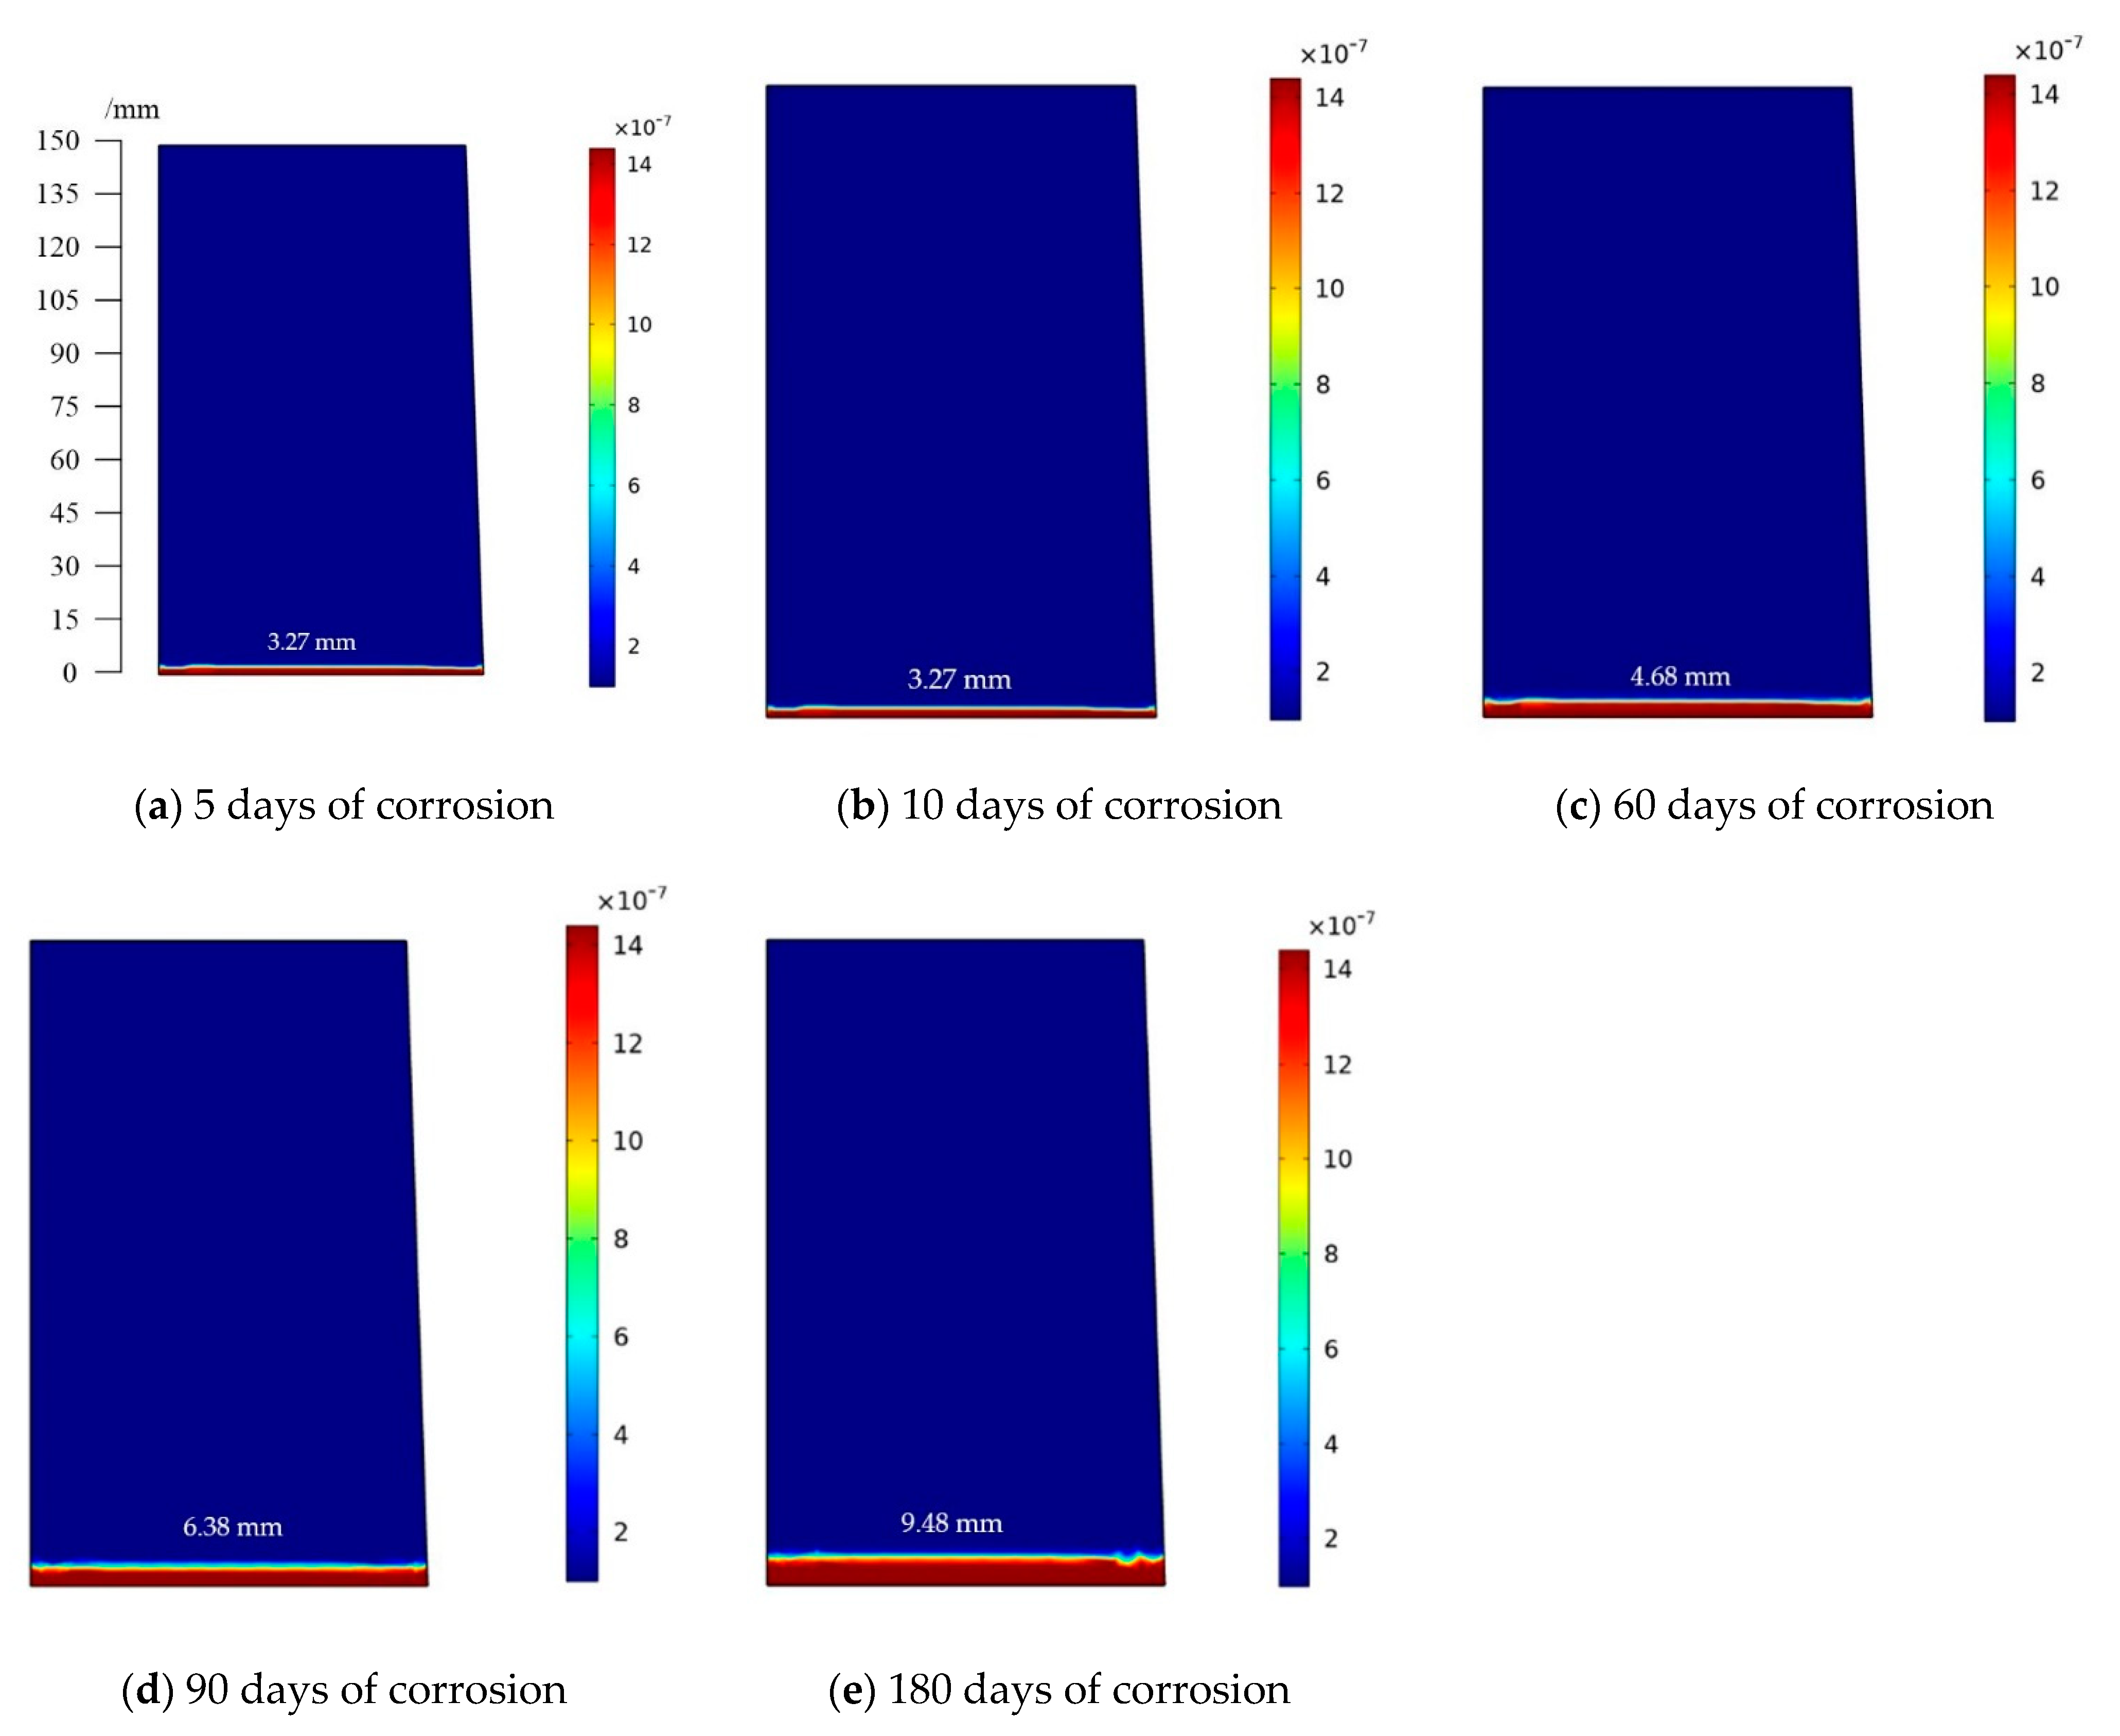
4.2. Numerical Simulation Results

COMSOL Multiphysics 5.5 (COMSOL company, Stockholm, Sweden) was used to simulate the coupling model of sulfate corrosion and high water head. This software can solve the partial differential equations of multiple physics fields simultaneously through the finite element algorithm. In the model established in Section 3, the elastoplastic damage model contains nine independent parameters: two elastic parameters (E and v), five plastic parameters (Rt, Rc, α max p , α min p and bp), two damage evolution parameters (dmc and bd). Through our previous research, these independent parameters were obtained through conventional mechanical tests [25,35,36]. The parameter values are shown in Table 3.
Under the HMC coupling effect, the damage variables, deformation and pore water pressure of concrete structures evolve continuously, and the evolution process is very important for the safety assessment of underground concrete structures. Compared with water head of 1.4 MPa groups, the first compares the corrosion depth reflected in the model with the test value, and then analyzes the evolution of the concrete damage variable during corrosion tests. Sulphate concentration distribution in concrete under 1.4 MPa water head is shown in Figure 18, and the corrosion depth as a function of sulfate exposure duration is shown in Figure 19.

5. Discussion

5.1. Micro-Indentation Test Discussion

The elastic modulus of concrete corroded in sulfate solution under high water head presents three stages: rapid decrease (5–10 d), rapid increase (60 d) and slow decrease (180 d). When the high water head is applied for 5–10 days, the end of the sample is affected by the high water head, which increases the pore pressure in the pores and microcracks of the concrete near the end. This phenomenon is prone to local stress concentration and local damage, resulting in the reduction of elastic modulus in the depth of 0–3 mm.
The main reason is that the osmotic pressure accelerates the ion migration in the coupling corrosion process, which mainly promotes the chemical corrosion. The higher the osmotic pressure, the faster the damage rate of concrete. With the continuous chemical reaction between sulfate and cementitious materials, hydration products are generated, including ettringite and other expansive hydration products, which play a role in compacting the internal structure of concrete temporarily. Then, with the aggravation of corrosion, the corrosion products increase and expand, which makes more cracks in the concrete.
According to the results of micro-indentation test at the same corrosion depth under different water head and corrosion exposure durations, the corrosion depth of samples increases gradually with the increase of corrosion duration. After 60 days of corrosion, the coupling corrosion depth has exceeded the range of 0–3 mm. Therefore, it is necessary to explore the deterioration degree of samples at different corrosion depths.
With Equations (48) and (49), the elastic modulus at different corrosion depth of concrete under the coupling effects of 0.7 and 1.4 MPa water head and sulfate attack can be easily calculated. The predicted value of elastic modulus can be put into the finite element model, which can provide reference for the analysis of concrete damage and deterioration in underground engineering and the calculation of bearing capacity of concrete structures in the actual engineering or test process.
It can be seen from Figure 17 that after 180 days of sulfate solution exposure corrosion under 0.7 MPa water head, E tends to 29.8 GPa at 8.36 mm corrosion depth, 29.8 GPa at 9.56 mm corrosion depth under 1.4 MPa water head. However, the average value of elastic modulus of non-corroded samples is 29.8 GPa, indicating that the corrosion depth of corroded sample under 0.7 MPa is 8.36 mm after 180 days of corrosion, and the corrosion depth of the corroded sample is 9.59 mm at 1.4 MPa.

5.2. Numerical Simulation Discussion

The sulfate concentration in concrete has a linear relationship with the damage degree of concrete. After corrosion of concrete, ettringite and other expansive hydration products are generated, which leads to more cracks in concrete. Therefore, the depth of concrete corrosion is determined by the concentration of sulfate in the concrete. It can be seen from Figure 19 that after 180 days of 1.4 MPa water head corrosion, the corrosion depth is 9 mm. The micro-indentation test result is 9.59 mm. The simulation results are in good agreement with the micro-indentation test results.
The distribution of sulfate concentration and the mechanical damage variables in the samples at 5, 10, 60, 90 and 180 days of corrosion at 1.4 MPa water head are shown in Figure 20 and Figure 21. With the increase of corrosion duration, the corrosion area gradually becomes larger. In the figures, it is obvious that the sulfate concentration is also larger in the area with larger mechanical damage variable, which indicates that the two kinds of corrosion affect each other and couple on the concrete material.

6. Conclusions

(1) In the process of water head–sulfate coupled corrosion, head accelerates ion migration, which mainly promotes the effect of sulfate corrosion. The higher the water head, the faster the damage rate of the concrete. With the continuous chemical reaction between sulfate and cementitious materials, hydration products are generated, including ettringite and other expansive hydration products, which temporarily compact internal concrete. However, as the corrosion intensifies, the corrosion products increase and expand, resulting in more cracks in the concrete, and the deterioration degree of corrosion is aggravated.
(2) Based on micro-indentation tests, it is found that the greater the water head, the deeper the corrosion depth. After 180 days of sulfate solution exposure, the depth of corrosion is 8.36 mm under 0.7 MPa water head and 9.59 mm under 1.4 MPa water head. These results are in good agreement with the numerical simulation results.
(3) In the corrosion process, the sulfate concentration is also large in the area with large mechanical damage variable, which indicates that the two kinds of damage are coupled and interact with each other.
(4) As the micro-indentation test method is not mature and complete, it is rarely used to measure the mechanical properties of rock. The micro-indentation test method was used to measure biological bone materials, but there are still many standards that need to be improved. Micro-mechanism research is a wide field. If we want to study the fundamental properties, merely relying on macro tests is insufficient, we still need to further explore the properties under micro and meso levels. It is not enough to only rely on macro tests.
In this paper, the chemical damage variable was determined according to the phenomenological method. We will consider the production of ettringite and the influence of expansion pressure on concrete in further research. Due to the limitation of the length of the article, the commonly used concrete with strength grade of C50 was studied in this article. Due to the limitation of equipment, only the microscopic compressive capacity of concrete was studied in this article. We will conduct more concrete tests of more strength grades and more mechanical strength analyses for further research.

Author Contributions

R.L.: data curation, writing, review and editing; H.H.: methodology; D.H.: methodology; Y.Z.: supervision and funding acquisition. All authors have read and agreed to the published version of the manuscript.

Funding

This research was funded by the Chinese national key research and development project, 2018YFC0809601; Jiangxi Province Natural Science Foundation, 20202BABL214052; Hubei Province Technological Innovation Special Large Project, 2017AAA128; National Natural Science Foundation of China, 51779252.

Conflicts of Interest

The authors declare no conflict of interest.

References

  1. Idiart, A.; Laviña, M.; Cochepin, B.; Pateau, A. Hydro-chemo-mechanical modelling of long-term evolution of bentonite swelling. Appl. Clay Sci. 2020, 195, 105717. [Google Scholar] [CrossRef]
  2. Yue, Z.W.; Li, P.J.; Yang, B. The calculation of chloride ion transport in concrete under convection condition is considered. J. Tongji Univ. 2015, 43, 60–66. [Google Scholar]
  3. Tan, B.H. Study on Chloride Ion Transport Mechanism of Submarine Tunnel Concrete under Multi-Salt and Multi-Field Coupling; East China Institute of Technology: Fuzhou, China, 2018. [Google Scholar]
  4. Liu, Y. Experimental Study on the Performance of Tunnel Lining Concrete Under the Action of “Seepage and Stress Field” and Double Factors; Jiangsu University of Science and Technology: Zhenjiang, China, 2018. [Google Scholar]
  5. Liu, R.X. Study on Damage and Fracture Mechanism of Concrete under Sulfate Erosion and High Strain Rate Loading; China University of Mining and Technology: Xuzhou, China, 2019. [Google Scholar]
  6. Zhao, E.F.; Wu, C.Q.; Wang, S.W.; Hu, J.; Wang, W.Q. Seepage dissolution effect prediction on aging deformation of concrete dams by coupled chemo-mechanical model. Constr. Build. Mater. 2020, 237, 117603. [Google Scholar] [CrossRef]
  7. Jia, S.P.; Chen, W.Z.; Yu, H.D.; Li, X.L. Research on seepage-stress coupling damage model of Boom clay during tunneling. Rock Soil Mech. 2009, 30, 19–26. [Google Scholar]
  8. Khanzaei, P.; Samali, B.; Zhang, C. Coupled and uncoupled seepage-stress analysis of roller compacted concrete dams. ISH J. Hydraul. Eng. 2017, 23, 92–101. [Google Scholar] [CrossRef]
  9. Gu, W.; Yao, Z. Evaluation of surface cracking in micron and sub-micron scale scratch tests for optical glass BK7. J. Mech. Sci. Technol. 2011, 25, 1167–1174. [Google Scholar] [CrossRef]
  10. Karine, V.; Sandrine, M.; Denis, D.; Gilbert, F.; Fransois, S. Determination by nano-indentation of elastic modulus and hardness of pure constituents of Portland cement clinker. Cem. Concr. Res. 2001, 31, 555–561. [Google Scholar]
  11. Constantinides, G.; Ulm, F.J.; Van Vliet, K. On the use of nanoindentation for cementitious materials. Mater. Struct. 2003, 36, 191–196. [Google Scholar] [CrossRef]
  12. Ramachandra, A.; Iyer, N.R.; Prasad, B.K.R. Characterization and Evaluation of Micro-mechanical Properties of Ultra High Strength Concrete by using Micro-indentation Test. J. Inst. Eng. 2016, 97, 1–8. [Google Scholar]
  13. GB 175-2007. Common Portland Cement; AQSIQ, SAC: Beijing, China, 2007. [Google Scholar]
  14. GB/T 1596-2005. Fly Ash Used for Cement and Concrete; General Administration of Quality Supervision, Inspection and Quarantine of the People’s Republic of China: Beijing, China, 2005. [Google Scholar]
  15. GB/T 18046-2008. Ground Blast Furnace Slag Powder for Cement and Concrete; General Administration of Quality Supervision, Inspection and Quarantine of the People’s Republic of China: Beijing, China, 2008. [Google Scholar]
  16. GB/T 14685-2011. Pebble and Crushed Stone for Construction; General Administration of Quality Supervision, Inspection and Quarantine of the People’s Republic of China: Beijing, China, 2011. [Google Scholar]
  17. GB/T 50082-2009. Standard for Test Methods of Long-Term Performance and Durability of Ordinary Concrete; Ministry of Housing and Urban-Rural Development: Beijing, China, 2009. [Google Scholar]
  18. ISO 14577-1-2015. Metallic Materials—Instrumental Indentation Test for Hardness and Material Parameters; ISO: Geneva, Switzerland, 2015. [Google Scholar]
  19. Oliver, W.C.; Pharr, G.M. An improved technique for determining hardness and elastic modulus using load and displacement sensing indentation experiments. J. Mater. Res. 1992, 7, 1564–1583. [Google Scholar] [CrossRef]
  20. Hu, D.; Zhou, H.; Zhang, F.; Shao, J. Modeling of Short- and Long-Term Chemomechanical Coupling Behavior of Cement-Based Materials. J. Eng. Mech. 2014, 140, 206–218. [Google Scholar] [CrossRef]
  21. Oztekin, E.; Pul, S.; Husem, M. Experimental determination of Drucker-Prager yield criterion parameters for normal and high strength concretes under triaxial compression. Constr. Build. Material. 2016, 112, 725–732. [Google Scholar] [CrossRef]
  22. Moreno-Juez, J.; Tavares, L.M.; Artoni, R.; Carvalho, R.M.d.; da Cunha, E.R.; Cazacliu, B. Simulation of the Attrition of Recycled Concrete Aggregates during Concrete Mixing. Materials 2021, 14, 3007. [Google Scholar] [CrossRef]
  23. Sucharda, O.; Mateckova, P.; Bilek, V. Non-linear analysis of an RC beam without shear reinforcement with a sensitivity study of the material properties of concrete. Slovak J. Civil Eng. 2020, 28, 33–43. [Google Scholar] [CrossRef]
  24. Kupfer, H.B.; Gerstle, K.H. Behavior of Concrete under Biaxial Stresses. J. Eng. Mech. 1973, 99, 853–866. [Google Scholar]
  25. Hu, D.; Zhu, Q.; Zhou, H.; Shao, J. A discrete approach for anisotropic plasticity and damage in semi-brittle rocks. Comput. Geotech. 2010, 37, 658–666. [Google Scholar] [CrossRef]
  26. Budiansky, B.; O’Connell, R.J. Elastic moduli of a cracked solid. Int. J. Solids Struct. 1976, 12, 81–97. [Google Scholar] [CrossRef]
  27. Tixier, R.; Mobasher, B. Modeling of Damage in Cement-Based Materials Subjected to External Sulfate Attack. II: Comparison with Experiments. J. Mater. Civil Eng. 2003, 15, 314–322. [Google Scholar] [CrossRef]
  28. Ikumi, T.; Cavalaro, S.H.P.; Segura, I.; Aguado, A. Alternative methodology to consider damage and expansions in external sulfate attack modeling. Cement Concr. Res. 2014, 63, 105–116. [Google Scholar] [CrossRef] [Green Version]
  29. Sun, C.; Chen, J.; Zhu, J.; Zhang, M.; Ye, J. A new diffusion model of sulfate ions in concrete. Constr. Build. Mater. 2013, 39, 39–45. [Google Scholar] [CrossRef]
  30. Bentz, D.P.; Clifton, J.R.; Ferraris, C.F.; Garboczi, E.J. Transport Properties and Durability of Concrete: Literature Review and Research Plan; National Institute of Standards and Technology: Gaithersburg, MD, USA, 1999. [Google Scholar]
  31. Yu, C.; Sun, W.; Scrivener, K. Mechanism of expansion of mortars immersed in sodium sulfate solutions. Cem. Concr. Res. 2013, 43, 105–111. [Google Scholar] [CrossRef]
  32. Atkinson, A.; Haxby, A.; Hearne, J.A. The Chemistry and Expansion of Limestone-Portland Cement Mortars Exposed to Sulphate Containing Solutions; United Kingdom Nirex: Oxfordshire, UK, 1988. [Google Scholar]
  33. Abed, A.A.; Sołowski, W.T. A study on how to couple thermo-hydro-mechanical behaviour of unsaturated soils: Physical equations, numerical implementation and examples. Comput. Geotech. 2017, 92, 132–155. [Google Scholar] [CrossRef]
  34. Coussy, O. Poromechanics; John Wiley & Sons: Hoboken, NJ, USA, 2004. [Google Scholar]
  35. Hou, H.; Hu, D.; Zhou, H.; Lu, J.; Zhang, F. A chemo-mechanical coupling model for concrete lining subjected to external sulfate attack. Eur. J. Environ. Civ. Eng. 2019, 1–18. [Google Scholar] [CrossRef]
  36. Hou, H.; Hu, D.; Zhou, H.; Lu, J.J.; Lv, T.; Zhang, F. A temperature-seepage-stress coupling numerical simulation method for geological disposal of high-level radioactive waste considering excavation damage. Rock Soil Mech. 2020, 41, 1056–1064. [Google Scholar]
Figure 1. The concrete sulfate attacked instrument.
Energies 14 05039 g001
Figure 2. Schematic diagram of concrete sulfate attacked instrument.
Energies 14 05039 g002
Figure 3. Specimens for micro-indentation tests.
Energies 14 05039 g003
Figure 4. 3D non-contact surface topography NANOVEA instrument.
Energies 14 05039 g004
Figure 5. Typical indentation cross section.
Energies 14 05039 g005
Figure 6. Typical loading and unloading curve of micro-indentation test.
Energies 14 05039 g006
Figure 7. Distribution of elastic modulus of concrete without corrosion.
Energies 14 05039 g007
Figure 8. Distribution of elastic modulus of concrete under 0.7–5 d.
Energies 14 05039 g008
Figure 9. Distribution of elastic modulus of concrete under 0.7–10 d.
Energies 14 05039 g009
Figure 10. Distribution of elastic modulus of concrete under 0.7–60 d.
Energies 14 05039 g010
Figure 11. Distribution of elastic modulus of concrete under 0.7–180 d.
Energies 14 05039 g011
Figure 12. Distribution of elastic modulus of concrete under 1.4–5 d.
Energies 14 05039 g012
Figure 13. Distribution of elastic modulus of concrete under 1.4–10 d.
Energies 14 05039 g013
Figure 14. Distribution of elastic modulus of concrete under 1.4–60 d.
Energies 14 05039 g014
Figure 15. Distribution of elastic modulus of concrete under 1.4–180 d.
Energies 14 05039 g015
Figure 16. Trend of elastic modulus of concrete with different water head and different corrosion days.
Energies 14 05039 g016
Figure 17. Fitting curves.
Energies 14 05039 g017
Figure 18. Sulphate concentration distribution in concrete under 1.4 MPa water head.
Energies 14 05039 g018
Figure 19. The corrosion depth as a function of sulfate exposure duration (days).
Energies 14 05039 g019
Figure 20. Sulfate concentration distribution after water head corrosion.
Energies 14 05039 g020
Figure 21. Mechanical damage variables of corrosion.
Energies 14 05039 g021
Table 1. Concrete parameters of test samples.
Concrete ParametersValueMass Fraction (%)
Strength gradeC50
Gel material420 kg/m3
Water–binder ratio0.35
Cement189 kg/m315.7%
Fly ash105 kg/m38.7%
Slag powder126 kg/m310.5%
Sand775 kg/m364.6%
Water-reducing agent4.2 kg/m30.5%
Density2395 kg/m3
Table 2. Quantity of corrosion test sample.
Water Head p/MPa00.71.4
Corrosion Time t/d
0100
5222
10222
60222
180222
Table 3. Various parameters used in the coupling model.
ParametersValueParametersValue
E (GPa)50.55 α min p 0.15
v0.22bp2.5 × 10−4
Rt (MPa)5.05dmc0.9
Rc (MPa)60.77bd1150
α max p 2.3
Publisher’s Note: MDPI stays neutral with regard to jurisdictional claims in published maps and institutional affiliations.

